Article

Sustainable Use of Citrus Waste as Organic Amendment in Orange Orchards

1
Dipartimento di Agricoltura, Alimentazione e Ambiente (Di3A), Università degli Studi di Catania, 95129 Catania, Italy
2
Department of Environmental Biology, Sapienza University of Rome, 00161 Rome, Italy
*
Author to whom correspondence should be addressed.
Sustainability 2023, 15(3), 2482; https://doi.org/10.3390/su15032482
Submission received: 23 November 2022 / Revised: 25 January 2023 / Accepted: 26 January 2023 / Published: 30 January 2023

Abstract

:
The use of citrus waste (peel, CW) as organic fertilizer was investigated on soil microbiota and on soil physico-chemical and hydraulic characteristics. The biotic components on CW and the effect on nutritional status, leaf chlorophyll content, fruit set and production of “Tarocco” orange trees were also identified. The citrus waste was supplied to an experimental orchard at different doses: 45 kg m−2 (with and without Ca(OH)2 addition) and 90 kg m−2. The study was conducted in three consecutive years (2015–2017) on 20-year old orange trees at the experimental farm of the University of Catania (Italy). The main results of the study confirm that the use of CW as a biofertilizer offers a great opportunity for sustainable sweet orange production.

1. Introduction

In Europe, food losses generated by the primary production and processing amount to about 25 million tons, while food wastes accounted for nearly 61 million tons [1]. When harvesting and processing of raw materials, from a semantic point of view, we are still refer to food loss; nevertheless, the scientific literature generally considers the discarded parts as “wastes” and “by-products”. According to the Waste Framework Directive [2], “waste” means any substance that the holder discards, while “by-product” is a substance resulting from a production process where the primary aim is not the production of that substance.
Organic waste from the fruit industry demands rational utilization to prevent resource loss from the disposal of the discarded peel. Agricultural and forestry wastes, such as orange peels and banana peels, have been successfully used for the treatment of wastewater containing heavy metals showing many advantages, including comprehensive sources and low cost.
Food waste and food co-products’ waste create huge environmental, economic and social problems [3]; specifically, 1.3 billion tons of food are lost or wasted annually [4]. With global climate change challenges and their effects on ecosystems, as well as resource depletion, the issue of food waste and its diversion from landfill has captured the attention of governments, environmental and social organizations, businesses and academics, becoming an increasingly urgent priority [4]. There is a growing recognition that these two problems (waste disposal and resource depletion) can be solved together through the utilization of waste as a resource, using green and sustainable technologies.
Citrus is one of the main fruit crops in the world, with an estimated production of more than 170 million tons, with 58% corresponding to oranges [4]. Italy is one of the main citrus-producing countries in the Mediterranean basin, after Spain, and together they reach 80% of the European production [5], with an area of about 170,000 ha and an average production of 3 million tons over the last five years. In Sicily (the southern Italian island), the area of citrus orchards is equal to about 71,000 ha [6], mainly consisting of orange groves (about 51,000 ha). An average of 34% of citrus fruits are processed into juices leaving around half of their weight as waste (mainly peel, seeds and pulp); annually [7] reaching 24.3 million tons per year [8]. The orange peels are the prime solid by-product of the citrus pulping industry [9]. Citrus waste (CW) is composed of 60–65% w/w of peels, 30–35% w/w of internal tissues, and the remaining is seeds [10]. In Italy, CW is the main by-product of the citrus (mainly sweet orange or Citrus sinensis) processing industry; it amounts to about 500,000 t per year [11]. Citrus waste shows low pH values (3–4), high organic matter (more than 90% of total solids) and high humidity (about 80–90%) [12]. Such waste, without any treatment, can contribute to environmental problems because of its fermentation, which results in a high chemical and biological demand of oxygen [8]. Because of its high water content (about 86%), it is difficult to dry, and its high organic matter content does not facilitate its disposal in appropriate sites, leading to additional transportation costs [13,14]. Traditionally, CW has been reused with various methods and techniques, for different purposes, generally low-value uses (e.g., according to the LD 152/06, it is categorized as waste instead of by-product). Conventionally, the disposal mechanisms adopted for CW are either to utilize it as a base for cattle feed or to burn it [15,16]. The European Parliament has recently launched a new regulation, known as Regulation (EU) 2019/1009, to control the use of fertilizers and harmonize the market for the production of these compounds for all European member states. In general, a fertilizing product is “a substance, mixture, microorganism or any other material, applied or intended to be applied on plants or their rhizosphere or on mushrooms or their mycosphere, or intended to constitute the rhizosphere or mycosphere, either on its own or mixed with another material, for the purpose of providing the plants or mushrooms with nutrient or improving their nutrition efficiency” [17]. Therefore, biofertilizers are defined as the substances containing a variety of microbes having the capacity to enhance plant nutrient uptake by colonizing the rhizosphere and making the nutrients easily accessible to plant root hairs. They are well known for their cost effectiveness, environmentally friendly nature and composition, representing effective alternatives to chemical fertilizers.
The valorization of CW has a great potential of mitigating the negative environmental effect of its uncontrolled discharge. The possibility of using CW as a natural soil amendment depends on the performance of the traditional composting process, which, at present, is unable to compensate for the production costs.
The main objective of this study was to promote the valorization of citrus waste as a soil biofertilizer. For this purpose, the effects of the use of citrus waste were evaluated on the physico-chemical, microbiological and hydraulic soil characteristics and on the physiological and productive/qualitative characteristics of orange trees under Mediterranean climate conditions.

2. Materials and Methods

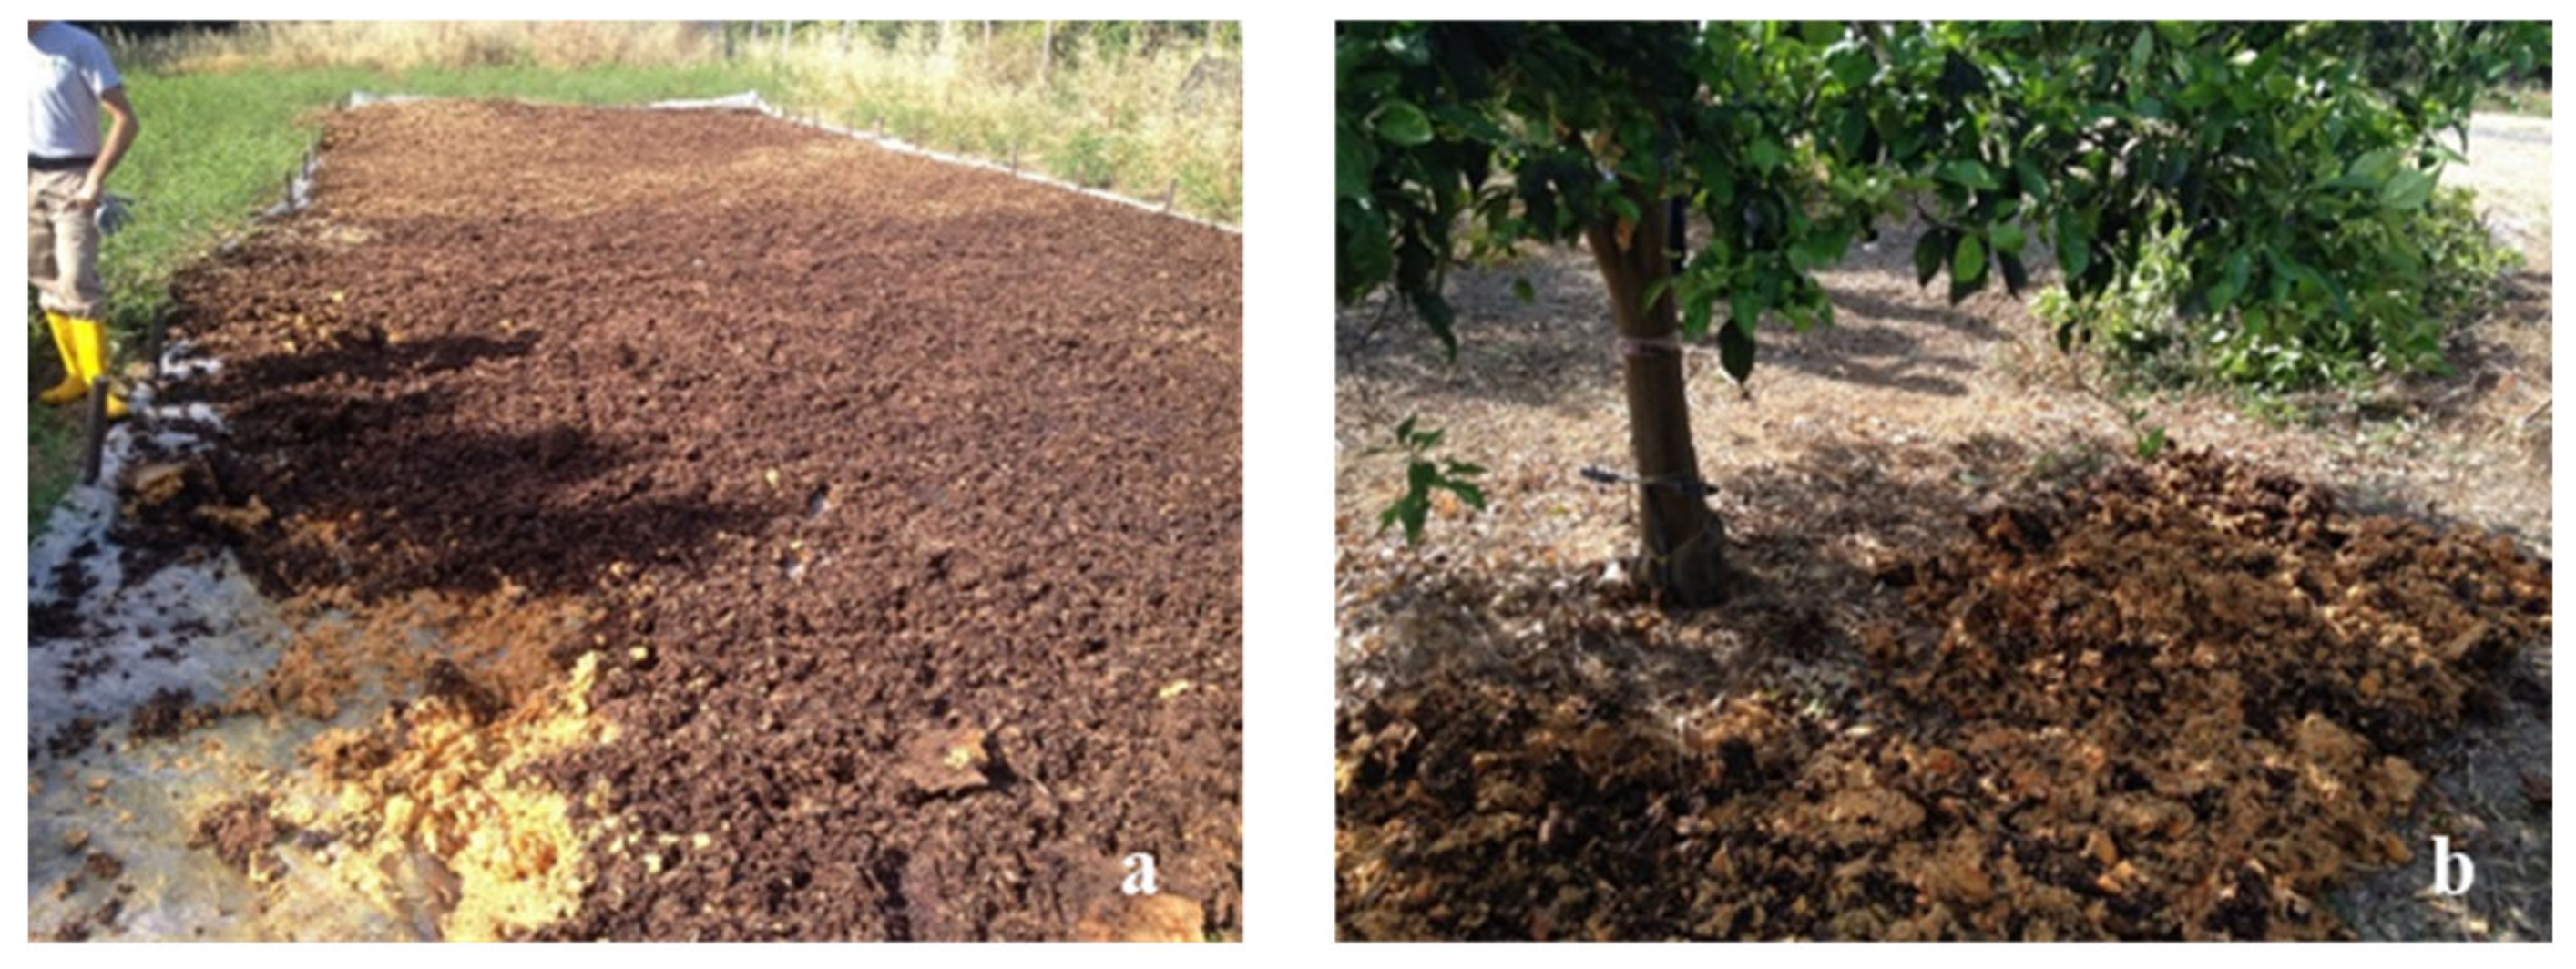
2.1. Experimental Site

The study was conducted during a three-year period (2015–2017) at the experimental farm of the University of Catania (Italy) (37°41′ N; 15°05′ E). The selected citrus orchard covers about 400 m2 and includes 20 trees of cv ‘Tarocco comune’ orange, 20 years old, planted at a 5 × 4 m distance. The mean soil water content at field capacity (pF = 2.5) and wilting point (pF = 4.2) was 38% and 23%, respectively. The soil bulk density was about 1.23 g cm−3.
Citrus waste was obtained from centrifuged orange juice from a citrus-processing plant located in Messina (south Italy). In April 2015, about 30 tons of CW were transported to the experimental site and laid down for about 1 month on a polyethylene tarp (Figure 1a) to reduce the humidity content (Figure 1a,b), and in May, the dried CW was added to the soil of the experimental orchard. Clods of CW were obtained and properly laid down around the tree trunks (about 0.5 m from trunk) (Figure 1b). Two months after the amendment phase (July 2015), the first 10 cm of CW were milled and mixed with the soil.
The use of citrus waste included the following treatments (Ti):
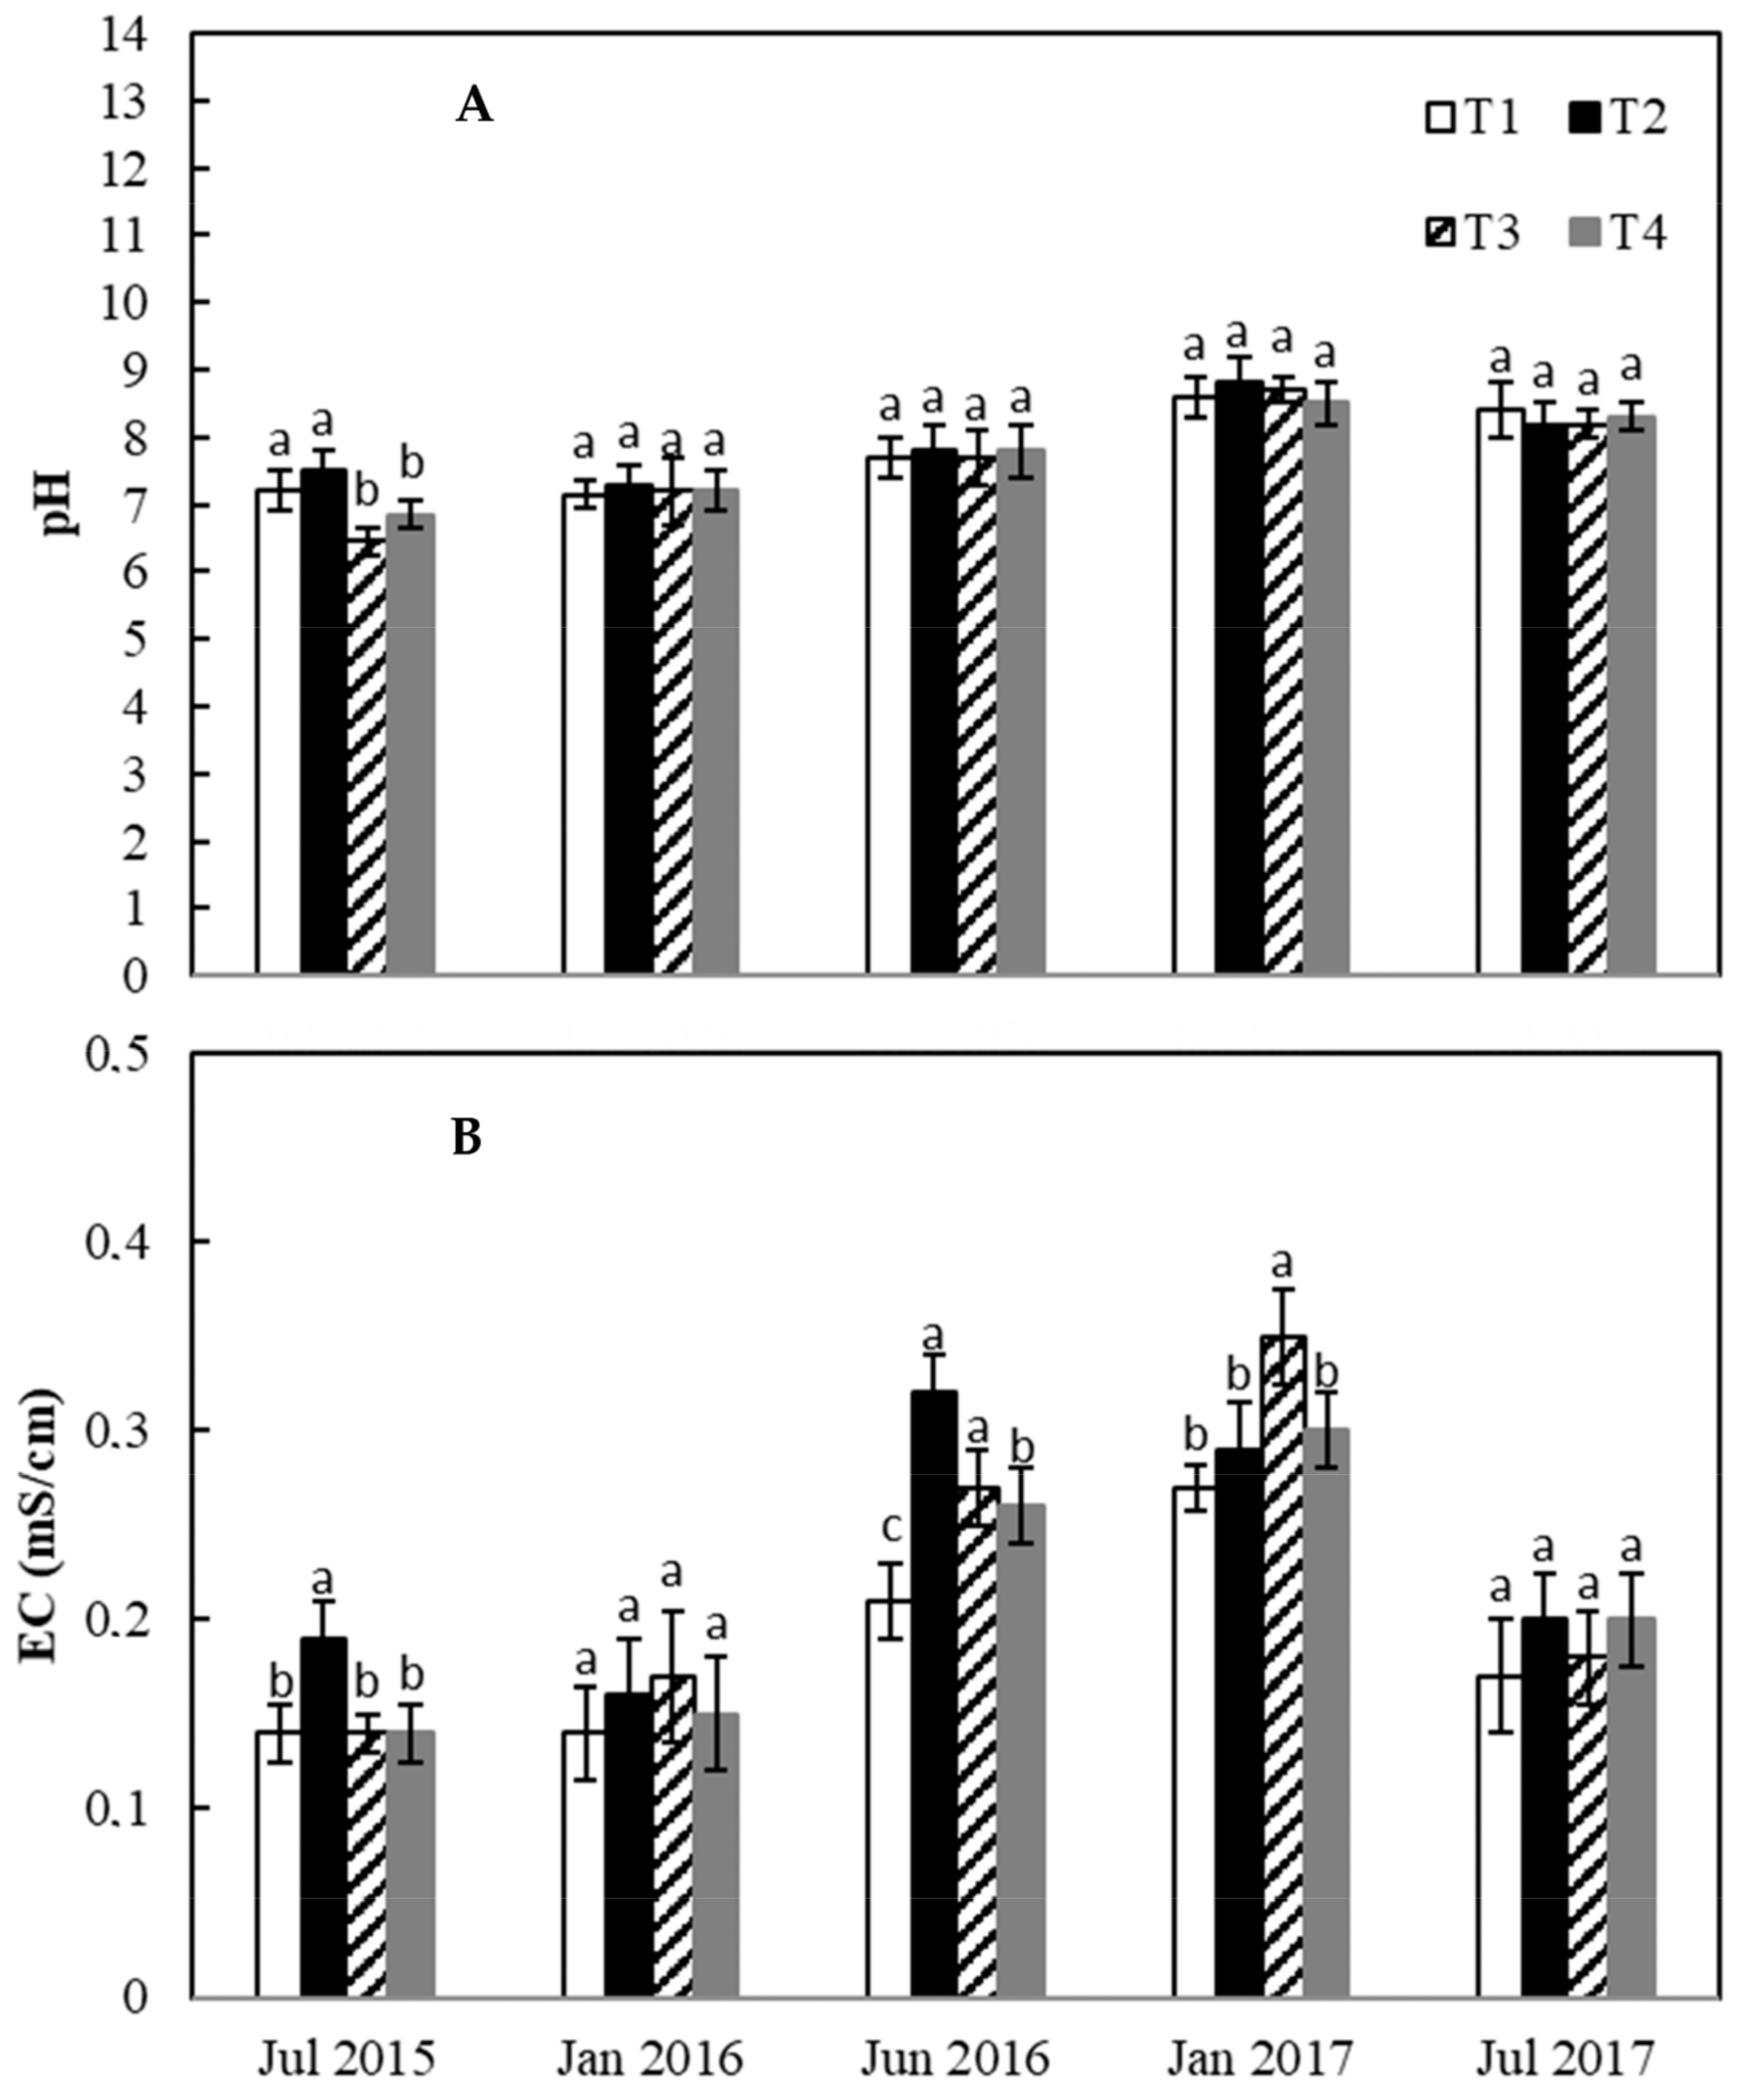
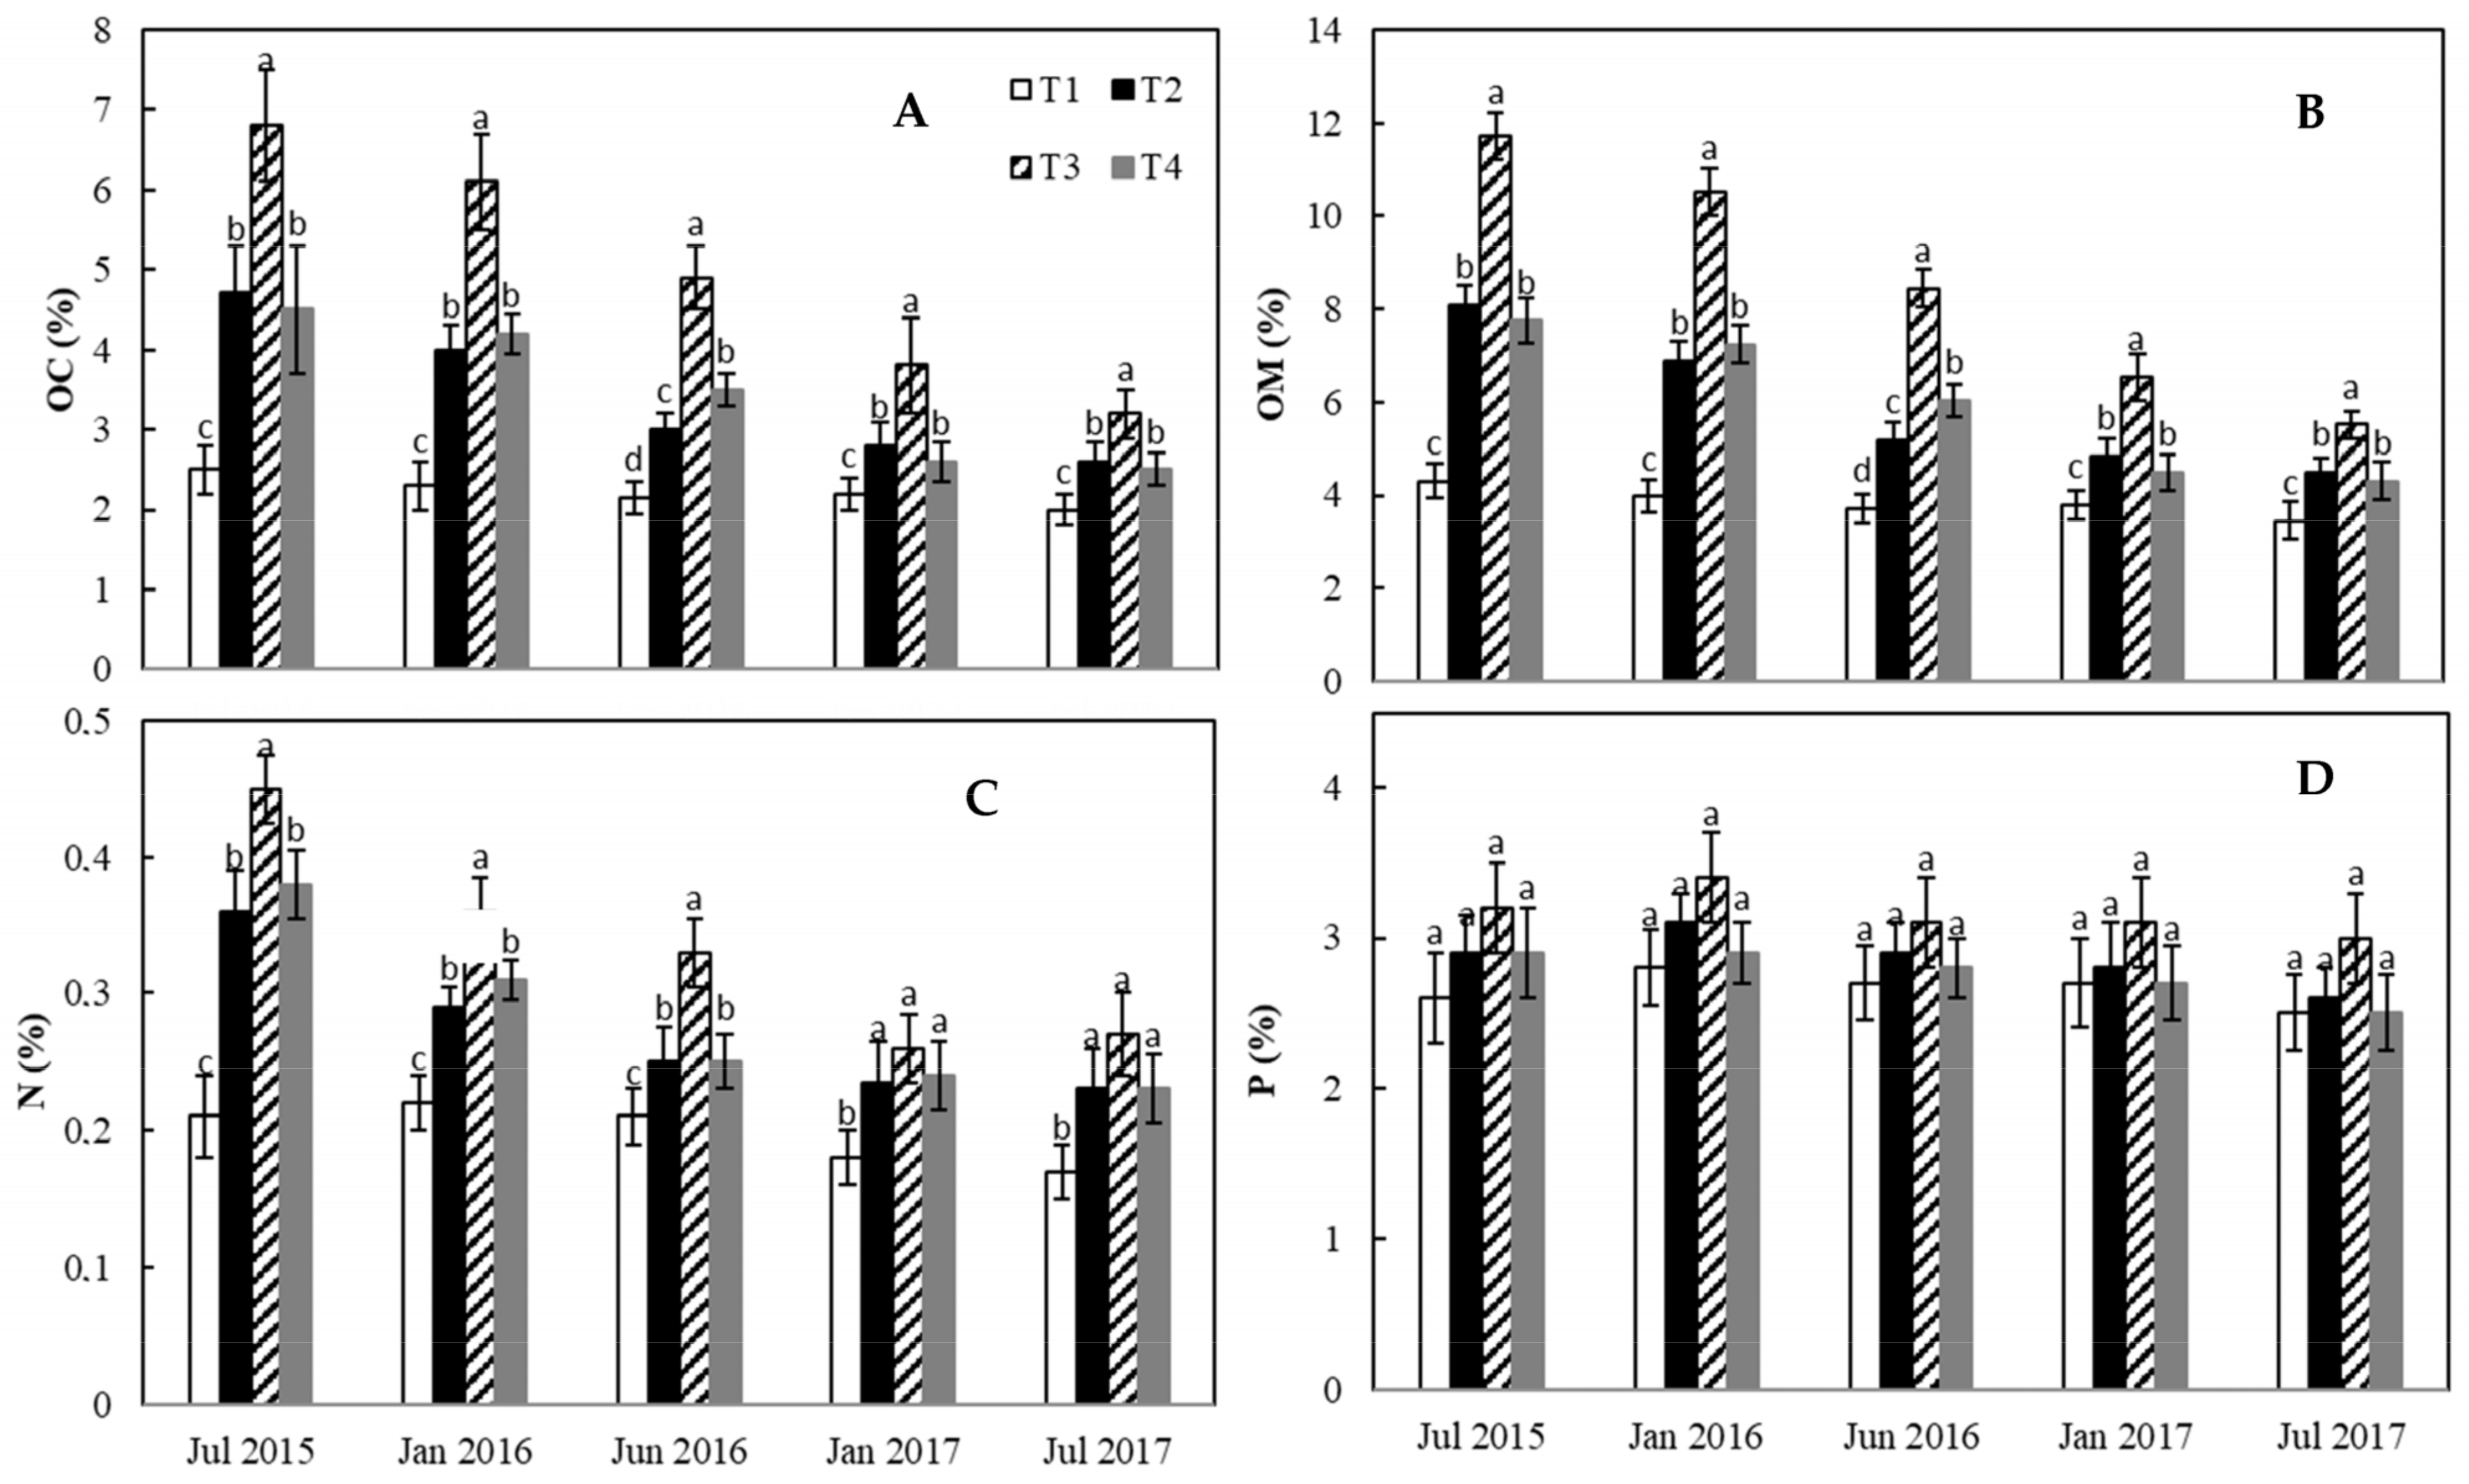
  • T1: Control. Only mineral fertilizer was added to the soil, with the same methods as for Treatment 4 (consisting of 1.27% of N, 0.3% of P2O5, 1.2% of K2O in the CW) (i.e., ammonium nitrate = 2.5 kg/plant; ammonium phosphate = 0.5 kg/plant; potassium nitrate = 2.5 kg/plant). The fertilizer was divided into two doses, supplied during the 2nd and the 3rd year of the experimental period (April 2016 and April 2017);
  • T2: a dose of 45 kg/m2 of CW was distributed (about 17.5 kg/m2 of dry matter, which corresponds to about 0.22 kg/m2 of N over a three-year period); the dose was applied in a single phase, at the beginning of the experimental campaign (May 2015) by adding 177 g/kg of Ca(OH)2 to raise the pH value of CW to around 6.5;
  • T3: a dose of 90 kg/m2 of CW was distributed (i.e., about 35.0 kg/m2 of dry matter, which corresponds to about 0.44 kg/m2 of N in a three-year period); this dose was applied in a single phase in May 2015;
  • T4: a dose of 45 kg/m2 of CW was distributed (about 17.5 kg/m2 of dry matter, which corresponds to about 0.22 kg/m2 of N in a three-year period); this dose was applied in a single phase (May 2015); the dose of 45 kg/m2 corresponds to double the maximum quantity permitted for sludge of agri-food origin by the Legislative Decree 234/2011.
The different treatments were irrigated three times a week, during June–September of the three-year period. Soil samples were collected before (January 2015) and after soil treatment with CW (July 2015, January and June 2016, January and July 2017).

2.2. Physico-Chemical and Hydraulic Characterizations of CW

The citrus waste samples were subjected to the following determinations: pH, electrical conductivity (EC, mS/cm), humidity (%), ash contents (%), Carbon (C, %), total Nitrogen (N, %) (Table 1. The pH values were measured in a water 1:2.5 sample/solution ratio, using a pH-meter and EC was determined using a conductivity meter (delta OHM, Italy). Humidity (expressed as %) was obtained in 10 g of CW (5 replicates) by subtracting the dryness from the fresh weight (obtained after an oven-drying phase at 105 °C for 24 h). Ash content was determined by incineration at 650 °C for 4 h. Carbon and Nitrogen contents were obtained by an elemental analyzer (LECO Analyzer mod. 600, LECO Corp, St. Joseph, MI, USA) and expressed as percentage of dry matter. Analyses were performed in April 2015, when CW was transported to the experimental site, and in May 2015, just before the addition of CW to the agricultural soil.
For each soil sample, the volumetric water content of the amended soil at 11 pressure heads, h, was determined by a sandbox (h = 0.01, 0.025, 0.1, 0.32, 0.63, 1.0 m) and a pressure plate apparatus (h = 3, 10, 30, 60, 150 m). For each sample, the parameters of the van Genuchten [18] model for the water retention curve with the Burdine condition were determined [18,19]. The hydraulic conductivity at saturation Ks was determined using a laboratory constant-head permeameter [20] by applying Darcy’s law.
A double-ring infiltrometer test was performed in situ to evaluate the hydraulic conductivity at saturation (ks) of the soil in T1 and T4, before and after the amendment process.
Soil pore water was monitored in terms of pH, EC (mS/cm), COD (mg/L), Nitrate (mg/L) and total phosphate (mg/L), to evaluate the effect of the CW amendment on soil. In particular, the latest monitoring was performed to estimate the release of nitrate in aquifers as a consequence of the CW incorporation and mineralization into the soil. In detail, the control soil and the soil amended with the highest quantity of CW (T3) were considered, as T3 represents the treatment with the highest risk of leaching nitrate. The analyses were performed soon after the soil amendment (July 2015), after about six months (January 2016), and after about 18 months from the treatment (January 2017). Pore water in T1 and T3 was extracted using ceramic suction lysimeters (Soil Solution Access Tube, SSAT by IRROMETER Company. Inc.), installed at a depth of 0.3 m. The pH and EC of the pore water were measured using a pH-meter and an HD2106.2 conductivity meter (delta OHM. Italy), respectively. COD, phosphate and nitrate were determined according to [21], following the procedures described in [22,23,24], respectively.
Soil samples were collected and characterized before the amendment with CW in January 2015 and after the treatment in July 2015, January and June 2016, January and July 2017. The soil samples for each sampling were previously air dried and sieved at 2 mm. Before the amendment, the soil at the experimental field was fairly uniform with a sandy-loam texture and a mean percentage of organic matter equal to 3.8% (Table 1).
All the methods used for soil characterization were performed according to [25]. The texture of the soil was evaluated before the amendment using the pipette method, determining the particle size classes, which were subdivided into clay (particles < 2 μm), silt (2 to 63 μm), and sand (63 to 2000 μm) [25]. Particles > 2000 μm were not considered. pH and EC were measured as described above for CW, in accordance with [26]. Organic carbon was determined by the oxidation–titrimetric method and the results were expressed as the percentage of dry matter [27]. Total N content in soil was determined by the hydrofluoric acid modification of the Kjeldahl method, including total fixed ammonium [28]. Total CaCO3 was determined by a “gas-volumetric” method based on the determination of the volume of CO2 produced in the presence of HCl. C.E.C. was determined on 2 g of soil samples, previously treated with 0.5 M BaCl2 (w/v) and with 0.05 M MgSO4, and finally chopped using 0.025 M EDTA; the results were expressed as meq of cations per 100 g of soil [26]. Phosphorus was spectrophotometrically (630 nm) determined by the Olsen method [29] and was expressed as the percentage of phosphorus (P) in the soil.

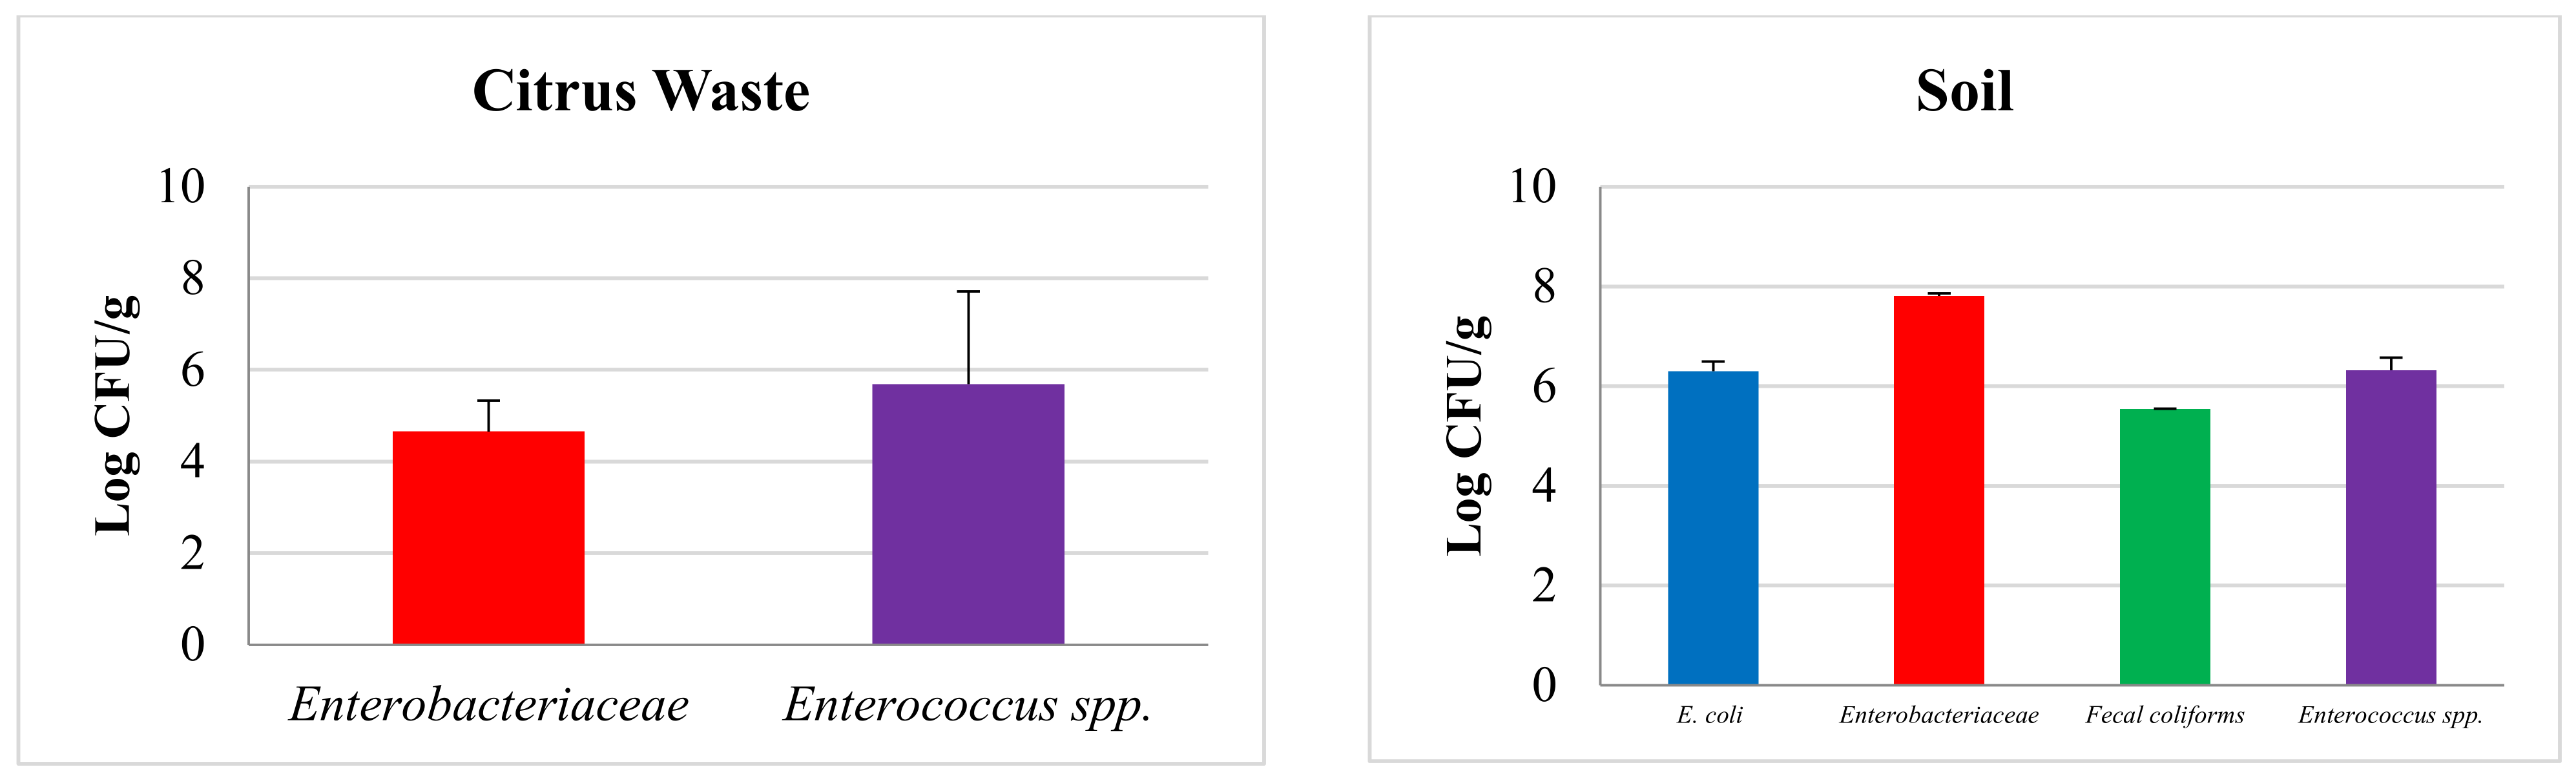
2.3. Microbiological Analyses of Soil and Soil Pore Water

The microbiological analyses were carried out following procedures indicated by the Legislative Decree (LD) 75/2010 on “Reorganization and revision of the discipline regarding fertilizers”, in accordance with Article 13 of the Italian Law 7 July 2009, n. 88, which imposes that the research of Salmonella enterica and Escherichia coli is conducted according to specific sampling plans. Furthermore, fecal bacteria, such as Enterobacteriaceae, fecal coliforms and Enterococcus spp., were counted in accordance with the procedures reported in the “Ministerial Decree 8 July 2002: Approval and formalization of the soil microbiological analysis methods.” Soil and CW samples (25 g) periodically collected were homogenized in sterile bags (Whirl-Pak1, Nasco, Fort Atkinson, WI, USA), diluted in 225 mL of physiological water (0.9% NaCl), using a stomacher 80 lab blender (Seward Ltd., West Sussex, England). Serial dilutions were obtained in sterile physiological water and 0.1 mL was used for microbiological analyses in accordance with [30]. Microbiological counts were performed using the following media and conditions: Mc Conkey agar (Liofilchem srl (Roseto D.A. (TE), Italy) for the enumeration of E. coli, incubated 37 °C for 24–48 h; Violet Red Bile Glucose Agar (VRBGA, Liofilchem) for the enumeration of Enterobacteriaceae and fecal coliforms, incubated at 37 °C and 45 °C for 24–48 h, respectively; Kanamicin Azide Aesculine agar (KAA, Liofilchem) for the enumeration of Enterococcus spp., incubated at 37 °C for 24–48 h. For S. enterica detection, the pre-enrichment and enrichment/isolation phases were followed. In detail, homogenate samples were inoculated at a 1:10 (w/w) ratio in buffered peptone water and incubated at 36 ± 1 °C for 24 h. Aliquots of 0.5 mL of the pre-enrichment culture were inoculated into Rappaport Vassiliadis Broth (Oxoid Rodano, Milan, Italy), and the tubes were incubated at 42 ± 1 °C for 24 + 24 h. A loopful of broth culture from all tubes was stricken on the Hektoen Enteric Agar selective medium (Oxoid) and incubated at 36 ± 1 °C for 24 h. Finally, preliminary identification based on the colony appearance of selective agar media was confirmed using classical biochemical (fermentation of glucose and lysine decarboxylase) and serological tests. The results were expressed as presence/absence per gram of dry weight.
The emended soil pore water was analyzed using the membrane filtration technique, in accordance with [31]. In detail, water samples were diluted and filtered in sterile glasses equipped with cellulose membranes (0.45 μm pores) in a 3-position filtration ramp. Subsequently, the membranes were transferred onto the same selective culture media used for the microbiological analyses of soil samples. The results were expressed as a Log Colony Forming Unit (CFU)/100 mL.

2.4. Plant Growth, Yield and Fruit Quality

Before adding the citrus waste to the soil, the orange trees were uniformly pruned to achieve similar volumes of the canopy. For each treatment (Ti), the vegetative growth was measured on five trees per treatment during May 2015 and January 2016, 2017 and 2018. The canopy volume (V, m3) was calculated by the following equation:
V = 0.524 × height × width2
the tree shape was assumed to be half the prolate spheroid [32]; tree height (m); trunk width (m).
The number of harvested fruits, total production (kg) per tree and mean fruit weight (g) were measured on the same five trees per treatment. ‘Tarocco comune’ fruits were collected at the commercial maturity during mid-January of the years 2016, 2017 and 2018, and transferred to the laboratory. There, 30 fruits for each treatment were divided into 3 random replicas and individually analyzed. Fruit weight was determined using an electronic balance.
Fruit juice was extracted with a commercial juice extractor (Kenwood Citrus Juicer JE290, Bolton, UK). Fruit quality analyses were performed. Juice total soluble solids content (TSS) was determined using a temperature-compensated digital refractometer (Atago Co., Ltd. model PR-32 α, Tokyo, Japan) and expressed as °Brix and juice titrable acidity (TA) by titration with 0.1 N NaOH (Hach, TitraLab AT1000 Series), and expressed as g L−1. The vitamin C content was determined by titration (702 SM Titrino, Metrohm, Herisau, Switzerland) with 0.001 M I2, and the results were expressed as mg/L. Total anthocyanin content was determined through a spectrophotometer (NanoDrop 2000, Thermo Scientific, Waltham, MA, USA) by the pH differential method [33], and expressed as cyanidin 3-glucoside equivalents (mg L−1).

2.5. Metagenomic Functional Analysis of CW’s Microbiota

Total DNA, including that from the naturally occurring microflora in citrus waste (CW), was extracted with the Tris-SDS [34]. The presence and the relative amount of the DNA of viridiplantae, fungi and eubacteria were then evaluated by PCR-amplifying total DNA with the universal primers: 16S pro eubacteria (PRK) (forward, CCTACGGGRBGCASCAG; reverse, GGACTACYVGGGTATCTAAT); ITS pro fungi (forward, TCCGTAGGTGAACCTTGCGG; reverse, TCCTCCGCTTATTGATATGC); 18S pro viridiplantae (forward, AACCTGGTTGATCCTGCCAGT; reverse TGATCCTTCTGCAGGTTCACCTAC). PCR reaction was performed in a thermal cycler (Eppendorf Mastercycler 5200) using an initial 94 °C denaturing step for 3 min followed by 35 cycles in accordance with each above-mentioned protocol and with an annealing temperature (Tann) of 55 °C. The quantity and quality of the extracted DNA were verified by Nano drop (ThermoFisher, USA) analysis, and Nextera™ Technology (Illumina, San Diego, CA, USA) for NGS. DNA Library Preparation was used for the sequence of microbiota of complex materials, such as CW, and the protocol was used even for this matrix without any significant changes.
Then, the quality of reads was checked using the following tools: FastQC (Version 0.11.3) and BBDuk (Version 36.20). During this process all reads longer than 35p and with a Phred quality score (https://jgi.doe.gov/data-and-tools/bbtools/bb-tools-user-guide/bbduk-guide/, accessed on 27 October 2019) of at least 25 were selected.
Upon completion of the cleaning process of all selected reads, the evaluation of the taxonomic composition of the sample was started by using K-mer analysis [35] based on a further fragmentation of all reads in k-mer products of 31bp. All those k-mers were compared using the Sequentia Biotech Database (Sequentia Biotech SL, Barcelona, Spain), which contains K-mer products of all taxonomic groups, including virus, archaebacteria, bacteria and fungi. Based on the comparison, it is possible to assign the reads to a specific taxonomic group. The functional analysis was carried out by following the SOAPdenovo (Version 2.04; http://soap.genomics.org.cn/soapdenovo.html, accessed on 27 October 2019) informatics procedure, a short-read assembly method that can build a de novo draft assembly for large-sized genomes. This program is specially designed to assemble Illumina short reads into longer regions called contig, which are used to identify the putative proteins with the PRODIGAL software (Version 2.6.2). Finally, the tool Interproscan Database (Version 5.19) was used to identify the ontology of proteins. For the CW of blonde oranges a total of 15,073,857 analyzed regions were sequenced. All above-described steps were included in a dedicated software, which, on the basis of the NGS-sequencing row data of the CW as input, is able to automatically report all taxonomic and related functional output (GAIA; www.metagenomics.com). GAIA is a SaaS (software as a service) system, which does not need a hardware or software to be ran.

2.6. Statistical Analysis

All the experiments reported in this study were performed according to specific sampling plans and the data obtained were reported as mean values provided with standard deviation.
Microbiological and physico-chemical data were analyzed by ANOVA (one-way analysis of variance), using Tukey’s post hoc test to assess the overall variation and differences between the multiple groups. The reference level of significance was 0.05 in all the assays. Statistical ANOVA was carried out to evaluate significant differences on bacterial growth on different media and on the physico-chemical characteristics of samples during the sampling period. In addition, in order to evaluate the extent to which the concentrations of the considered microbial groups correlate to physico-chemical parameters, the correlation by Pearson rank was used and statistical significance values were determined. Statistical ANOVA (p < 0.05) and the correlation test were performed using XLSTAT [36].

3. Results

3.1. Physico-Chemical and Hydraulic Characterizations of CW

Table 2 reports the main physico-chemical characteristics of citrus waste (CW) as detected in April 2015 and after one month (May 2015). As expected, the humidity of CW decreased by about 30% and the ash content increased by about 17%.
All other parameters remained quite stable.
Physico-chemical analyses on soil samples were performed during the entirety of the experimental period, from July 2015 (2 months after amendment) to July 2017 (24 months after amendment). Figure 2 reports the values of pH and EC of the soil pore water. Two months after amendment (July 2015), the soil pH decreased in the T3 and T4 treatment. In January 2016, the pH was quite constant, around 7.0, in all samples of the different treatments (Figure 2A). From June 2016, the pH slowly increased in all soil samples to reach the highest value (ca. 8.5) in January 2017 (Figure 2A). No significant (p > 0.05) differences on pH were detected among the different treatments (Figure 2A). The EC significantly increased after only two months from amendment in T2 due to the addition of Ca(OH)2 (Figure 2B). In January 2016, all soil samples had similar EC values (around 0.15 mS/cm). Conversely, in June, the highest EC values (around 0.30 mS/cm) were registered in T2 soil, followed by T3 and T4, whereas in January 2017 the highest EC (around 0.35 mS/cm) was observed in T3, probably as consequence of the highest amount of CW added to the soil (Figure 2B). In January 2017, EC values decreased in all samples, and finally, at the end of the experimental period (July 2017) EC values (around 0.18 mS/cm) decreased, reaching values similar to the control, T1 (Figure 2B).
Figure 3 reports the organic carbon (OC), organic matter (OM), total nitrogen (N) and phosphorus contents in soil samples from July 2015 to July 2017. A similar trend was observed for OC, OM and N accumulation as an effect of CW addition. Only after 2 months from the amendment (July 2015) did C and N contents greatly increase in all the treatments, reaching their highest values (OC: 7%, OM: 11.7%, and N: 0.45%) in T3 (Figure 3A,C). The highest contents of OC, OM and N until the end of the experimental period (July 2017) were detected in T3. The OC, OM and N content in amended soils gradually decreased during the two years of monitoring (from July 2015 to July 2017), always showing a higher amount than the control treatment (Figure 3A–C). Interestingly, the same amount of CW (T2 and T4) resulted in similar values of OC, OM and N, except in June 2016, as it resulted in similar values only for OC and OM, when it was observed that the addition of Ca(OH)2 in T2 may had caused a reduction in content compared to T4. As expected, the C/N ratio in T1 remained rather constant (ranging from 10 to 15) during the experimental period. In the first two samples, C/N for all the amended soils increased with respect to T1. In June 2016, the C/N ratio decreased in T2, reaching the value detected in T1, whereas T3 and T4 showed higher values than T1. Finally, in January and July 2017, the C/N values were rather constant (around 10) in all the investigated samples.
Based on the amount of P in CW, the amendment slowly modified the P (%) content. As observed in Figure 3D, no significant differences (p > 0.05) were observed for the different treatments during the experimental period (Figure 3D).
The results from the treatments carried out on soil pore water are reported in Table 3. Two months from the amendment (July 2015), the pH was drastically lower (pH 3.7) than in T1 (pH 7.2), whereas in all the other samples, pH values were not statistically significant. EC values remained constant in soil pore water, except for T3 in January 2017, where EC increased to 3.32 mS/cm (Table 3). COD values were always higher in the T3 treatment than in T1 (Table 3). The nitrate content of the soil pore water sharply increased in T3 in January 2016 (32 mg/L). However, it slowly decreased in January 2017 (10.4 mg/L) and the values were always higher than those detected in all the other samples (Table 3). Finally, the resulting phosphate content was rather constant in all the samplings, except in T3 in January 2016, when the phosphate content slowly increased compared to the other samples (Table 3).
Table 4 shows the soil hydraulic conductivity at saturation (ks, m d−1) for the different treatments; ks values were obtained by the constant-head permeameter method, before (January 2015) and after the soil amendment with citrus waste (from January 2016 to July 2017). The values obtained indicate a reduction in soil ks of about an order of magnitude due to the adoption of CW.
With reference to the in situ infiltrometric tests, generally, the time intervals were more intense in the first phase of the test until the complete saturation of the macroporosity and microporosity of the soil. In particular, in T1 (control), the infiltration rate reached 1.2 mm h−1, while in T4 it reached 6 mm h−1. At the end of the investigation period, a greater capacity of the soil to retain water was detected, compared to the first test; in fact, the water content values determined showed an increase of about 16% in the volumetric water content corresponding to the field capacity, and an increase of about 10% in correspondence to the wilting point.

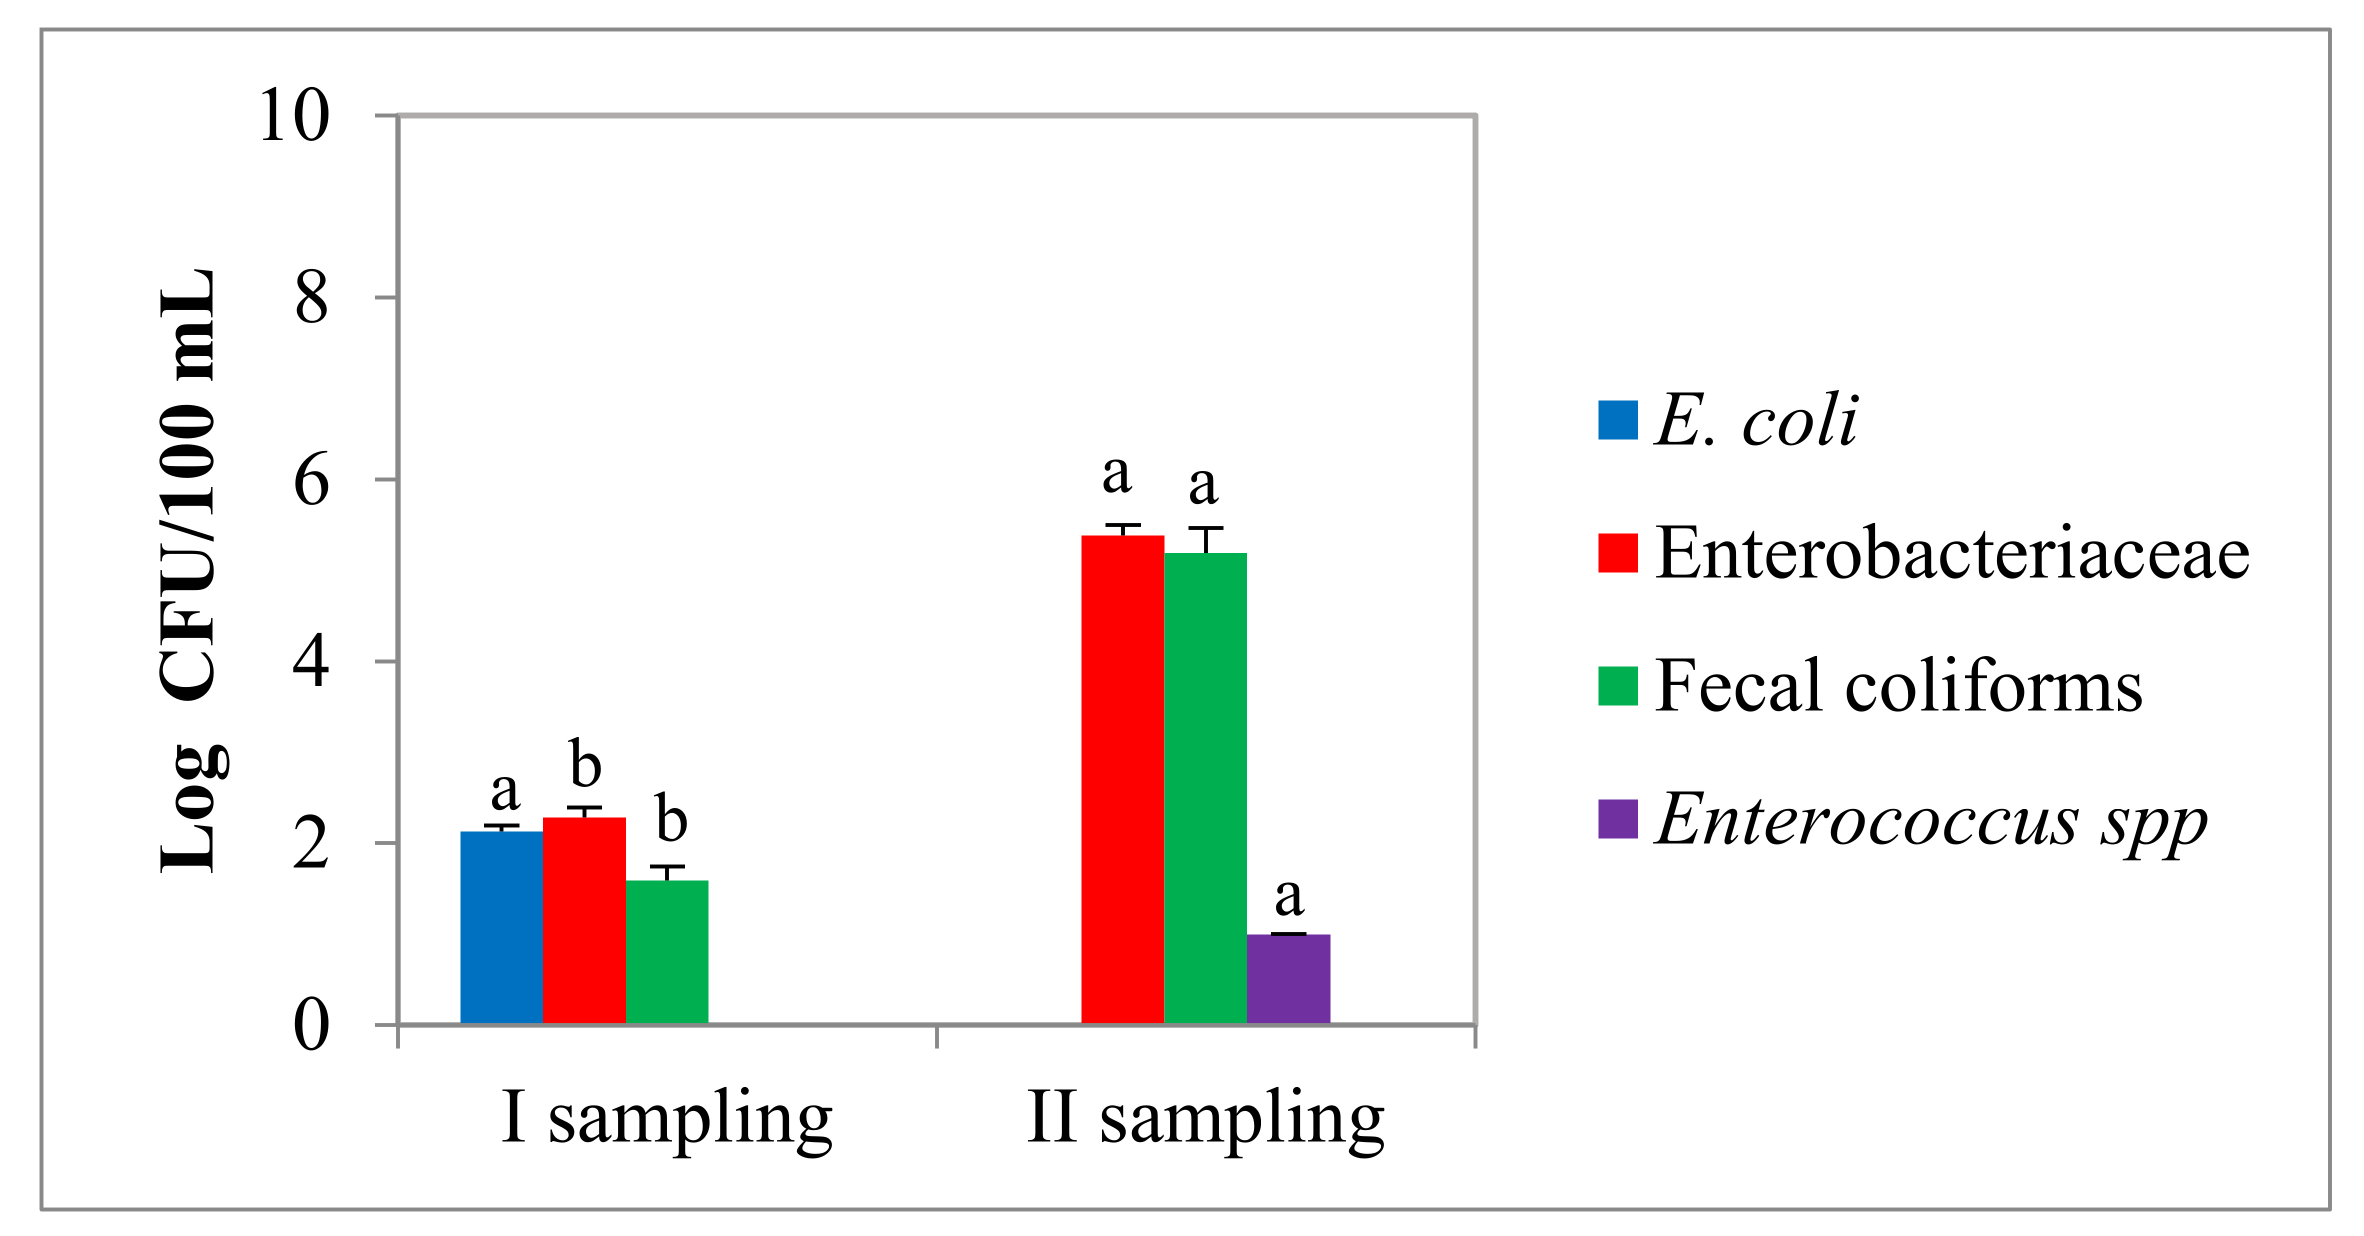
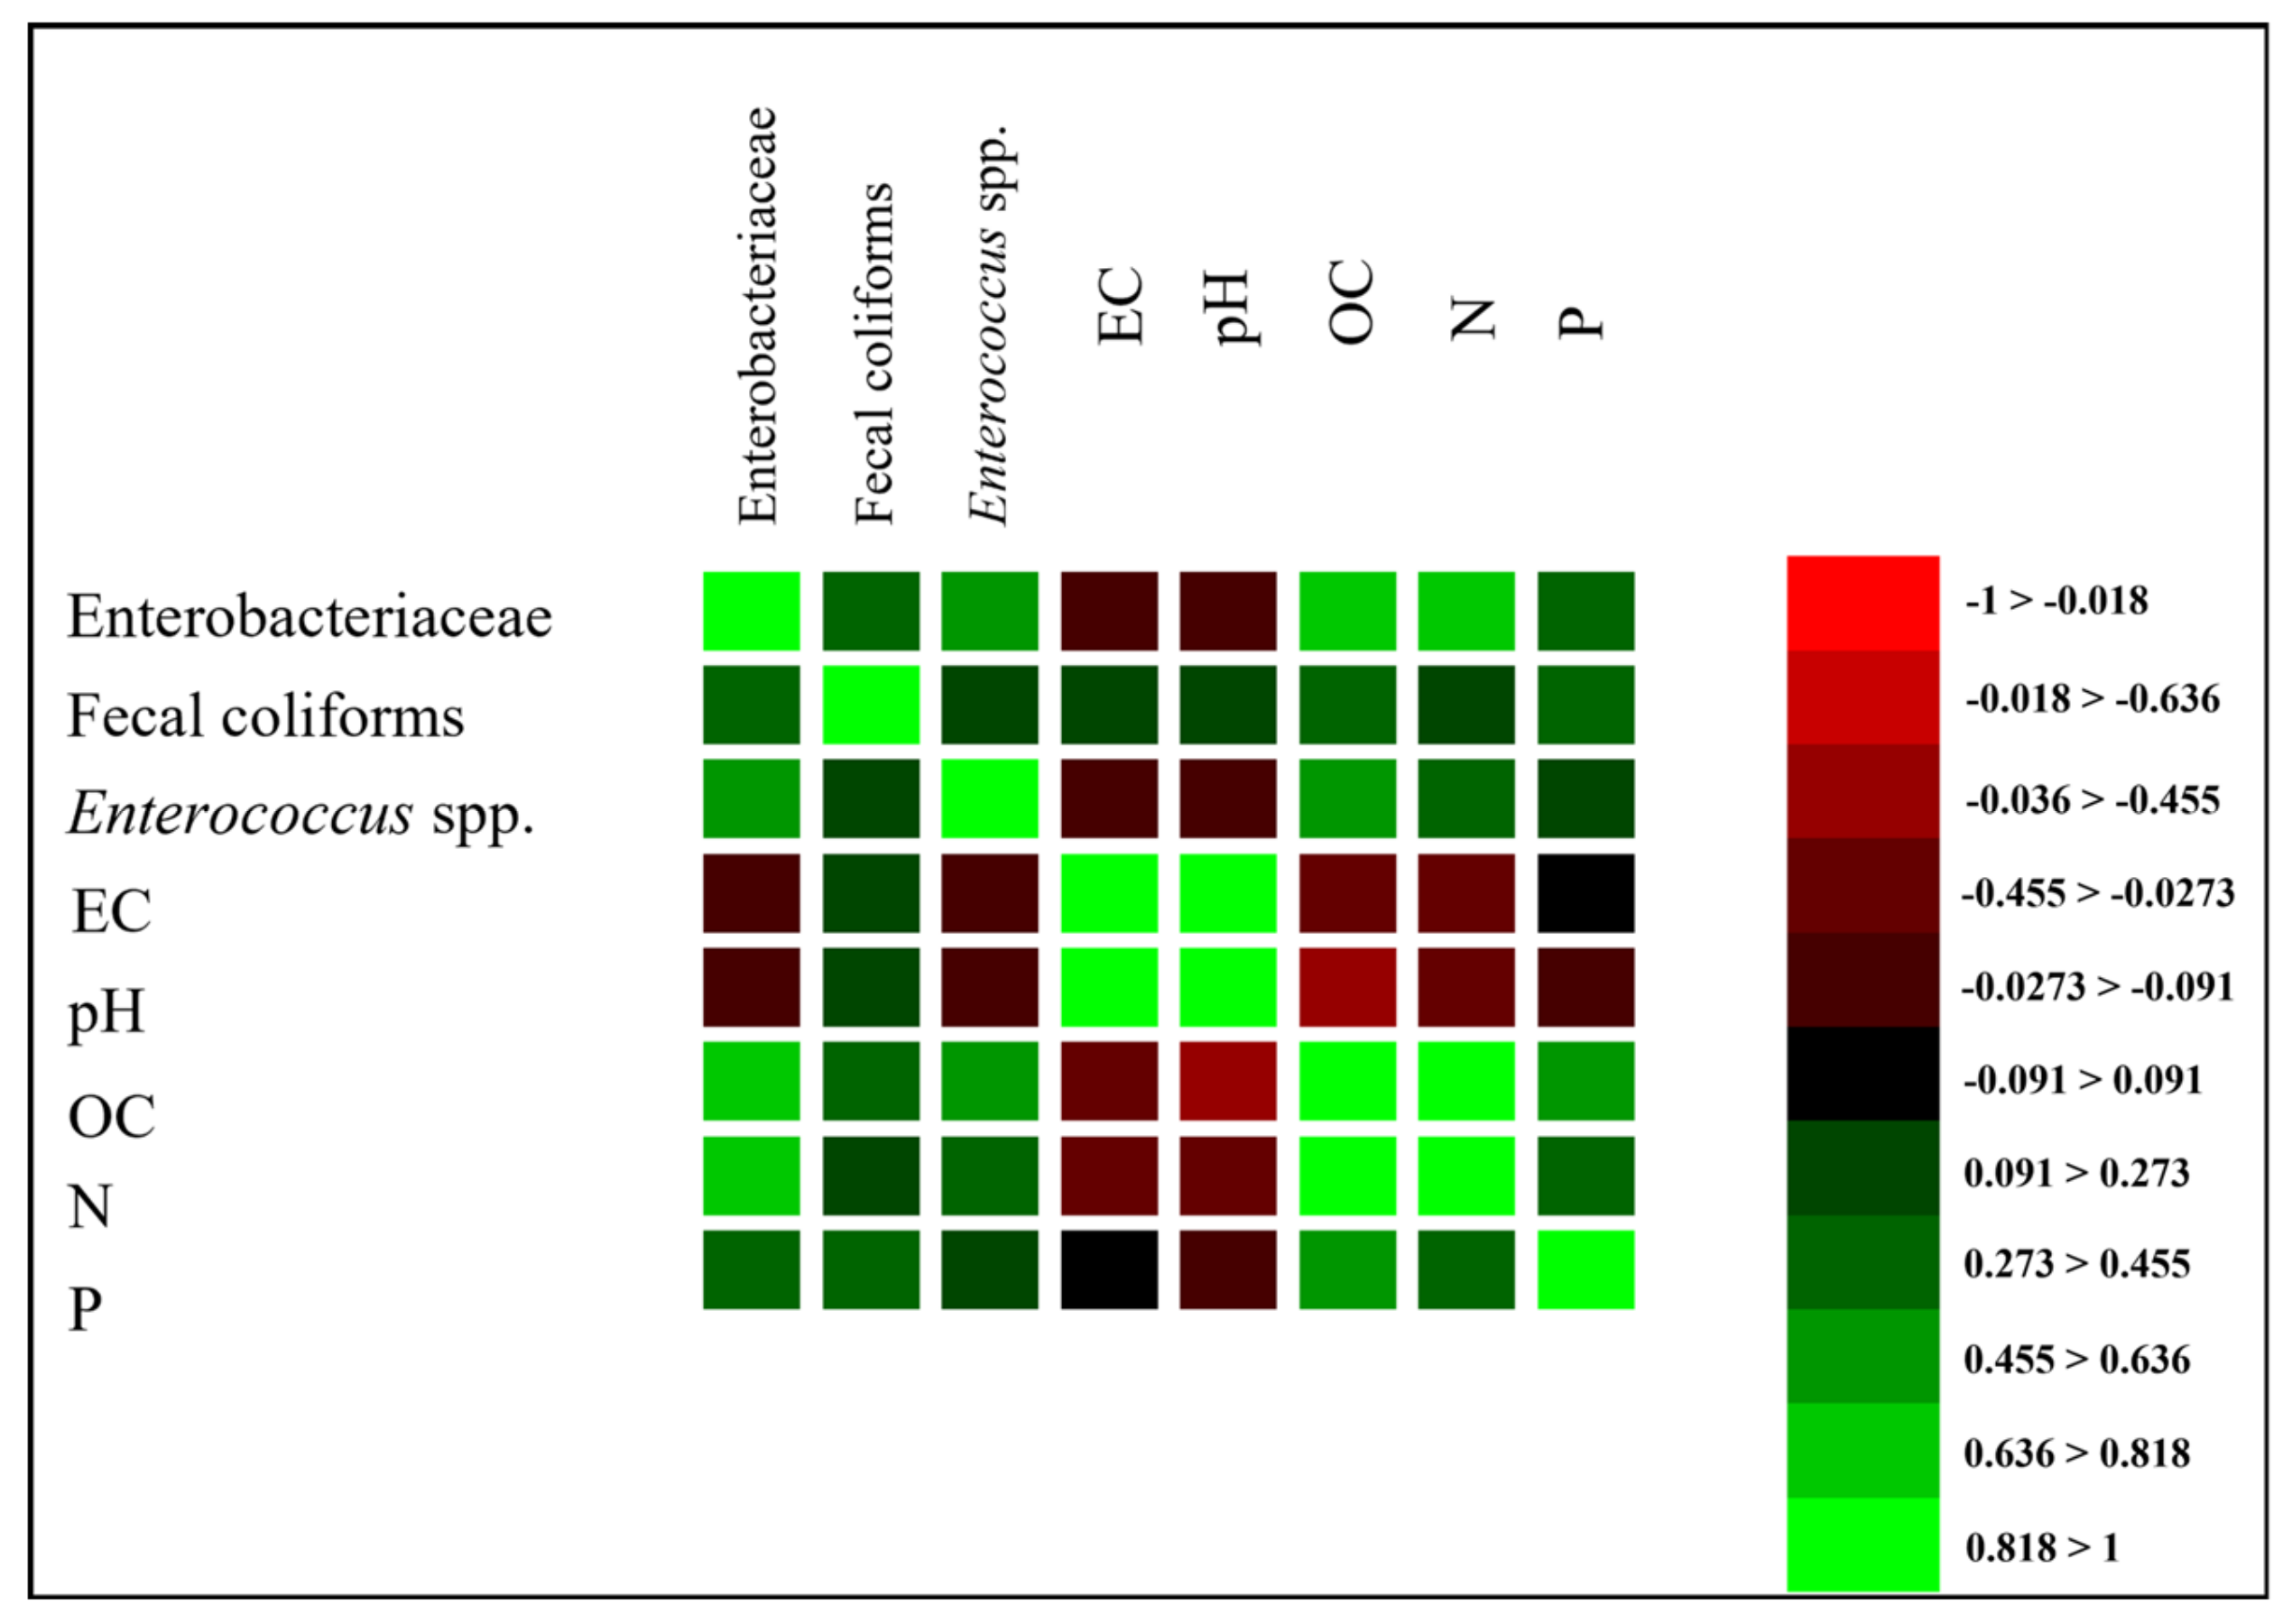
3.2. Microbiological Characterization of Soil and Soil Pore Water Samples

The results of microbiological analyses carried out on citrus waste (CW) and soil without any CW addition are shown in Figure 4; the results are the average of five replicates and the standard deviation is also reported.
Data analysis on citrus waste (CW) highlighted the absence of E. coli, fecal coliforms and Salmonella, whereas Enterobacteriaceae and Enterococcus spp. were detected as 4.6 Log CFU/g and 5.6 Log CFU/g, respectively. The microbiological parameters detected for CW were in accordance with Attachment 2 of the LD 75/2010, which set the absence of Salmonella (absence in 25 g of sample: n = 5; c = 0; m = 0; M = 0) and limited the presence of E. coli (referring to 1 g of sample: n = 5; c = 1; m = 1000 CFU/g; M = 5000 CFU/g). Similarly, in the soil, before the CW addition, neither Salmonella nor E. coli were found, while fecal coliforms, Enterobacteriaceae and Enterococcus spp. were detected at 5.5, 7.8 and 6.3 Log CFU/g, respectively.
The microbiological analyses of soil samples at the different treatments (Ti) during different sampling times (2, 6, 12, 18 and 24 months) are shown in Table 5. Overall, the results highlighted the absence of Salmonella and E. coli, while fluctuations of other microbial groups were observed (Table 5).
In detail, an increase in the enterococci and Enterobacteriaceae counts for the T2 and T4 samples, mostly after 2 months from the amendment, was detected. A similar effect, to a lesser extent, was evidenced in T3 samples, where the effect of CW addition persisted for up to 18 months (Table 5). Moreover, comparing the results obtained from the control (not-amended) soil (T1) at 2, 6, 12, 18 and 24 months to those obtained from the soil before the amendment, an increase in the cell density of fecal coliforms and a decrease in Enterobacteriaceae and Enterococcus spp. is detected.
Finally, the data obtained from the soil pore water showed the absence of Salmonella, the presence of E. coli in July 2015 (after 2 months) and a high cell density of Enterobacteriaceae, fecal coliforms and enterococci in January 2017 (after 8 months) (Figure 5). These data confirm the microbial variability observed in soil samples, regardless of the performed treatment. Overall, both among sampling points and among considered microorganisms, significant differences (p < 0.05) were observed.
Moreover, strong positive correlations were revealed, mostly for fecal coliforms and physico-chemical parameters. Only in some cases, negative correlations were observed in relation to the other considered parameters (Figure 6).

3.3. Workflow for Data Integration for Taxonomic-Functional Species-Specific Association

The developed software GAIA has been prepared for shotgun or amplicon sequencing analysis and has already been tested with several test datasets for its functionality. GAIA is available at www.metagenomics.com (accessed on 27 October 2019). Through this system, NGS data from complex ecological matrices can be automatically analyzed for taxonomic and functional analysis of microflora, storage of sequencing data, and exploration of results. GAIA is a SaaS (software as a service) system developed on cloud systems and it does not need hardware or software systems to run.
During the taxonomic assignment process, 55.05% of the 15,073,857 reads were classified using the Sequentia Biotech database of complete genomes derived from the RefSeq database. The remainder, 44.95%, found no certain match in the database and was, therefore, discarded. Such analysis showed: (i) A high abundance of Acetobacter okinawensis (probable strain: Acetobacter okinawensis JCM 25146); (ii) A medium abundance of Acetobacter pasteurianus; and (iii) A low abundance of Acetobacter malorum Acetobacter papayae, Acetobacter tropicalis, Gluconobacter oxydans, Komagataeibacter hansenii, Komagataeibacter medellinensis, Streptomyces avicenniae, Streptomyces catenulae, Streptomyces megasporus.
Two taxonomic trees were realized (results produced in Table 6 and Table 7), taking as the minimum threshold all that is shown with at least 10K reads, and one with all that we see with at least 50 K reads.
The two taxonomic trees generated from the reads at different depths show that the taxonomic group most represented in the examined CW is the genus Acetobacter. This is the one that very possibly contributes the most to the degradation of the pulp, although other bacterial genera, such as Streptomyces and Lactobacillus, must also be added; thus, it is likely that there is a bacterial “guild” in charge of the degradation of the citrus waste.
What enzyme functions are overexpressed in these bacterial functional “guilds”? That is, which gene populations are most commonly found in the metagenome? To this end, a functional metagenomics analysis was performed as described in the Section 2.
The analysis performed returns two types of results; the first is the identification of the molecular functions of the genes found, and it is presented in Figure 7.
The results of the gene ontology enrichment analysis (GOEA) are shown in a TreeMap, which is a visual approach to data visualization. The features derived from gene ontology (GO) are represented as groups. On the one hand, the size of the group depends on the GO group enrichment (type of enzyme function) given by a test after false discovery rate (FDR) correction. The larger the group the more specific the function is for the analyzed dataset with respect to Uniprot’s GO database. The color of the rectangles, on the other hand, depends on the category enrichment score. In fact, the color turns from blue to red based on the frequency of a category in the dataset. The more frequent a category is, that is, enriched, the more the square takes on a dark red color. Several GOs are related to hydrolytic and lytic activities (as might be expected); others related to cellular respiration, phosphorus metabolism, and cellular detoxification processes emerge significantly present.

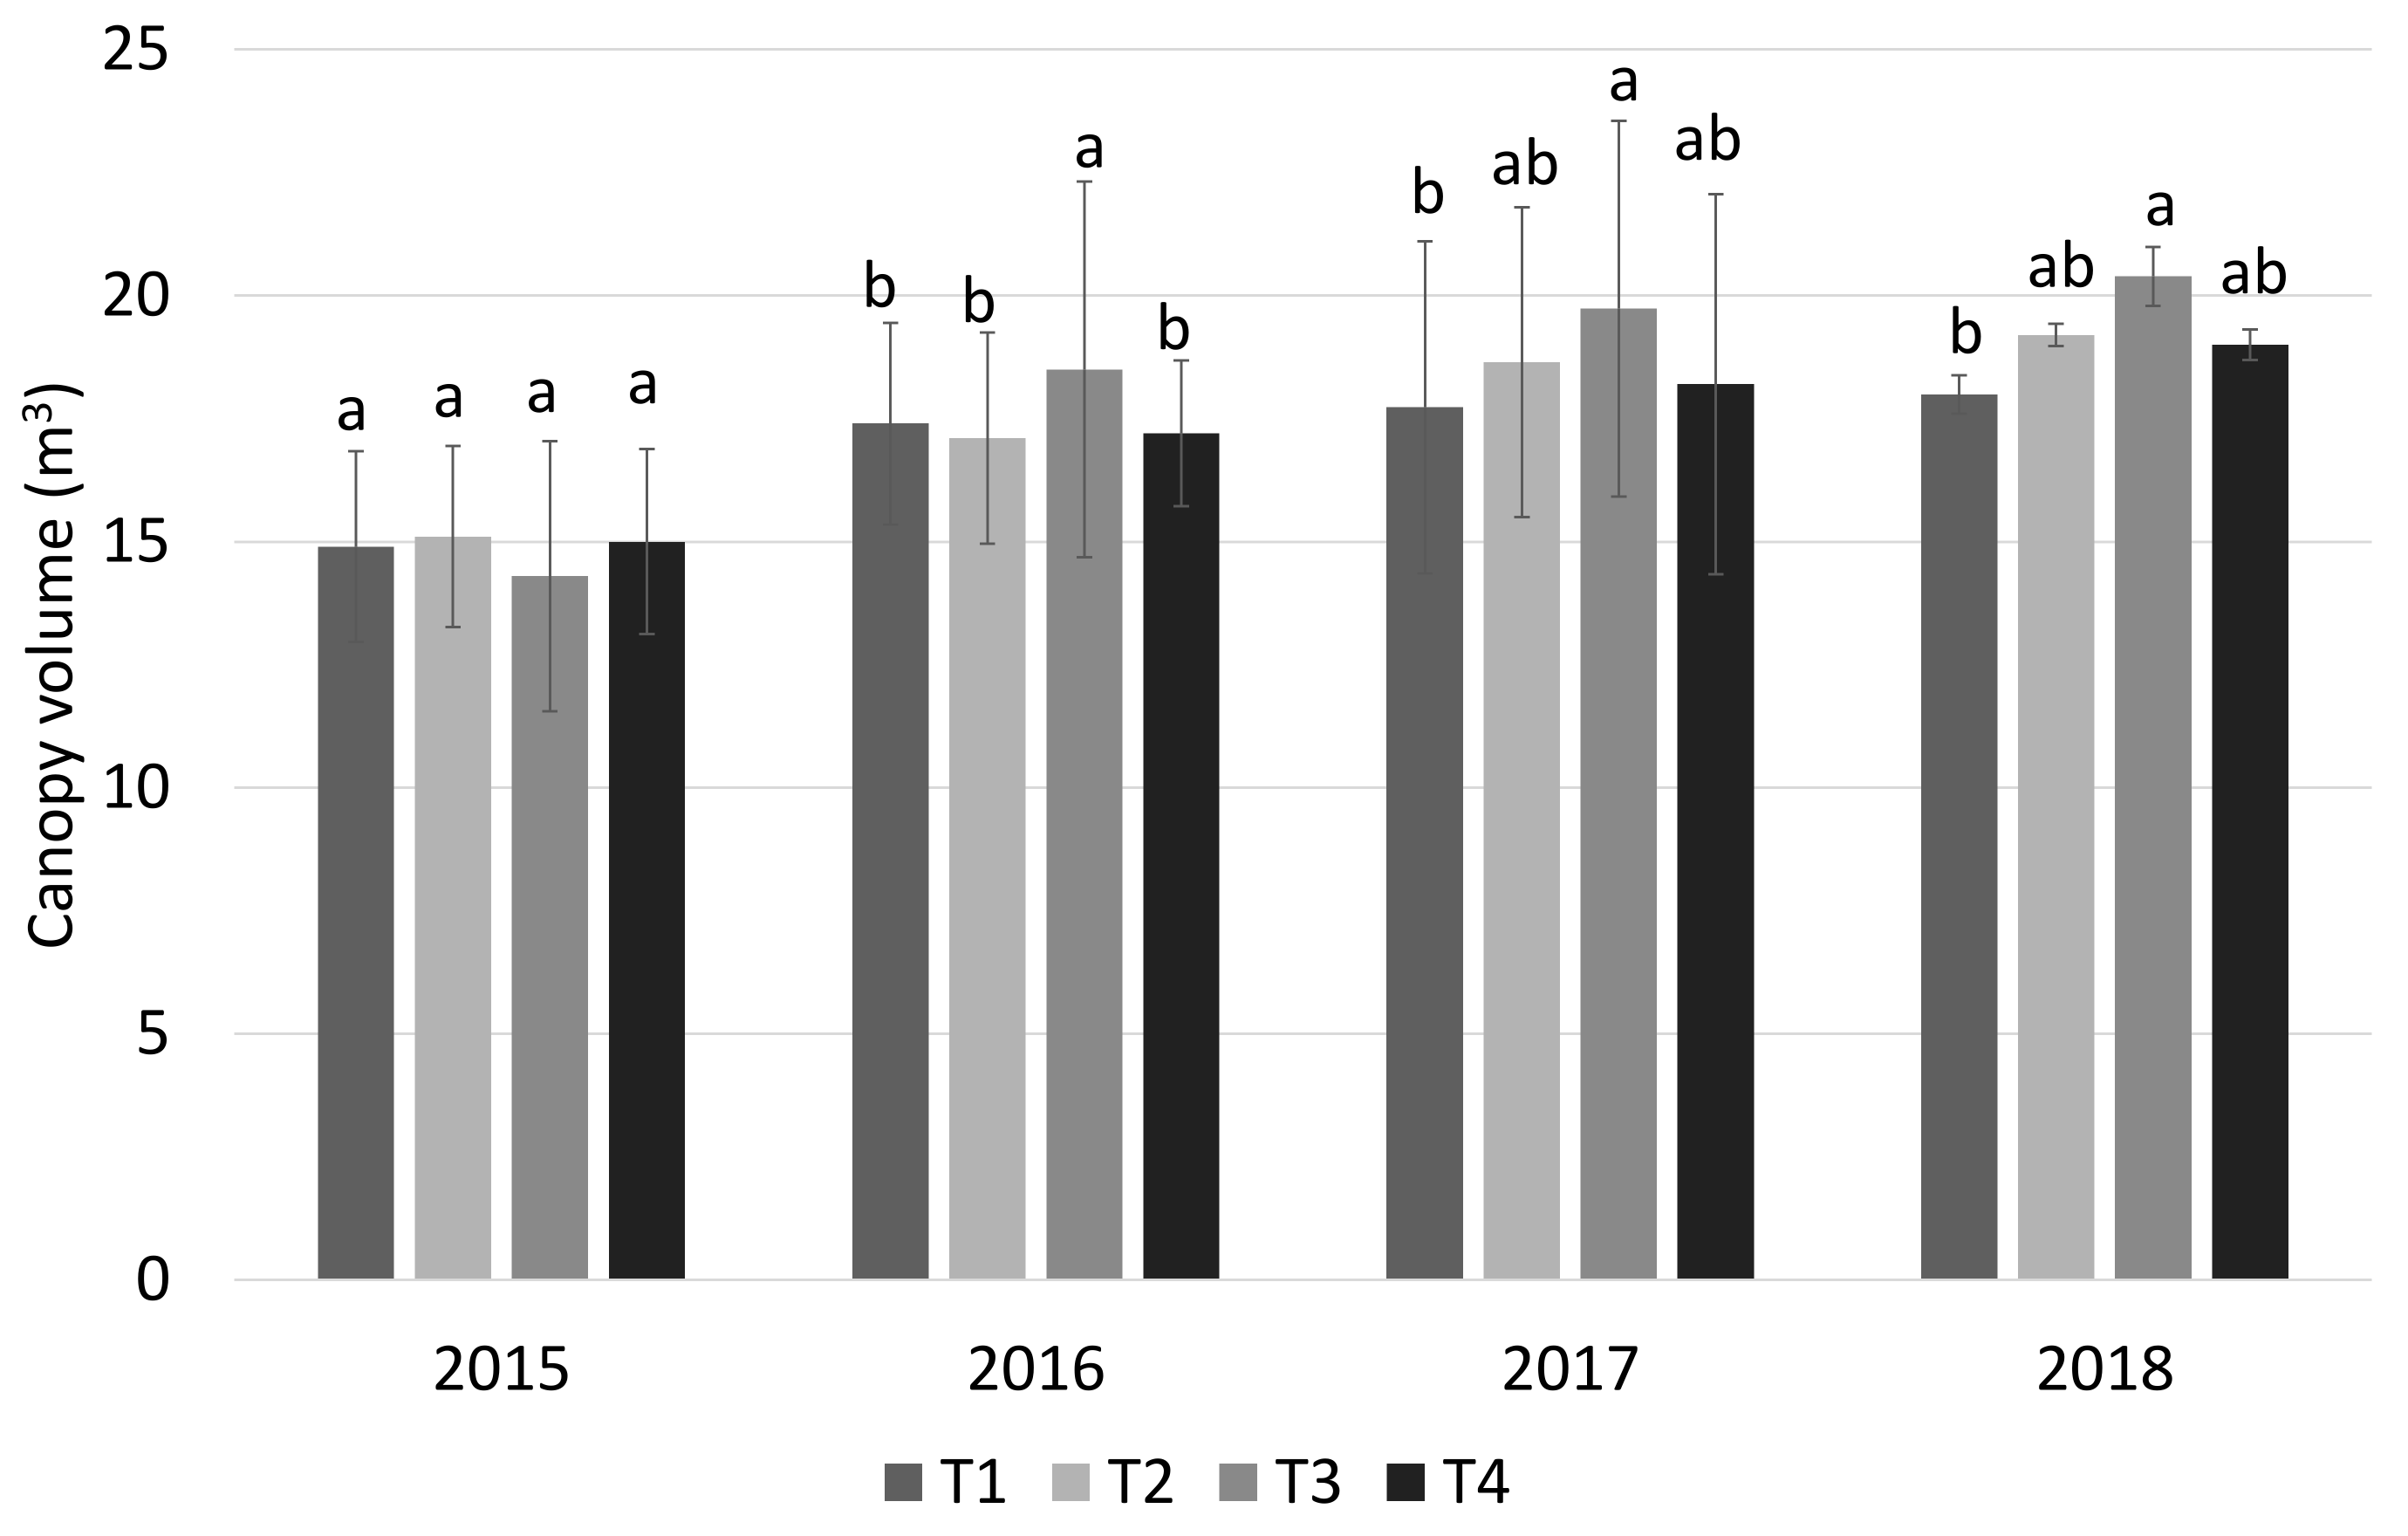
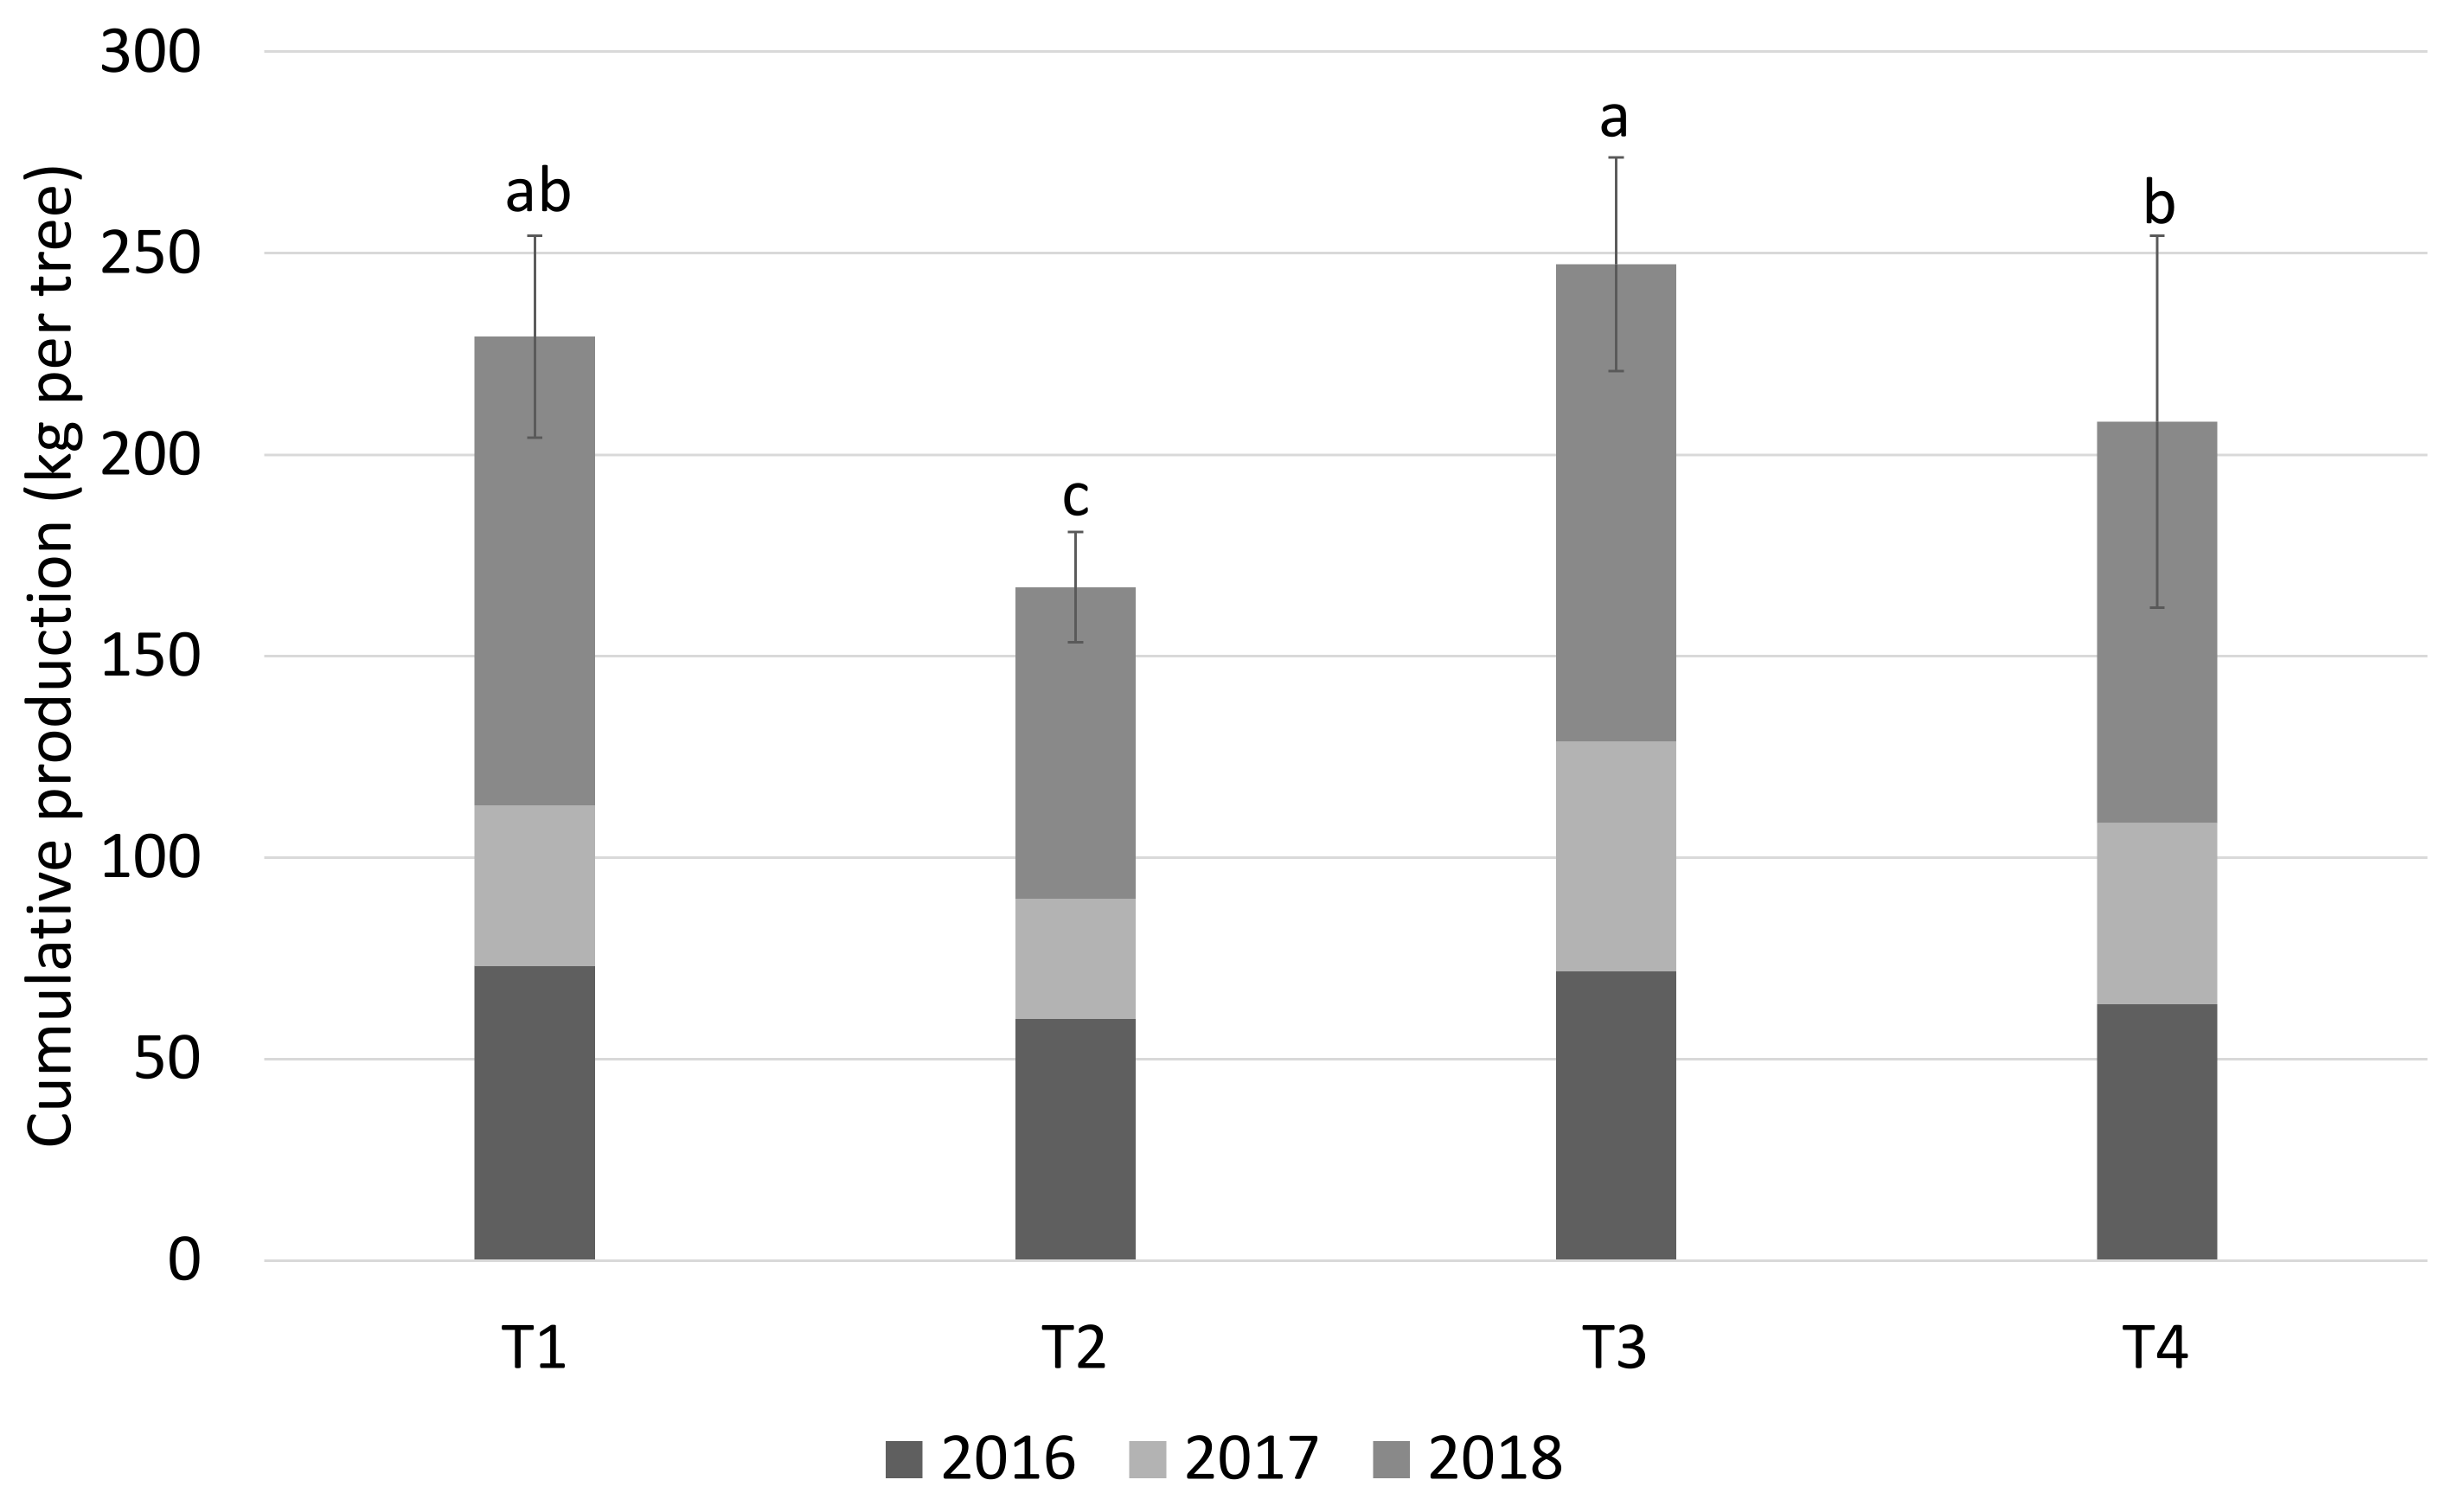
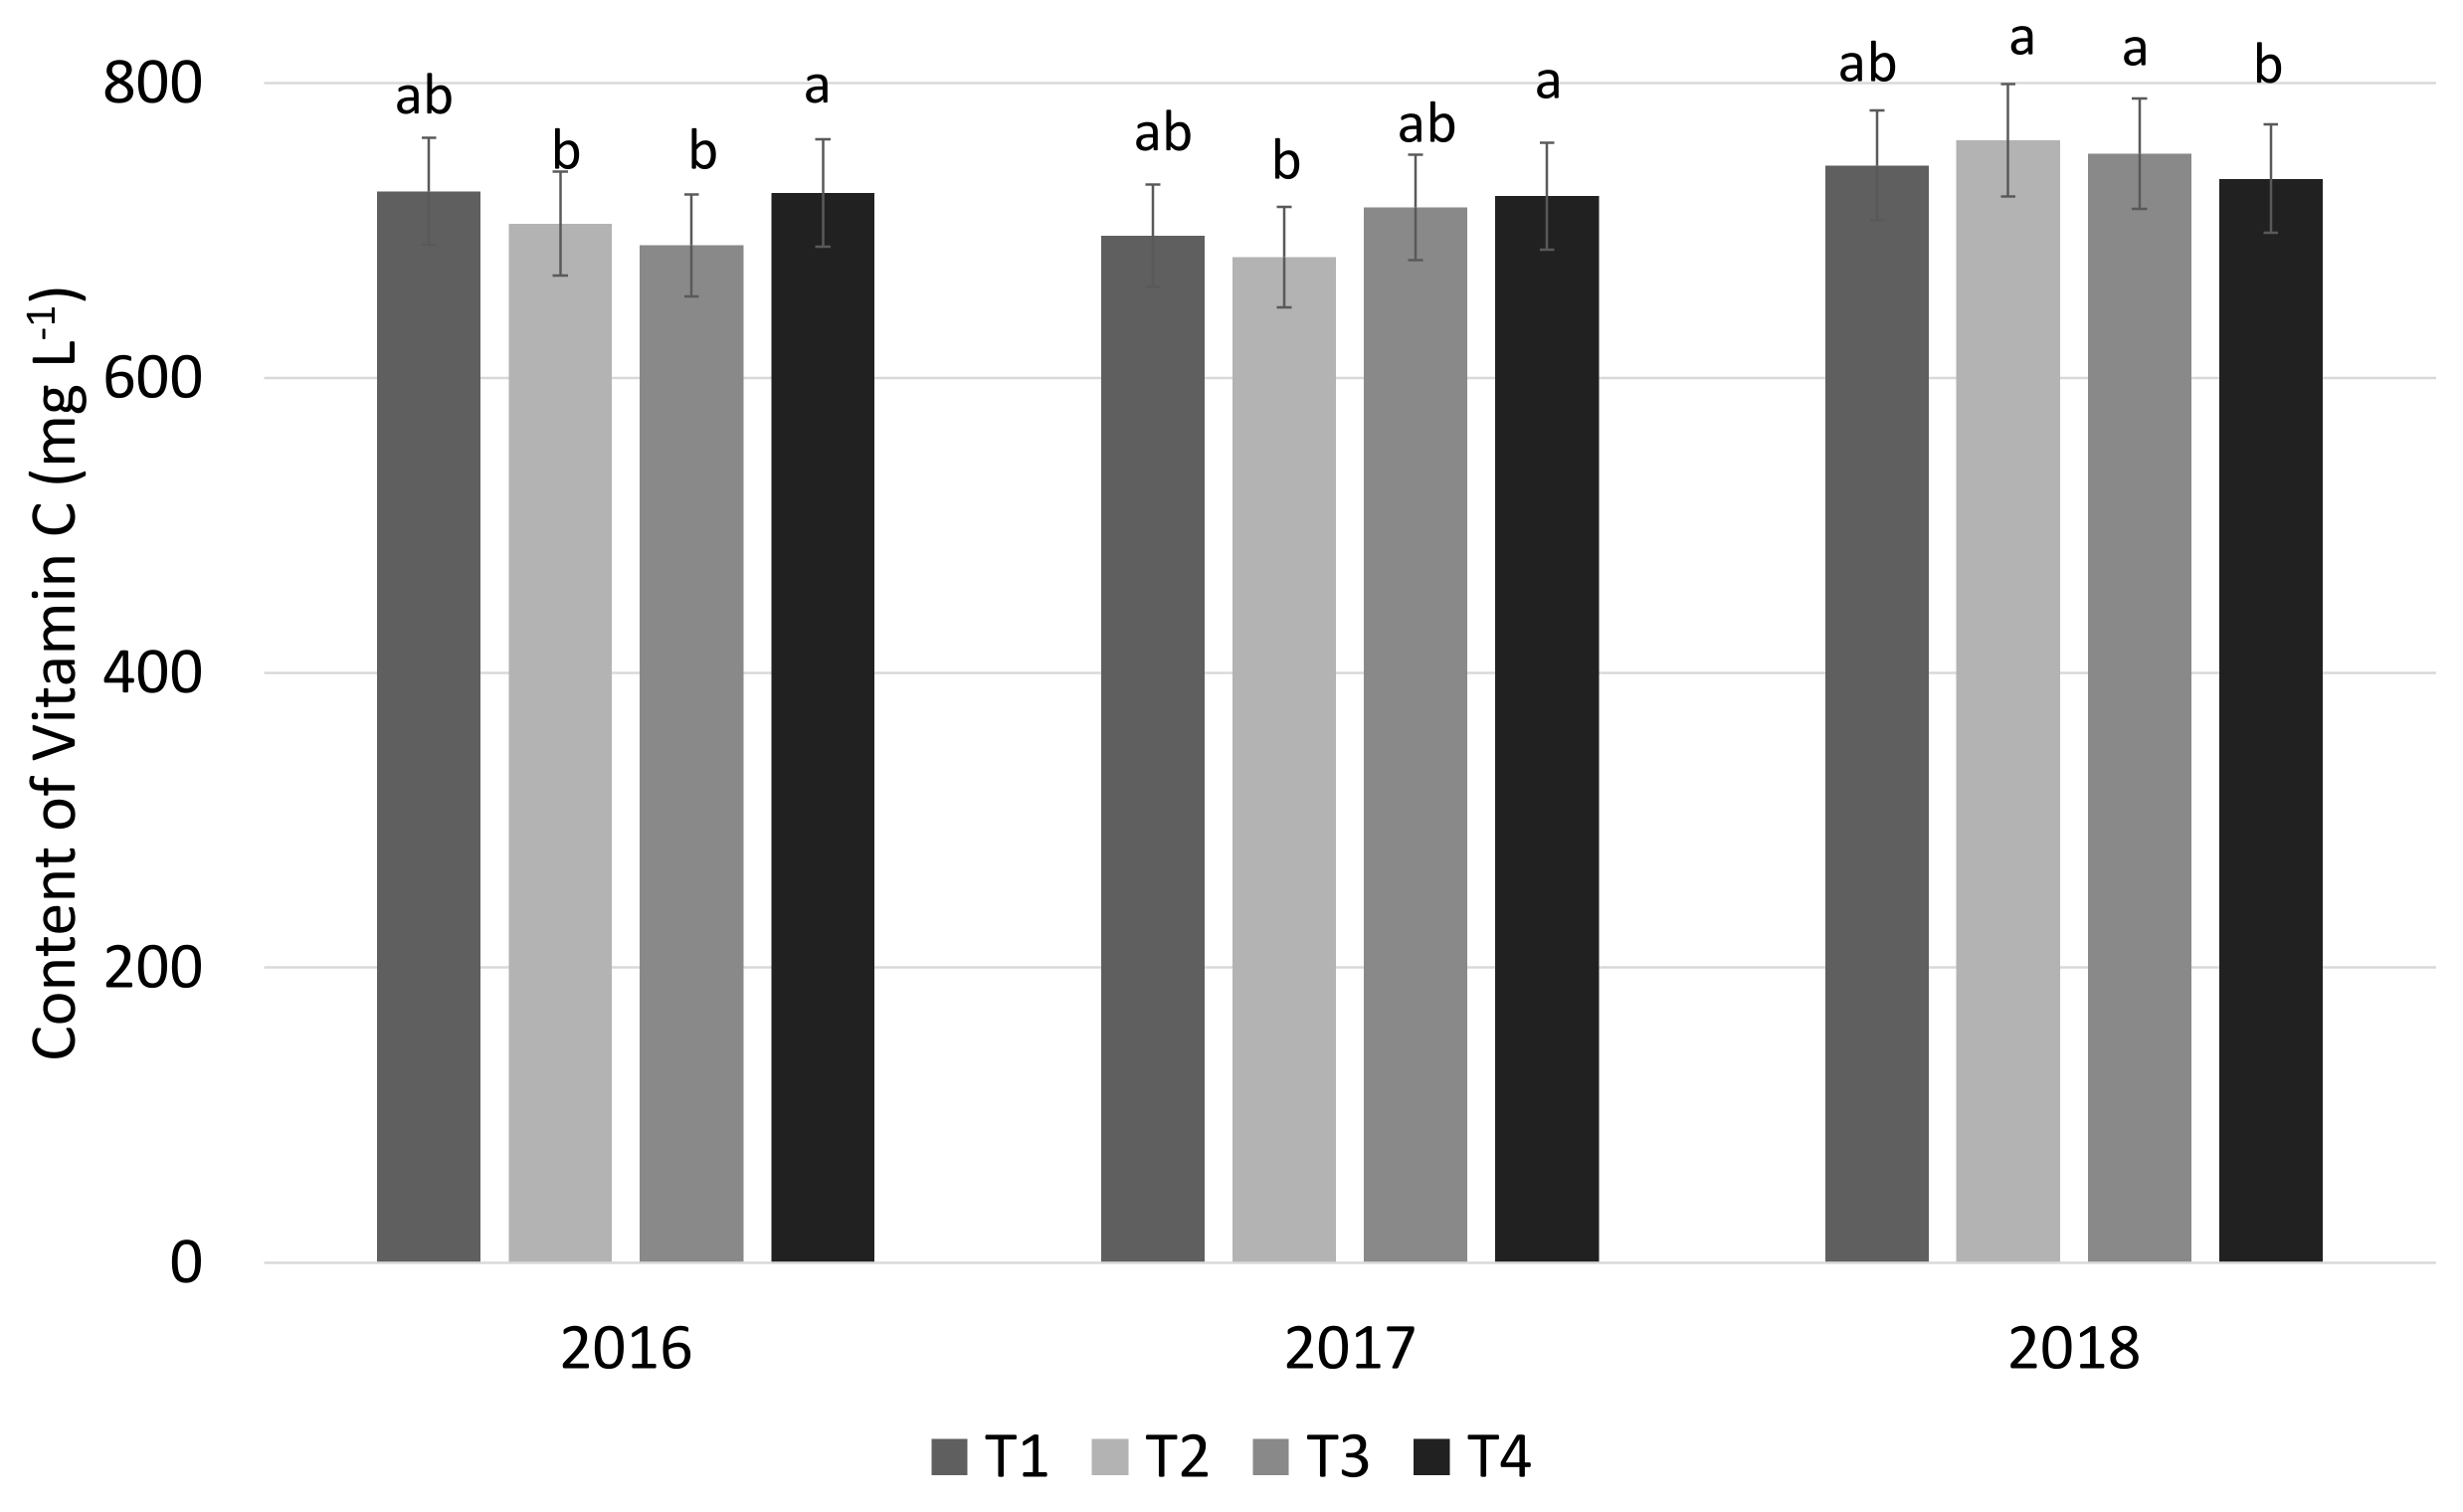
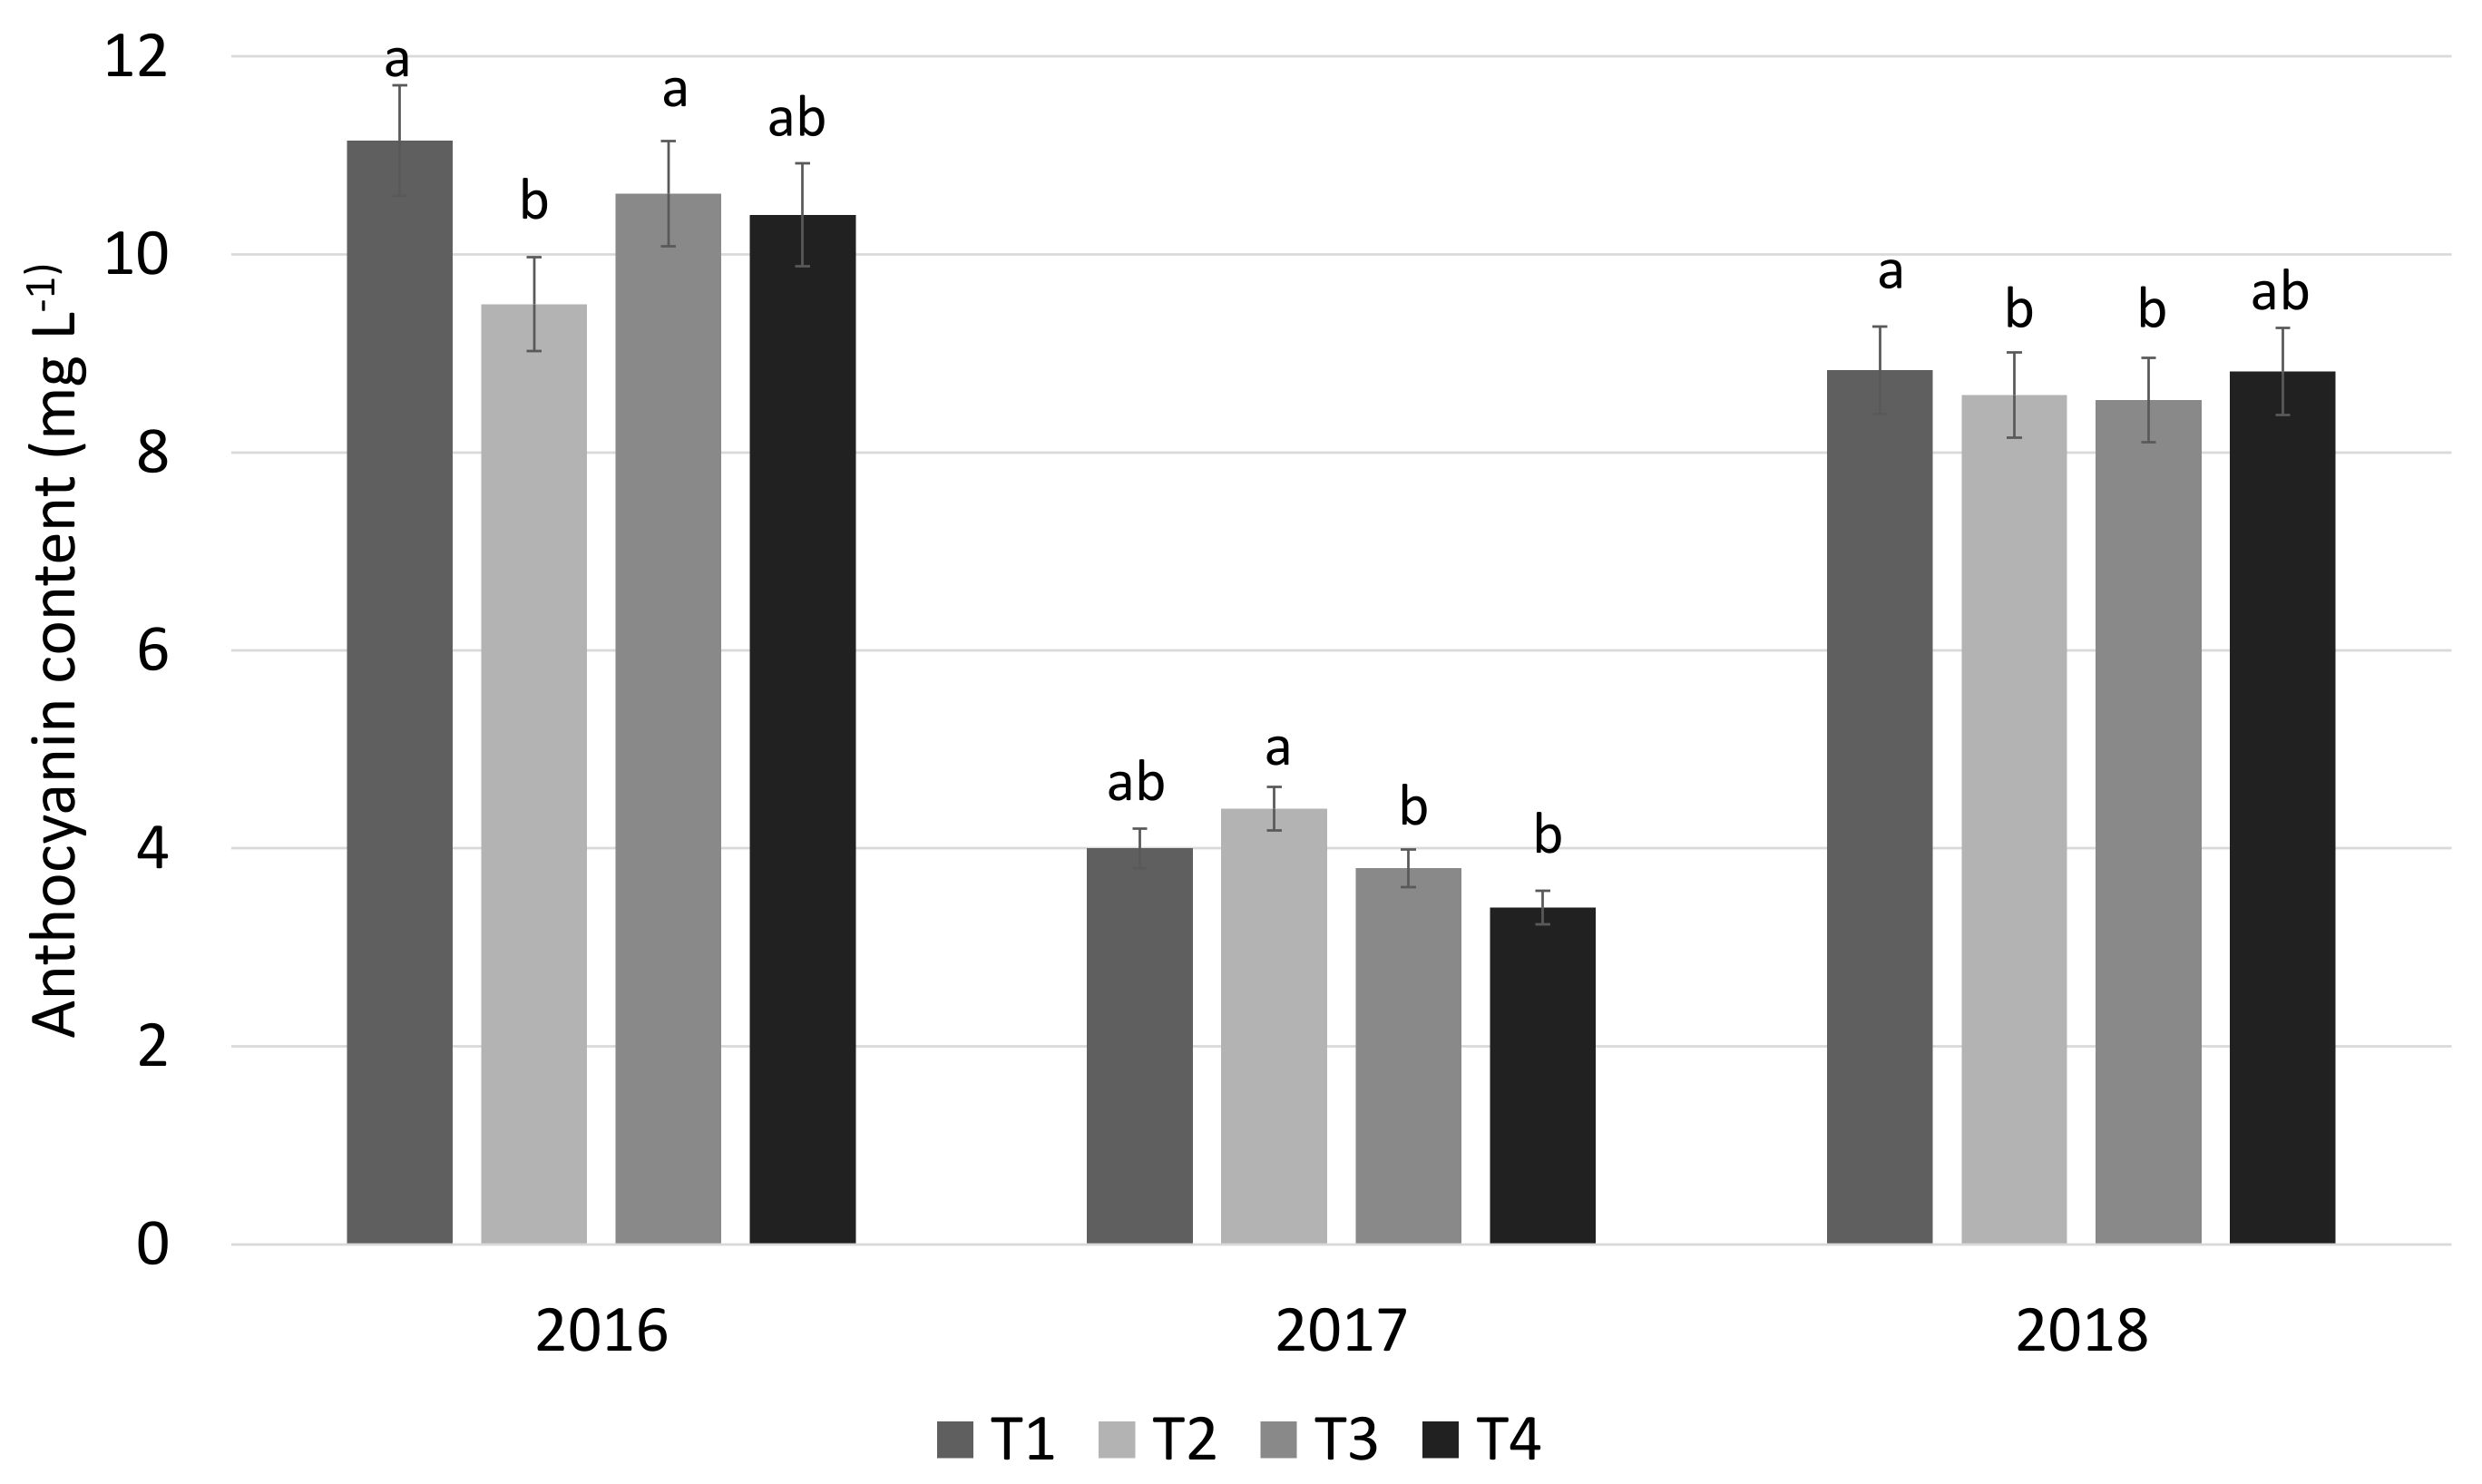
3.4. Plant Growth, Yield and Fruit Quality

The different treatments (Ti) significantly affected the vegetative growth of the ‘Tarocco comune’ trees (Figure 8). The canopy volume, pruned in 2015, showed a significant increase of 30% in 2018 in the T3 treatment, where the highest amount of CW was added. The smallest canopy volume was observed in 2018 in T1, even if no statistical differences with T2 and T4 were observed.
The cumulative yield reached the highest value in T3 (247 kg per tree), although no statistical difference with the control thesis (T1) was observed (Figure 9). The overall lowest production was recorded in T2 (167 kg per tree). The test trees showed an alternative bearing, as low production was found in the second year in all treatments.
A great variability in the fruit weight was observed between the monitoring period (Table 8); even if in the second and third years, T3 had the highest fruit weight (325 and 170 g, respectively). In 2016 and 2018, there were no statistical differences in juice content and SST between the treatments, while in 2017, the year of low production due to the alternative bearing, the fruit of T3 showed the highest values. The fruit of T1 (control) had the lowest SST (11.7 °Brix) in 2017. The acidity registered its lowest values in T1 in all the 3 years of trial, while the acidity content was always higher in T3.
No difference between the treatments was registered for the content of Vitamin C that was practically constant in the period of trial (Figure 10). The anthocyanin content showed no statistical difference between the treatments, although great variability in the 3 evaluated years was observed (Figure 11).

4. Discussion

The Mediterranean basin represents the main citrus-producing area with a significant number of by-products derived from industrial processes that can be seen as a valuable matrix and/or an important resource to improve the sustainability of the sector. Within a regenerative agriculture approach, the reuse of industrial citrus wastes (CWs) as natural organic soil fertilizers, could represent a sustainable strategy of recycling nutrients and reintegrating organic matter into the soil. The main objective of the present study was to promote the valorization of CWs as soil amendment.
The results of the present study highlighted the good soil-buffering ability, considering that the addition of such an acidic matrix, as the CW, only slightly influenced the pH of the soil (in July 2015), independent from the CW amount, reaching, in all samples, values of pH similar to the control only after 8 months from amendment (January 2016). Moreover, in the treatment with Ca(OH)2, the soil pH was found to be similar to that of the control, showing that the addition of Ca(OH)2 may completely eliminate the soil acidification due to the addition of a high acid matrix. Furthermore, the increased pH values, recorded in January 2017, were not related to the CW treatments, since the pH was always similar to that detected in the control soil (T1). According to [37], the addition of Ca(OH)2 promptly increased the EC of the soil at the beginning of the experimental period (July 2015) due to the additional calcium and hydroxyl ions. Later, at the end of the experimental period, EC sharply decreased due to the complete cation exchange of the soil, reaching similar values to those detected in the control soil. Taking into account the other soil parameters, results suggested that the CW application as amendment, positively affect soil chemical fertility by increasing the organic matter supplied to the soil (Figure 3A,B). Our results are in accordance with those reported by [38], which found an increase in the soil organic matter, as well as an improvement of microbial biomass activity and the stimulation of soil enzymatic activity. The increase in the soil organic matter was directly related to the amount of CW added, and led to a notable mineralization process characterized by different times dependent on the treatment. In particular, T2 induced the organic matter mineralization process in the short-term (June 2016) due to the addition of Ca(OH)2 to the CW. In fact, in June 2016 the treatment T2 induced a carbon content decrease along with an increase in EC, resulting in a reduction in the C/N ratio, confirming the stabilization of the mineralization process that occurred to reach an optimal value of C/N of about 10 [7]. In fact, the C/N ratio is closely related to the decomposition rate in the soil, and controls N availability in the complex soil–microorganisms–plant system [39]. A C/N ratio > 20 induces the soil microorganisms to scavenge the soil solution to obtain enough N, thus causing crop plants to suffer from N deficiency. On the contrary, a C/N ratio of around 10 results in an optimal condition in the soil that leads to an increase in N content available both to the plants and microorganisms [39,40]. In contrast, the CW amount added to the soil did not affect the mineralization process, which occurred in both T3 and T4 in a longer time than in T2.
The results obtained from the analysis of soil pore water in the T1 and T3 treatments confirmed the previous data retrieved about soil. According to the pH data recorded for the amended soils, the pH in the interstitial water decreased dramatically only in T3 in the July 2015 sampling. Similarly, the amended soils, where the maximum EC value was recorded in T3 in January 2017, the EC values in soil pore water increased in the same sampling and treatment.
In T1, the constant C/N ratio suggests a consolidate phase of decomposition of organic matter and nutrient immobilization [39]. The latter was confirmed by a rather constant level of COD, nitrate and phosphate in the soil pore water (Table 3). The release of organic substances in the soil pore water was evaluated by measuring the COD, which represents the oxygen required to oxidize soluble and particulate organic matter in the water [41]. Interestingly, it was observed that also in January 2017 the values of nitrate and phosphate in T1 were similar to the previous sampling (January 2016), although the mineral fertilization was performed in April 2016. Probably, mineral fertilizers were uptaken by plants or leached by seasonal rainfalls. As expected, the CW amendment (T3 treatment) increased the COD values in soil pore water at each sampling time in accordance with [42], which found that COD was positively correlated with increasing concentrations of organic compounds in pond waters. The pattern of nitrate content was similar to those of COD; however, at the first sampling (July 2015) the T3 nitrate value resulted very similar to T1. An explanation may be that in July 2015 the release of nitrogen into the soil pore water was only under organic form. Therefore, only an increase in COD was observed due to the organic matter not being completely mineralized. Notably, the highest amount of nitrate in the soil pore water in the treatment that corresponds to twice the maximum quantity admitted for sludge of agro-alimentary origin from the A.D. 234/2011 (T3), found in January 2016, was lower than the limit value (50 mg/L) imposed by the EU Nitrate Directive 91/676/CEE [42].
Considering the fluctuation of the microbial population in the soil, according to the specificity of the environment [43,44], this study focused on the evaluation of the effects of the CW amendment to a very limited portion of soil microbiota population, related to the fecal bacteria. In compliance with the Attachment 2 of the LD 75/2010, microbiological data attested the absence of Salmonella and E. coli, both in the CW and in the soil before the amendment. The presence of fecal coliforms was found at high density in all soil samples at any sampling period, confirming the role of the soil as a reservoir of this microbial group that can come from water, sediments and agricultural land, organic fertilizers, farms, feces of wild game, irrigation water and from natural precipitations [45]. Several studies highlighted that fecal coliforms can persist in soil for days and/or months, representing a problem for public health. Different authors reported that the persistence of fecal coliforms (included E. coli O157:H7) in soil is inversely related to the microbial diversity of the ecosystem [46,47,48,49]. Data related to the amended soil, at different sampling periods, highlighted the absence of Salmonella and E. coli in all samples, while fluctuations for the others microbial groups were observed, indicating that the addition of CW contributed to the increase in the cell densities of the tested microbial groups. Similar results have been observed by several authors who assessed the effect of cultivation management practices, such as working in steady conditions [50], soil fertilization and sterilization treatments on soil microbiota [51,52,53,54]. The presence of bacteria and spores, the activation and the promotion of metabolic strategies, aimed at exploiting specific environmental conditions make the soil microbial communities constantly evolving systems. It is known that one gram of soil can contain from 1 × 10³ to 1 × 10⁶ different species of bacteria able to promptly react to variation of micro-environmental parameters [51].
The reuse of industrial CW as natural soil biofertilizers could represent a sustainable approach of recycling nutrients and reintegrating organic matter to soil. The organic fertilization may improve chemical properties by increasing the cation exchange capacity, retaining water, increasing soil aeration, and promoting microbial activity [55,56]. Several studies highlighted the positive role of agro-food industrial residues for improving the characteristics of soil aeration and increasing the stable formation of aggregates [57]. In these processes, the microbial activity of the “masses” is improved by the nutrient content, which makes the degradation of organic components possible. Moreover, the taxonomic and functional metagenomic approach proved to be a powerful tool for a snapshot analysis of the microbiome active in pulp degradation, but also in other substrates and environments [58,59,60]. Metagenomic analysis reveals the presence of a bacterial “guild”, whose main exponent is Acetobacter okinawensis, belonging to Group I of Acetobacter genus [61]. Acetic bacteria are important to the industry for the production of vinegar, cellulose, gluconic acid and sorbose. In addition, in orange peels, the presence of the high concentration of carbohydrates, vitamins and nutrients triggers and promote the dynamics of microbial activities [38,54]. In detail, [38] showed that the incorporation of CW as soil amendments increased the soil organic matter despite the notable mineralization process occurring in the short term due to the citrus fruit industry residues. However, in the medium term of 2 years, the chemical-spectroscopic characterization of the organic compounds in the soil were shown to be very similar to the natural humic substances.
Considering the aspects related to the citrus productions, the growth and yield parameters investigated during the study were generally affected by several agronomic factors such as cultivar and rootstock, fertilizers, irrigation, etc. [62,63,64]. In this context, the use of organic fertilizers offers a great opportunity for the sustainable fruit production of sweet orange. The vegetative parameters of the ‘Tarocco comune’ trees were significantly affected by the different treatments. The canopy volume increased in foliage in the treatment with the highest quantity of citrus waste. The yield was variable from 2016 to 2018 for the alternate bearing; this phenomenon is mostly determined by the genotype, common also in other citrus species, such as mandarin hybrids [65]. The treatments significantly affected the cumulative yield, and the highest production was recorded in treatment T3, corresponding to the highest amount of citrus waste.
Among the Italian blood orange cultivars, Tarocco is one of the most important and it is consumed as a fresh fruit because of its easy peelability, good size and high levels of sugar/acid ratio [66]. Regarding the different qualitative parameters tested, fruit weight showed a variable trend from 2016 to 2018; high size fruit were recorded in 2017, while low values were observed in 2018. This variation is related to the alternate bearing that affected the trees [67]. However, in our study, the ‘Tarocco comune’ tree showed a higher value of fruit weight than previous researchers reported [68], and, in addition, its isodiametric shape in all treatment was confirmed [66]. Sugars and organic acids are important components of the chemical composition of blood oranges and their accumulation depends on cultivar, harvest time and environmental conditions [69]; in our study, the amount of sugar and organic acids confirmed what was reported in other lines of Tarocco [63,70]. The anthocyanin content was not affected by the treatment, but probably the environment and, specifically, the low temperatures influenced the accumulation of anthocyanins in the juice, as previously reported [71], determining the great difference between the studied years [72,73].

5. Conclusions

The present study confirms that the use of citrus waste (CW) as an organic fertilizer offers a great opportunity for the sustainable fruit production of sweet orange. The main findings of the research can be summarized as in follows:
1.
The organic fertilization improves soil chemical properties by increasing the cation exchange capacity, retaining water, increasing soil aeration and promoting microbial activity;
2.
CW could be an excellent substrate for the growth of acetic acid bacteria for the low-cost production of molecules of biotechnological industrial interest;
3.
The vegetative parameters of ‘Tarocco comune’ trees were significantly and positively affected by the addition of CW to the soil.
However, further study on the interaction of plants/soil microbiota is needed to understand the persistence mechanism of fecal coliforms and for a better understanding of the mechanisms involved in the longer persistence of human pathogens in soil.

Author Contributions

S.C., S.B., A.B., C.C., C.L.R., A.C., S.O.C., M.M. and M.R.; conceptualization; methodological setting; writing and funding acquisition; N.R., G.M., L.F., I.P. and G.L.M.: software analysis; in situ and laboratory analysis; data curation; review and editing. All authors have read and agreed to the published version of the manuscript.

Funding

The work was financed by the project “Miglioramento delle produzioni agroalimentari mediterranee in condizioni di carenza di risorse idriche—WATER4AGRIFOOD”. Cod. progetto: ARS01_00825; cod. CUP: B64I20000160005, “PON “RICERCA E INNOVAZIONE” 2014–2020, Azione II—Obiettivo Specifico 1b.

Informed Consent Statement

Not applicable.

Data Availability Statement

Not applicable.

Conflicts of Interest

The authors declare no conflict of interest.

References

  1. Stenmarck, Â.; Jensen, C.; Quested, T.; Moates, G. Estimates of European Food Waste Levels; IVL Swedish Environmental Research Institute: Stockholm, Sweden, 2016.
  2. Directive, E.C. Directive 2008/98/EC of the European Parliament and of the Council of 19 November 2008 on waste and repealing certain Directives. Off. J. Eur. Union 2008, 312, 22. [Google Scholar]
  3. Mourad, M. Recycling, recovering and preventing “food waste”: Competing solutions for food systems sustainability in the United States and France. J. Clean. Prod. 2016, 126, 461–477. [Google Scholar] [CrossRef] [Green Version]
  4. FAOSTAT. 2015. Available online: http://fao.org/faostat/es/#data/QC (accessed on 22 November 2022).
  5. USDA Foreign Agricultural Service. 2017. Available online: https://www.fas.usda.gov (accessed on 22 November 2022).
  6. ISMEA. Bilanci di Approvigionamento. 2013. Available online: https://www.ismea.it/flex/cm/pages/ServeBLOB.php/L/IT/IDPagina/5419 (accessed on 22 November 2022).
  7. Li, S.; Lo, C.Y.; Ho, C.T. Hydroxylated polymethoxyflavones and methylated flavonoids in sweet orange (Citrus sinensis) peel. J. Agric. Food Chem. 2006, 54, 4176–4185. [Google Scholar] [CrossRef]
  8. Mamma, D.; Christakopoulos, P. Biotransformation of citrus by-products into value added products. Waste Biomass Valorization 2014, 5, 529–549. [Google Scholar] [CrossRef]
  9. Koppar, A.; Pullammanappallil, P. Anaerobic digestion of peel waste and wastewater for on site energy generation in a citrus processing facility. Energy 2013, 60, 62–68. [Google Scholar] [CrossRef]
  10. Crawshaw, R. Co-product feeds: Animal feeds from the food and drinks industries R Crawshaw Nottingham University Press, Nottingham, 2001 pp 285, price £30.00 (paperback) ISBN 1-897676-35-2. J. Sci. Food Agric. 2003, 83, 362–362. [Google Scholar] [CrossRef]
  11. Canali, S.; Di Bartolomeo, E.; Trinchera, A.; Nisini, L.; Tittarelli, F.; Intrigliolo, F.; Roccuzzo, G.; Calabretta, M.L. Effect of different management strategies on soil quality of citrus orchards in Southern Italy. Soil Use Manag. 2009, 25, 34–42. [Google Scholar] [CrossRef] [Green Version]
  12. Satari, B.; Karimi, K. Citrus processing wastes: Environmental impacts, recent advances, and future perspectives in total valorization. Resour. Conserv. Recycl. 2018, 129, 153–167. [Google Scholar] [CrossRef]
  13. Ferrari, A.; Morone, P.; Tartiu, V.E. Tackling Uncertainty through Business Plan Analysis—A Case Study on Citrus Waste Valorisation in the South of Italy. Agriculture 2016, 6, 5. [Google Scholar] [CrossRef] [Green Version]
  14. Negro, V.; Ruggeri, B.; Fino, D.; Tonini, D. Life cycle assessment of orange peel waste management. Resour. Conserv. Recycl. 2017, 127, 148–158. [Google Scholar] [CrossRef]
  15. Ghani, W.; Alias, A.; Savory, R.; Cliffe, K. Co-combustion of agricultural residues with coal in a fluidised bed combustor. Waste Manag. 2009, 29, 767–773. [Google Scholar] [CrossRef]
  16. Lapuerta, M.; Hernández, J.J.; Pazo, A.; López, J. Gasification and co-gasification of biomass wastes: Effect of the biomass origin and the gasifier operating conditions. Fuel Process. Technol. 2008, 89, 828–837. [Google Scholar] [CrossRef]
  17. Barros-Rodríguez, A.; Rangseekaew, P.; Lasudee, K.; Pathom-Aree, W.; Manzanera, M. Regulatory risks associated with bacteria as biostimulants and biofertilizers in the frame of the European Regulation (EU) 2019/1009. Sci. Total Environ. 2020, 740, 140239. [Google Scholar] [CrossRef]
  18. Van Genuchten, M.T. A Closed-form Equation for Predicting the Hydraulic Conductivity of Unsaturated Soils. Soil Sci. Soc. Am. J. 1980, 44, 892–898. [Google Scholar] [CrossRef] [Green Version]
  19. Aiello, R.; Bagarello, V.; Barbagallo, S.; Consoli, S.; Di Prima, S.; Giordano, G.; Iovino, M. An assessment of the Beerkan method for determining the hydraulic properties of a sandy loam soil. Geoderma 2014, 235–236, 300–307. [Google Scholar] [CrossRef]
  20. Klute, A.; Dirksen, C. Hydraulic conductivity and diffusivity: Laboratory methods. Methods Soil Anal. Part 1 Phys. Mineral. Methods 1986, 5, 687–734. [Google Scholar]
  21. Soriano-Disla, J.M.; Gómez, I.; Navarro-Pedreño, J. The Influence of Soil Properties on the Water Pollution (Nitrate, Phosphate and COD) Following a Single Application of Sewage Sludge to 70 Contrasting Agricultural Soils. Water Air Soil Pollut. 2011, 223, 1783–1790. [Google Scholar] [CrossRef]
  22. APHA. Standard Methods for the Examination of Water and Wastewater; American Public Health Association: Washington, DC, USA, 1999.
  23. Díez, J.A. Consideraciones sobre la utilización de la técnica extractiva de Burriel-Hernando para la evaluación de fósforo asimilable en suelos. An. Edafol. Agrobiol. 1982, 41, 1345–1353. [Google Scholar]
  24. Sempere, A.; Oliver, J.; Ramos, C. Simple determination of nitrate in soils by second-derivative spectroscopy. Eur. J. Soil Sci. 1993, 44, 633–639. [Google Scholar] [CrossRef]
  25. Violante, P. Metodi di analisi chimica del suolo. In Collana di Metodi Analitici per l’Agricoltura; Francoangeli: Milano, Italy, 2000. [Google Scholar]
  26. Page, A.L.; Miller, R.H.; Keeney, D.R. Methods of Soil Analysis. Part 2. Chemical and Microbial Properties; American Society of Agronomy, Inc.: Madison, WI, USA, 1982.
  27. Springer, U.; Klee, J. Prüfung der Leistungsfähigkeit von einigen wichtigeren Verfahren zur Bestimmung des Kohlenstoffs mittels Chromschwefelsäure sowie Vorschlag einer neuen Schnellmethode. J. Plant Nutr. Soil Sci. 1954, 64, 1–26. [Google Scholar] [CrossRef]
  28. Bremner, J.M. Determination of nitrogen in soil by the Kjeldahl method. J. Agric. Sci. 1960, 55, 11–33. [Google Scholar] [CrossRef]
  29. Olsen, S.R. Estimation of Available Phosphorus in Soils by Extraction with Sodium Bicarbonate (No. 939); US Department of Agriculture: Washington, DC, USA, 1954.
  30. Agency for the Environment Protection and Technical Services. Microbiological Methods of Compost Analysis. Manuals and Guidelines 20/2003; APAT: Fort Meade, MD, USA, 2003.
  31. Agency for the Environment Protection and Technical Services; Istituto di Ricerca sulle Acque—Consiglio Nazionale delle Ricerche (IRSA-CNR). Metodi Analitici per le Acque. (Manuali e Linee Guida 29/2003); APAT: Fort Meade, MD, USA, 2003.
  32. Morse, J.G.; Robertson, C.A. Calculating Canopy Area of Citrus Trees and Surface Area of Fruits. Fla. Èntomol. 1987, 70, 168. [Google Scholar] [CrossRef]
  33. Rapisarda, P.; Fanella, F.; Maccarone, E. Reliability of Analytical Methods for Determining Anthocyanins in Blood Orange Juices. J. Agric. Food Chem. 2000, 48, 2249–2252. [Google Scholar] [CrossRef] [PubMed]
  34. Mapleson, D.; Accinelli, G.G.; Kettleborough, G.; Wright, J.; Clavijo, B.J. KAT: A K-mer analysis toolkit to quality control NGS datasets and genome assemblies. Bioinformatics 2016, 33, 574–576. [Google Scholar] [CrossRef] [PubMed] [Green Version]
  35. Sikaa, K.C.; Kefela, T.; Adoukonou-Sagbadja, H.; Ahoton, L.; Saidou, A.; Baba-Moussa, L.; Baptiste, L.J.; Kotconi, S.O.; Gachomo, E.W. A simple and efficient genomic DNA extraction protocol for large scale genetic analyses of plant biological systems. Plant Gene 2015, 1, 43–45. [Google Scholar] [CrossRef] [Green Version]
  36. XLSTAT by Addinsoft. Statistical and Data Analysis Solution; Version 2018.7.5; XLSTAT: Boston, MA, USA, 2018; Available online: https://www.xlstat.com (accessed on 22 November 2022).
  37. Al-Mukhtar, M.; Lasledj, A.; Alcover, J.-F. Behavior and mineralogy changes in lime-treated expansive soil at 20 °C. Appl. Clay Sci. 2010, 50, 191–198. [Google Scholar] [CrossRef]
  38. Meli, S.M.; Baglieri, A.; Porto, M.; Belligno, A.; Gennari, M. Chemical and Microbiological Aspects of Soil Amended with Citrus Pulp. J. Sustain. Agric. 2007, 30, 53–66. [Google Scholar] [CrossRef]
  39. Sommerfeldt, T.G.; Chang, C.; Entz, T. Long-term Annual Manure Applications Increase Soil Organic Matter and Nitrogen, and Decrease Carbon to Nitrogen Ratio. Soil Sci. Soc. Am. J. 1988, 52, 1668–1672. [Google Scholar] [CrossRef]
  40. Li, Y.; Wu, J.; Shen, J.; Liu, S.; Wang, C.; Chen, D.; Huang, T.; Zhang, J. Soil microbial C:N ratio is a robust indicator of soil productivity for paddy fields. Sci. Rep. 2016, 6, 35266. [Google Scholar] [CrossRef] [Green Version]
  41. Pontoni, L.; Van Hullebusch, E.D.; Pechaud, Y.; Fabbricino, M.; Esposito, G.; Pirozzi, F. Colloidal Mobilization and Fate of Trace Heavy Metals in Semi-Saturated Artificial Soil (OECD) Irrigated with Treated Wastewater. Sustainability 2016, 8, 1257. [Google Scholar] [CrossRef] [Green Version]
  42. Boyd, C.E. The Chemical Oxygen Demand of Waters and Biological Materials from Ponds. Trans. Am. Fish. Soc. 1973, 102, 606–611. [Google Scholar] [CrossRef]
  43. European Council. Official Journal of the European Communities (31-12-91). No L 375/1, EU Nitrate Directive 91/676/CEE; European Council: Brussels, Belgium, 1991; p. 8. Available online: http://eur-lex.europa.eu/legal-content/EN/TXT/PDF/?uri=CELEX:31991L0676&from=EN (accessed on 3 May 2018).
  44. Nannipieri, P.; Ascher, J.; Ceccherini, M.; Landi, L.; Pietramellara, G.; Renella, G. Microbial diversity and soil functions. Eur. J. Soil Sci. 2003, 54, 655–670. [Google Scholar] [CrossRef]
  45. Baveye, P.C.; Berthelin, J.; Munch, J.-C. Too much or not enough: Reflection on two contrasting perspectives on soil biodiversity. Soil Biol. Biochem. 2016, 103, 320–326. [Google Scholar] [CrossRef]
  46. Cooley, M.; Carychao, D.; Crawford-Miksza, L.; Jay, M.T.; Myers, C.; Rose, C.; Keys, C.; Farrar, J.; Mandrell, R.E. Incidence and tracking of Escherichia coli O157: H7 in a major produce production region in California. PLoS ONE 2007, 2, e1159. [Google Scholar] [CrossRef]
  47. Semenov, A.V.; Franz, E.; Van Overbeek, L.; Termorshuizen, A.J.; Van Bruggen, A.H. Estimating the stability of Escherichia coli O157: H7 survival in manure-amended soils with different management histories. Environ. Microbiol. 2008, 10, 1450–1459. [Google Scholar] [CrossRef]
  48. Ibekwe, A.M.; Ma, J. Effects of fumigants on microbial diversity and persistence of E. coli O15:H7 in contrasting soil microcosms. Sci. Total. Environ. 2011, 409, 3740–3748. [Google Scholar] [CrossRef] [PubMed]
  49. Van Elsas, J.D.; Semenov, A.V.; Costa, R.; Trevors, J.T. Survival of Escherichia coli in the environment: Fundamental and public health aspects. ISME J. 2010, 5, 173–183. [Google Scholar] [CrossRef] [Green Version]
  50. Ma, J.; Brookes, J.D.; Qin, B.; Paerl, H.W.; Gao, G.; Wu, P.; Zhang, W.; Deng, J.; Zhu, G.; Zhang, Y.; et al. Environmental factors controlling colony formation in blooms of the cyanobacteria Microcystis spp. in Lake Taihu, China. Harmful Algae 2013, 31, 136–142. [Google Scholar] [CrossRef] [PubMed]
  51. Shi, Y.; Lalande, R.; Hamel, C.; Ziadi, N.; Gagnon, B.; Hu, Z. Seasonal variation of microbial biomass, activity, and community structure in soil under different tillage and phosphorus management practices. Biol. Fertil. Soils 2013, 49, 803–818. [Google Scholar] [CrossRef]
  52. Fierer, N.; Lauber, C.L.; Ramirez, K.S.; Zaneveld, J.; Bradford, M.A.; Knight, R. Comparative metagenomic, phylogenetic and physiological analyses of soil microbial communities across nitrogen gradients. ISME J. 2012, 6, 1007–1017. [Google Scholar] [CrossRef] [Green Version]
  53. Fierer, N.; Bradford, M.A.; Jackson, R.B. Toward an ecological classification of soil bacteria. Ecology 2007, 88, 1354–1364. [Google Scholar] [CrossRef]
  54. Wei, M.; Hu, G.; Wang, H.; Bai, E.; Lou, Y.; Zhang, A.; Zhuge, Y. 35 years of manure and chemical fertilizer application alters soil microbial community composition in a Fluvo-aquic soil in Northern China. Eur. J. Soil Biol. 2017, 82, 27–34. [Google Scholar] [CrossRef]
  55. Wei, W.; Isobe, K.; Nishizawa, T.; Zhu, L.; Shiratori, Y.; Ohte, N.; Koba, K.; Otsuka, S.; Senoo, K. Higher diversity and abundance of denitrifying microorganisms in environments than considered previously. ISME J. 2015, 9, 1954–1965. [Google Scholar] [CrossRef] [PubMed] [Green Version]
  56. Aiello, R.; Cirelli, G.L.; Consoli, S.; Licciardello, F.; Toscano, A. Risk assessment of treated municipal wastewater reuse in Sicily. Water Sci. Technol. 2013, 67, 89–98. [Google Scholar] [CrossRef]
  57. Tripodo, M.M.; Lanuzza, F.; Micali, G.; Coppolino, R.; Nucita, F. Citrus waste recovery: A new environmentally friendly procedure to obtain animal feed. Bioresour. Technol. 2004, 91, 111–115. [Google Scholar] [CrossRef]
  58. Zappia, R.; Branca, V.; Gullo, G. Il pastazzo di agrumi come fertilizzante o ammendante del terreno su piante di navelina innestate su citrumelo. In Valorizzazione di Acque Reflue e Sottoprodotti Dell’industria Agrumaria e Olearia; Laruffa Editore: Reggio Calabria, Italy, 2004. [Google Scholar]
  59. Rashid, M.I.; Mujawar, L.H.; Shahzad, T.; Almeelbi, T.; Ismail, I.M.; Oves, M. Bacteria and fungi can contribute to nutrients bioavailability and aggregate formation in degraded soils. Microbiol. Res. 2016, 183, 26–41. [Google Scholar] [CrossRef]
  60. Abdelfattah, A.; Wisniewski, M.; Nicosia, M.G.L.D.; Cacciola, S.O.; Schena, L. Metagenomic Analysis of Fungal Diversity on Strawberry Plants and the Effect of Management Practices on the Fungal Community Structure of Aerial Organs. PLoS ONE 2016, 11, e0160470. [Google Scholar] [CrossRef] [PubMed] [Green Version]
  61. Abdelfattah, A.; Malacrinò, A.; Wisniewski, M.; Cacciola, S.O.; Schena, L. Metabarcoding: A powerful tool to investigate microbial communities and shape future plant protection strategies. Biol. Control. 2018, 120, 1–10. [Google Scholar] [CrossRef]
  62. La Spada, F.; Cock, P.J.A.; Randall, E.; Pane, A.; Cooke, D.E.L.; Cacciola, S.O. DNA Metabarcoding and Isolation by Baiting Complement Each Other in Revealing Phytophthora Diversity in Anthropized and Natural Ecosystems. J. Fungi 2022, 8, 330. [Google Scholar] [CrossRef]
  63. Lino, T.; Suzuki, R.; Kosako, Y.; Ohkuma, M.; Komagata, K.; Uchimura, T. Acetobacter okinawensis sp. nov., Acetobacter papayae sp. nov., and Acetobacter persicus sp. nov.; novel acetic acid bacteria isolated from stems of sugarcane, fruits, and a flower in Japan. J. Gen. Appl. Microbiol. 2012, 58, 235–243. [Google Scholar] [CrossRef] [Green Version]
  64. Spann, T.M.; Tsagkarakis, A.E.; Syvertsen, J.P. Managing citrus tree growth with hedging and plant growth regulators: Strategies for reducing psyllid feeding and huanglongbing infection. Proc. Fla. State Hortic. Soc. 2009, 122, 161–165. [Google Scholar]
  65. Continella, A.; Pannitteri, C.; La Malfa, S.; Legua, P.; Distefano, G.; Nicolosi, E.; Gentile, A. Influence of different rootstocks on yield precocity and fruit quality of ‘Tarocco Scirè’pigmented sweet orange. Sci. Hortic. 2018, 230, 62–67. [Google Scholar] [CrossRef]
  66. Hameed, A.; Fatma, S.; Wattoo, J.I.; Yaseen, M.; Ahmad, S. Accumulative effects of humic acid and multinutrient foliar fertilizers on the vegetative and reproductive attributes of citrus (Citrus reticulata cv. kinnow mandarin). J. Plant Nutr. 2018, 41, 2495–2506. [Google Scholar] [CrossRef]
  67. Caruso, M.; Continella, A.; Modica, G.; Pannitteri, C.; Russo, R.; Salonia, F.; Arlotta, C.; Gentile, A.; Russo, G. Rootstocks Influence Yield Precocity, Productivity, and Pre-Harvest Fruit Drop of Mandared Pigmented Mandarin. Agronomy 2020, 10, 1305. [Google Scholar] [CrossRef]
  68. Legua, P.; Modica, G.; Porras, I.; Conesa, A.; Continella, A. Bioactive compounds, antioxidant activity and fruit quality evaluation of eleven blood orange cultivars. J. Sci. Food Agric. 2022, 102, 2960–2971. [Google Scholar] [CrossRef]
  69. Legua, P.; Martinez-Cunenca, M.R.; Bellver, R.; Forner-Giner, M.Á. Rootstock’s and scion’s impact on lemon quality in southeast Spain. Int. Agrophys. 2018, 32, 325–333. [Google Scholar] [CrossRef]
  70. Rapisarda, P.; Russo, G. Fruit quality of five Tarocco selections grown in Italy. In Proceedings of the International Society of Citriculture 9th Congress, Orlando, FL, USA, 3–7 December 2000; pp. 3–7. [Google Scholar]
  71. Lana, G.; Modica, G.; Casas, G.L.; Siracusa, L.; La Malfa, S.; Gentile, A.; Sicilia, A.; Distefano, G.; Continella, A. Molecular Insights into the Effects of Rootstocks on Maturation of Blood Oranges. Horticulturae 2021, 7, 468. [Google Scholar] [CrossRef]
  72. Caruso, M.; Ferlito, F.; Licciardello, C.; Allegra, M.; Strano, M.C.; Di Silvestro, S.; Russo, M.P.; Paolo, D.P.; Caruso, P.; Casas, G.L.; et al. Pomological diversity of the Italian blood orange germplasm. Sci. Hortic. 2016, 213, 331–339. [Google Scholar] [CrossRef]
  73. Modica, G.; Pannitteri, C.; Di Guardo, M.; La Malfa, S.; Gentile, A.; Ruberto, G.; Pulvirenti, L.; Parafati, L.; Continella, A.; Siracusa, L. Influence of rootstock genotype on individual metabolic responses and antioxidant potential of blood orange cv. Tarocco Scirè. J. Food Compos. Anal. 2022, 105, 104246. [Google Scholar] [CrossRef]
Figure 1. Amendment process of CW. (a) 30 tons of CW were transported to the experimental site and laid down for about 1 month on a polyethylene tarp. (b) Clods of CW were obtained and properly laid down around the tree trunks (about 0.5 m from trunk).
Sustainability 15 02482 g001
Figure 2. Characterization of soil samples for pH (A) and electrical conductivity (EC) (B). Error bars indicate standard deviation. The values are means of data from three measurements. Values of the same soil-sampling date followed by different letters are significantly different (p < 0.05).
Sustainability 15 02482 g002
Figure 3. Characterization of soil samples for organic carbon (OC) (A), organic matter (OM) (B), total nitrogen (N) (C), and available phosphorus (P) (D). Error bars indicate standard deviation. The values are means of data from three determinations. Values of the same soil sampling date followed by different letters are significantly different (p < 0.05).
Sustainability 15 02482 g003
Figure 4. Microbiological analyses (as Log CFU/g) of CW and soil samples before the amendment process.
Sustainability 15 02482 g004
Figure 5. Microbial results, in Log CFU/100 mL, of soil pore water at 4 (I sampling) and 5 (II sampling) months after treatment. Different letters indicate statistical differences among the columns of the same microbial group (significance at p ≤ 0.01).
Sustainability 15 02482 g005
Figure 6. Correlation matrix between microbiological and physico-chemical parameters.
Sustainability 15 02482 g006
Figure 7. Schematization of the functions found in the sample related to molecular processes. The size of the boxes represents how unique the function in question is (the larger the square the less frequent this function is within the Uniprot protein dataset). The color correlates with the frequency of the function in question with respect to the gene ontology (GO) terms found within the sample (red squares have a higher frequency than blue ones).
Sustainability 15 02482 g007
Figure 8. Canopy volume recorded for ‘Tarocco comune’ trees of the different treatments from 2015 to 2018; Mean values with different letters within the same year are statistically different (p < 0.05).
Sustainability 15 02482 g008
Figure 9. Cumulative yield recorded on ‘Tarocco comune’ trees of the different treatments from 2016 to 2018; Mean values with different letters within the same year are statistically different (p < 0.05).
Sustainability 15 02482 g009
Figure 10. Content of Vitamin C (mg L−1) recorded in fruit juice of ‘Tarocco comune’ sweet orange in 2016, 2017 and 2018 productions of the different treatments; Mean values with different letters within the same column and year are statistically different (p < 0.05).
Sustainability 15 02482 g010
Figure 11. Content of anthocyanins (mg L−1) recorded in fruit juice of ‘Tarocco comune’ sweet orange in 2016, 2017 and 2018 productions of the different treatments; Mean values with different letters within the same year are statistically different (p < 0.05).
Sustainability 15 02482 g011
Table 1. Physico-chemical properties of the tested soil.
TreatmentsClay
(%)
Loam
(%)
Sandy
(%)
pHElectrical Conductivity
(mS/cm)
Organic Carbon (%)Total Nitrogen (%)C/NCaCo3 (%)Cation Exchange Capacity
(cmols(+)/kg)
Available P (‰)
T113.518.368.27.20.132.30.211.28.020.72.6
T210.319.070.77.10.142.020.210.49.522.12.6
T318.521.260.37.10.142.30.211.17.023.52.3
T421.121.857.17.10.152.30.211.03.525.62.8
Table 2. Mean chemical composition of CW during the experiment. Values followed by different letters are significantly different (p < 0.05).
pHCE (mS/cm)Humidity (%)Ashes (%)C (%)N (%)P (%)
April 20152.93 a1.33 a83.7 a4.5 b41.8 a0.97 a0.26 a
May 20152.87 a1.11 a61.1 b5.3 a41.6 a1.07 a0.24 a
Table 3. Chemical composition of soil pore water in July 2015, January 2016 and January 2017; Values of followed by different letters are significantly different (p < 0.05).
SamplingTreatmentpHE.C.CODNitratePhosphate
(mS/cm)(mg O2/L)(mg/L)(mg/L)
Jul 2015T17.2 ± 0.1 a1.24 ± 0.15 b12.4 ± 2.2 b4.8 ± 0.1 c4.5 ± 0.5 b
T33.7 ± 0.2 b1.41 ± 0.17 b24.1 ± 1.2 a4.4 ± 0.9 c4.4 ± 0.3 b
Jan 2016T17.6 ± 0.2 a1.83 ± 0.11 b14.2 ± 0.9 b5.4 ± 1.1 c4.5 ± 0.6 b
T37.4 ± 0.1 a1.86 ± 0.20 b24.2 ± 1.7 a32.0 ± 4.1 a6.1 ± 0.6 a
Jan 2017T18.3 ± 0.1 a1.55 ± 0.13 b15.0 ± 1.3 b6.5 ± 0.3 c3.6 ± 0.8 b
T38.4 ± 0.1 a3.32 ± 0.18 a28.5 ± 3.7 a10.4 ± 1.3 b4.7 ± 0.3 b
Table 4. Hydraulic conductivity at saturation (ks) of the soil for the different treatments; Values of followed by different letters are significantly different (p < 0.05).
TreatmentSoil TextureJanuary 2015
ks
January 2016
ks
January 2017
ks
July 2017
ks
(m d−1)(m d−1)(m d−1)(m d−1)
T1Sandy-Loam3.5 × 10−2(±1.8 × 10−49.9 × 10−3(±1.7 × 10⁻⁴)6.9 × 10⁻³(±1.1 × 10⁻⁵)8.1 × 10⁻³(±0.8 × 10⁻⁴)
T2Sandy-Loam9.7 × 10−2 (±9.1 × 10⁻⁴)1.1 × 10⁻⁴ (±1.5 × 10⁻⁴)1.0 × 10⁻⁴(±0.9 × 10⁻⁵)1.6 × 10⁻⁴(±1.1 × 10⁻⁵)
T3Sandy-Loam9.3 × 10−3(±8.8 × 10⁻⁴)3.9 × 10⁻⁴ (±1.0 × 10⁻⁴)2.2 × 10⁻⁴(±1.5 × 10⁻⁵)3.0 × 10⁻⁴(±1.5 × 10⁻⁵)
T4Sandy-Clay-Loam2.9 × 10−3(±6.5 × 10⁻⁴)4.9 × 10⁻⁵ (±1.2 × 10⁻⁴)2.2 × 10⁻⁵(±0.8 × 10⁻⁵)3.7 × 10⁻⁵(±1.2 × 10⁻⁵)
Average 3.6 × 10−22.6 × 10−31.8 × 10−32.15 × 10−3
Table 5. The microbiological results of the amended soil at the different sampling periods. Data are expressed as mean (Log CFU g−1) + SD. Mean values with different letters within the same column are statistically different. n.s.: not significant; ** Significance at p ≤ 0.01; *** Significance at p ≤ 0.001.
Soil SamplesEnterobacteriaceaeFecal ColiformsEnterococcus spp.
Soil after 2 months
T1 (control)4.8 ± 0.05 b3.0 ±0.55<1 d
T2 7.6 ± 0.01 a4.8 ±0.057.2 ± 0.34 a
T37.5 ± 0.23 a4.2 ±0.183.5 ± 0.13 c
T4 7.5 ±0.21 a3.6 ±0.936.5 ± 0.06 b
***n.s.***
Soil after 6 months
T1 (control)5.7 ± 0.12 b4.1 ± 0.72 d3.0 ± 0.12 c
T2 6.5 ± 0.04 ab5.7 ± 0.03 b4.7 ± 0.03 b
T36.8 ± 0.08 a6.1 ± 0.03 a5.4 ± 0.07 a
T4 6.1 ± 0.08 ab5.3 ± 0.01 c5.2 ± 0.12 a
*********
Soil after 12 months
T1 (control)5.6 ± 0.333.7 ± 0.71 b<1 b
T2 6.1 ± 0.605.8 ± 0.60 a<1 b
T36.3 ± 0.106.5 ± 0.11 a3.6 ± 0.35 a
T4 5.7 ± 0.073.2 ± 0.45 b2.5 ± 0.60 a
n.s.****
Soil after 18 months
T1 (control)4.9 ± 0.613.6 ± 0.623.0 ± 0.12
T2 6.0 ± 0.225.0 ± 0.423.2 ± 0.80
T35.2 ± 0.355.0 ± 0.352.3 ± 0.35
T4 4.5 ± 0.804.0 ± 0.692.6 ± 0.30
n.s.n.s.n.s.
Soil after 24 months
T1 (control)6.4 ± 0.234.5 ± 0.42 b4.7 ± 0.42 b
T2 6.2 ± 0.124.6 ± 0.34 ab3.2 ± 0.17 c
T36.1 ± 0.145.1 ± 0.16 a4.0 ± 0.05 b
T4 6.7 ± 0.225.6 ± 0.06 a5.4 ± 0.20 a
n.s.*****
Table 6. Taxonomic classification for genus and their relative abundances (expressed as %) in the samples.
PercentageName
73.8033Unknown
16.4775Acetobacter
4.69746Gluconobacter
2.41539Komagataeibacter
1.26384Lactobacillus
0.568008Gluconacetobacter
0.282513Zymomonas
0.137505Sphingomonas
0.135731Saccharomyces
0.115508Rhizobium
0.10326Mycobacterium
Table 7. Taxonomic classification for species and their relative abundances (expressed as %) in the samples.
PercentageName
83.3332Unknown
11.9573Acetobacter pasteurianus
2.28234Gluconobacter oxydans
0.6705Komagataeibacter medellinensis
0.657145Lactobacillus brevis
0.441383Komagataeibacter xylinus
0.222455Gluconacetobacter diazotrophicus
0.188566Limosilactobacillus fermentum
0.128615Saccharomyces cerevisiae
0.118458Zymomonas mobilis
Table 8. Physico-chemical characteristics of ‘Tarocco comune’ sweet oranges in the different treatments. Mean values with different letters within the same column and year are statistically different (p < 0.05).
SamplingTreatmentFruitweight (g)Juice (%)SST (°Brix)TA (gL−1)
2016T1263 ± 16.3 a54.6 ± 0.310.4 ± 0.7 a10.8 ± 0.2 b
T2171 ± 23.9 c56.5 ± 0.810.4 ± 0.5 a10.5 ± 0.5 b
T3210 ± 18.2 c50 ± 0.99.9 ± 0.3 b12.2 ± 0.1 a
T4210 ± 21.1 b54.2 ± 0.410.5 ± 0.2 a11.3 ± 0.6 a
2017T1263 ± 42.9 b51.4 ± 3.9 a11.7 ± 0.7 b9.6 ± 0.1 c
T2256 ± 21.1 b48.2 ± 3.6 b12.4 ± 0.2 a11.9 ± 0.1 b
T3325 ± 0.1 a57.3 ± 0.2 a11.9 ± 0.1 b12.5 ± 0.1 a
T4315 ± 29.1 ab54.3 ± 3.7 ab12.0 ± 0.8 a11.2 ± 0.1 b
2018T1149 ± 15.9 c49.4 ± 5.4 a13.5 ± 2.017.0 ± 1.1 b
T2158 ± 17.9 bc49.6 ± 3.8 a13.3 ± 0.518.4 ± 1.9 a
T3170 ± 24.0 a45.2 ± 17.9 b13.1 ± 0.318.1 ± 1.8 a
T4161 ± 23.4 b48.0 ± 4.5 a13.3 ± 0.718.2 ± 0.9 a
Disclaimer/Publisher’s Note: The statements, opinions and data contained in all publications are solely those of the individual author(s) and contributor(s) and not of MDPI and/or the editor(s). MDPI and/or the editor(s) disclaim responsibility for any injury to people or property resulting from any ideas, methods, instructions or products referred to in the content.

