Article

A Study on the Economic Resilience of Industrial Parks

Department of Land Economics, National Chengchi University, Taipei City 11605, Taiwan
*
Author to whom correspondence should be addressed.
Sustainability 2023, 15(3), 2462; https://doi.org/10.3390/su15032462
Submission received: 19 December 2022 / Revised: 10 January 2023 / Accepted: 22 January 2023 / Published: 30 January 2023

Abstract

:
The development of globalization has brought about obvious differences in the resilience of different regions against economic crises. Regional economic resilience refers to the ability of a region’s economy to resist shocks when faced with external disturbances or to break away from its existing growth model in favor of a better path, Resilience represents the region’s adaptability, innovation, and sustainability. This paper describes an empirical analysis on the 60 designated industrial park developments under the Industrial Development Bureau in Taiwan. Over a period of short-term disturbances, the industrial parks are analyzed from four aspects: industrial structure, regional development foundation, enterprise competitiveness and labor conditions, and government governance and policy systems. Through discriminant analysis, we analyze the characteristics of factors that mainly affect the economic resilience of 60 industrial parks faced with shocks such as the subprime mortgage crisis in 2008, the five-day work week in 2016, and the COVID-19 outbreak in 2019. We found that industrial structure, specifically diversified industrial structure, is the major factor behind enhanced regional economic resilience. If the scale of specialized industries is large enough, they can form sufficient capacity to resist external changes and also be economically resilient. Under the negative impact, the amount of innovation can be an important part of post-disaster recovery, and stable innovation input will become a main factor for the sustainable development of industrial parks. The pressure of the uncertainty of global economic development and the transformation and upgrading of the domestic economy underscore that enterprises urgently need automation and digital transformation to enhance their competitiveness. In order to enhance economic resilience to adapt to changes in the overall environment, the industrial parks need to adjust adaptively, improve their industrial structure, and promote innovation, hoping that the regional economy will move towards a more stable and sustainable development path.

1. Introduction

Globalization has made countries and regions more interconnected. However, external risks also increase when negative external interference impacts or even permanently damages regional economies. The 2008 subprime crisis impacted the world’s economy and brought about more far-reaching political, economic, and social problems. However, different regions still have significant resilience differences in their capacities to recover from economic crises.
This study empirically analyzed 62 industrial parks under the jurisdiction of the Taiwan government based on four major aspects: industrial structure, regional development foundation, enterprise competitiveness and labor force situation, and government governance and policy system, examining the resilience of Taiwan’s industrial parks to economic shocks and disasters and proposed a comprehensive assessment framework for economic and disaster resilience. The objectives and steps of the study are shown below:
  • Economic and disaster resilience indicators were selected to establish an assessment framework.
  • Based on the evaluation framework of economic resilience, this study evaluates the industrial parks and analyzes the main factors affecting economic resilience.
  • This study combines the economic and disaster resilience indicators to comprehensively assess and explore the relationship between the two indicators.

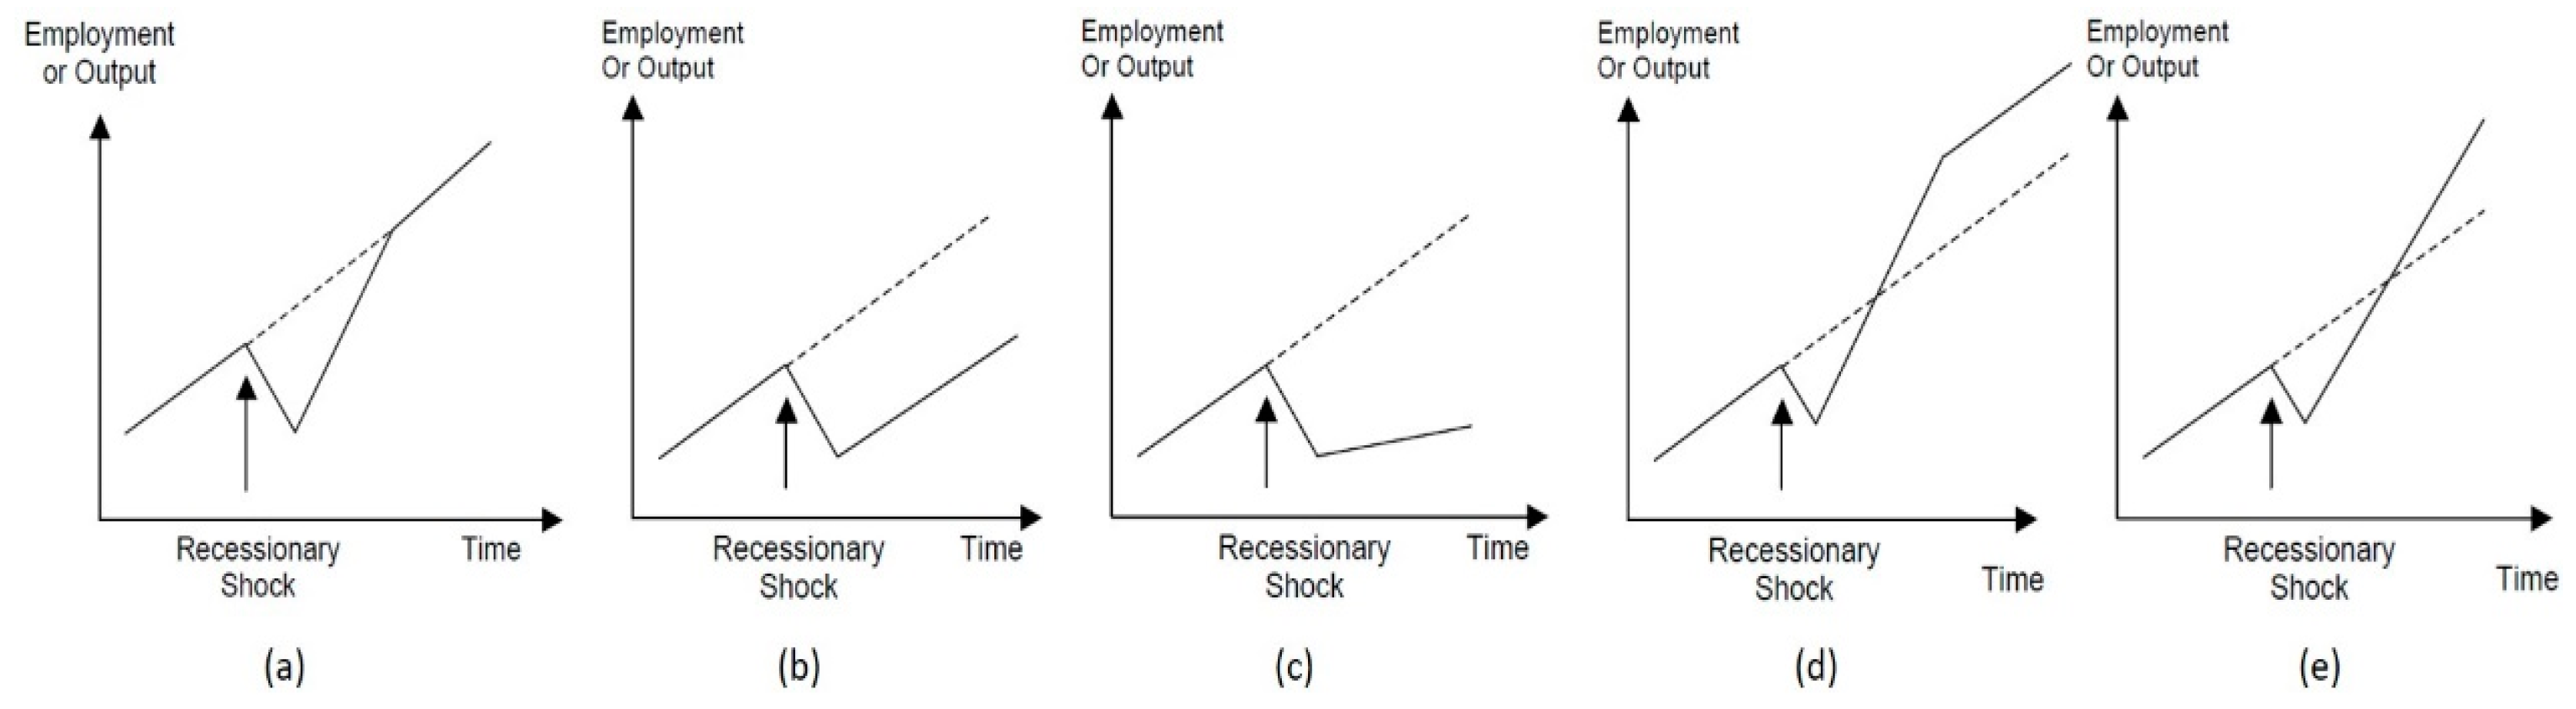
1.1. Regional Economic Resilience

The word ‘resilience’ is derived from the Latin, resilire. It is the ability of social, economic, and environmental systems to maintain their stability and recover from external shocks [1,2,3,4,5,6]. Resilient economies usually have strong self-recovery and adjustment capabilities and can return to previous growth paths or reallocate resources to develop new growth paths quickly [5,7,8].
Economic resilience is an economy’s ability to withstand external disruptions. Evolutionary economic geographers suggest that a region’s resistance and recovery from shocks may be the result of its previous growth path [9]. Economic resilience is a dynamic evolutionary process that can be used to study how regions are affected by recessionary downturns [10]. The underlying concept is how regional systems respond to shocks, whether by recovering to the pre-shock state, or by moving to other, better paths [7].
Foster [11], Hill et al. [12], and Martin and Sunley [7] introduced the concept of resilience into regional economic system research, characterizing regional economic resilience as the ability of a socioeconomic system to recover to a stable state after a shock. Martin [7] represents a more comprehensive overview of regional economic resilience with four dimensions, including the ability to reposition itself to adapt to the new external environment and the ability to create new development paths. The study also shows that a region’s economic resilience steers the economy toward a stronger and more sustainable growth path (Figure 1d,e), rather than back to its original trajectory (Figure 1a), or into a more passive and contractionary growth path (Figure 1b,c).

1.2. Economic Resilience Factors

Many scholars have suggested that the levels of innovation, infrastructure, etc., affect a region’s resilience in the face of crisis [14,15,16,17,18,19,20]. It has also been suggested that industrial diversity is closely related to regional resilience and that related diversity delivers positive externalities that promote regional employment and output growth [13,15,21,22,23].

1.2.1. Regional Development Infrastructure

The social functions of a regional economic system are highly dependent on the infrastructure network that enhances the economic efficiency of the system; therefore, infrastructure is an important indicator of resilience [24]. Scholars have also explored the correlation between accessibility and regional economic resilience, and also in industrial parks [25]. When accessibility is high, employers and employees can quickly find alternative solutions to economic shocks, such as downsizing, industrial restructuring, and relocation and have more options to recover without having to relocate outside the region [25,26,27].

1.2.2. Industrial Structure

Traditional economic geography focuses on the impact of the specialization and diversification of urban industrial structures on regional innovation and urban growth. Although specialization leads to knowledge spillovers within industries and is beneficial to economic growth [28], more studies suggest that diversification or Jacobs’ externalities are more beneficial to regional growth [28,29,30,31].

1.2.3. Enterprise Competitiveness and Labor Force Conditions

Research on industrial development and economic geography defines innovation as product innovation through technological innovation. The main advantage of this definition is that it can focus on the manufacturing industry and show the effectiveness of innovation for quantitative analysis and comparison with economic development performance indicators [29]. Knowledge and technology-intensive industry sectors are more resilient, spreading innovation to other industries in the region, thus driving economic recovery across the region [7].

1.2.4. Government Governance and Policy System

The development of industries does not always evolve spontaneously through market forces, and government intervention is necessary [21].

2. Materials and Methods

The first part is the analysis of the economic resilience of the industrial parks. The regional economic recovery index derived from previous studies is used to measure the economic resilience of each industrial park, including the resilience and recovery ability of the regional economy. In addition, discriminant analysis is used to measure and weight the performance of indicators to understand the most sensitive influencing factors in different types of economic resilience and classify industrial areas according to their resilience.
In the second part, the study analyzed the impact factors of disaster resilience, including environmental exposure of industrial parks, disaster prevention, and relief resources and plans, etc. Through typical correlation analysis, the correlation between economic resilience and disaster resilience was analyzed to facilitate the arrangement and allocation of resources for decision making.
The total area of 35,779 hectares (accounting for 74.27% of the total area) of the 60 designated industrial parks is under the Industrial Development Bureau in the Ministry of Economic Affairs which houses the main force of Taiwan’s economic development. We analyzed the economic resilience of the 60 industrial parks in the face of several impacts—the 2008 subprime crisis, the 2016 one-year hiatus, and the 2019 COVID-19 epidemic—based on four major factors: industrial structure, regional development base, enterprise competitiveness and labor force, and government governance and policy system, and quantitatively analyzed the resilience of 60 industrial parks from two perspectives: resistance and recovery.
The regional economic recovery index was used to measure the economic resilience of each industrial park, including the resilience and recovery ability of the regional economy. The factors influencing economic resilience were analyzed, and a preliminary evaluation framework was established, including industrial structure, regional development base, labor force, financial support capability, and government governance and management capability. In addition, discriminant analysis was used to measure and weight the indicators and to explore which factors were the most critical.

2.1. Selection of Evaluation Indicators and Description of Data Sources

From previous studies, five major aspects were integrated, including regional development base, industrial structure, enterprise competitiveness and labor force, financial support capability, and government governance and policy system. Industrial parks are different in scale from metropolitan areas in most studies causing some inappropriate indicators to be excluded. The final evaluation indicators were divided into four major aspects, including regional development base, industrial structure, enterprise competitiveness and labor force status, and governmental governance and policy system. Industrial structure and availability of data were also considered.
The final analysis of the economic resilience of the 60 categorized industrial areas in the face of three waves of shocks was conducted using 14 measurement variables in four major areas. The relevant categories, evaluation indicators, measurement variables, and data sources are summarized in the following Table 1.

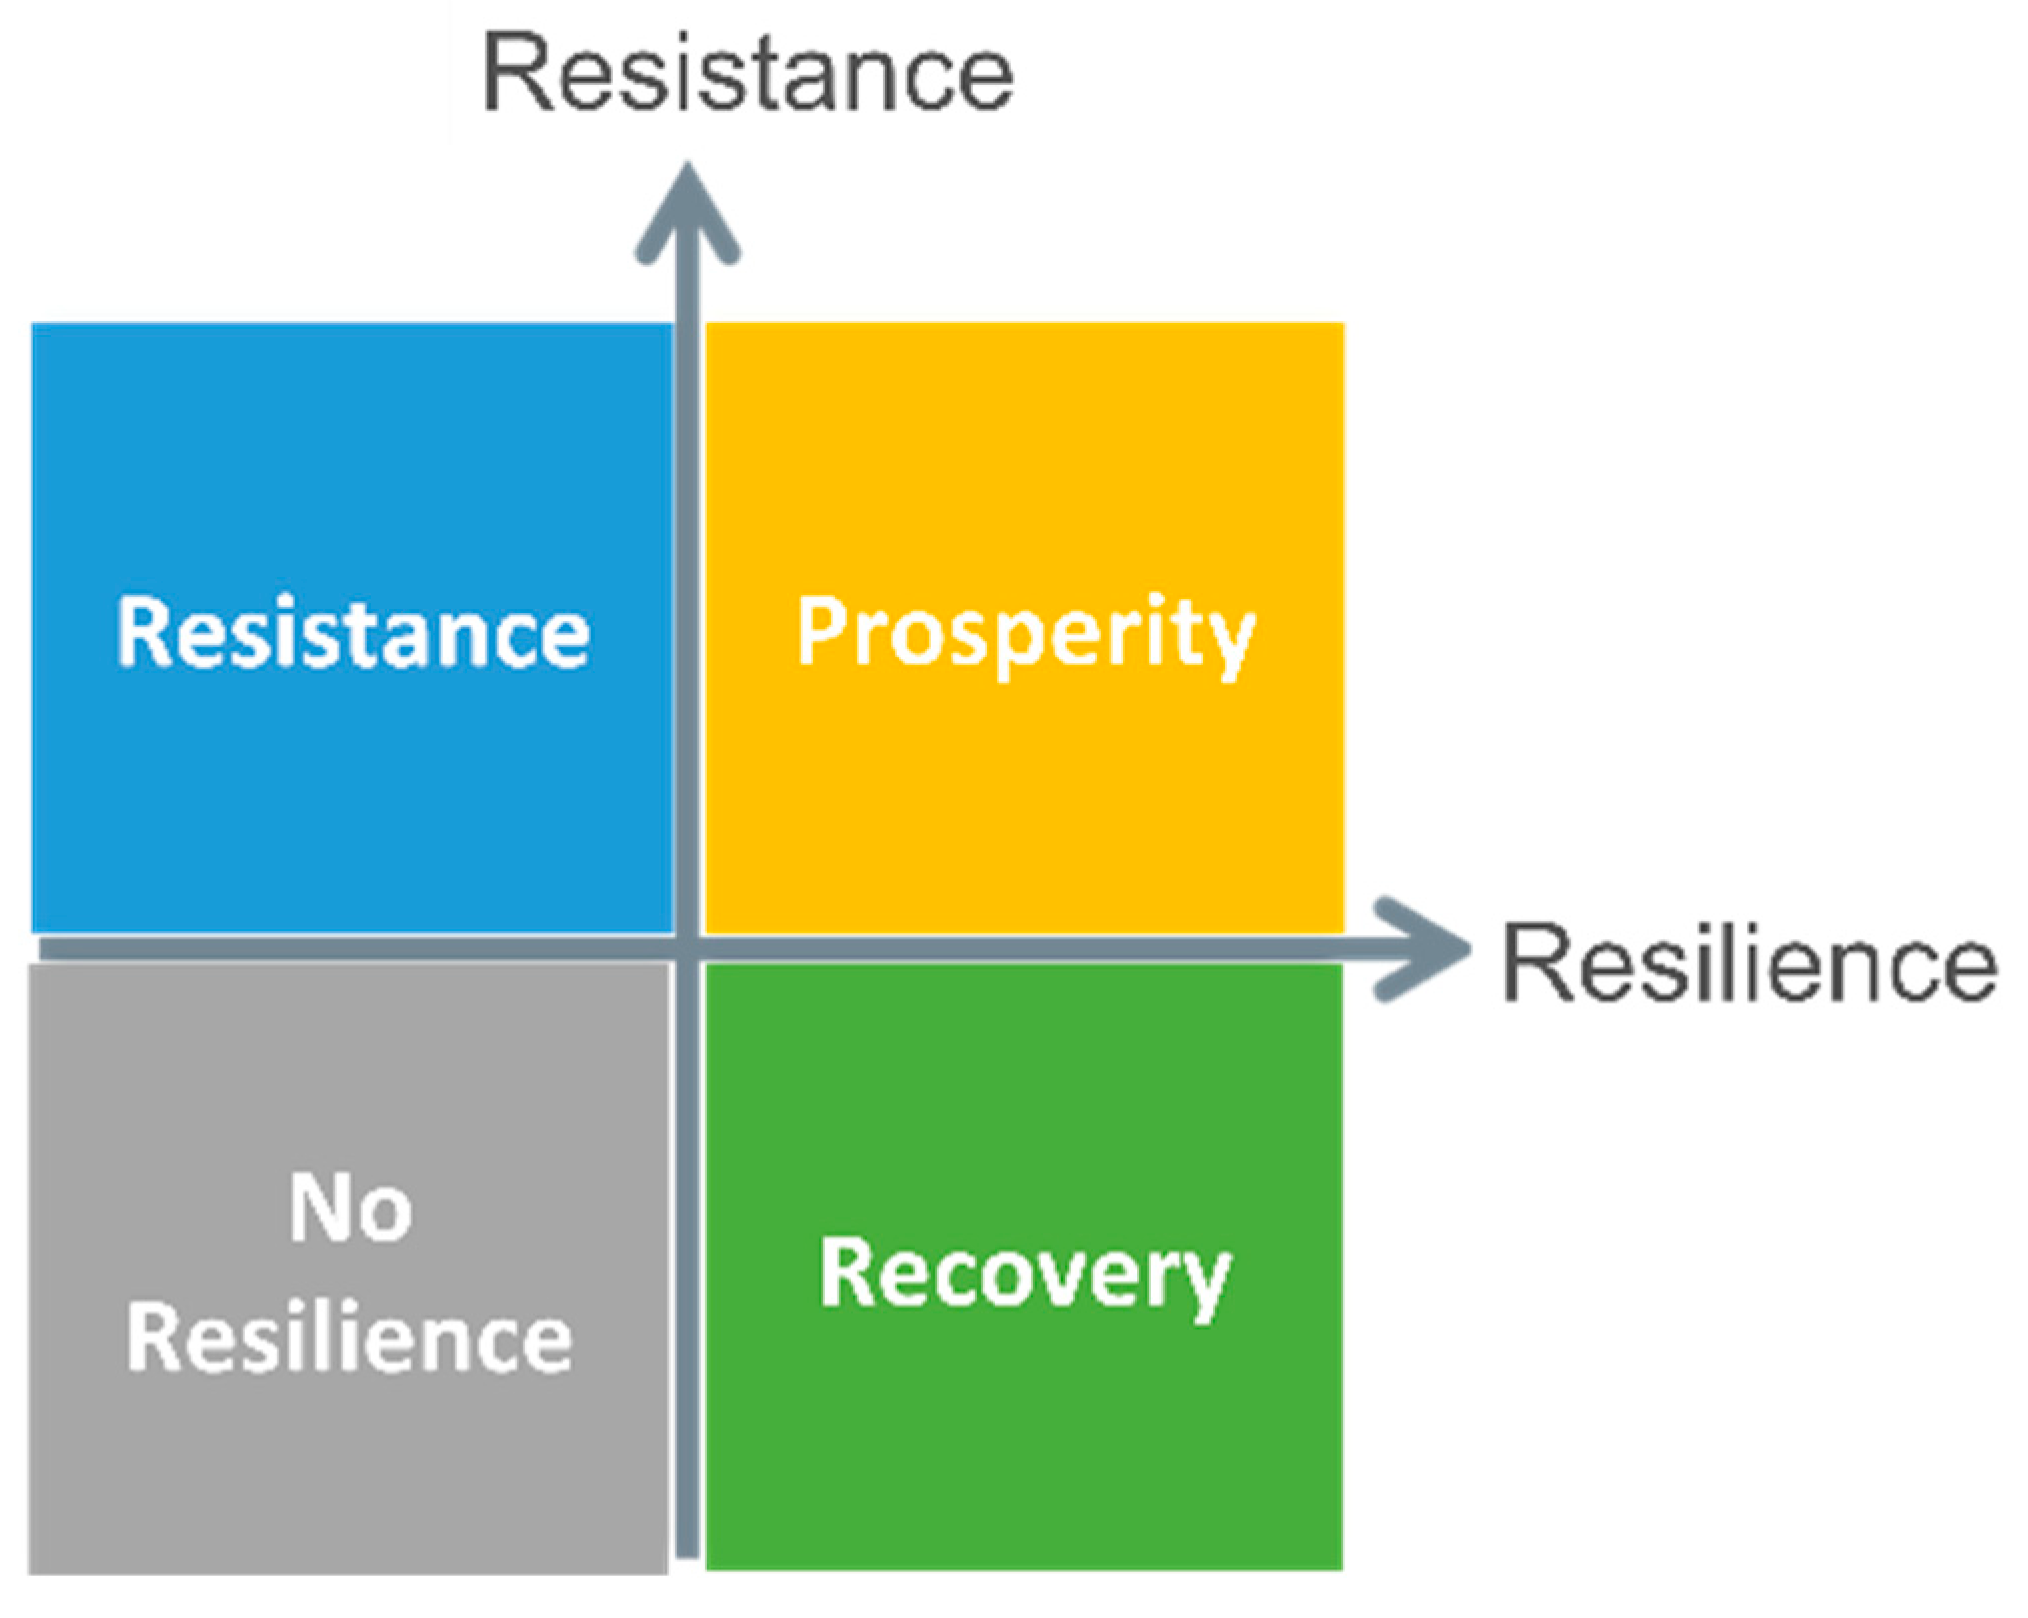
2.2. Economic Recovery Index

Economic resilience is measured by the Economic Recovery Index (ERI), which defines the amount of expected growth or decline and calculates the regional economic resilience by comparing the change in the economic growth rate with the change in the expected economic growth rate.
Most of the literature on economic resilience is based on Martin’s [7] study that measures the resilience of regional economies to shocks and their ability to recover from shocks. The employment level of each industrial region is used as a measure because the cyclical changes in employment are more pronounced than those in output, and the changes in employment reflect the social impact of recessionary shocks better than output.
Let R e s i s r and R e c o v r denote the resistance and resilience of the regional economy, respectively. Positive values mean that the economic resistance and resilience of the region are greater than the national average; i.e., the region is better able to withstand recession or shock. Negative values indicate economic resistance and resilience of the region below the national average.
The expected economic change in the region is calculated as follows:
Δ E r t + k expected = i g N t + k E i , r t
where Δ E r t + k expected represents the expected amount of economic change in region r according to the national average growth rate, E i , r t is the growth rate of industry I in region r in starting (base) year t, and g N t + k is the rate of change in the contraction or expansion of the national economy from starting year t to year t+k (covering the contraction or expansion period). Given that major recessions occur nationwide, it is assumed that each region of the economy should respond in the same way as the macro aggregate. Therefore, the amount of change in the national economy is used as the benchmark against which all regions are compared, and the difference from that benchmark indicates the relative toughness of each region. The economic resilience and recovery of the region are expressed as follows.
R e s i s r = Δ E r decline Δ E r decline decline ÷ Δ E r decline expected
R e c o v r = Δ E r growth Δ E r growth expected ÷ Δ E r growth expected
where Δ E r decline and Δ E r   growth are the actual regional economic growth rate decline and change, respectively, and Δ E r decline expected and Δ E r growth expected are the expected regional economic growth rate decline or growth in the country, respectively.

2.3. Discriminant Analysis

The main factors affecting the economic resilience of industrial parks were identified by discriminant analysis. This method was developed by Fisher in 1938 and performs two main functions: discrimination and categorization. Fisher’s discriminant analysis can establish a model for a known class of observations (industrial area), construct a set of discriminant functions, convert the observations into a new variable by linear combination, and make the original classification group (class) achieve the maximum differentiation after the conversion. It can then convert the observations of an unknown group sample by discriminant functions to predict into which group the observations can be classified. Fisher’s discriminant analysis can establish discriminant functions to classify the known and to reconfigure the unknown (allocation) to achieve classification. The basic concept is to find a discriminant function from the vector space of observations so that the number of observations overlapping between groups is minimized, i.e., the intergroup variation is maximized, the intra-group variation is minimized, and the ratio of the two variances is maximized.

3. Empirical Analysis

The different shock types faced by the industrial parks—namely financial shocks, policy shocks, and epidemic shocks—will be analyzed to identify factors affecting them. The economic recovery index is used to classify the 60 industrial parks into four categories: prosperous, resistant, recovering, and non-resilient.
In order to define the impact period and recovery periods, we first collated the changes in the total number of employees in the 60 designated industrial parks (Table 1) and used these objective numerical changes to determine whether the overall industrial areas suffered from economic shocks. We defined the impact period as covering a peak-to-trough transition, and the recovery period as the ensuing trough-to-peak transition. As we can see from Figure 2, over the past 14 years, the designated industrial parks experienced three shocks: S1, the financial tsunami from 2008 to 2009; S2, the new labor system from 2016 to 2017; and S3, the new coronavirus COVID-19 epidemic from 2019 to 2020. The corresponding recovery periods are R1 from 2009 to 2016, R2 from 2017 to 2019, and R3 from 2020 to 2021.
The resiliencies of the 60 industrial parks under the three impact waves, calculated using Equations (2) and (3), are shown in Table 2, and for each impact, the resiliencies were classified according to the four quadrants of Figure 3 to produce Figure 4, Figure 5 and Figure 6.
The larger the eigenvalue of the discriminant function in the discriminant analysis, the more discriminative the function is. The discriminative power of the variable is expressed by ‘Wilks’ λ. The larger the F statistic, the smaller ‘Wilks’ λ; if p < 0.05, the variance has reached a significant level. The coefficient of standardized positive discriminant function represents the relative importance (contribution) of the respective variables (predictor variables) in each discriminant function. The higher the coefficient is, the higher the importance (contribution) of the independent variable (predicted variable) in the discriminant function, and the higher the influence will be.

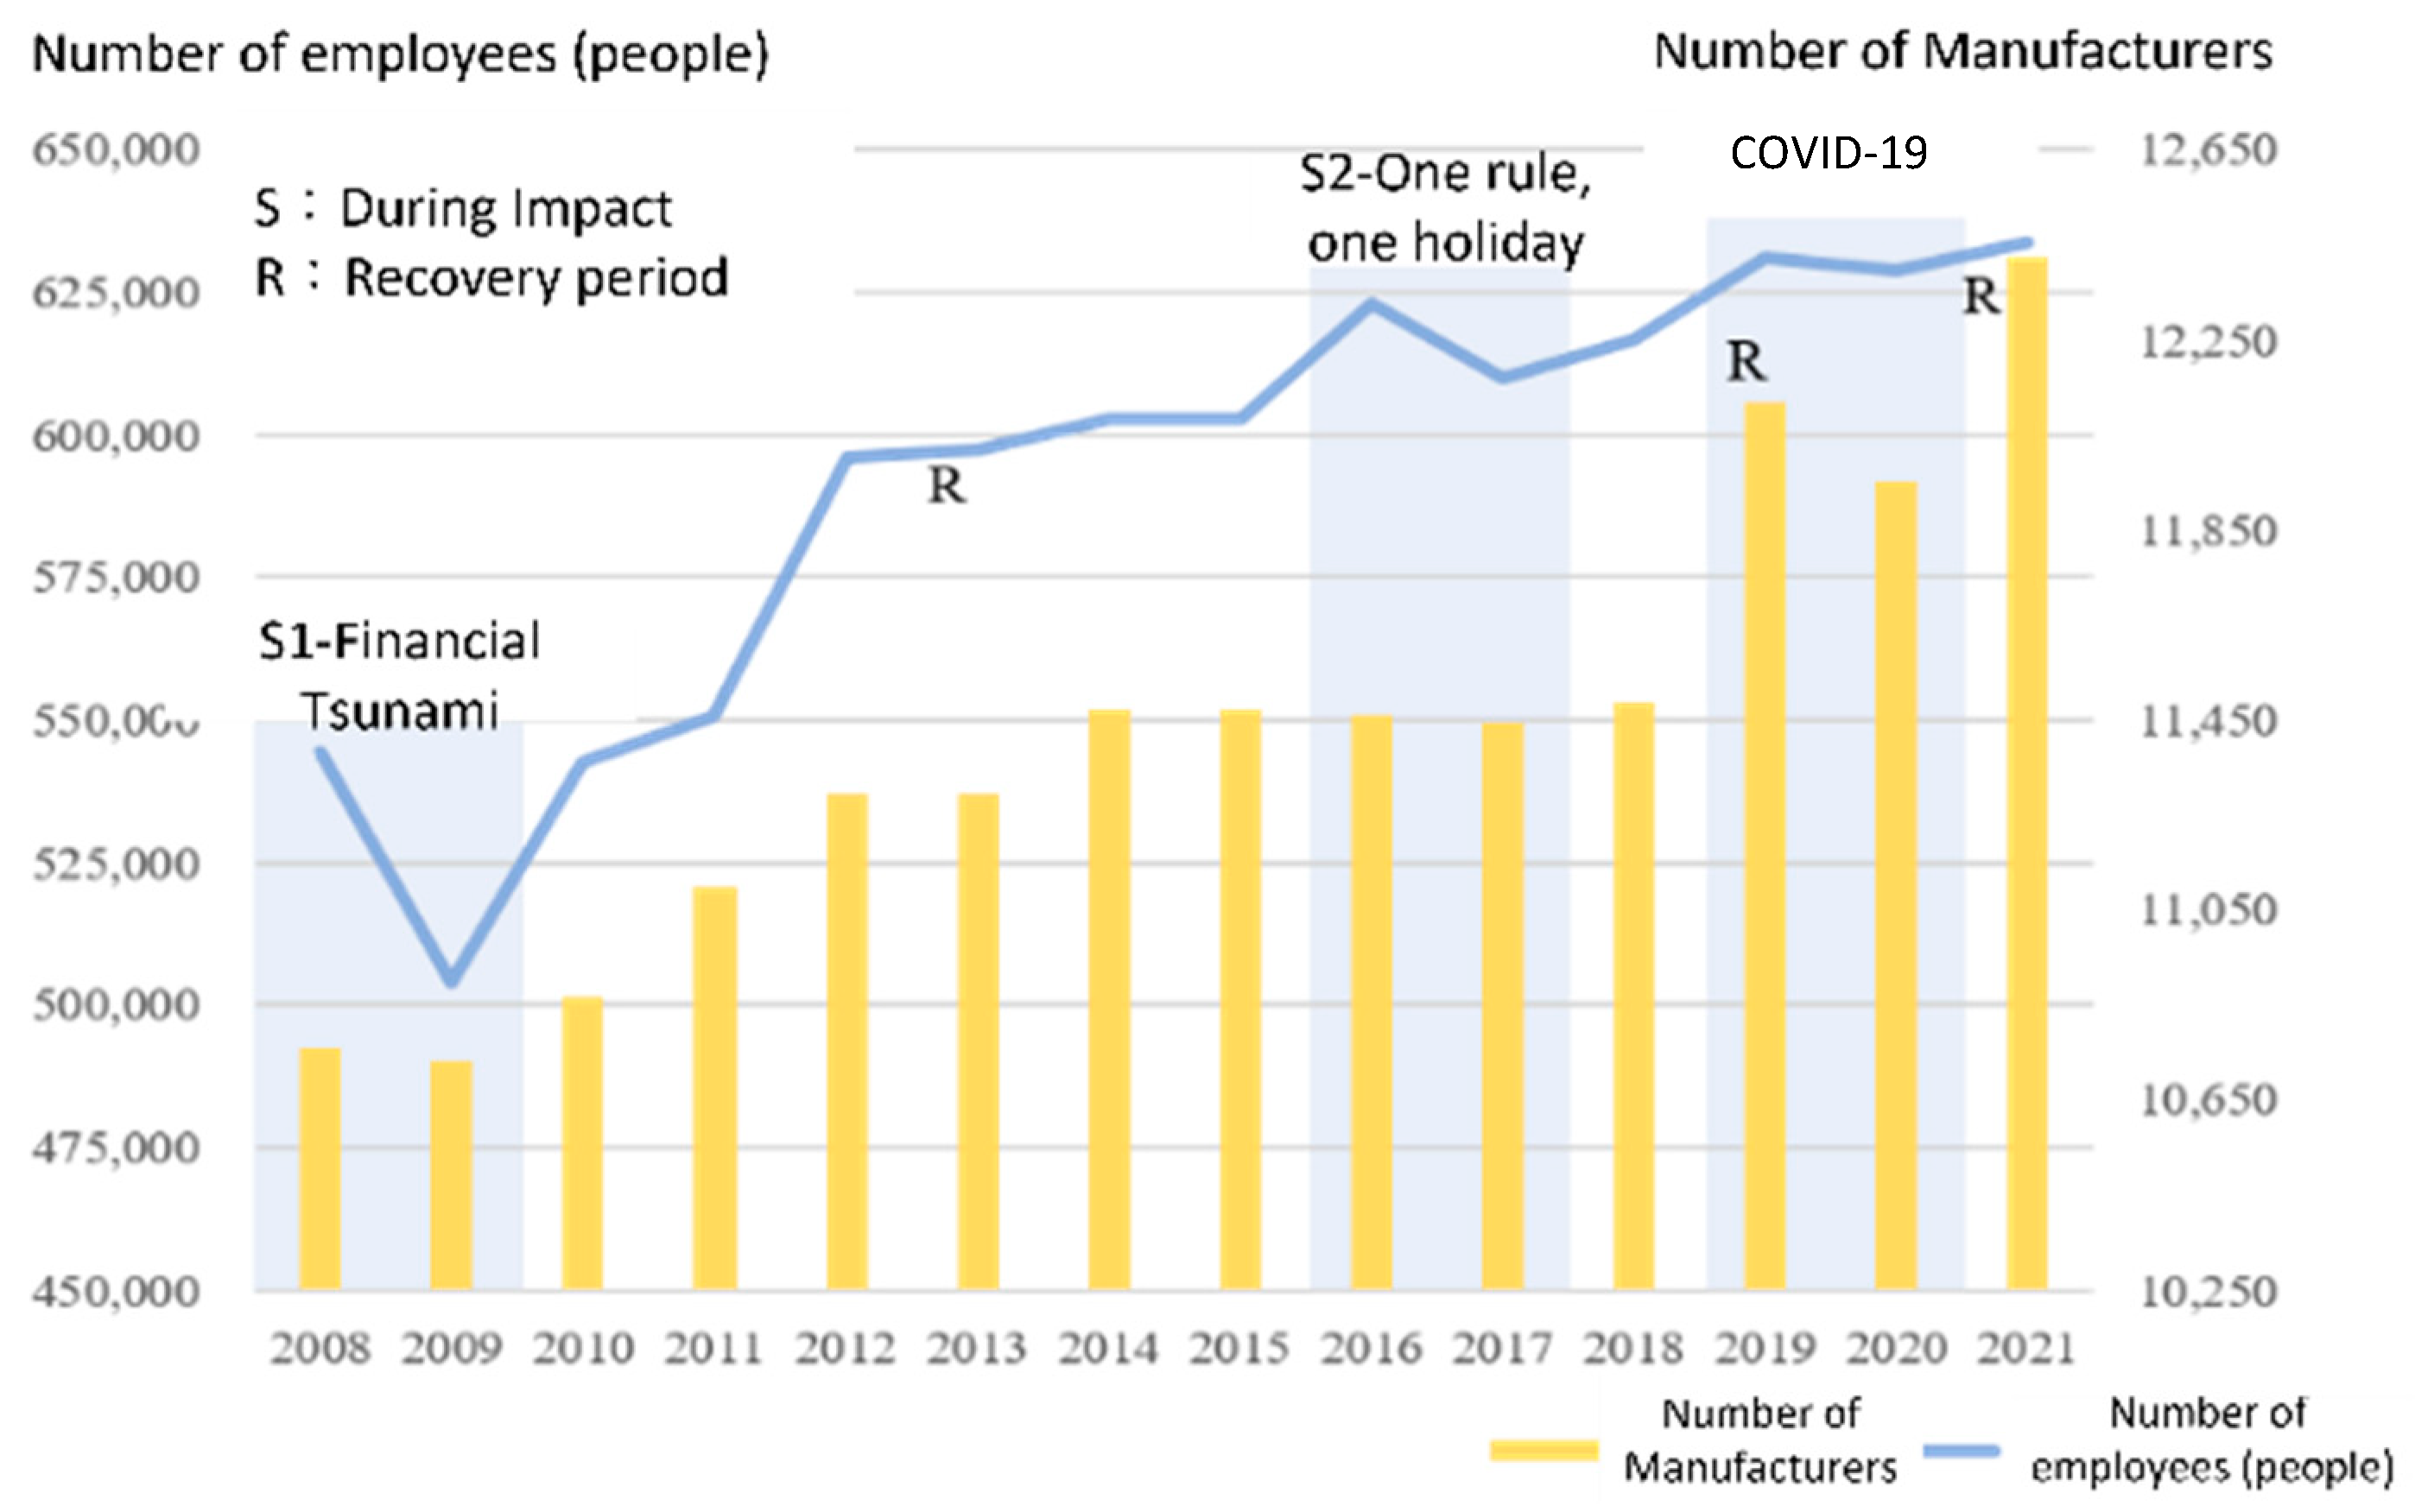
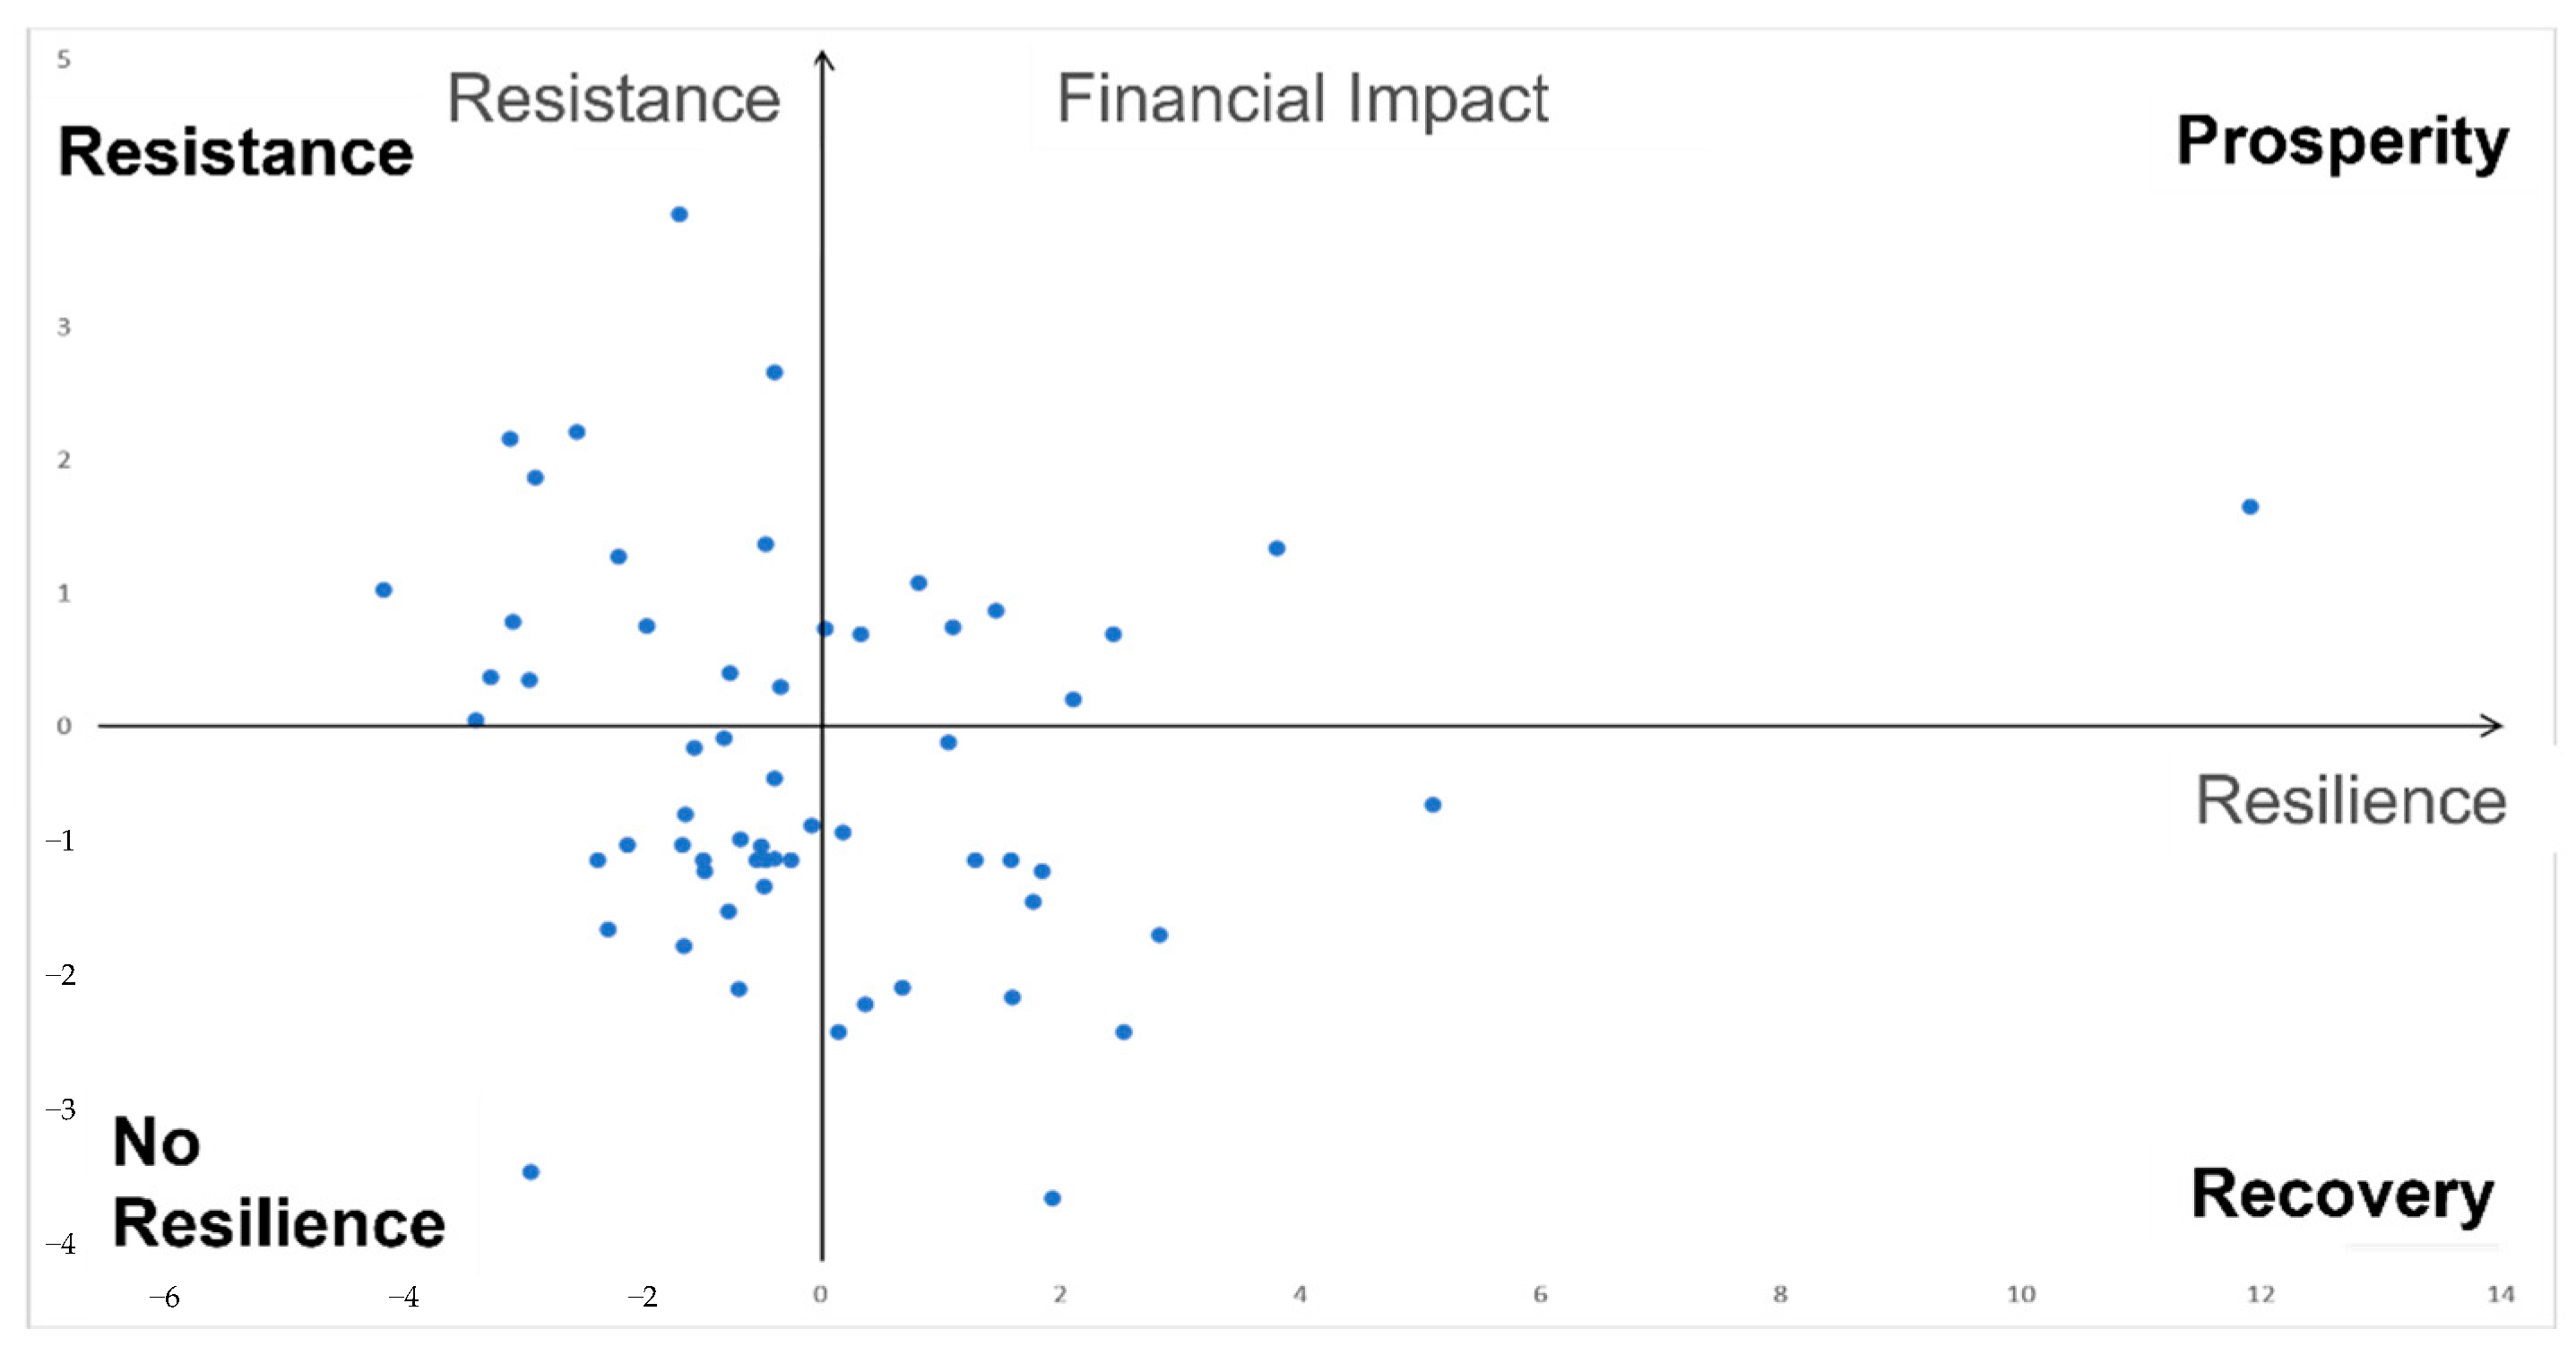
3.1. Financial Shocks
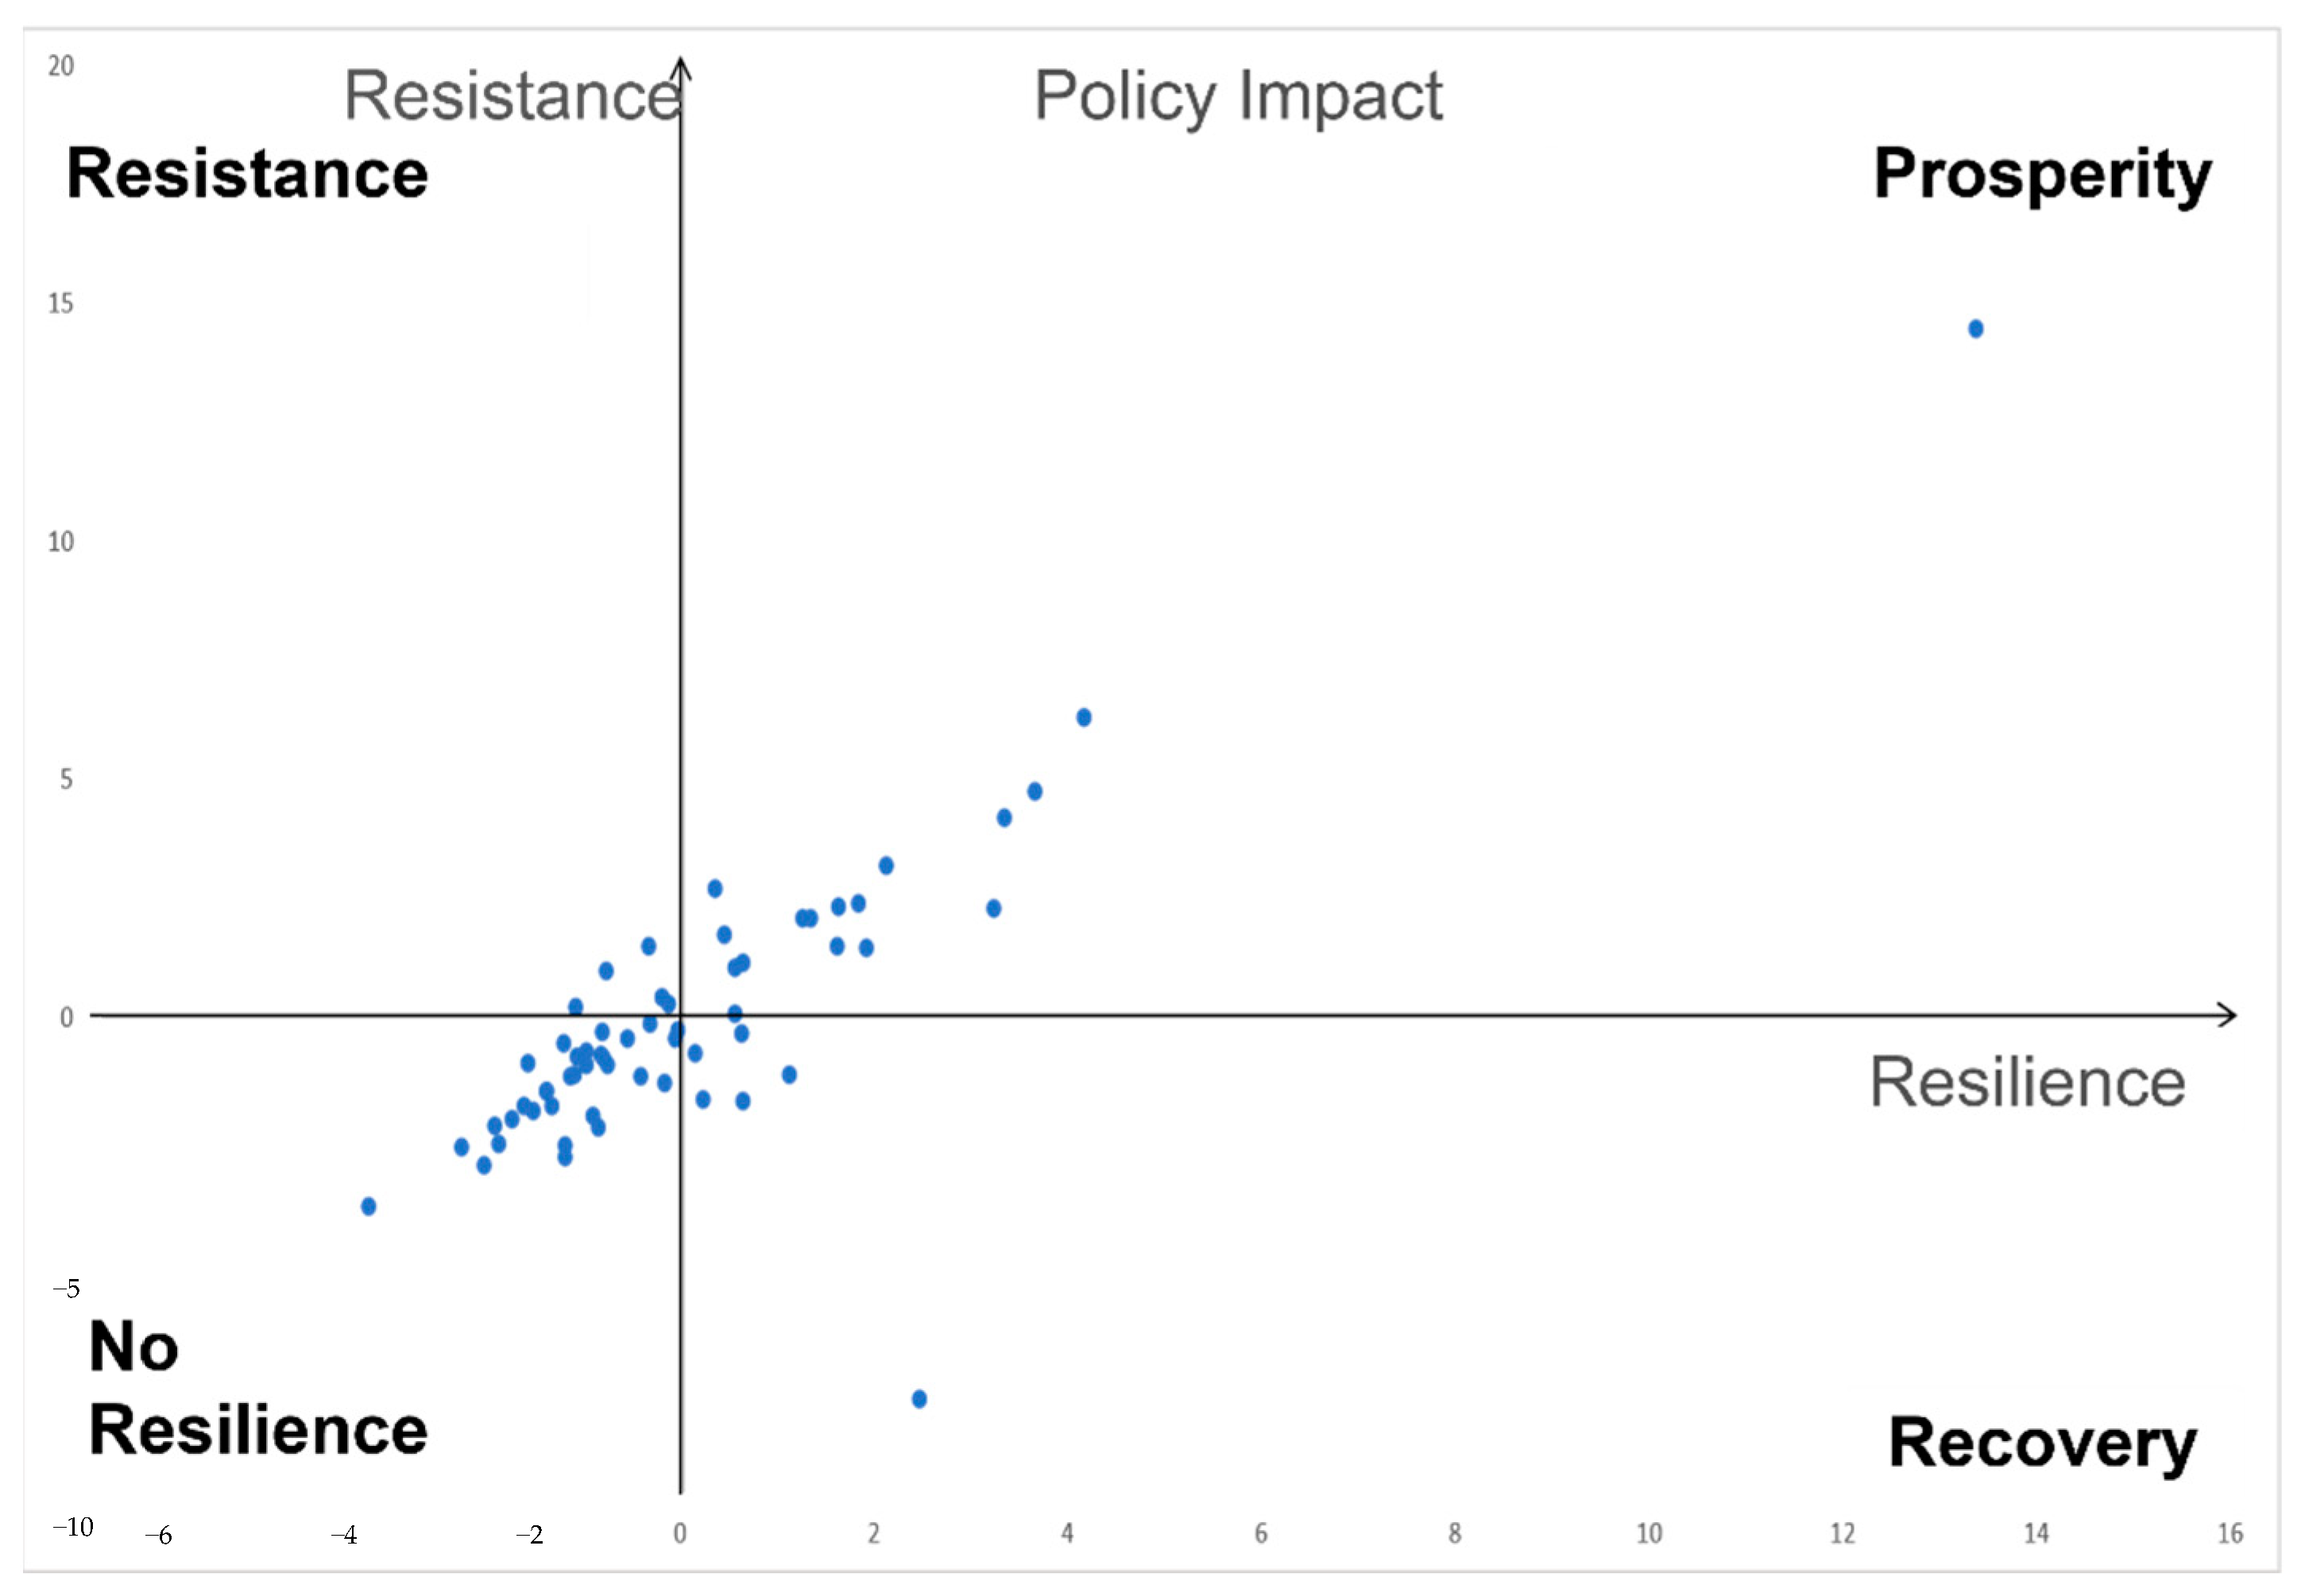
The financial shock period was from 2008 to 2016. Taiwan’s economy was hit by the global financial crisis, and the economy shrank from the third quarter of 2008 for five consecutive quarters. Since Taiwan is a small, open economy with a small and mature domestic market, its economic growth is driven mainly by overseas markets, and the export regions are highly concentrated in electronics and high-tech products, which are greatly affected by the international economic climate.
The discriminant analysis of financial shocks is shown in Table 2. Among the three discriminant functions, the characteristic value of the first function is 0.751, which can explain 48.5% of the corresponding variables. Functions 1 and 2 are significant, which means that they have statistically significant explanatory power for the dependent variable, while Function 3 is not significant and does not have significant explanatory power for the dependent variable.

3.2. Policy Impact

The policy impact period is from 2016 to 2019, and the main focus is on the response of different industrial parks to the implementation of the one-period-one-rest policy. The impact of the amendment is mainly on the increased number of labor days off and the sudden increase of personnel cost caused by working on rest days, resulting in a serious labor shortage, difficulty in scheduling, a high multiplier increase in overtime cost, decreased quality, and failure to deliver on time. If the operation cannot be adjusted in the short-term, it will definitely cause an impact.
The discriminant analysis of the policy impact is shown in Table 3. Among the three discriminant functions, the first has a characteristic value of 0.588, and it can explain 54.3% of the variables. The discriminant power of Function 1 is better; the significance of ’Wilks’ λ to check the discriminant function is 0.029 between Functions 1 and 3, 0.22 between Functions 2 and 3, and 0.735 for Function 3. Function 1 is statistically significant in explaining the dependent variables, while Functions 2 and 3 are not significant and do not have significant explanatory power for the dependent variables.

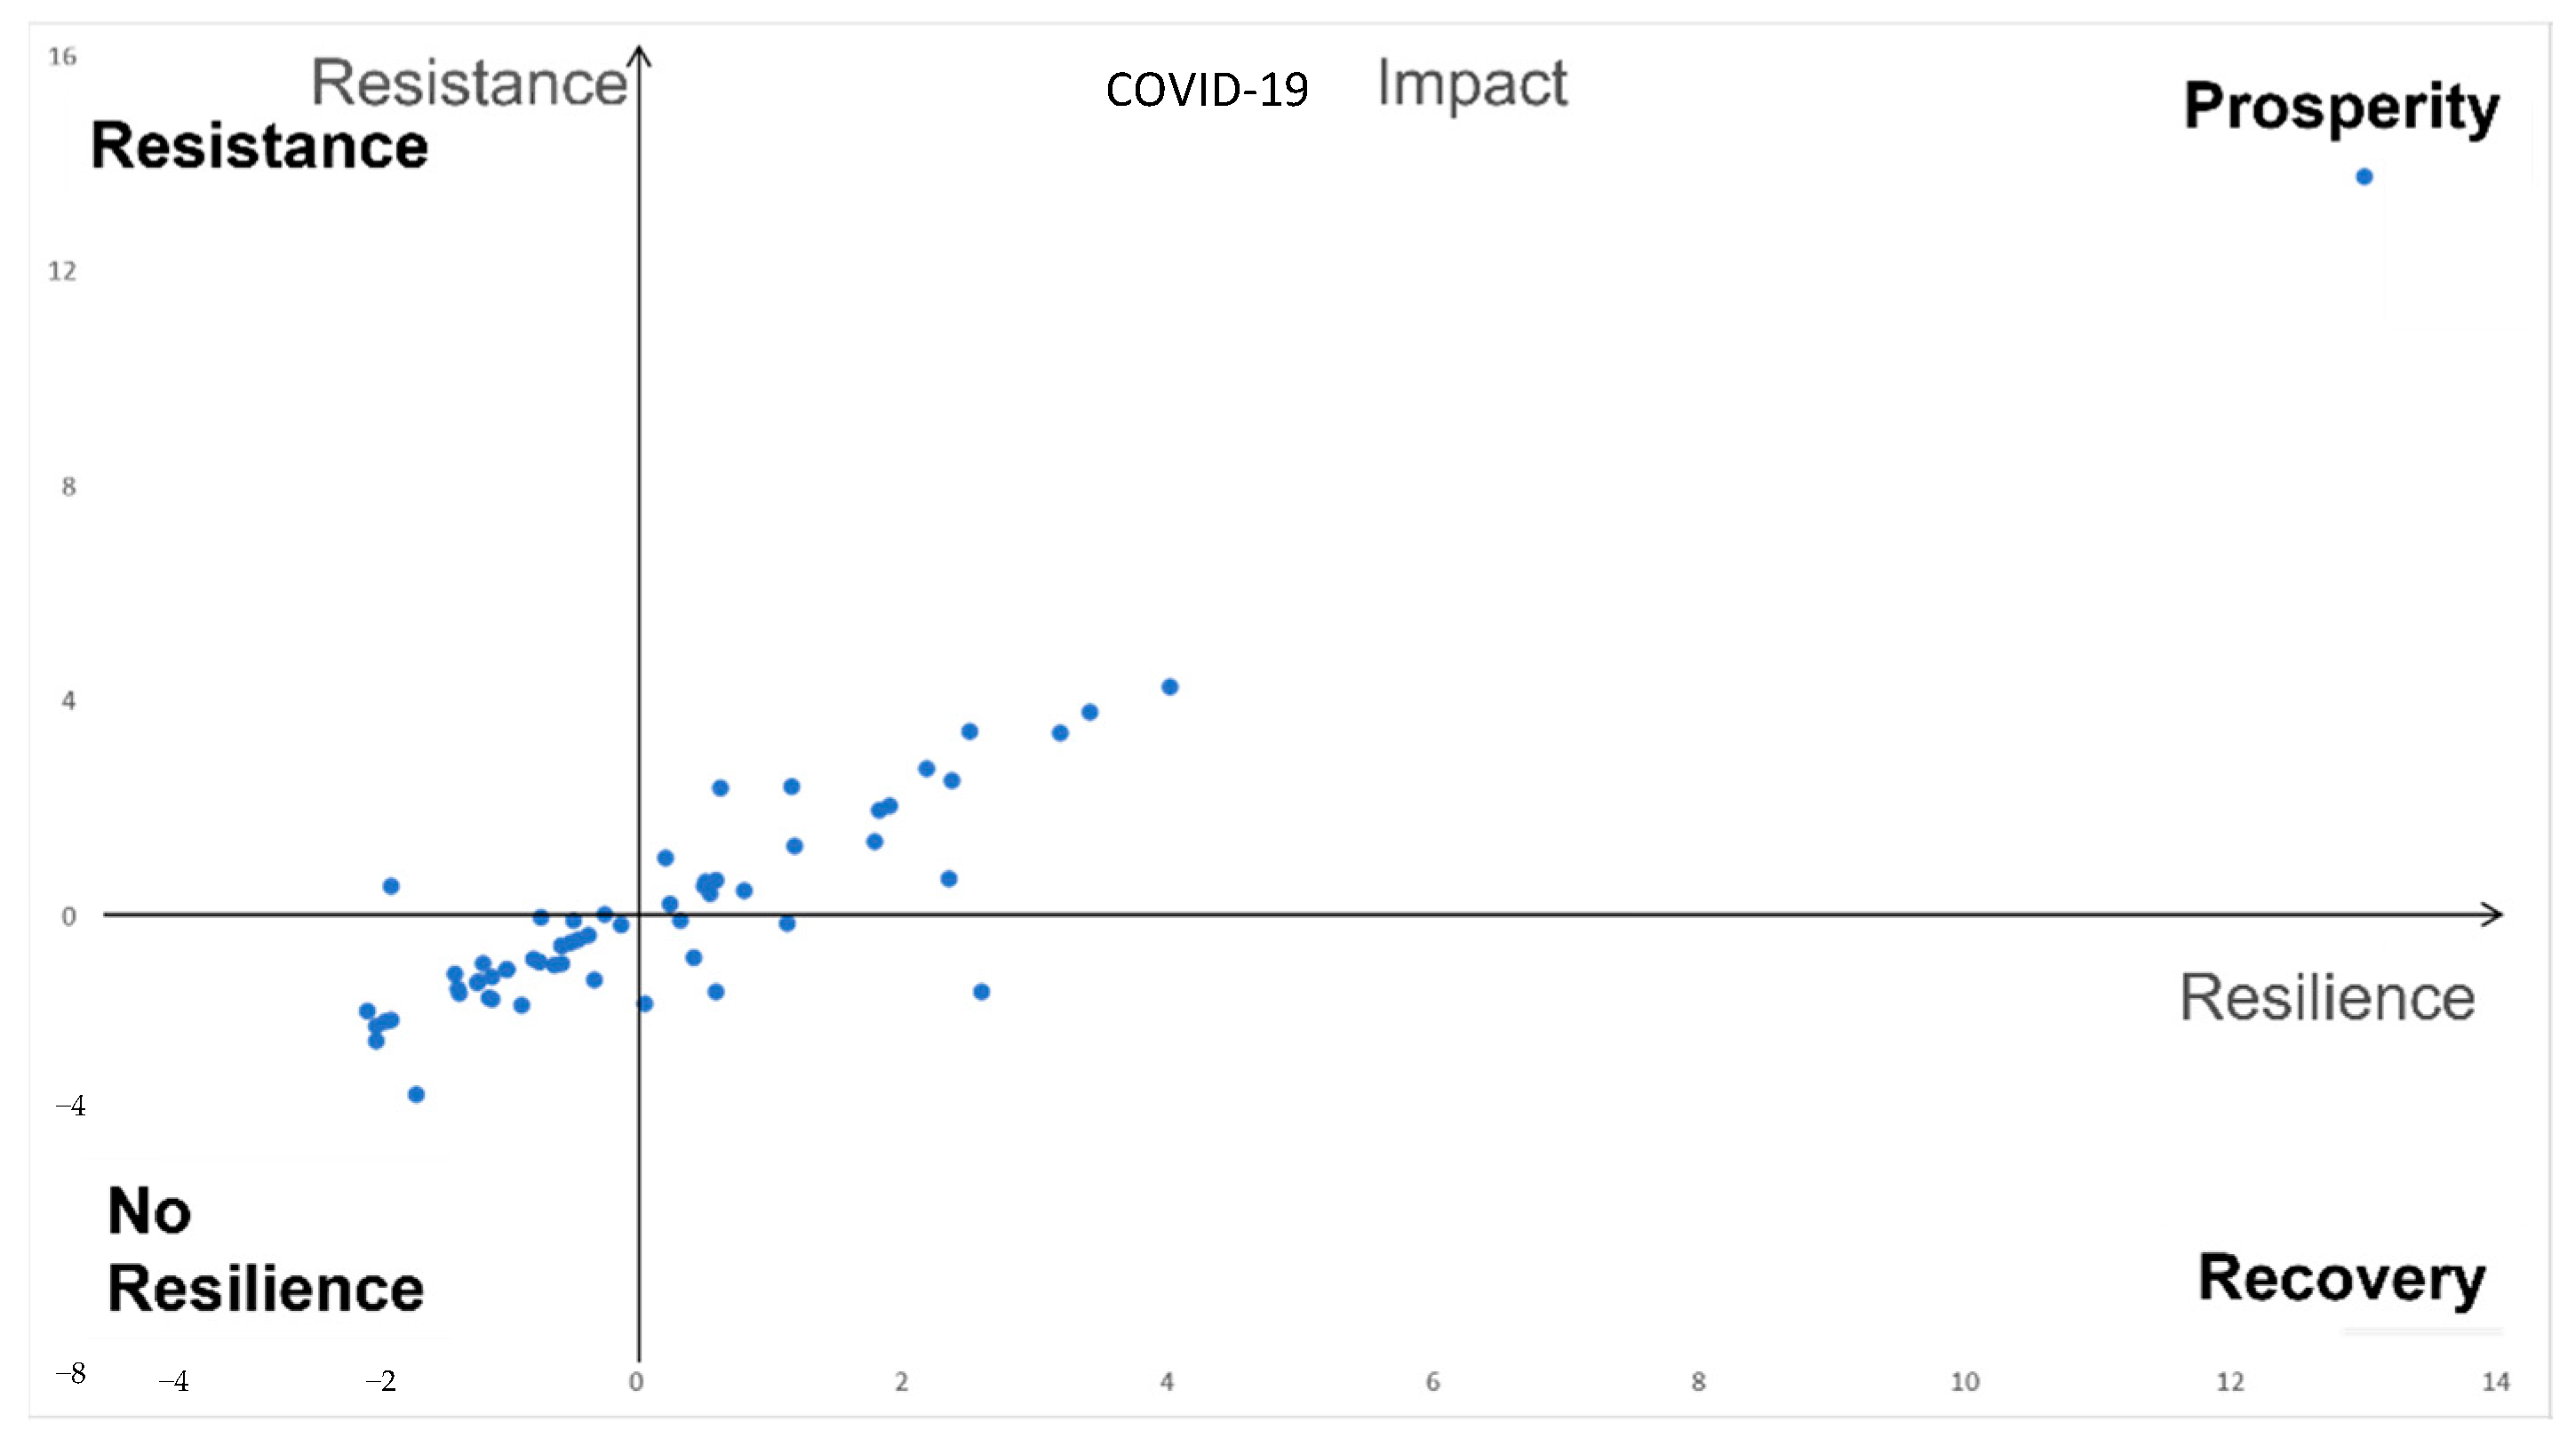
3.3. Impact of the Epidemic

In December 2019, an outbreak of a novel viral pneumonia occurred in Wuhan, Hubei Province, China, which was named COVID-19 by the World Health Organization (WHO) on 11 February 2020. China is Taiwan’s main export and investment market. The division of labor across the Taiwan Strait has long formed a close supply and demand relationship. Japan and South Korea are important suppliers of raw materials and key components to Taiwan, while Europe and the United States are the world’s largest consumer markets. Therefore, the subsequent spread of COVID-19 had a high impact on Taiwan’s industrial economy.
The discriminant analysis of the impact of the epidemic found that none of the three functions had significant explanatory power for the dependent variables. There are no specific regional development base, industrial structure, enterprise competitiveness and labor force status, or government governance and policy system patterns that are more resilient to the impact of the epidemic. In order to further explore the regional differences among industrial areas in different regions during the epidemic impact, a separate analysis was conducted for three zones—North, Central, and South. As shown in Table 4, only the North Zone reached a significant level.

4. Conclusions and Recommendations

4.1. Conclusions

Under the impact of global changes and uncertainty risks, regional economic resilience is considered as an important feature of regional responses to shocks and disturbances, which is important for understanding how regions cope with social, economic, and environmental changes, and has therefore received wide attention. Although studies on Europe, the United States, and mainland China demonstrate some significance, features should be analyzed in the context of local conditions. The study of regional economic resilience should focus not only on economic factors, but also consider the influence of the local cultural environment and the degree of development.
The results showed that in the analysis of economic resilience, the first discriminant function has the largest typical correlation coefficient of 0.655. From the financial impact section of Table 3, we can see that the distinction was mainly influenced by the five discriminant variables with higher absolute values of the discriminant function coefficients: uncorrelated diversity, correlated diversity, new factory registrations, electronics, and livelihood, indicating that these discriminant variables had a good ability to discriminate economic resilience with significant differences. The first discriminant function is mainly composed of the influence of industry type. During economic shocks, industrial areas with a higher proportion of diversified and non-diversified industries and electronics and livelihood industries are more resilient; conversely, the distance to nearby interchanges and the ratio of owned financial resources were negatively related to economic resilience.
The first discriminant function has the largest typical correlation coefficient of 0.609. The policy impact section of Table 4 shows that the differentiation is mainly influenced by five discriminant variables with higher absolute values of the discriminant function coefficients: correlated diversity, uncorrelated diversity, college-plus population, chemistry, and metals, indicating that these discriminant variables have a good ability to discriminate economic resilience with significant differences. The first discriminant function is mainly composed of industry-type effects. Conversely, industrial parks with a high proportion of the population above the university level and chemical and metal industries have a negative impact on economic resilience.
The first discriminant function had the largest typical correlation coefficient of 0.898 (Table 5), and the discriminant variables with higher magnitudes of the discriminant function coefficients were: non-relevant diversity, electronics, chemical, professionalization, and relevant diversity. Diversification and specialization of industries are both beneficial to economic resilience, and the share of electronics and chemical industries also benefits the economic resilience of the North Zone.
How the regional economy is affected by negative shocks depends on two aspects (Table 6): the intensity of the shocks on the one hand and the resilience of the regional economy on the other. In the context of financial and policy shocks, the industrial structure is the main factor affecting the resilience of the regional economy, especially industrial diversification with relevant and non-relevant diversity, which disperses shocks and resists risks to reduce the impact of shocks. In the context of epidemic prevention and control, the first aspect depends on the severity of the epidemic and the results of local measures to deal with the epidemic; the second aspect depends on the economic resilience of each region.
This study classifies the economic resilience of 60 industrial areas into four quadrants and analyzes the main factors affecting economic resilience in different shocks. The 2008–2009 financial tsunami was a global shock event that brought a major recession to the global economy and severely reduced export momentum. The impact of the “one regulation, one rest” policy brought about a sudden increase in labor costs for enterprises and changed the existing labor arrangement model, which especially hurt labor-intensive industrial areas. Therefore, the government should consider the situation and needs of each industry before implementing policies and should formulate a more flexible policy system to avoid hindering the development of different types of industries due to the absolute rigidity of policies. The impacts on Taiwan’s industries varied depending on whether the product was made in Taiwan or through China, marketed globally, in China, or locally, and the global supply chain gradually shifted from globalization to localization after the COVID-19 outbreak. As a result of the pandemic, companies in various countries re-examined risk management, accelerated the establishment of multiple production bases (cross-region and cross-country), and decentralized markets. At the same time, they also strengthened the backup capacity for key components produced in their home countries and initiated dual sourcing to repair the broken supply-chain crisis in the shortest possible time and strengthen the response capability to enhance supply-chain resilience.
This study analyzes the characteristics and differences among industrial regions in terms of the regional development base, industrial structure, enterprise competitiveness and labor force, and government governance and policy system. The industrial structure is a key factor affecting economic resilience regardless of the impact type. The results show that both diversification and specialization benefit regional economic resilience. Different types of industries have different demand elasticity, export orientation, labor and capital intensity, and external competitive risks. Specialized industries that are large enough can be resilient to external changes and have economic resilience.
The average R&D funding and patent applications in industrial areas are beneficial to their economic recovery. Although the contribution is not as obvious as the industrial structure, maintaining a stable investment in innovation will be a key factor for the sustainable evolution of industrial areas. In the face of many shocks, most industries are developing value-added strategies, building competitive advantages through innovation, and accelerating automation to improve operational efficiency, asset productivity, and product quality. This enables the industry to have a strong dynamic adjustment capability, not only to reallocate resources to cope with the changing environment and ensure its competitive advantage persists, but also to rapidly generate and absorb new innovations and spread them to other industries through knowledge spillovers, thus driving productivity recovery across the region [7].
In terms of government governance and policy systems, regions with a smaller proportion of their own financial resources tend to be more dependent on the central government and thus lack the ability to adjust in the face of external shocks, making the region relatively less resilient. However, during the recovery period, government spending helps enterprises and regions to recover by expanding employment and revitalizing the economy, which strengthens the regional economic resilience. However, the industrial zones in this study are all designated by the Ministry of Economic Affairs and are not directly related to local government finance. However, Taiwan’s manufacturing industry consists of a large number of small and medium-sized enterprises (SMEs), and when they are faced with external shocks, the government still needs to provide short-term relief, low-interest loans, and revitalization policies in response.
In addition, in view of the high proportion of SMEs in Taiwan’s manufacturing industry, the government should increase investment and guidance for SMEs and improve support for SMEs, such as reducing their tax revenue, so that SMEs can fully utilize their advantages. Taiwan’s industry is facing a critical moment of transformation. At this stage, most SMEs are between Industry 2.0 and 3.0, and they should continue to invest in industrial upgrading and transformation, as well as in research and development of innovative applications, in order to maintain a position in the global industrial competition and to sustain the development of the industry. The unpredictability of global economic development reflects the urgent need for automation and digital transformation to enhance competitiveness, reduce the risk of industry disconnection or emergency response, especially the risk management of multi-layer supply chains, and establish a multi-lateral supply and demand digital platform. The core of economic resilience is to adapt to changes in the overall environment, make changes in the industrial structure, and promote innovation in hopes that the regional economy will move towards a more stable and sustainable development path.
The Industrial Development Bureau of the Ministry of Economic Affairs has been reinvigorating old industrial parks, strengthening the trend of smartening public facilities, integrating Internet Of Things (IOT)-related technologies in industrial parks, establishing a shared information platform to improve the management efficiency of the zones, and promoting public–private cooperation to establish a circular economy and create low-carbon emission zones to achieve sustainable operation. In order to pursue the sustainable and stable development of industry, in addition to strengthening its economic and disaster resilience, the introduction of information technology and IOT applications should be accelerated to help promote innovation and upgrades. In the future, the industrial park can also build an intelligent management system collaborative platform based on the IOT network by combining various units of industry, academia and research to create circular business opportunities and autonomous management mechanisms.

4.2. Recommendations

Global supply chains were reorganized due to the COVID-19 epidemic and the U.S.-China trade war. A “short-chain supply strategy” reducing production crises is an opportunity for industries to accelerate transformation, digitization, and intellectualization processes. ESG was also highlighted during the pandemic by taking advantage of the upstream and downstream industrial chains where automated and intelligent industries’ remotely controlled production lines can maintain a stable supply during a lockdown. “Digital Transformation” and “ESG” are interlinked, effectively enhancing competitiveness.
The emerging concept of regional economic resilience still presents many challenges. Quantitative analysis of regional economic resilience is still immature, especially neglecting the idea of evolutionary economic geography. The existing empirical studies of regional economic resilience are based on macroeconomic models, and most of the early theoretical frameworks of regional economic resilience were inspired by evolutionary economic geography, but no mature theoretical system has yet been formed. Moreover, there are problems in the applicability of the resilience derived from the ecological domain to regional economic analysis. The institutional environment and cultural factors are important elements influencing regional economic resilience, but there is a lack of effective empirical analysis tools. Some of the current literature studies the resilience of local policy and institutional and cultural factors as they relate to regional economies through case studies, but it is difficult to analyze them quantitatively. Existing studies do not yet have effective measurement methods, and various quantitative and qualitative analyses have certain shortcomings, which is the biggest obstacle to studying institutional and cultural factors affecting regional economic resilience.
As this is an exploratory study, it is inevitable that important factors have not been taken into account or are difficult to quantify in the analysis model. The analysis in this paper is still limited, especially in terms of data collection. In the future, we should use a large number of questionnaires and in-depth interviews to quantify the indicators that are not easy to quantify, using the Likert scale to better integrate quantitative and qualitative research and analyze the factors influencing regional economic resilience in a more in-depth and comprehensive manner.

Author Contributions

The study was written by L.-L.K., W.-H.L. and reviewed by J.-T.P.; the data collection and analysis by Y.-H.L. The manuscripts were prepared by L.-L.K., and W.-H.L. All authors have read and agreed to the published version of the manuscript.

Funding

This research received no external funding.

Institutional Review Board Statement

Not applicable.

Informed Consent Statement

Not applicable.

Data Availability Statement

The data presented in this study are available on request from the corresponding author. The data are not publicly available, owing to privacy concerns.

Conflicts of Interest

The author declares no conflict of interest.

References

  1. Gunderson, L.H.; Holling, C.S. Panarchy: Understanding Transformations in Human and Natural Systems; Island Press: Washington, DC, USA, 2002. [Google Scholar]
  2. Walker, B.; Salt, D. Resilience Thinking: Sustaining Ecosystems and People in a Changing World; Island Press: Washington, DC, USA, 2006. [Google Scholar]
  3. IPCC. Climate Change the Physical Science Basis; AGUFM, 2007, U43D–01; IPCC: Geneva, Switzerland, 2007. [Google Scholar]
  4. Li, L.; Zhang, P.; Tan, J.; Guan, H. Evolution of resilience concept and progress in regional economic resilience. Hum. Geogr. 2019, 166, 1–7. [Google Scholar]
  5. Martin, R.; Gardiner, B. The resilience of cities to economic shocks: A tale of four recessions (and the challenge of Brexit). Pap. Reg. Sci. 2019, 98, 1801–1832. [Google Scholar] [CrossRef]
  6. Pendall, R.; Foster, K.A.; Cowell, M. Resilience and regions: Building understanding of the metaphor. Camb. J. Reg. Econ. Soc. 2009, 3, 71–84. [Google Scholar] [CrossRef] [Green Version]
  7. Martin, R.; Sunley, P. On the Notion of Regional Economic Resilience: Conceptualisation and Explanation. J. Econ. Geogr. 2015, 15, 1–42. [Google Scholar] [CrossRef] [Green Version]
  8. Holling, C.S. Engineering Resilience versus Ecological Resilience. In Engineering Within Ecological Constraints; The National Academies Press: Washington, DC, USA, 1996. [Google Scholar]
  9. Martin, R.; Sunley, P.; Gardiner, B.; Tyler, P. How Regions React to Recessions: Resilience and The Role of Economic Structure. Reg. Stud. 2016, 50, 561–585. [Google Scholar] [CrossRef] [Green Version]
  10. Martin, R.L. Regional economic resilience, hysteresis and recessionary shocks. J. Econ. Geogr. 2012, 12, 1–32. [Google Scholar] [CrossRef] [Green Version]
  11. Foster, K.A. A Case Study Approach to Understanding Regional Resilience; Institute of Urban and Regional Development, University of California: Berkeley, CA, USA, 2007. [Google Scholar]
  12. Hill, E.W.; Wial, H.; Wolman, H. Exploring Regional Economic Resilience; Working Paper 2008–04; Institute of Urban and Regional Development, University of California: Berkeley, CA, USA, 2008. [Google Scholar]
  13. Simmie, J.; Martin, R. The economic resilience of regions: Towards an evolutionary approach. Camb. J. Reg. Econ. Soc. 2010, 3, 27–43. [Google Scholar] [CrossRef] [Green Version]
  14. Modica, M.; Zoboli, R. Vulnerability, resilience, hazard, risk, damage, and loss: A socio-ecological framework for natural disaster analysis. Web Ecol. 2016, 16, 59–62. [Google Scholar] [CrossRef]
  15. Williams, N.; Vorley, T. Economic Resilience and Entrepreneurship: Lessons from the Sheffield City Region. Entrep. Reg. Dev. 2014, 26, 257–281. [Google Scholar] [CrossRef]
  16. Boschma, R.; Martin, R. Editorial: Constructing an evolutionary economic geography. J. Econ. Geogr. 2007, 7, 537–548. [Google Scholar] [CrossRef]
  17. Boschma, R.; Frenken, K. The Spatial Evolution of Innovation Networks: A Proximity Perspective; Edward Elgar Publishing: Cheltenham, UK, 2013. [Google Scholar] [CrossRef]
  18. Guan, H.; Yang, Q.; Hao, F.; Feng, Z. Economic resilience characteristics of Shenyang based on “industry-enterprise-space”. Acta Geogr. Sin. 2021, 76, 415–427. [Google Scholar]
  19. Hassink, R. Regional Resilience: A Promising Concept to Explain Differences in Regional Economic Adaptability? Camb. J. Reg. Econ. Soc. 2010, 3, 45–58. [Google Scholar] [CrossRef]
  20. Pike, A.; Dawley, S.; Tomaney, J. Resilience, Adaptation and Adaptability. Camb. J. Reg. Econ. Soc. 2010, 3, 59–70. [Google Scholar] [CrossRef]
  21. Boschma, R. Towards an Evolutionary Perspective on Regional Resilience. Reg. Stud. 2014, 49, 733–751. [Google Scholar] [CrossRef] [Green Version]
  22. Frenken, K.; Van Oort, F.; Verburg, T. Related Variety, Unrelated Variety and Regional Economic Growth. Reg. Stud. 2007, 41, 685–697. [Google Scholar] [CrossRef] [Green Version]
  23. Li, N.; Zhu, H. Regional Resilience and Path Creation: Foreign Experience and Chinese Reference. J. Hunan Univ. Econ. 2020, 17, 44–48. [Google Scholar]
  24. Percoco, M. Infrastructure and Economic Efficiency in Italian Regions. Netw. Spat. Econ. 2004, 4, 361–378. [Google Scholar] [CrossRef]
  25. Xu, Y.; Wang, C. Influencing factors of regional economic resilience under the background of financial crisis: A case study of Zhejiang Province and Jiangsu Province. Prog. Geogr. 2017, 36, 986–994. [Google Scholar]
  26. Lin, Q. Exploring the Regional Economic Resilience of Knowledge-Intensive Manufacturing Clusters from a Life Cycle Perspective: A Case Study of Hsinchu and Southern Science Park and Surrounding Areas. Master’s Thesis, Institute of Urban Planning, National Cheng Kung University, Tainan, Taiwan, 2019. [Google Scholar]
  27. Östh, J.; Reggiani, A.; Galiazzo, G. Spatial Economic Resilience and Accessibility: A Joint Perspective. Comput. Environ. Urban Syst. 2015, 49, 148–159. [Google Scholar] [CrossRef]
  28. Henderson, V. The Urbanization Process and Economic Growth: The So-What Question. J. Econ. Growth 2003, 8, 47–71. [Google Scholar] [CrossRef]
  29. Glaeser, E.; Kallal, H.D.; Scheinkman, J.; Shleifer, A. Growth in Cities. J. Political Econ. 1992, 100, 1126–1152. [Google Scholar] [CrossRef]
  30. Jacobs, J. Economy of Cities; Random House: New York, NY, USA, 1969. [Google Scholar]
  31. Storper, M.; Venables, A. Buzz: Face-to-face contact and the urban economy. J. Econ. Geogr. 2004, 4, 351–370. [Google Scholar] [CrossRef]
Figure 1. Possible development paths after impact [13].
Sustainability 15 02462 g001
Figure 2. Impact period and recovery period of the designated industrial parks.
Sustainability 15 02462 g002
Figure 3. Four quadrant schematic diagram.
Sustainability 15 02462 g003
Figure 4. Resilience of industrial parks during the financial tsunami.
Sustainability 15 02462 g004
Figure 5. Resilience of industrial parks during the one-off period.
Sustainability 15 02462 g005
Figure 6. Resilience of industrial parks during the novel coronavirus COVID-19 outbreak.
Sustainability 15 02462 g006
Table 1. Indicators and sources of information for assessing the economic resilience of industrial parks.
Classification-OrientedEvaluation MetricsMeasure VariablesPeriod of InformationSource
Foundations for regional developmentLocation conditionsDistance from nearby interchange2020Economic Geographic Information System
Industrial structureNumber of new entrantsNumber of new factory registrations2008~2021Bureau of Industry, Ministry of Economic Affairs
Inventory of factories in production
Industrial structure relatedRelevant diversity index2008~2021This study calculates
Introduction to the industrial zone
Non-correlated diversity index2008~2021This study calculates
Introduction to the industrial zone
Specialization index2008~2021This study calculates
Introduction to the industrial zone
Leading industry typeLivelihood industry ratio2008~2021This study calculates
Introduction to the industrial zone
Chemical industry ratio2008~2021This study calculates
Introduction to the industrial zone
Metal machinery industry2008~2021This study calculates
Introduction to the industrial zone
Information electronics industry2008~2021This study calculates
Introduction to the industrial zone
Enterprise competitiveness and labor statusRegional innovationAverage R&D expenditure2008~2019
[14]
Factory calibration and operation
Survey data
Number of patent applications2018~2020Economic Geographic Information System
Human capitalPopulation above university within 10 km2020Economic Geographic Information System
Government governance and
Policy regime
Financial situationRatio of own resources2008~2020“Republic of China Statistical Information Network” county and city important statistical indicators query system
The degree of economic opennessNumber of import and export manufacturers2018Economic Geographic Information System
Table 2. Economic resilience of industrial parks (2008–2021).
Industrial ParkS1R1S2R2S3R3Industrial ParkS1R1S2R2S3R3
Mei-hun−1.64−1.16−1.19−1.12−1.12−1.11Pitou−1.00−0.48−0.55−1.23−1.51−1.14
peace0.05−2.90−3.97−3.25−3.30−1.68Tanaka−1.001.271.49−0.36−0.070.31
Guanghua Lohas−2.021.572.091.241.291.17Fangyuan−2.292.503.202.092.390.62
Fengle2.66−0.41−0.30−0.83−0.88−0.58Nangang−1.08−0.99−0.98−0.78−0.780.41
Ronde−1.091.822.391.802.051.89Zhushan−1.001.562.071.321.381.77
Leze1.6611.8914.4813.3513.7812.99Dou Six2.21−2.05−2.26−1.94−1.96−1.91
Dawu Lun0.751.081.501.592.401.15Cloud Science and Engineering0.692.414.183.323.442.49
Ruifang−0.74−0.100.080.530.57−1.87Toyota2.16−2.61−2.94−1.22−1.22−1.21
New Taipei1.080.791.150.630.670.58Yuan length3.84−1.19−1.23−0.44−0.43−0.46
Tucheng0.690.31−0.330.610.650.50Yunlin Islands−1.00−1.00−1.00−1.00−1.00−1.00
woods−1.00−1.88−1.720.210.240.23Minxiong−2.290.130.27−0.14−0.121.11
Guan yin−1.20−0.49−0.43−0.57−0.56−0.58Head bridge−0.66−1.15−0.98−1.60−1.610.05
Linkou Gong II−0.89−1.17−1.211.101.100.20Puzi−1.97−0.70−1.54−1.41−1.422.58
Linkou Gong III−0.89−1.63−1.760.620.712.33Yizhu−0.08−0.83−1.22−1.17−1.17−0.33
Kameyama0.871.431.740.430.460.79Kata0.37−2.77−3.12−2.06−2.04−1.98
Pingzhen1.03−3.66−2.66−1.90−1.92−1.87New Battalion−0.790.17−0.82−1.09−1.35−1.36
Peach young0.79−2.59−2.30−0.88−0.88−1.18Guantian0.740.010.21−1.10−1.09−1.39
Big Garden−0.595.086.304.144.273.99Yongkang−0.16−1.07−0.81−0.85−0.85−0.75
Naka-ri0.212.082.700.34−0.56−0.59Southern Science and Technology1.333.784.743.633.803.39
Hsinchu0.40−0.78−0.87−0.82−0.49−0.52Anping−1.00−0.55−0.72−1.00−1.00−1.00
Head portion−3.33−2.43−2.15−1.76−1.78−2.05Yongan−0.90−0.52−1.54−1.41−1.420.58
gong0.36−2.45−2.74−2.29−2.32−1.98Facing the sea0.31−0.36−0.44−0.080.04−0.26
Zhunan−1.52−1.80−1.96−1.54−1.56−1.11Daihatsu−1.311.752.303.212.732.16
Nail young−0.99−0.41−0.27−0.05−0.03−0.74Fengshan1.87−2.40−2.68−1.22−1.23−1.21
Taichung Port−0.39−0.40−1.38−0.19−0.17−0.14Renmu−0.84−0.691.030.530.570.49
Taichung0.75−1.48−1.85−1.35−1.44−1.36Taisha−1.00−0.28−0.13−0.34−0.35−0.38
Dali −1.562.80−8.022.452.542.35Forest Garden−1.38−0.79−0.740.120.420.54
Quanxing1.28−1.70−1.84−1.64−1.65−0.89Pingtung−1.960.650.98−0.79−0.78−0.80
Shohama−0.111.041.451.891.971.81Pingnan−3.541.902.341.603.413.17
Fuxing−2.080.350.41−0.21−0.08−0.49Neipu1.37−0.48−2.06−0.92−0.92−0.64
Table 3. Eigenvalues and ‘Wilks’ λ for the whole region of financial shocks.
Characteristic Value‘Wilks’ λ
CodeCharacteristic ValueFunctionCharacteristic ValueFunctionCharacteristic ValueFunctionCharacteristic ValueFunctionCharacteristic Value
10.75148.548.50.6551 to 30.29463.069330.001
20.51233.181.50.5822 to 30.51434.234200.025
30.28618.5100.00.47130.77812.94690.165
Table 4. Policy shock all-region eigenvalues and ’Wilks’ λ.
Characteristic Value‘Wilks’ λ
CodeCharacteristic ValueVariables%Cumulative %Typical CorrelationFunction VerificationWilk’s LambdaCardinality CheckDegree of FreedomSignificance
10.58854.354.30.6091 to 30.41046.340300.029
20.38935.990.30.5292 to 30.65122.286180.220
30.1059.7100.00.30930.9055.21380.735
Table 5. Eigenvalues and ‘Wilks’ λ in the northern part of the outbreak impact.
Characteristic Value‘Wilks’ Λ
CodeCharacteristic ValueFunctionCharacteristic ValueFunctionCharacteristic ValueFunctionCharacteristic ValueFunctionCharacteristic Value
14.16364.764.70.8981 to 20.05933.915220.050
22.27035.3100.00.83320.30614.216100.163
Table 6. Table of discriminant function coefficients for each shock.
Discriminant VariablesStandardized Normalized Discriminant Function Coefficient
Financial Shock across the RegionPolicy Impact across the RegionEpidemic Hits Northern District
12312312
Ratio of Owned Financial Resources−0.380−0.3650.591−0.0270.746−0.552−1.422−4.222
Number of new factory registrations0.646−0.5381.2120.1671.1700.0901.3060.324
Patents −0.5330.596
Average R&D expenses0.2020.0750.348
Over-university population0.017−0.319−0.517−1.1590.0510.6630.1432.314
Distance from nearby AC−0.129−0.2250.082−0.1510.205−0.2522.0160.045
Related Diversity1.6923.4352.6593.3033.0233.0562.3885.838
Non-relevant diversity1.8962.3113.1232.4553.4793.5813.3156.827
Professionalism0.1430.441−0.2290.155−0.105−0.6142.4961.068
People’s livelihood0.5410.6280.379
Chemistry −0.509−0.7970.0852.9213.218
Metal0.4960.759−0.480−0.418−0.961−0.4950.861−0.758
Electronic0.793−0.131−0.740−0.005−0.453−0.5513.0380.827
Disclaimer/Publisher’s Note: The statements, opinions and data contained in all publications are solely those of the individual author(s) and contributor(s) and not of MDPI and/or the editor(s). MDPI and/or the editor(s) disclaim responsibility for any injury to people or property resulting from any ideas, methods, instructions or products referred to in the content.

