1. Introduction
In the past decade, the worldwide construction sector has experienced explosive growth, and safety management on building sites has become a top priority. However, accidents continue to occur in these locations and are frequently undetected or noticed extremely late. According to the Saudi Arabian Health and Safety Association, commercial and public sector workplace injuries in 2016 totaled over 67,000 and related medical treatment cost over SAR 370 million [
1]. Minor and significant injuries on the job have ramifications for the workers, their families and the project’s schedule and budget. Therefore, there have been many efforts in recent years to make construction sites safe, productive and smart.
Construction sites are known to be highly hazardous environments due to their dynamic and temporary nature. Some studies showed that accidents at construction sites can be caused by many factors, as follows [
2,
3]: lack of awareness and experience among workers, lack of safety training among workers, workers not wearing personal protective equipment (PPE), no safety officer located in danger zones and machinery defects and errors. Construction workers are involved in many activities that might expose them to risks and accidents. Some of the hazards on construction sites may involve falling from heights, being electrocuted, being struck by heavy equipment or falling materials, being caught in equipment and many more, depending on the nature of the site [
3]. Those accidents can be prevented by following safety policies and rules such as providing appropriate safety training for the workers, monitoring PPE compliance, regularly inspecting machines for defects and errors, identifying danger zones and assign a safety officer to each danger zone [
2]. Despite all the efforts that have been conducted by the authorities to reduce accidents and manage safety, it is still a complex task that needs to be accomplished manually.
The safety and wellbeing of employees are essential targets for a successful project [
4]. Employees’ overall health is crucial for authorities when approving and monitoring a project. On the other hand, accidents can lead to complications or failures related to the employees or the project. In general, construction sites pose a high risk to employees’ health and wellbeing, which is mainly related to accidents. The procedures and factors involved in predicting such a risk are quite diverse and complex, to be observed and analyzed manually. In the future, computer vision and deep learning algorithms can be used to analyze, identify and predict the hazards to be avoided, eliminated or reduced.
The study of construction safety algorithms and approaches began decades ago. Regarding the subject of construction safety management, researchers have employed numerous computer vision and machine learning approaches, including YOLO, Fast-RNN and many more. The most significant component of this process is obtaining accurate resultsn a fair amount of time, which pushes researchers to focus their efforts on the development of procedures that will lead to greater accuracy. This section is devoted to providing a concise summary of the most recent attempts and strategies that have been presented in the past few years.
In 2019, Zhang et al. [
5] proposed a framework to manage safety on construction sites based on computer vision and a real-time location system. Imagery data collected from on-site cameras were analyzed using Fast R-CNN to detect and classify objects and determine the danger zones. The location of workers could be tracked using Bluetooth Low Energy devices attached to their safety equipment. If a dangerous situation was detected, the workers were notified through a loud sound and vibration by their mobile, which was paired with their Bluetooth devices. This framework was useful for proactive safety management and it was cost efficient. However, due to the fact that construction sites are noisy environments, the warning sound might not be heard. One way to solve this issue is to use a light strip attached to the safety vest instead.
In 2019, Wang et al. [
6] proposed a methodology to predict safety hazards on construction sites based on deep learning and computer vision. They used 2410 images from construction site surveillance cameras as a training and testing dataset. These images contained construction workers and five types of heavy equipment. The first step of the methodology was to extract and detect workers and equipment from images using faster R-CNN. Then, the danger zone was specified for the equipment, and the trajectory of the workers was predicted using the DeepSORT framework and Kalman filter. Based on the result of the second step, the spatial–temporal relation between the workers and the equipment was analyzed, and the hazards were predicted. The proposed method obtained a high accuracy, 95%, for detecting the workers and equipment while the accuracy of assigning the safety status to the workers was 87.45%.
In 2019, Zhao et al. [
7] proposed a method to detect safety officers and track pedestrians on construction sites based on deep learning. They combined multiple datasets of humans, vests and helmets. YOLO-v3 was used to detect safety officers using their helmets and reflective vest, while the Kalman filter and Hungarian algorithm were used for pedestrian tracking. The precision of detecting pedestrians, helmets and vests was 89%, 84% and 94%, respectively. Moreover, it maintained a high detection speed, close to the real-time requirement, with 18 frames/second.
In 2020, Nipun et al. [
8] proposed three models based on YOLO-v3 and machine learning classifiers to check whether workers were wearing their PPE. They used Pictor-v3 as a training dataset for their three models. In this study, the authors focused on detecting hats and vests, but the model could be scaled to detect other PPE, such as gloves and glasses. The first model detected the workers and the PPE first, and then NN and DT were used to check if the workers wore the detected PPE or not. The second model localized the workers and directly classified them based on their PPE into one of four classes: workers not wearing a hard hat or vest (W), workers wearing just a hard hat (WH), workers wearing just a vest (WV), and workers wearing both a hard hat and vest (WHV). In the third model, all the workers were detected, then a CNN classifier was applied to classify the workers into the W, WH, WV and WHV classes. Among these three models, the second one gave the best performance with 72.3% mAP, followed by the third model with 67.93%. On the other hand, the first model gave the fastest performance with 13 FPS.
In 2020, Delhi et al. [
9] proposed a framework to check the PPE compliance in real time to ensure the safety of construction workers. The authors trained the model using manually collected images from construction sites and the Internet. The framework was based on CNN and YOLO-v3 deep learning networks and focused on detecting hard hats and safety jackets. It classified the detected workers into four categories: not safe, safe, no hard hat and no jacket. When the detected worker fell into the not safe category, an alarm and time-stamped report were generated. The accuracy of the proposed model was 96.92%, and the average precision was 0.98.
The above methods provided a solution to construction site safety management, but with some limitations. Some systems focused solely on detecting PPE compliance without providing a method to notify safety officers, so countermeasures could be taken. Furthermore, weather conditions play an important role in safety management, particularly in harsh environments such as deserts. Working around heavy equipment in high winds and gusts is extremely dangerous. No method took the weather into account as a risk factor.
The related work put a spotlight on developing an approach based on computer vision and deep learning, by considering how to improve some of the limitations of the approaches mentioned above.
The purpose of this research can be summarized as follows:
Building our own dataset: The performance of any deep learning model relies significantly on the quality of the training data. Construction sites are dynamic, so we built a dataset that combines images from existing datasets (Pictor-v3 TTM, Construction-YOLOv5 and ACID) and self-captured images from local construction sites to include different weather conditions.
Image preprocessing: Image augmentation techniques are used in this project to produce different scales of the images to enlarge the dataset size. This helps deal with different CCTV cameras positions later in the deployment.
Object detection model: In this project, we do not propose a new architecture for YOLO, but, instead, we investigate the latest version of YOLO, version 5, which has not been tested with construction site data.
Weather conditions: In construction sites, weather conditions play an important role in the project’s progress. Wind speed and gusts are important factors in determining when to stop lifting activities, and temperature determines when to stop construction activities in general. In this project, we connect a weather API to our system to identify hazardous situations.
2. Materials and Methods
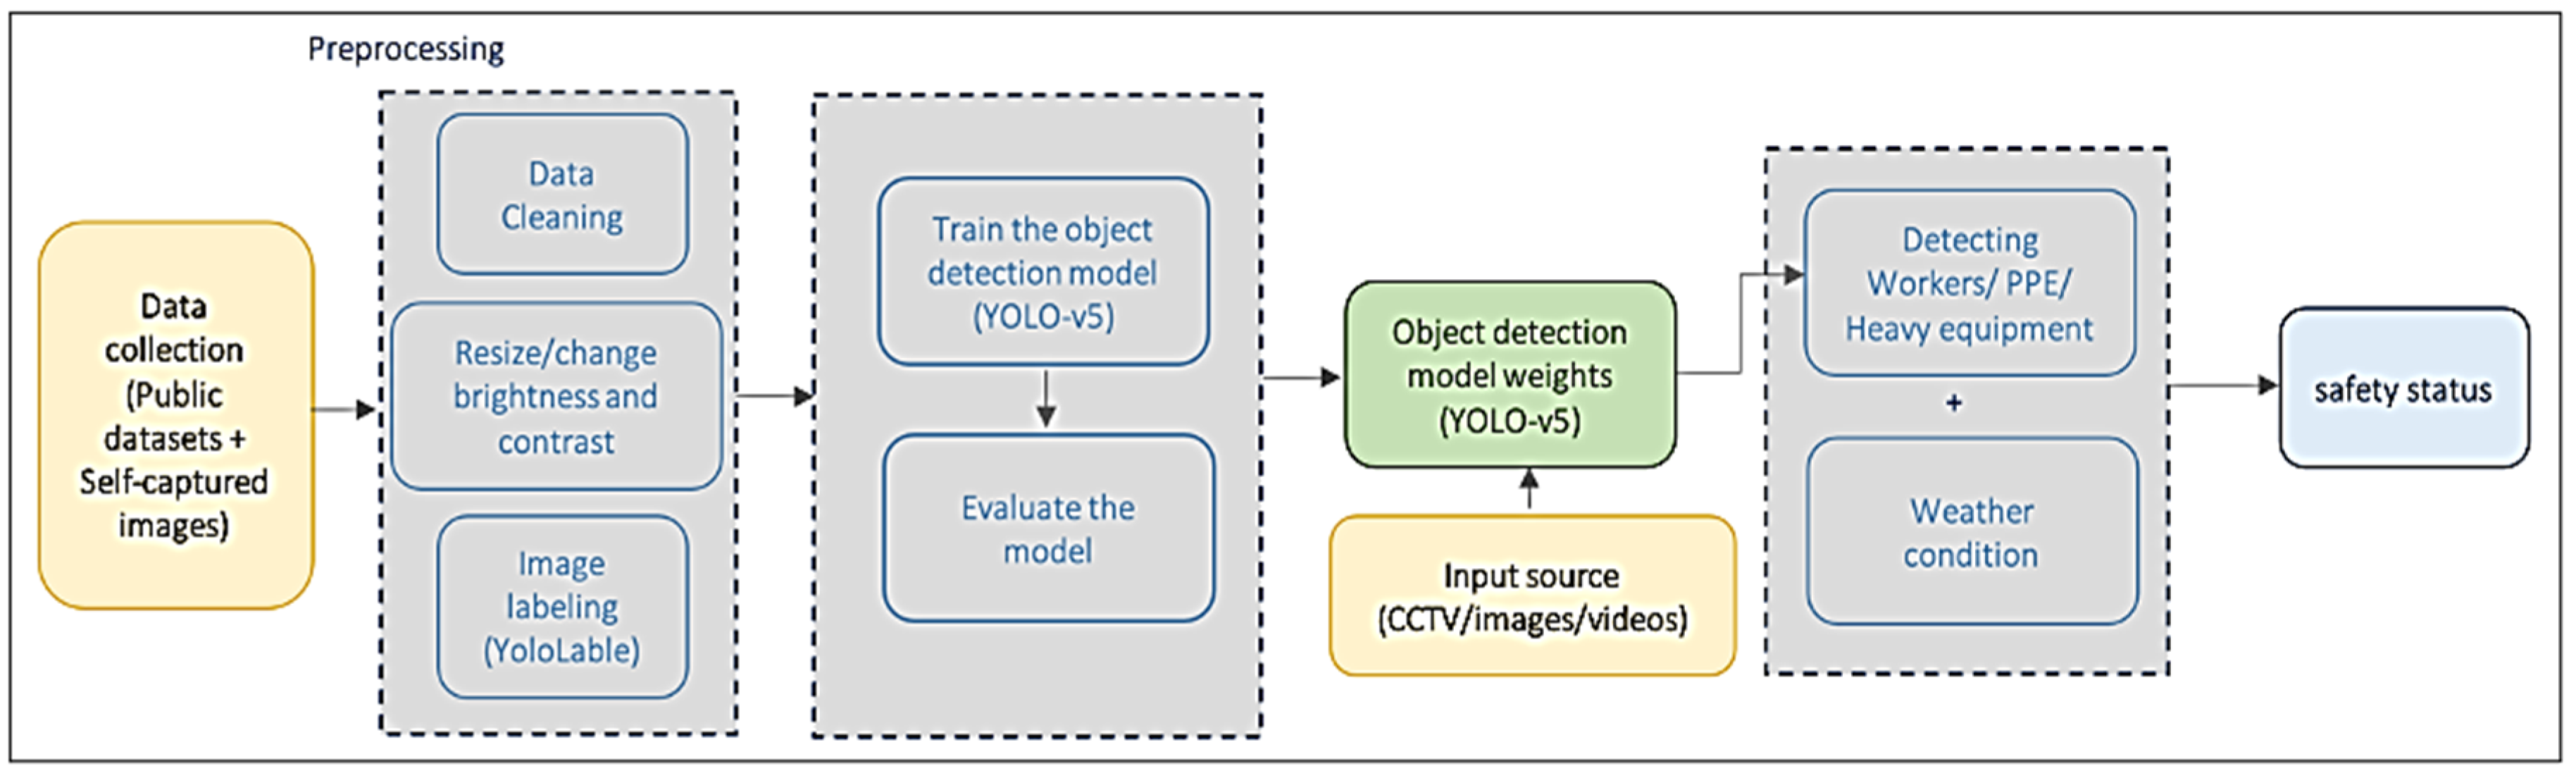
The primary goal of this project is to improve hazard identification by combining existing models with data preprocessing techniques to reach high accuracy. The methodology of the proposed project consists of the following main steps, where each step is responsible for a specific task.
Figure 1 shows an overview of the proposed system.
Imagery data are collected to build the training and validation datasets.
YOLO-v5 algorithm is used for object detection.
The model is trained to recognize PPE and heavy equipment using our datasets.
Weather conditions obtained from the API is used to predict the wind speed and temperature hazards.
Hazards are identified based on the status of the workers (if they are wearing the appropriate PPE or not), the type of equipment around them and the weather conditions.
When a hazard is identified, the safety officer is notified to prevent the accident.
2.1. Dataset of the Study
Training an object detector is a supervised learning problem. For that, we need to specify a dataset to train our model. The following describes the process of building the dataset.
2.2. Data Collection
The choice of the dataset is an important factor in the accuracy and reliability of the model. To conduct our experiment, two datasets were used, one for detecting workers and PPE and the other for detecting heavy equipment. Worker/PPE dataset images were collected from Pictor-v3 dataset (from [
10]) and self-captured images.
Figure 2 shows sample of Pictor-v3 dataset images.
Our collected dataset contains 826 images with 5241 instances of three categories: workers, safety helmets and reflective vests.
Table 1 shows the number of cases across different classes.
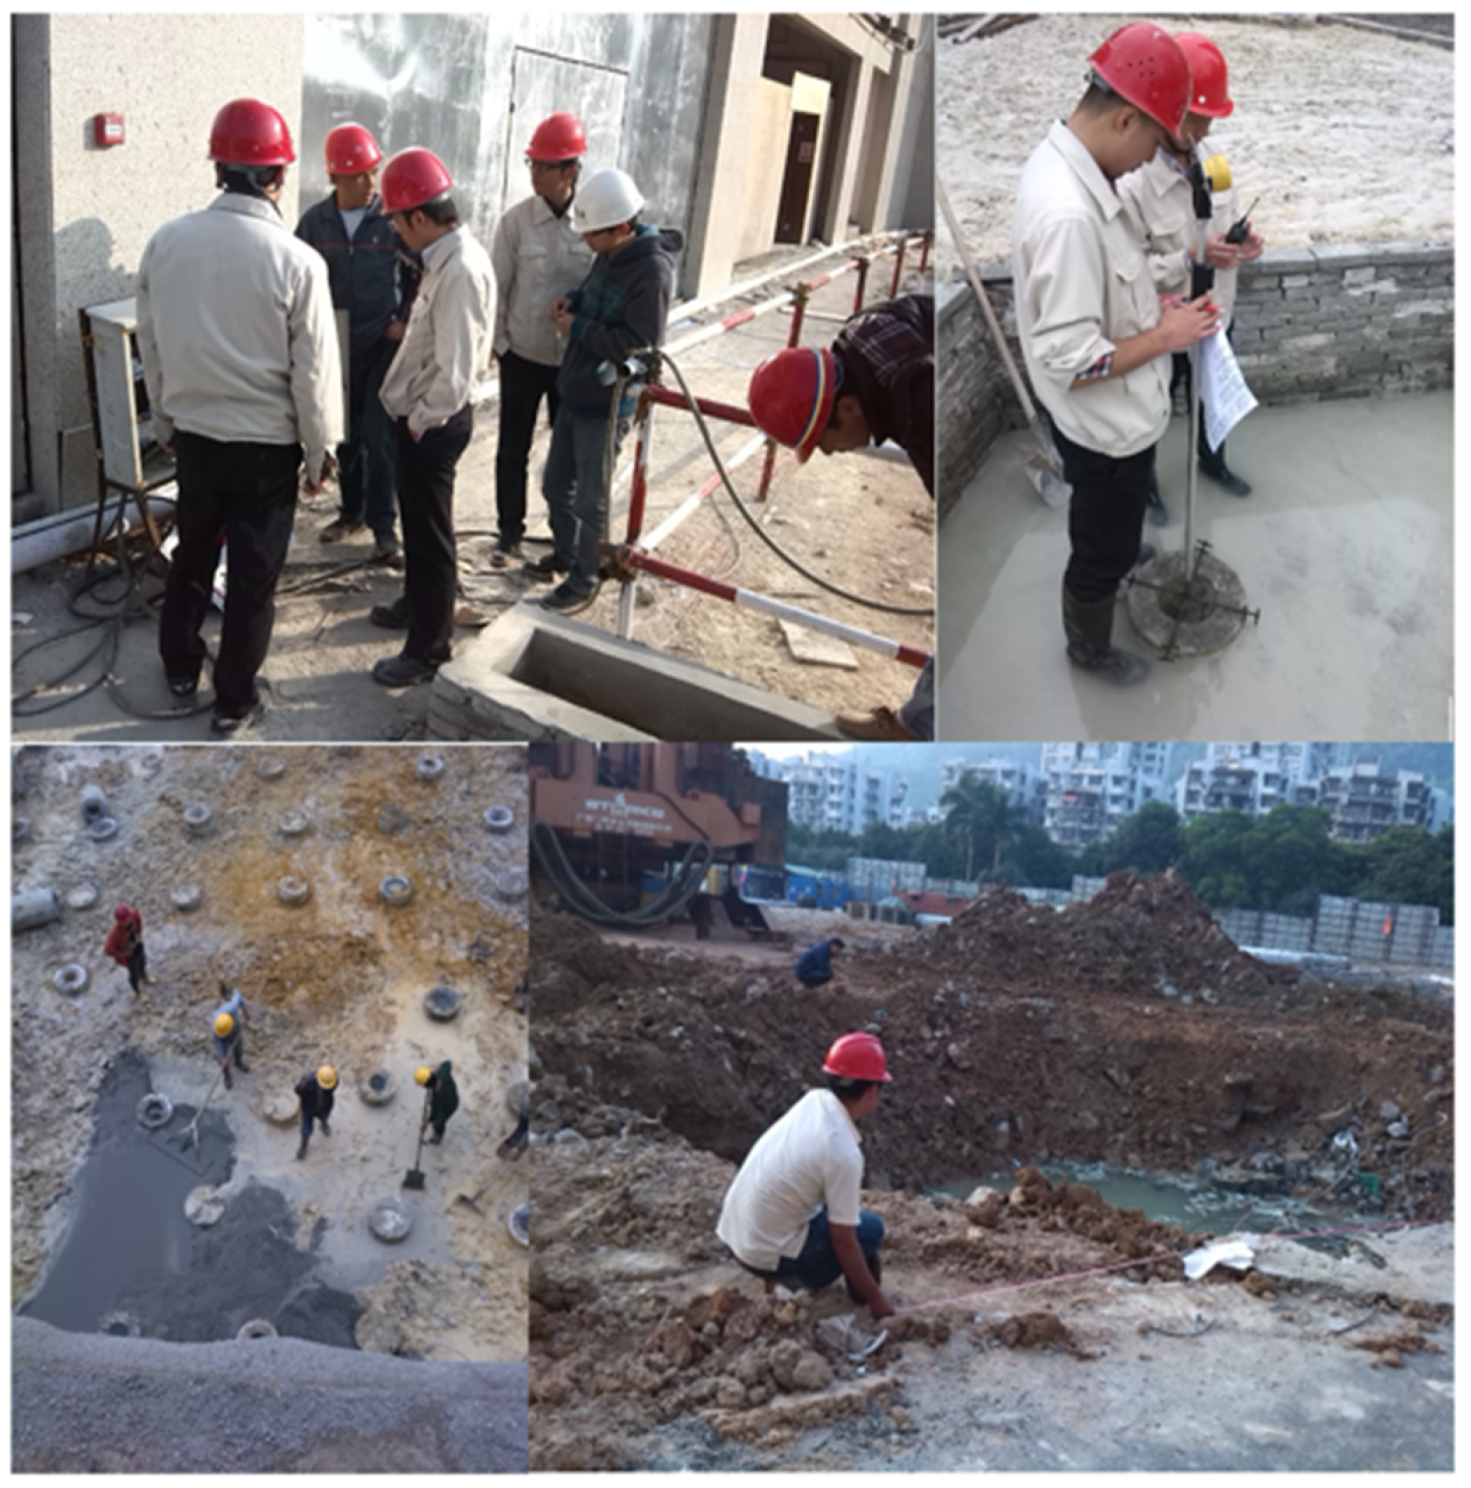
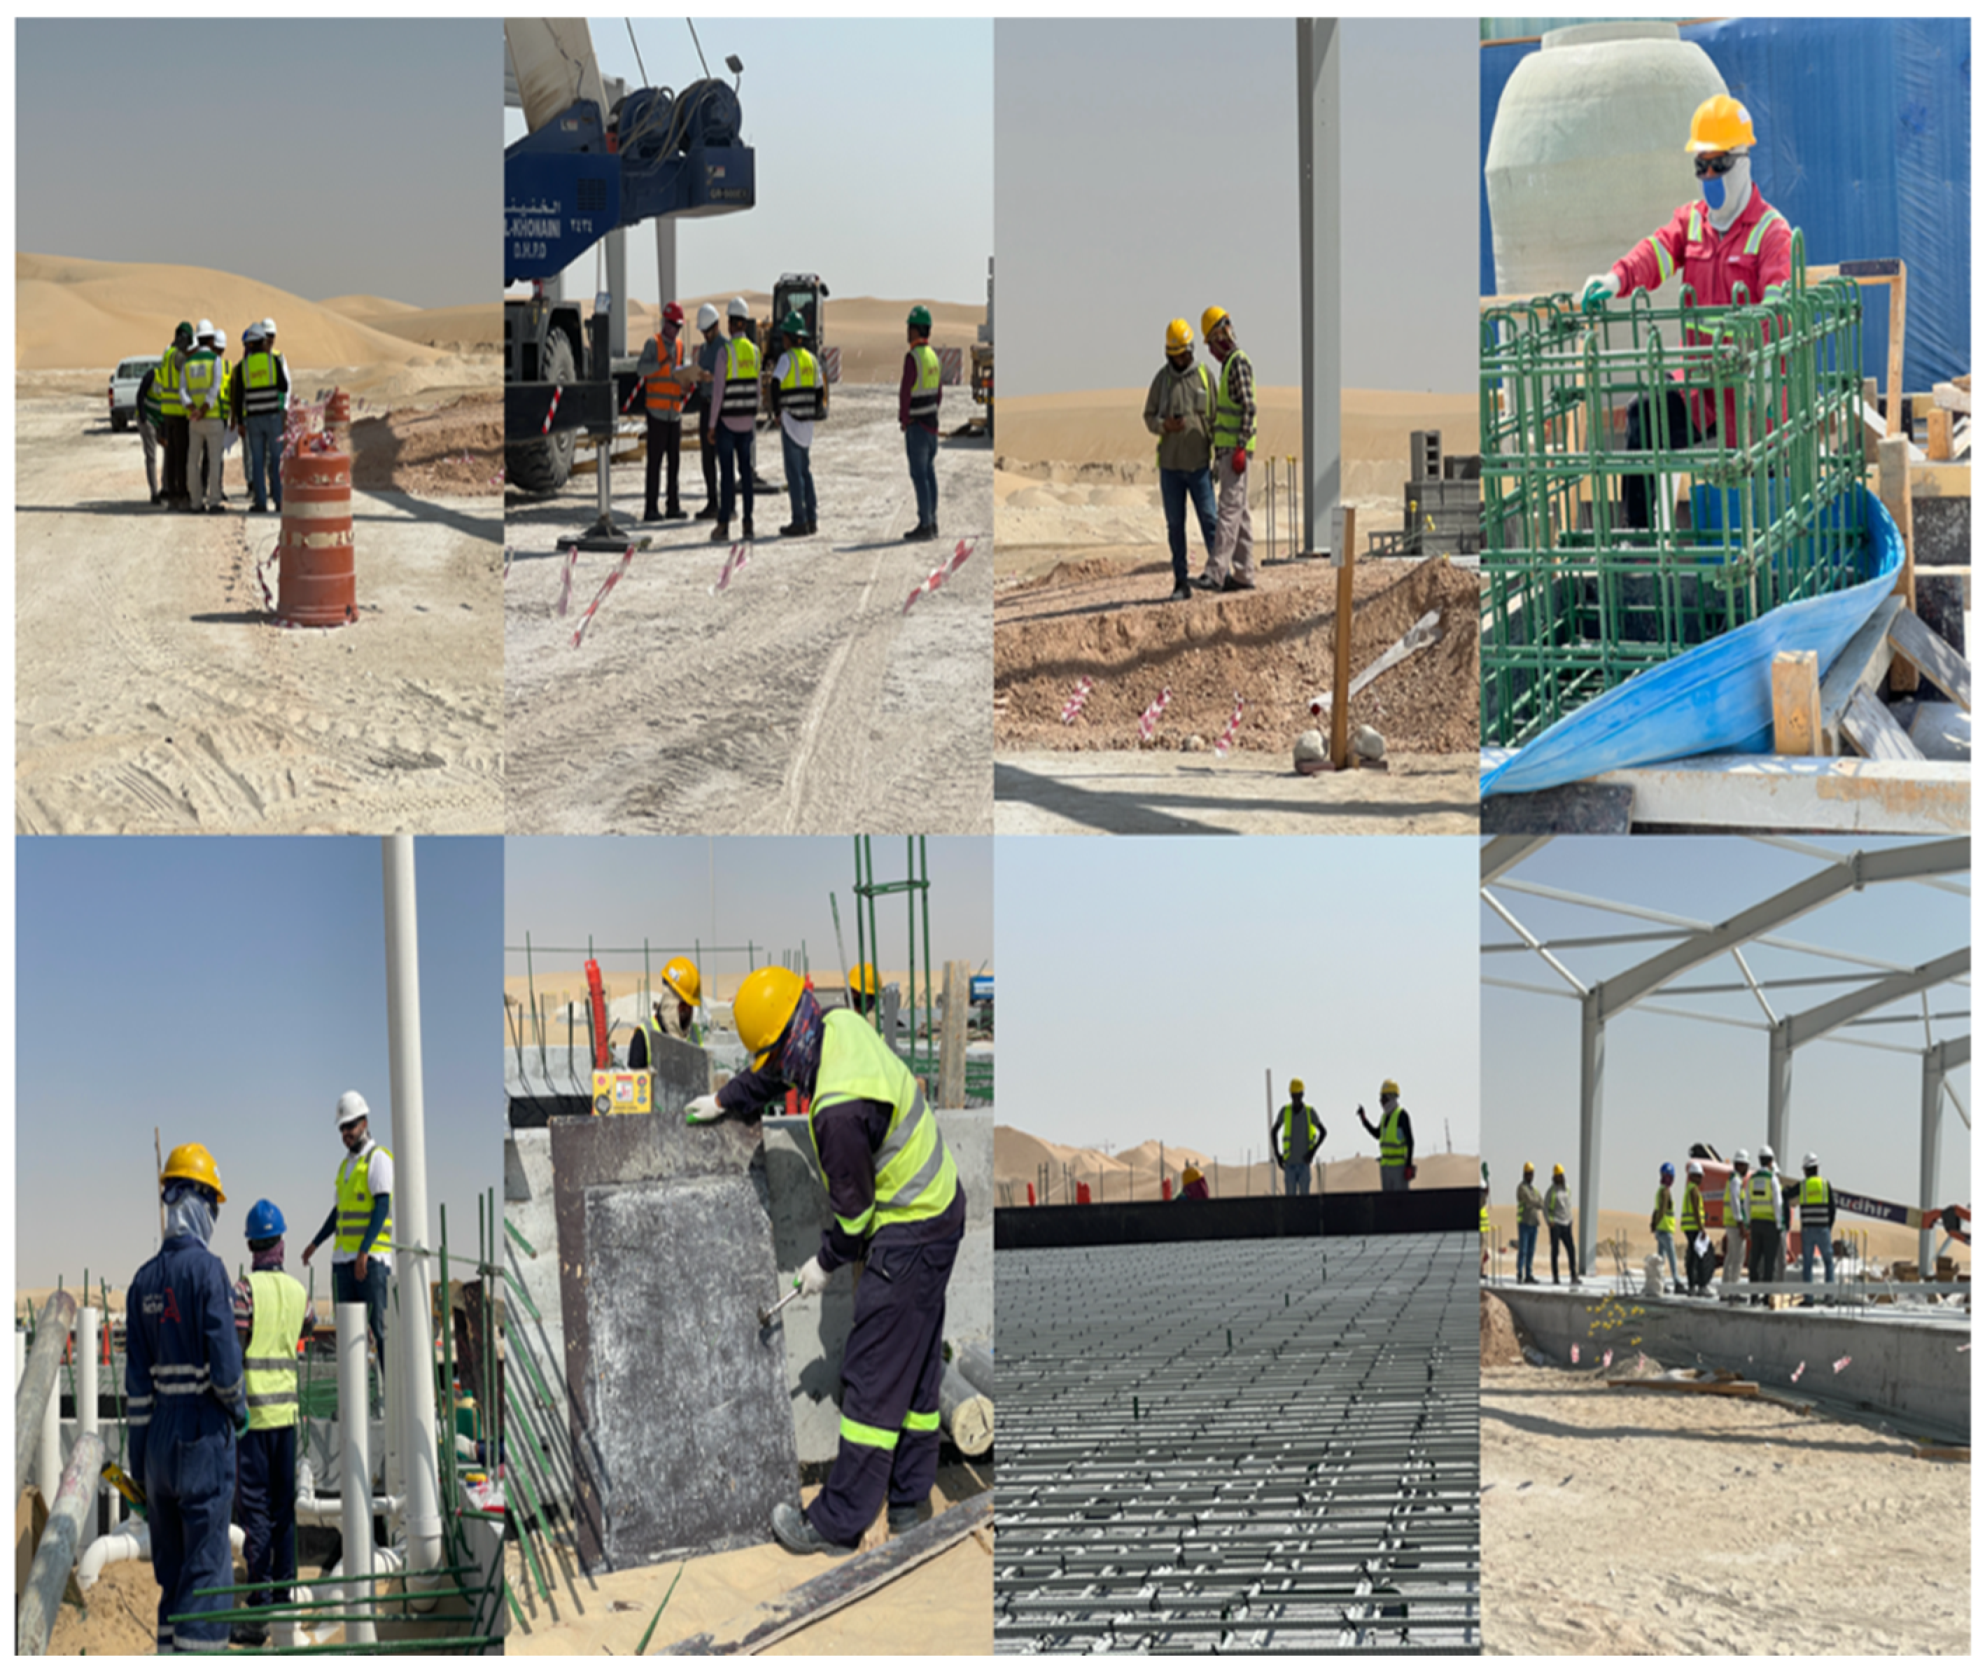
Figure 3 shows an example of self-captured images.
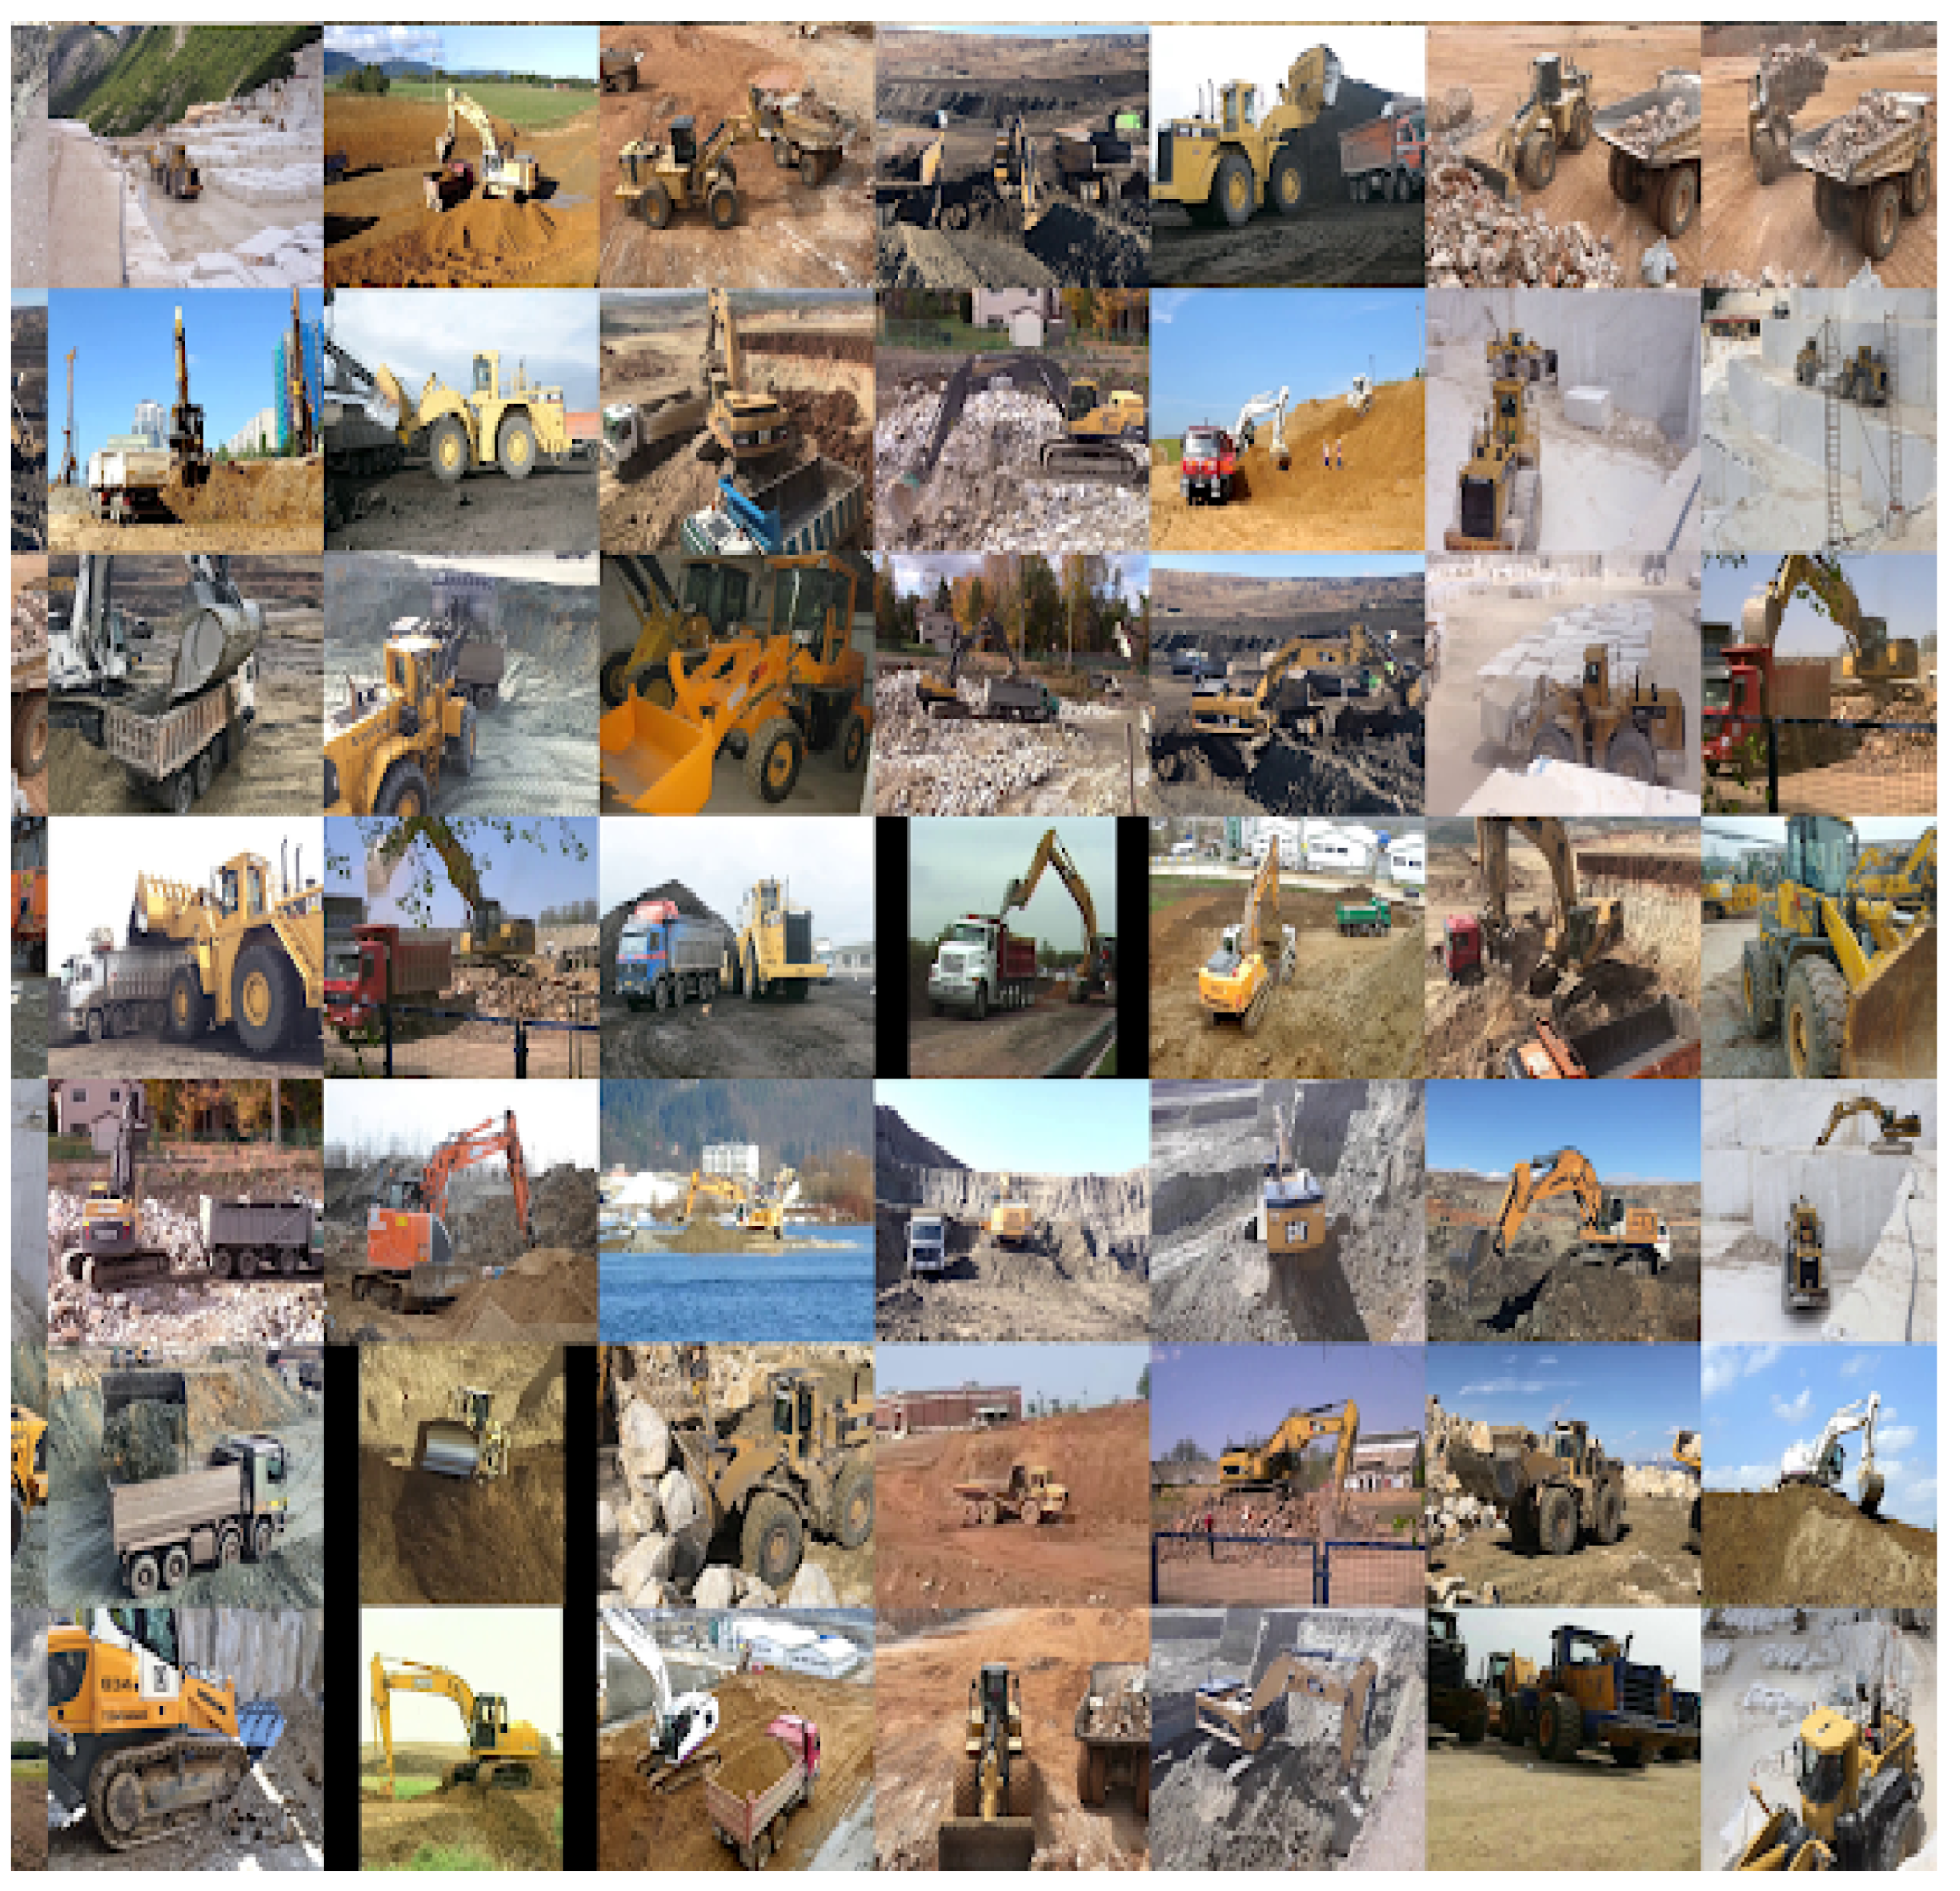
The heavy equipment dataset images were collected from publicly available datasets: ACID [
11], TTM [
12] and Construction-YOLOv5 [
13]. Each dataset contains different classes of heavy equipment, and seven classes of the most commonly used heavy equipment were chosen.
Figure 4 shows samples of images of the datasets.
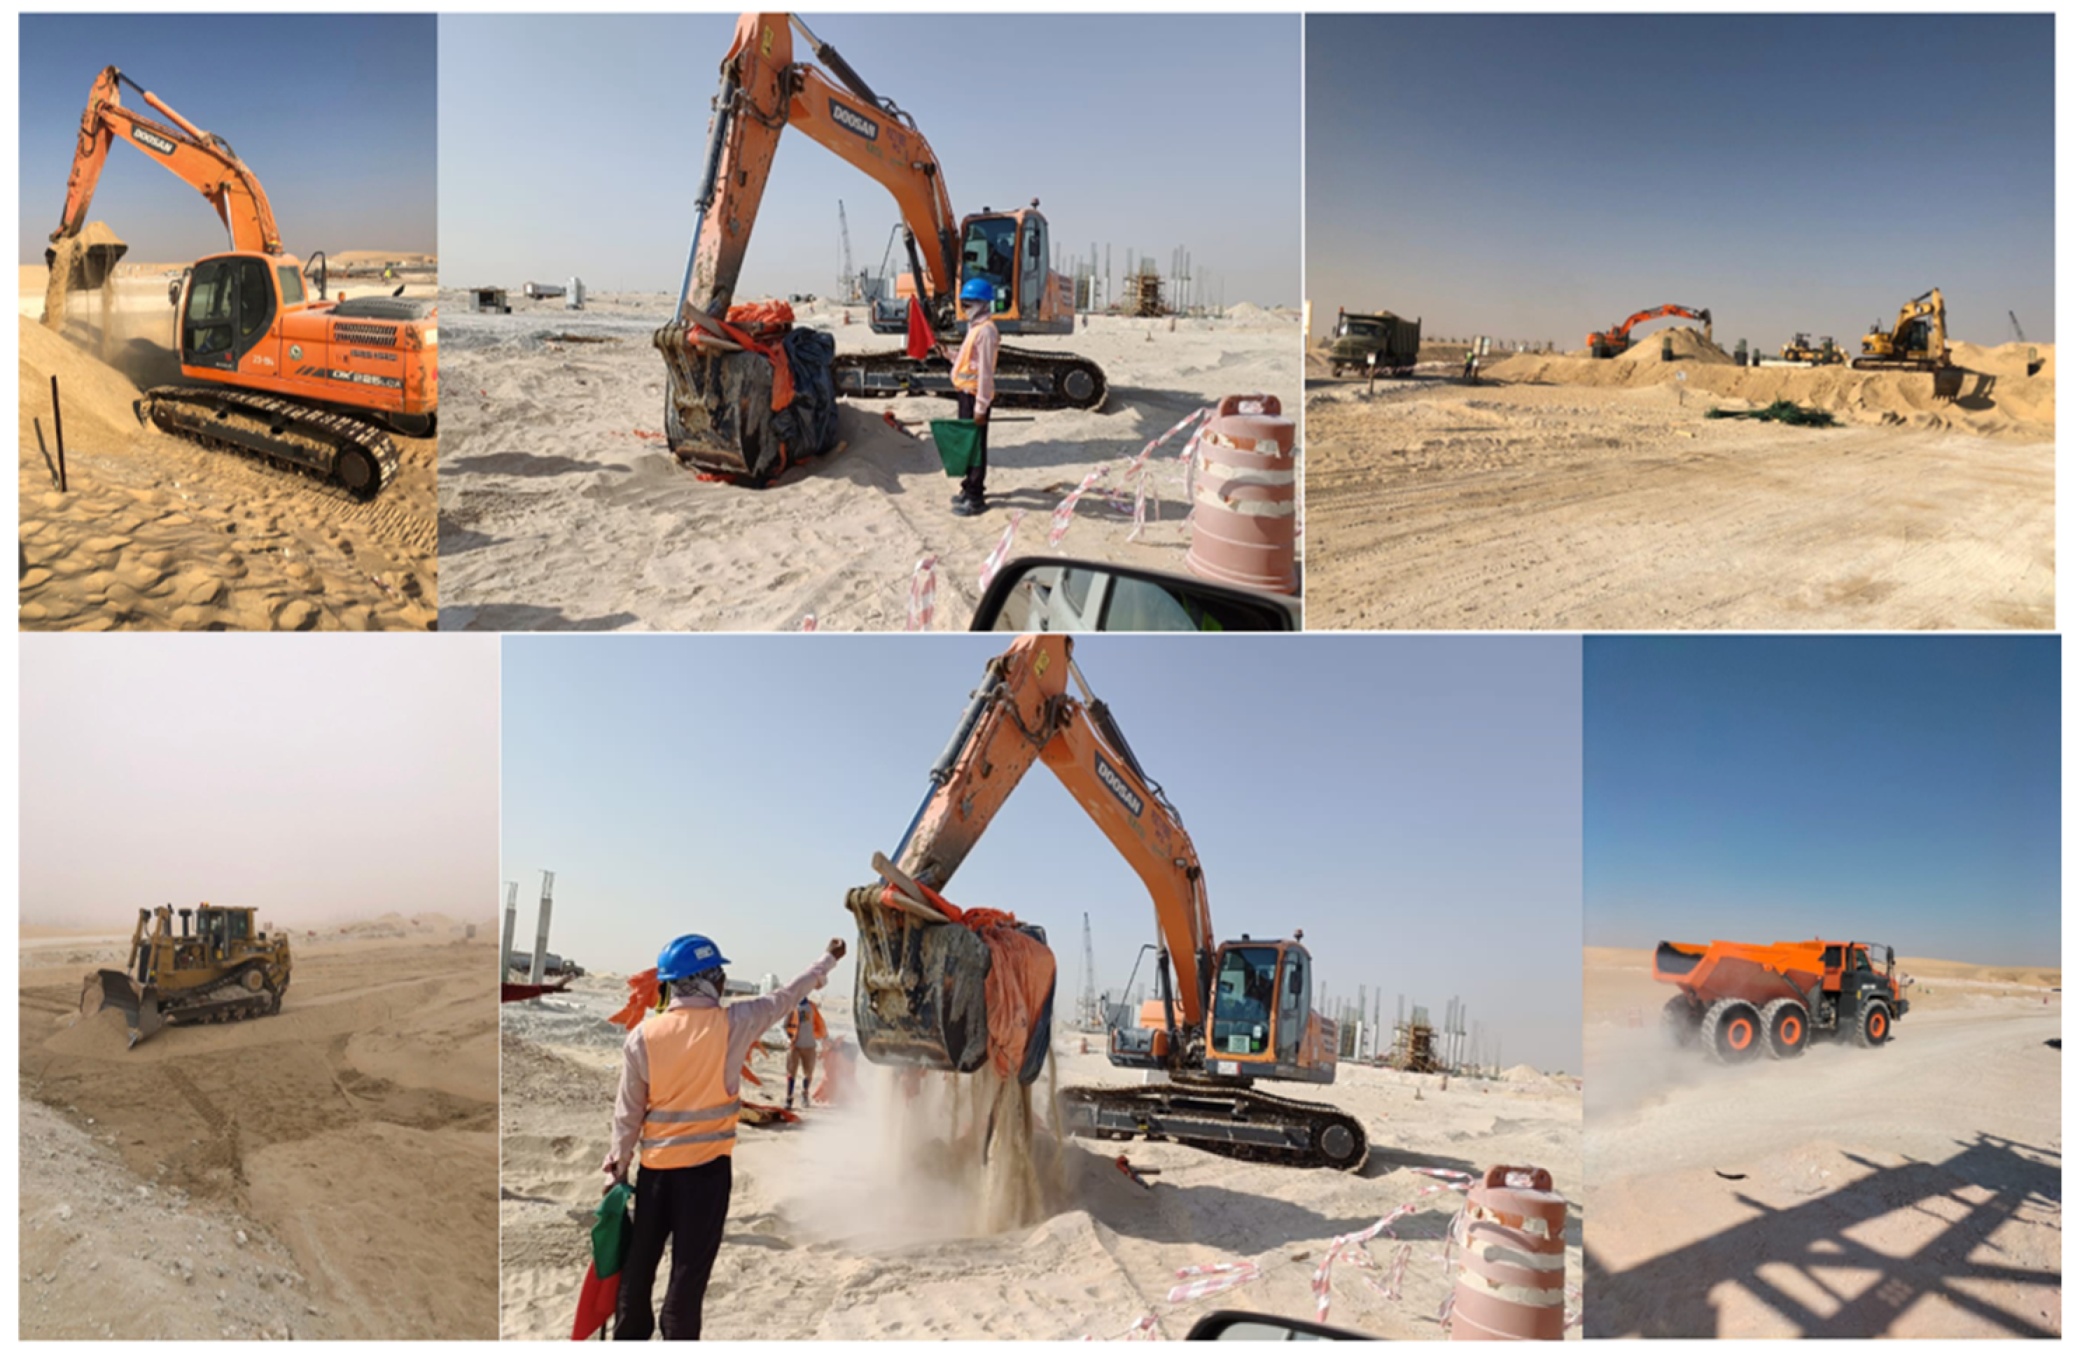
In addition to these datasets, self-captured images from local construction sites were collected. Our dataset contains 6338 photos with 9701 cases of seven classes of the most commonly used heavy equipment in construction sites: bulldozer, dump truck, excavator, grader, loader, mobile crane and roller.
Figure 5 shows example of self-captured images.
Table 2 shows the number of instances across the seven classes.
2.3. Data Cleaning
After data collection, the data were cleaned to remove invalid data. This step involved the elimination of duplicate images and images that violate the privacy of the construction company. The two datasets were cleaned manually by removing duplicate and low-quality photos.
2.4. Image Preprocessing
Before providing the object detection model with images as inputs, these input images have to be preprocessed. All the photos in the dataset were resized to the shape 416 × 416. Another preprocessing step in the dataset was changing the brightness and contrast of some images to enhance them.
2.5. Image Labeling
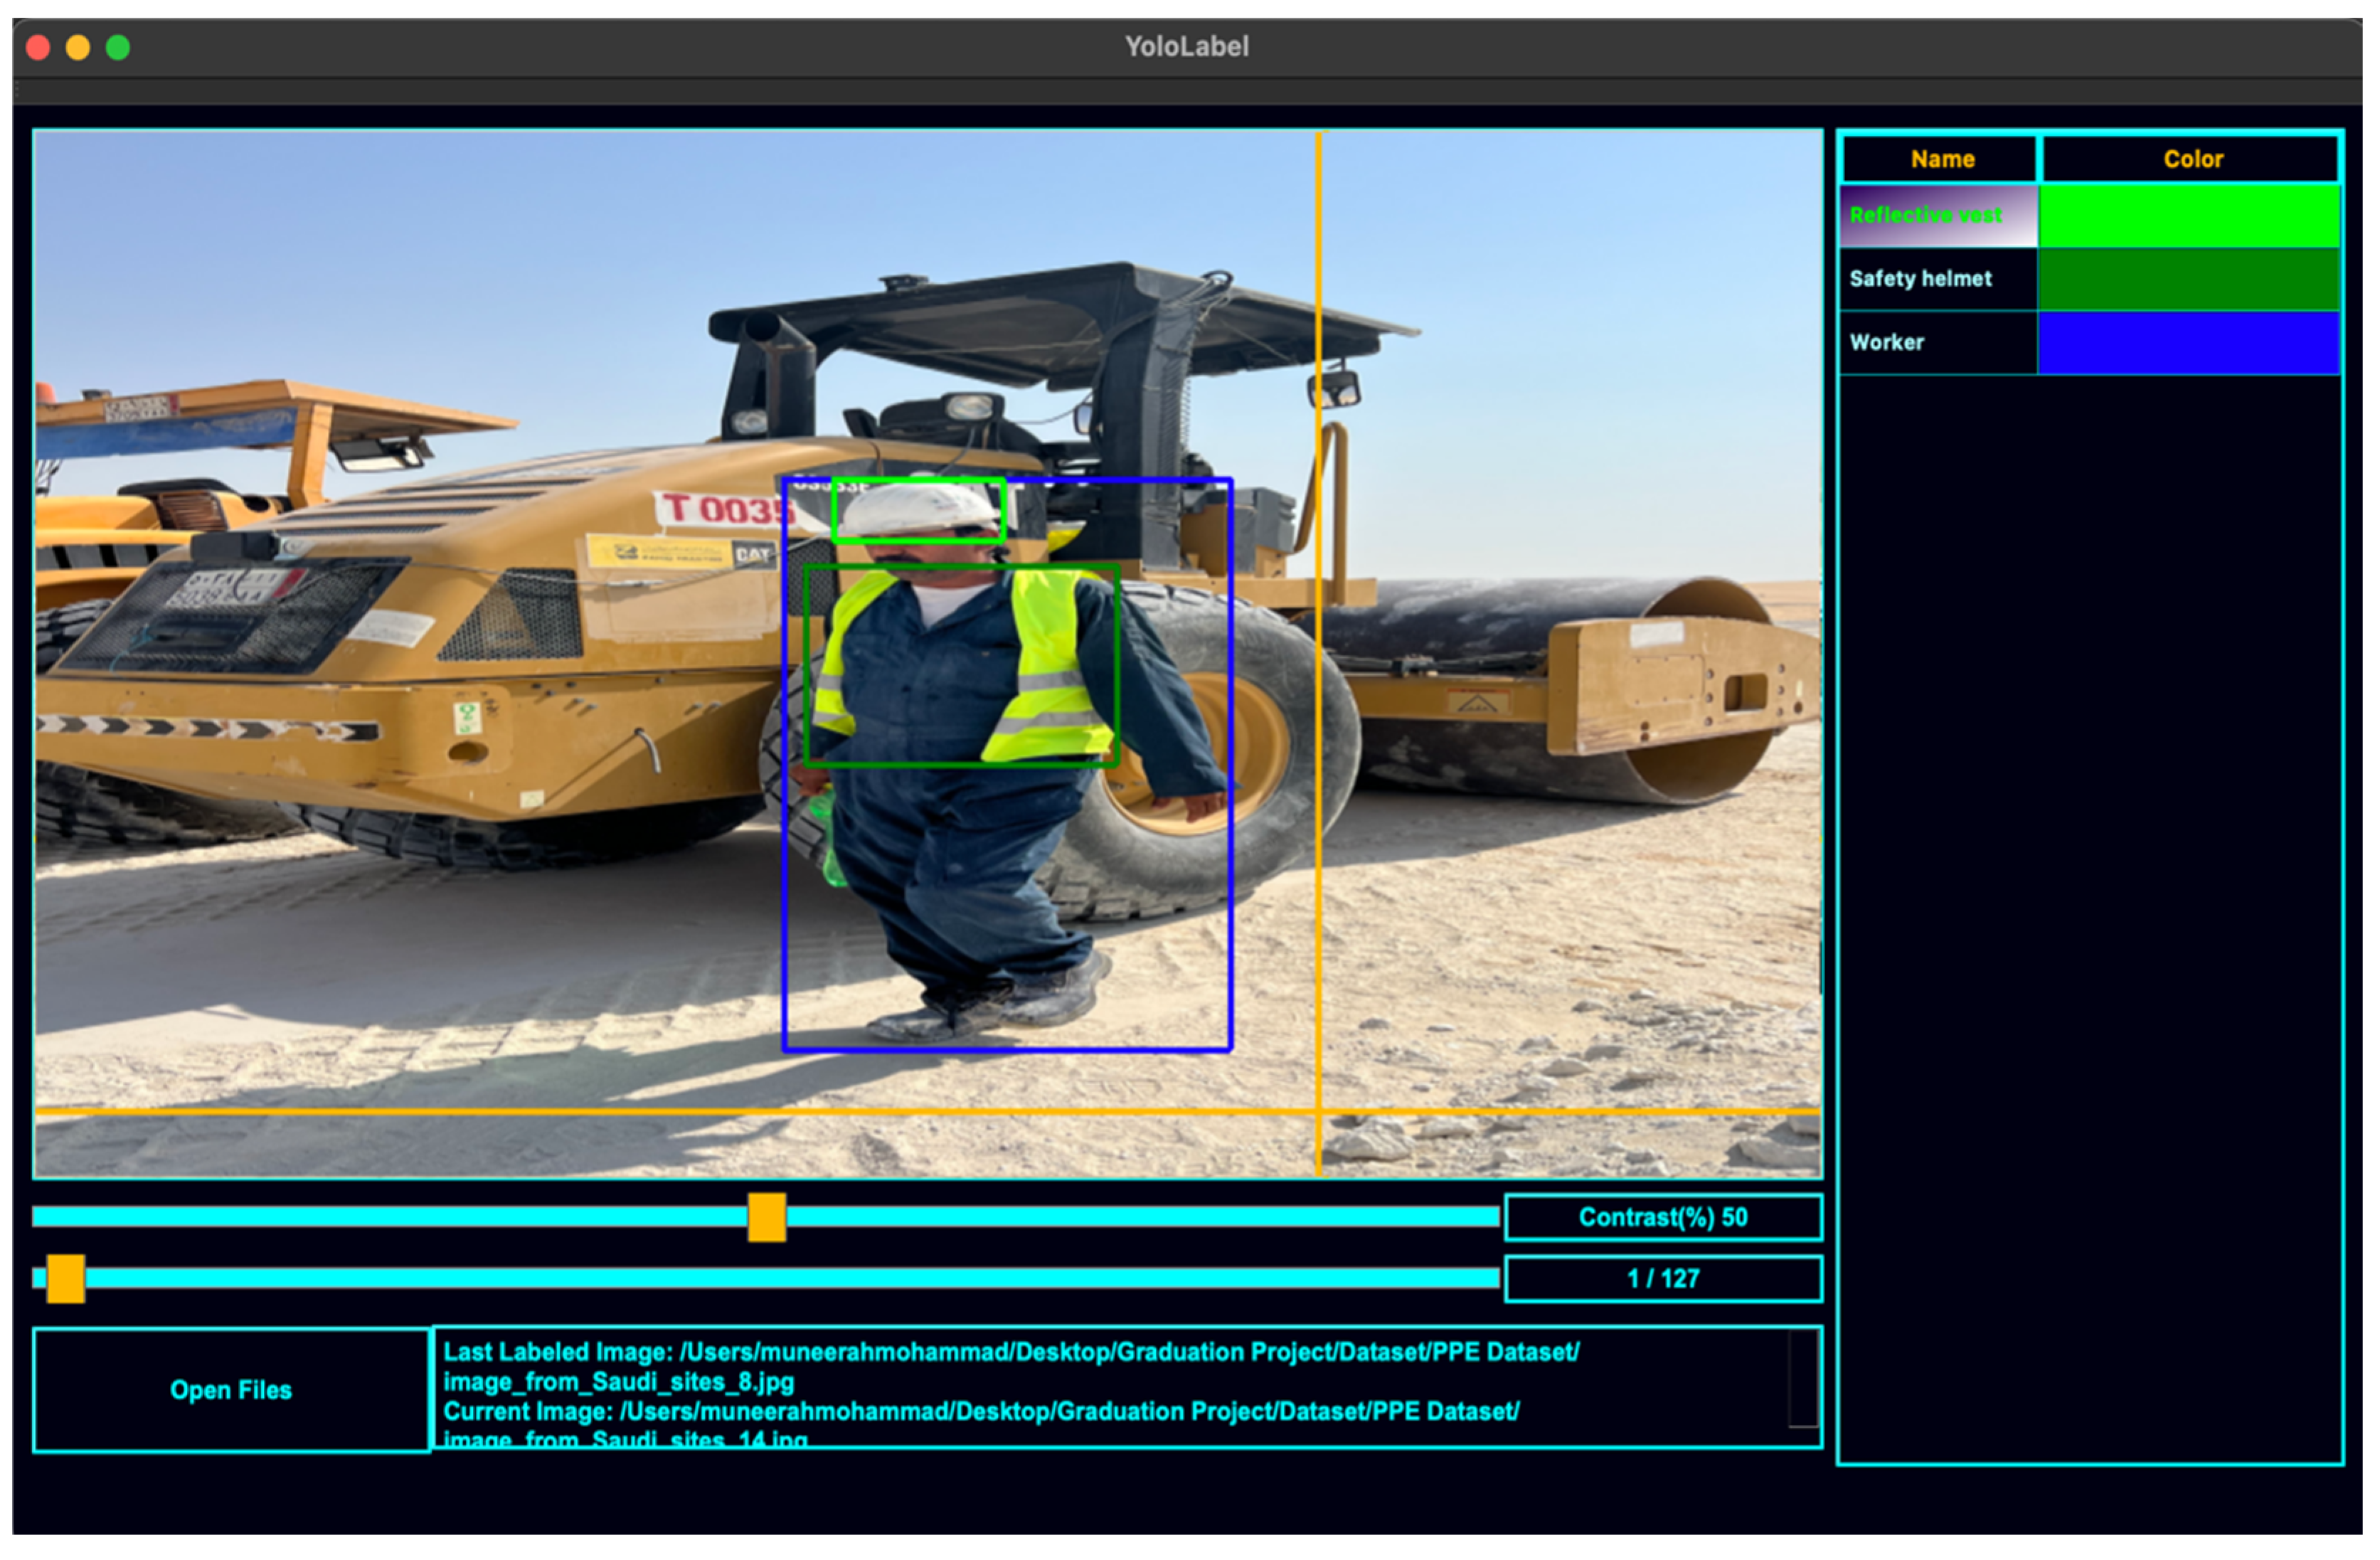
Different object detectors have other labeling formats. YOLO family uses two file extensions for labeling objects: the .jpeg image file and the .txt text file. The image file is just a simple image file, while the text file is used to store the labels, the types of objects present in the image and the coordinates of their bounding boxes. The number of rows within the text file indicates the number of objects within the image. Many labeling tools can be used to label the objects, such as YOLO_mark, BBox-Label-Tool, labelImg, etc. In this project, images were labeled using the YOLOLabel tool, which is simple and provides a good GUI. This tool is publicly available in [
14]. To locate the objects we wanted to detect, we drew the bounding box and chose the class from the list of predefined classes.
Figure 6 shows the YoloLabel interface and an example of the image labeling process.
2.6. Splitting Data
In our experiments, the entire dataset was randomly split into 70% training (578 images of workers and PPE instances and 4400 images of heavy equipment instances), 20% validation (165 images of workers and PPE instances and 1300 images of heavy equipment instances) and 10% test (83 images of workers and PPE instances and 636 images of heavy equipment instances).
2.7. Object Detection Algorithms
The YOLO algorithm was first introduced by Redmon et al. in 2015 [
15], which was followed by many different versions. YOLO implements a single-stage object detector. In general, YOLO algorithms divide the image into s×s grid, and, if the object center is within one of the grids, this grid will detect the object [
16].
YOLO-v5, proposed by Glenn Jocher et al. in 2020, is the updated version of the YOLO family. It is more flexible, faster and more accessible than the previous versions; however, it is slightly less accurate than YOLO-v4 [
16]. The advantages of being faster and easier outweigh the difference in accuracy, making it an attractive choice to be used in object detection for our project.
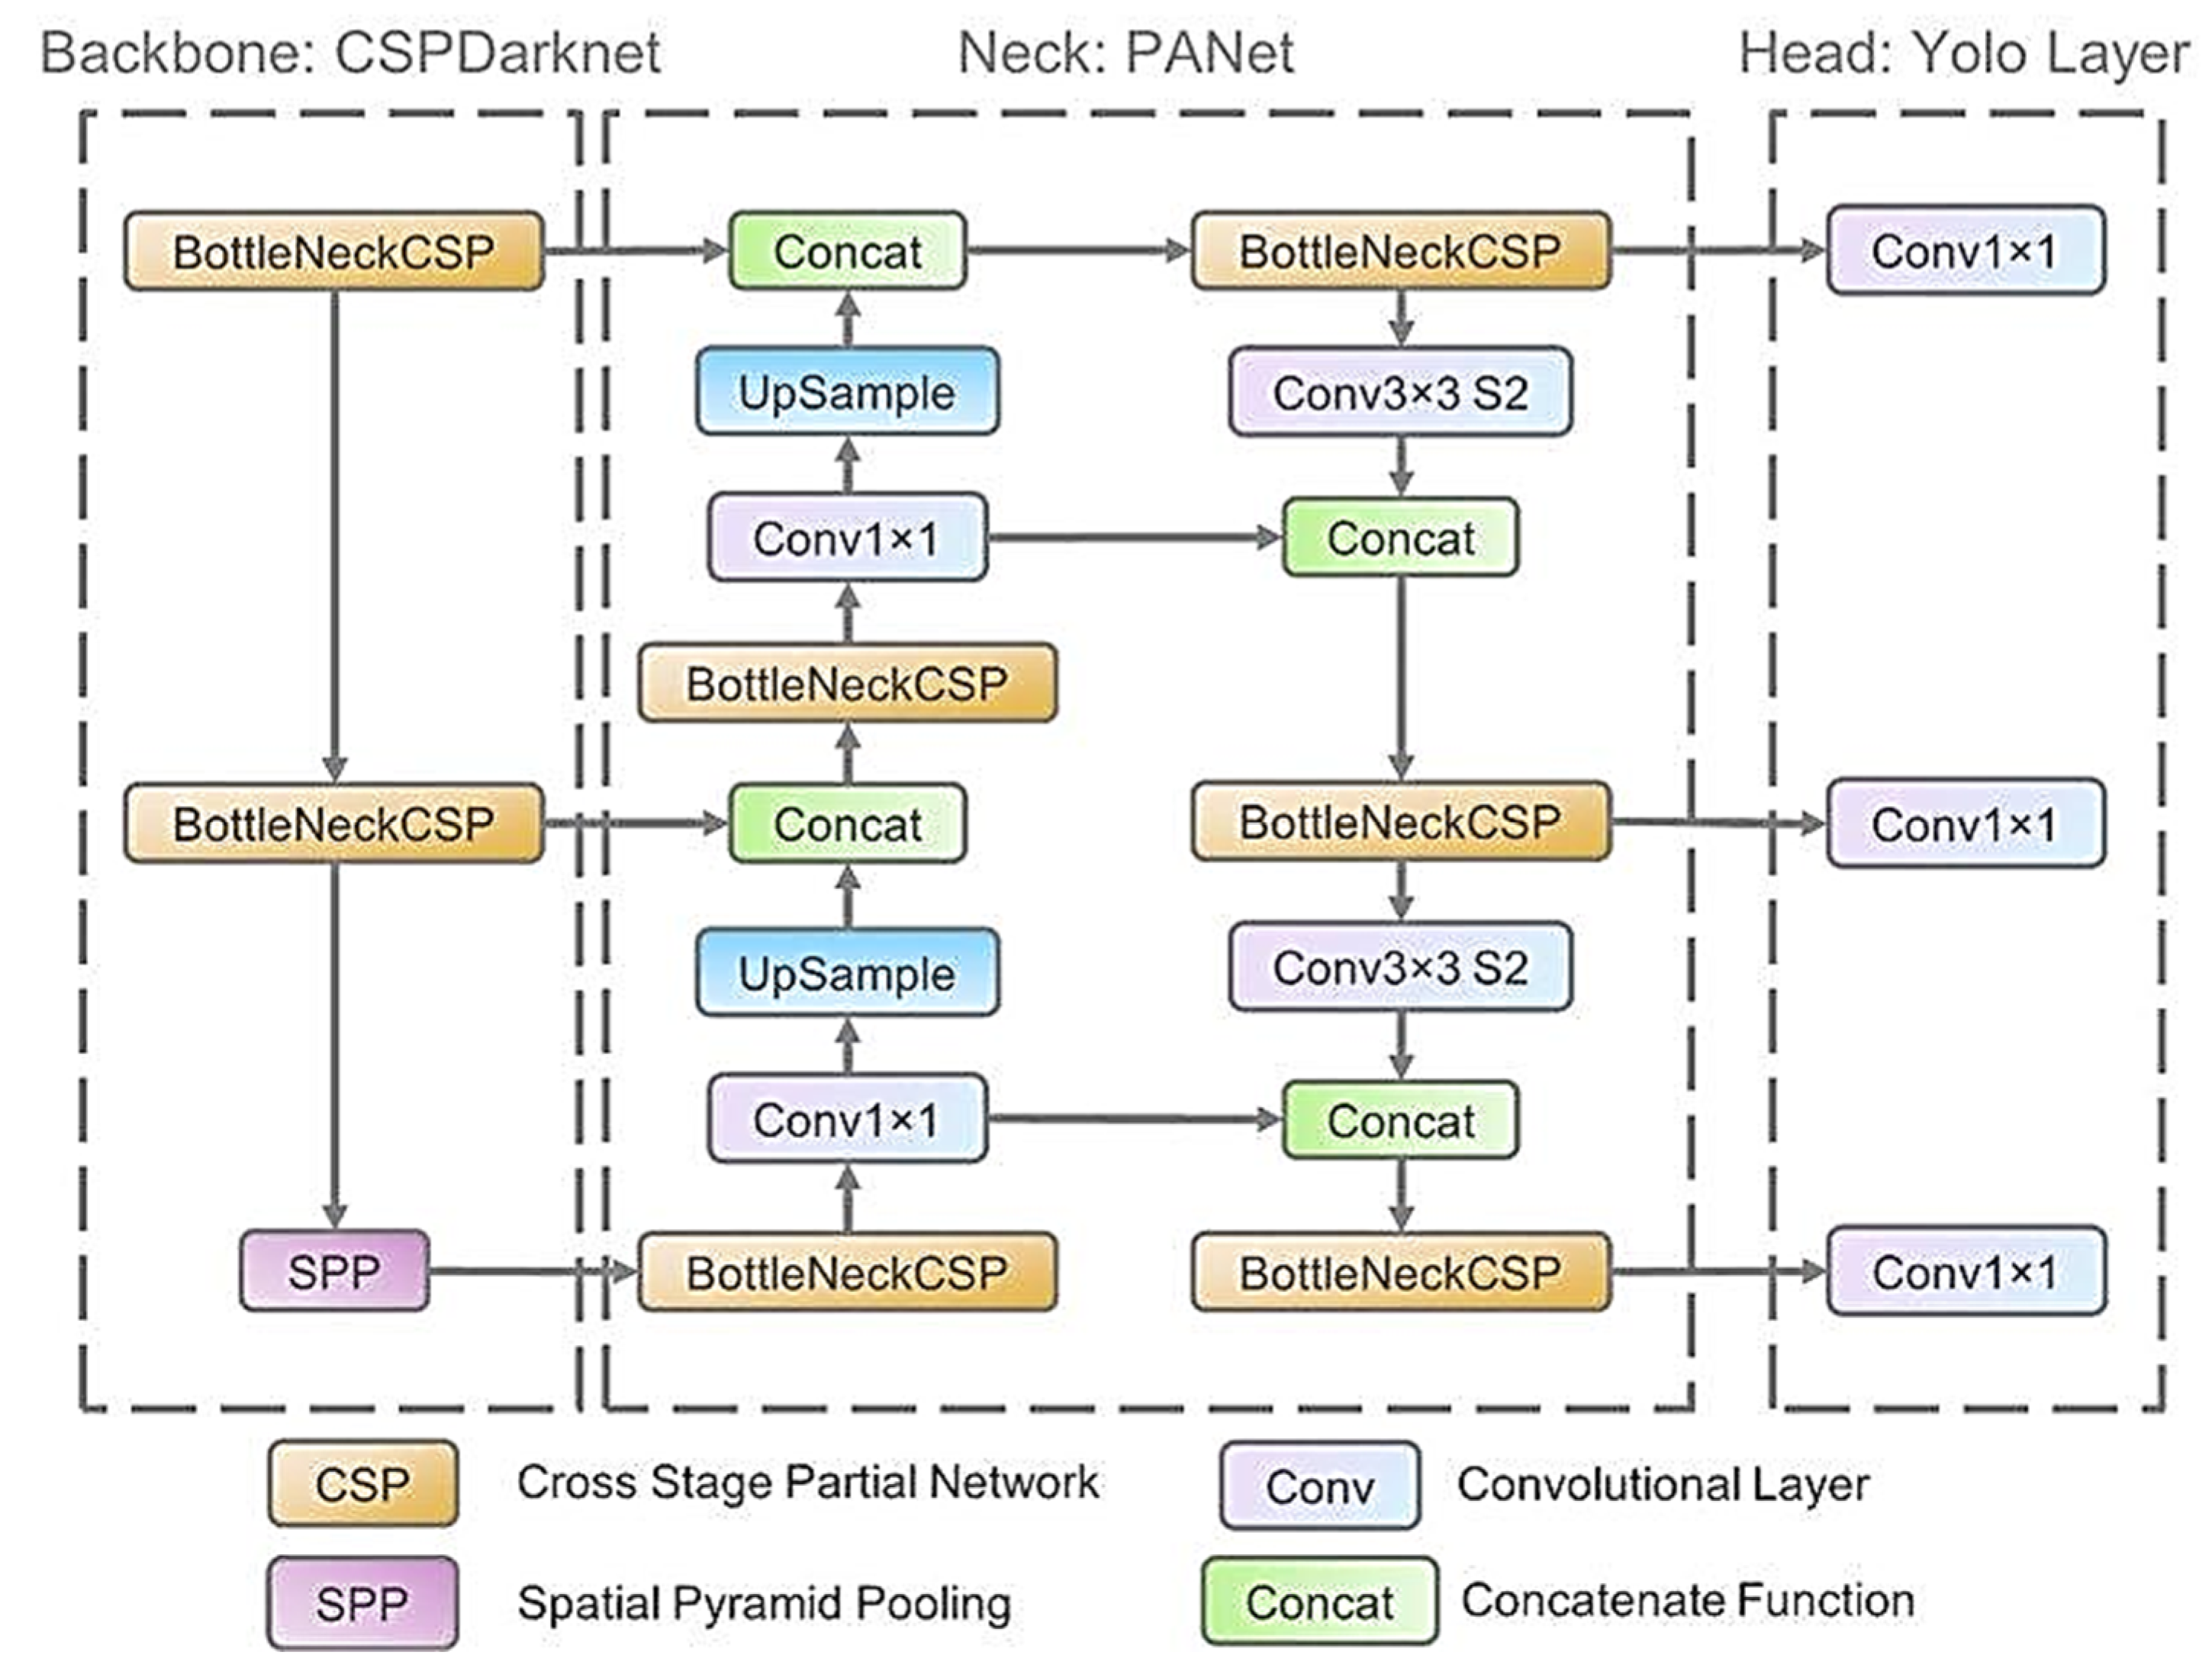
The architecture of YOLO-v5, like any object detector, is composed of three main parts: backbone, neck and head. YOLO-v5 uses Cross Stage Partial Network (CSPNet) as a model backbone [
17], which helps to extract the essential features from a given image. For the model neck, YOLO-v5 uses Path Aggregation Network (PANet) [
18] to generate the feature pyramids, which helps to generalize unseen data. The final detection is performed by the model head, which applies the anchor boxes in the features and produces the final vector along with the bounding boxes and class probabilities [
19].
Figure 7 shows the network architecture of YOLO-v5.
2.8. Testing and Evaluation
To test the proposed model, imagery data collected from a local construction site using CCTV cameras were used. Then, the accuracy of the proposed methodology was measured using Intersection over Union (IoU) and a confusion matrix. IoU is a metric that calculates the intersection area between the actual bounding box and the predicted bounding box to check whether the detected object is valid, as shown in Equation (1). The value of IoU ranges from 0 to 1, where 0 indicates no overlap, and 1 indicates perfect overlap [
21]. The confusion matrix consists of true prediction indicated by true positive TP and true negative TN, while false prediction is indicated by false positive FP and false negative FN. Many metrics can be driven from the confusion matrix, such as precision, recall and mAP. The precision of the model measures whether the model is reliable or not. It tells us how many TP observations the model could detect out of all the positive observations; see Equation (2). To measure the sensitivity of a model, we use recall. Recall tells us how many TP observations the model detected correctly; see Equation (3). The mean average precision (mAP) is used to measure the accuracy of the object detection model across all classes in a given dataset, as shown in Equation (4), where AP is the average of all precisions (see Equation (5)), and n is the total number of classes [
22].
2.9. Experiment Setup
Python programming language was used to conduct this experiment on Google ColaboratoryPro (Google Colab Pro) on Mac operating system using the online cloud service with graphics processing unit (GPU) hardware. YOLO-v5 model source code was taken from the original author of the model [
23,
24,
25,
26,
27,
28,
29,
30,
31,
32], and then it was altered based on our needs. The model was pre-trained on COCO dataset weights.
2.10. System GUI
The GUI of the system was built using the TKinter package, which is the most commonly used package for GUI programming in Python. It provides a fast and easy object-oriented interface [
33].
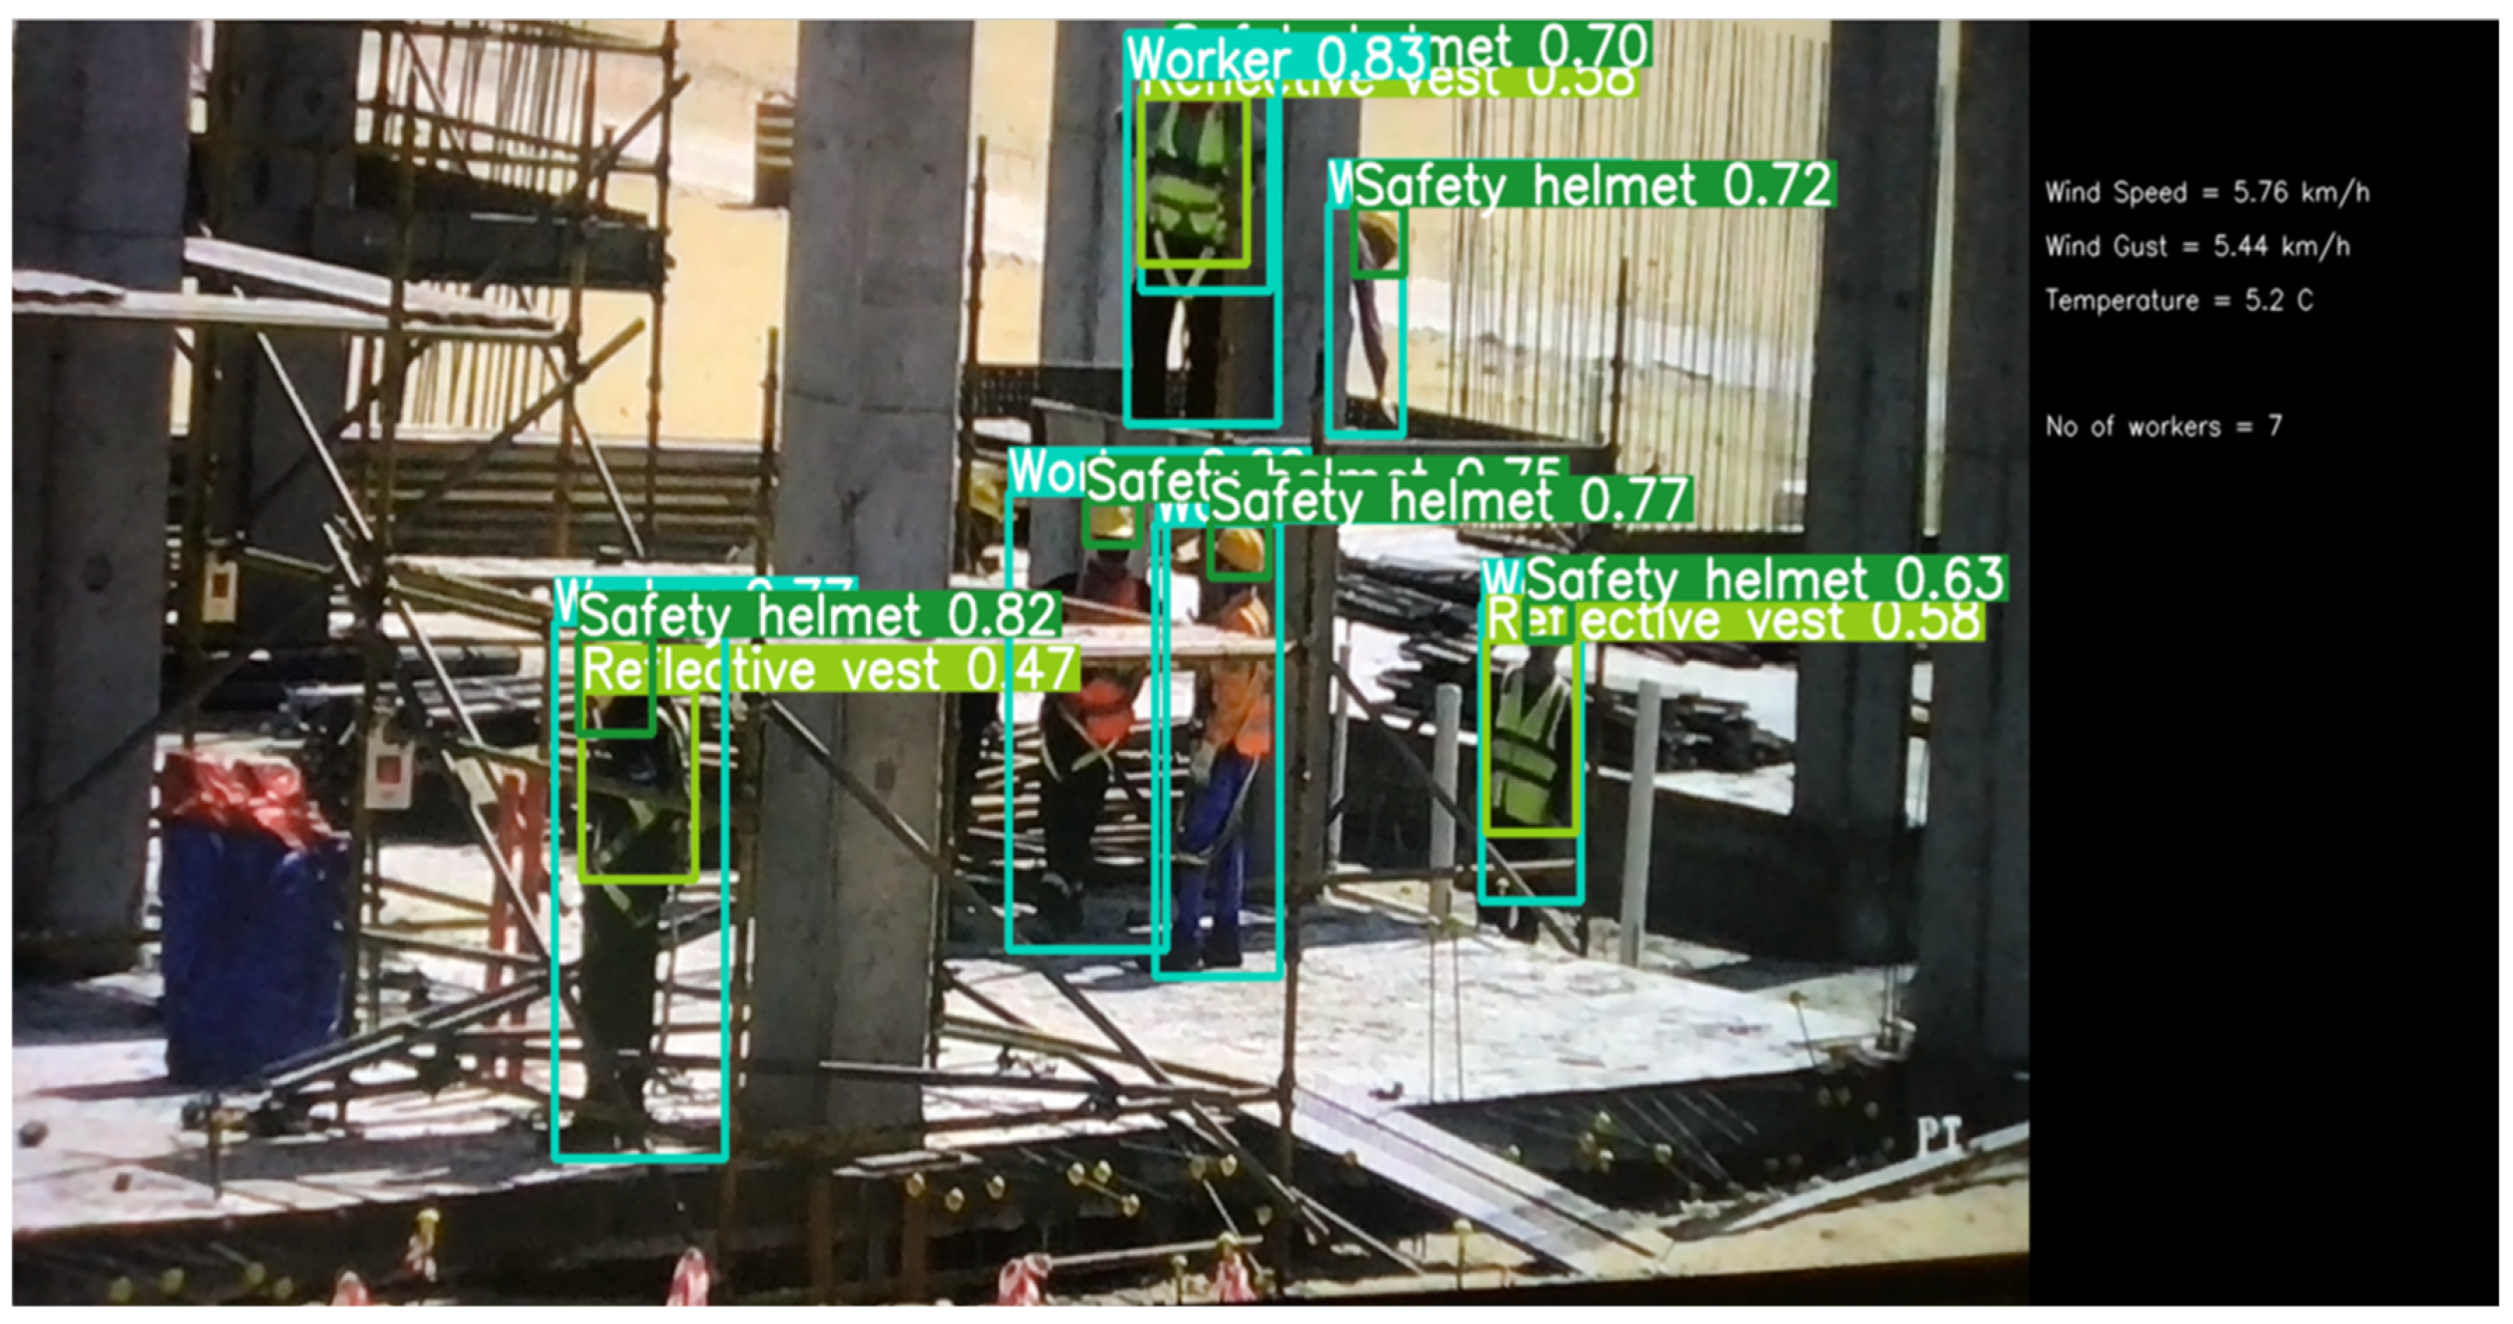
The GUI of the system includes a video frame to show the detection results, weather data and the number of workers detected by the model, as shown in
Figure 8.
In this project, OpenWeatherMap API was used to obtain live weather data. In Python, the request library as first used to obtain the API response. Then, the response was converted into json format, from which the temperature, wind speed and wind gust values were used. The weather data of a specific area was obtained by putting that location’s coordinates (longitude and latitude) in the API request URL.
3. Results
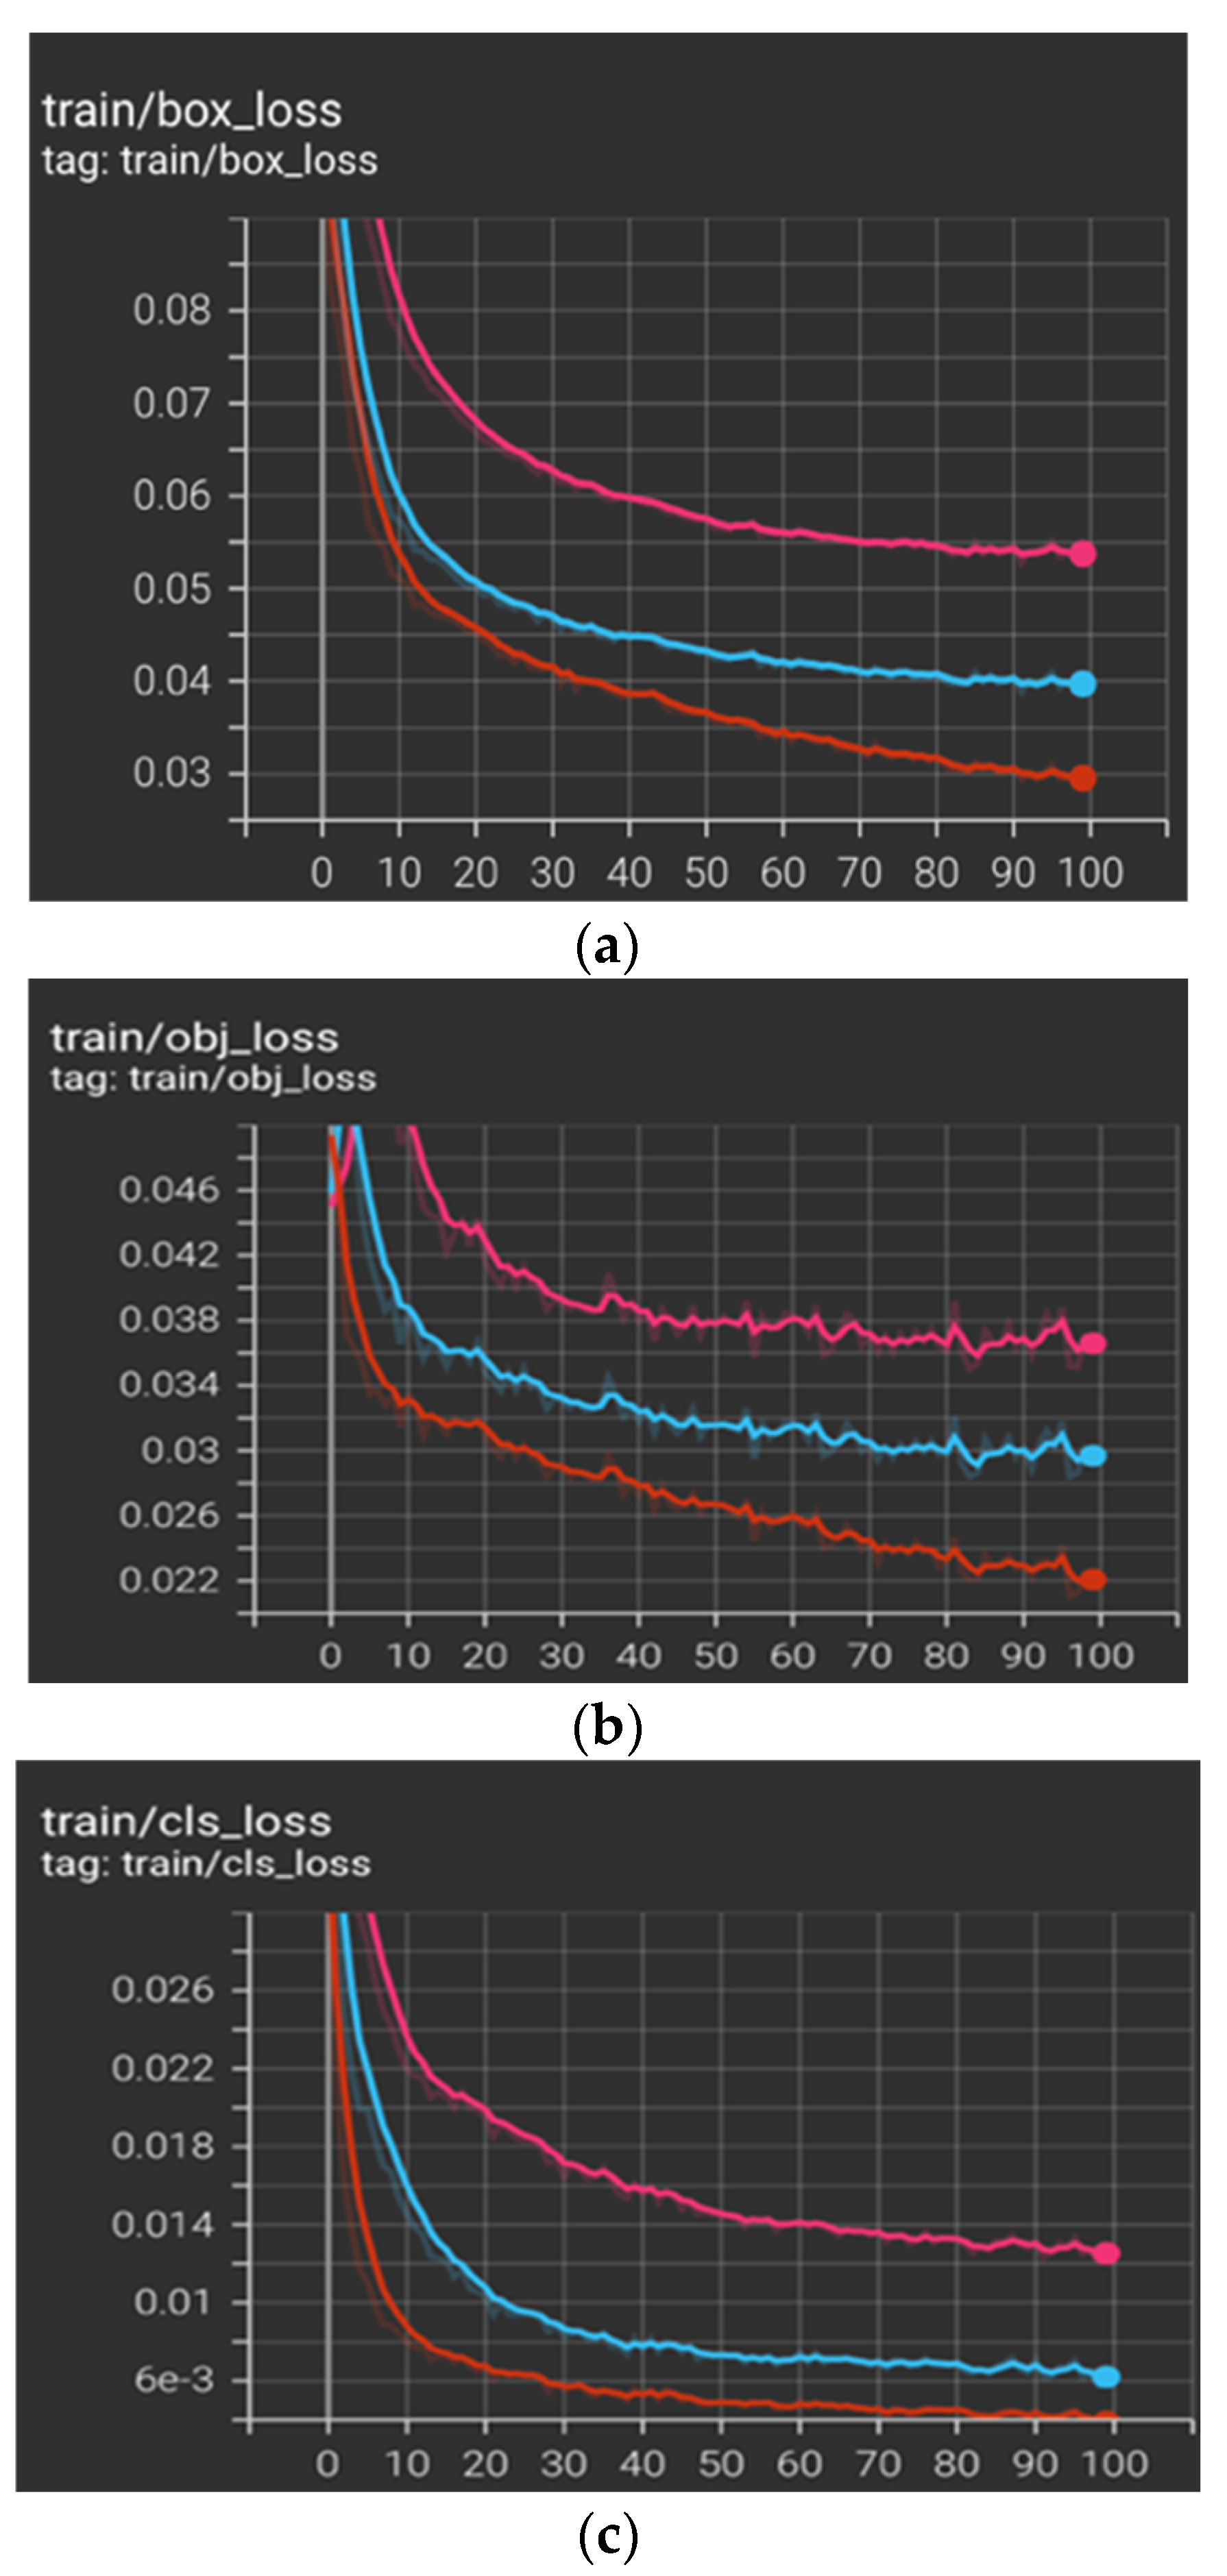
The main objective of this experiment is to detect objects with high accuracy and in real-time. In this study, our datasets were trained with the YOLO-v5 model. In the beginning, three different learning rates were experimented with to examine which gave the lowest loss. We started with 0.01, the default value in the YOLO-v5 model, and then exponentially lowered the values to 0.001 and 0.0001. Based on the minimum loss, we found that the model was performing better with a learning rate = 0.01, as shown in red in
Figure 9, rather than a learning rate of 0.001 or 0.0001, as shown in blue and pink in
Figure 9, respectively.
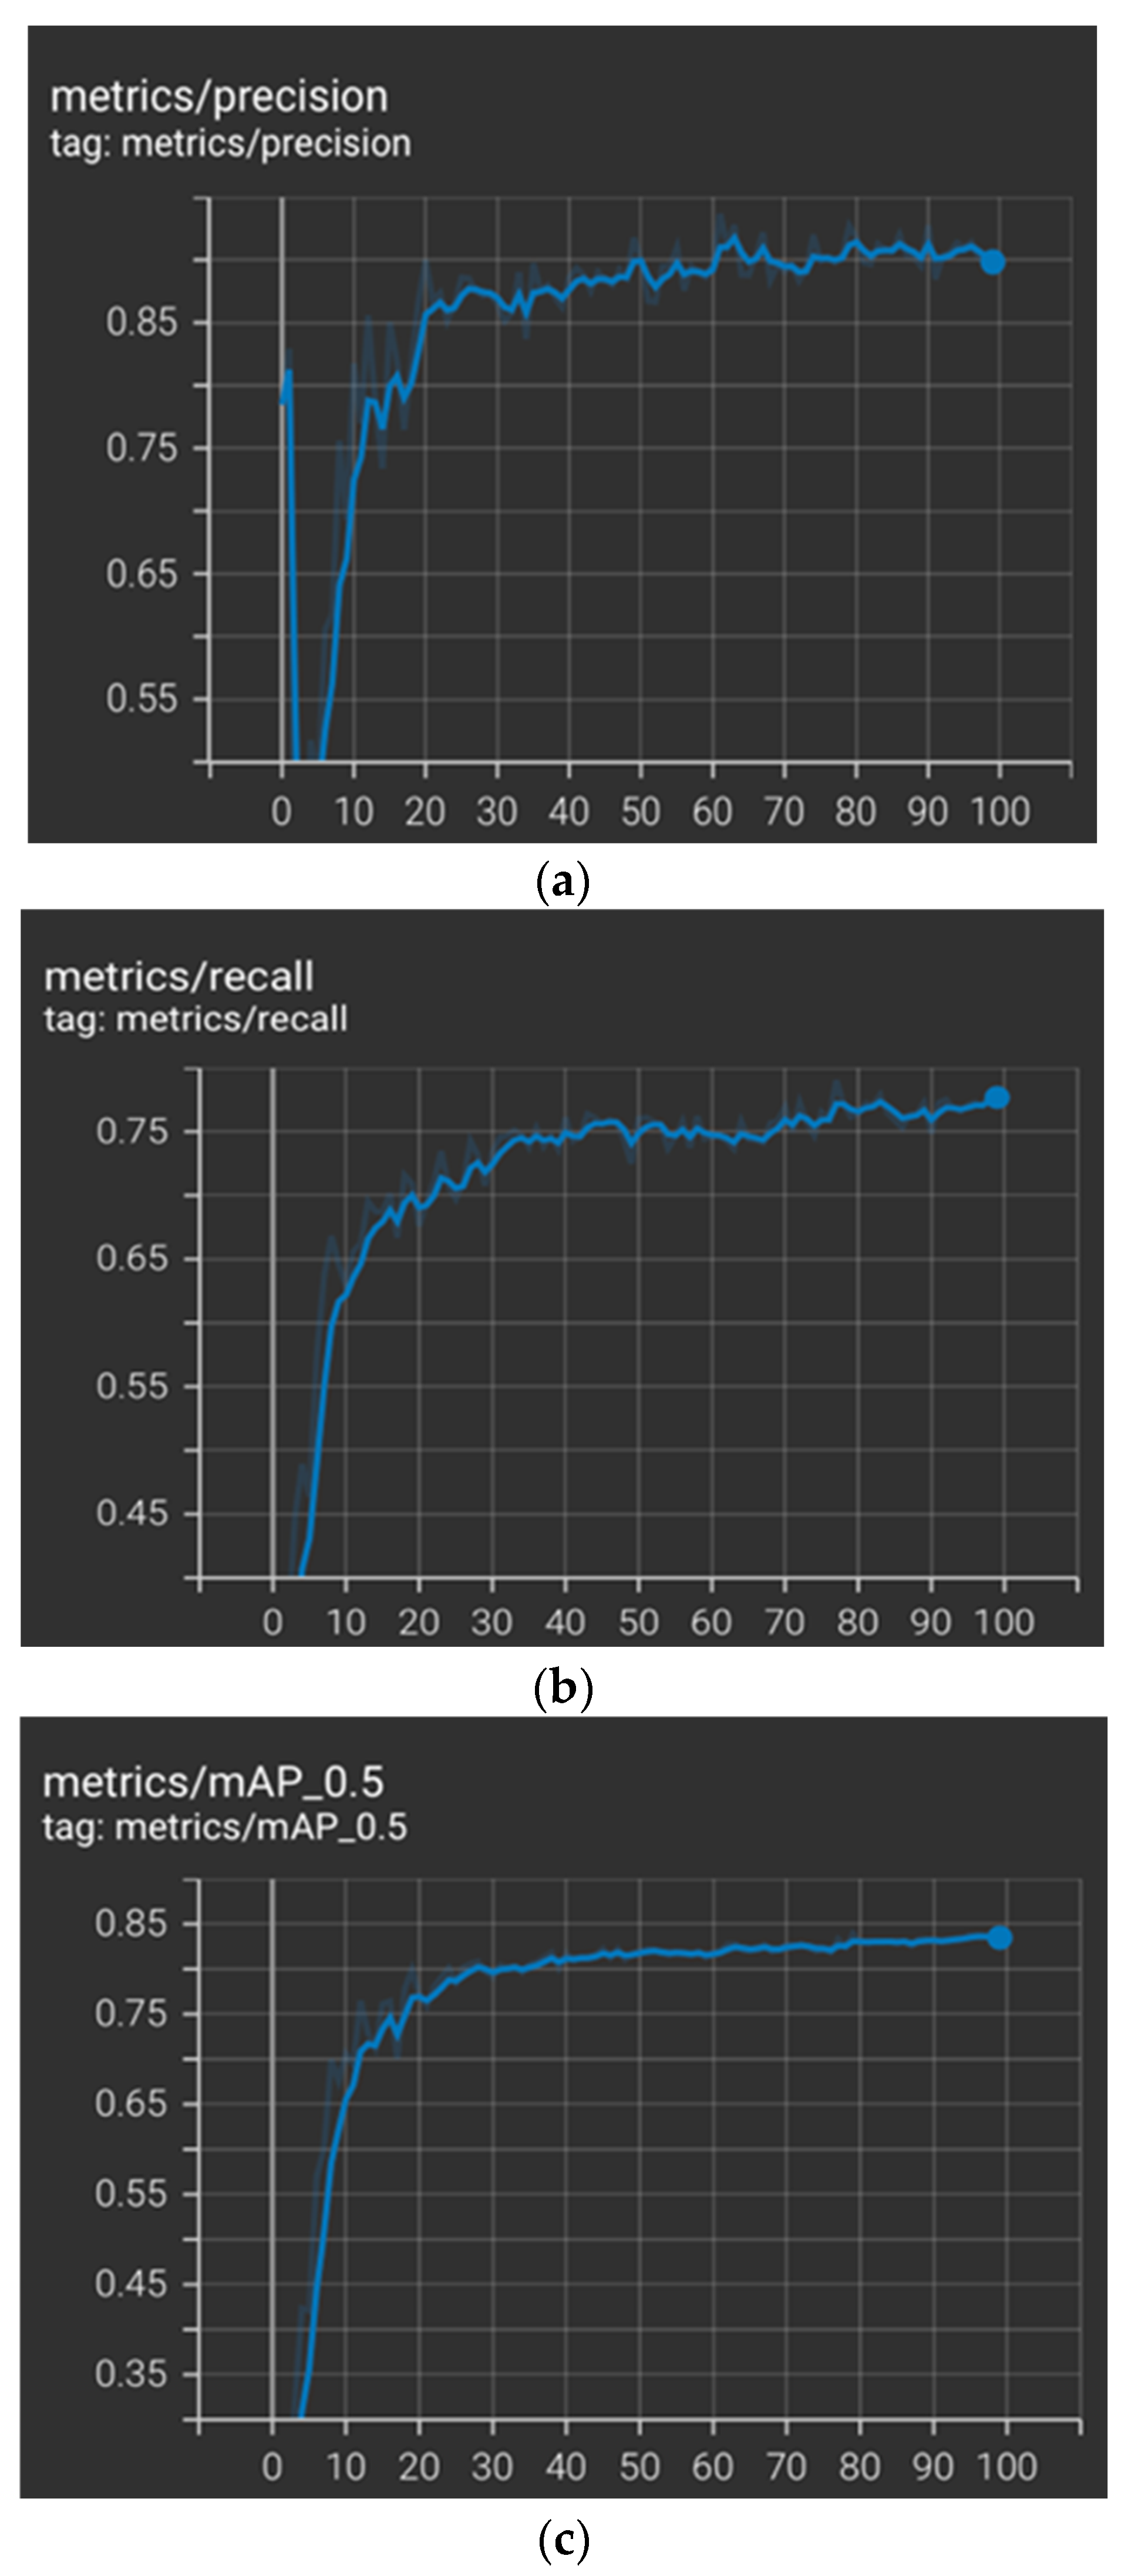
YOLO-v5 was trained with two different datasets, worker/PPE training datasets and heavy equipment training datasets. For the worker/PPE dataset, the model was trained for 100 epochs, and the batch size was 16. The training time took approximately 15 minutes on a Google Colab GPU.
Figure 10 shows the model’s performance with the worker/PPE datasets in terms of precision, recall and mAP at the 50 IoU threshold.
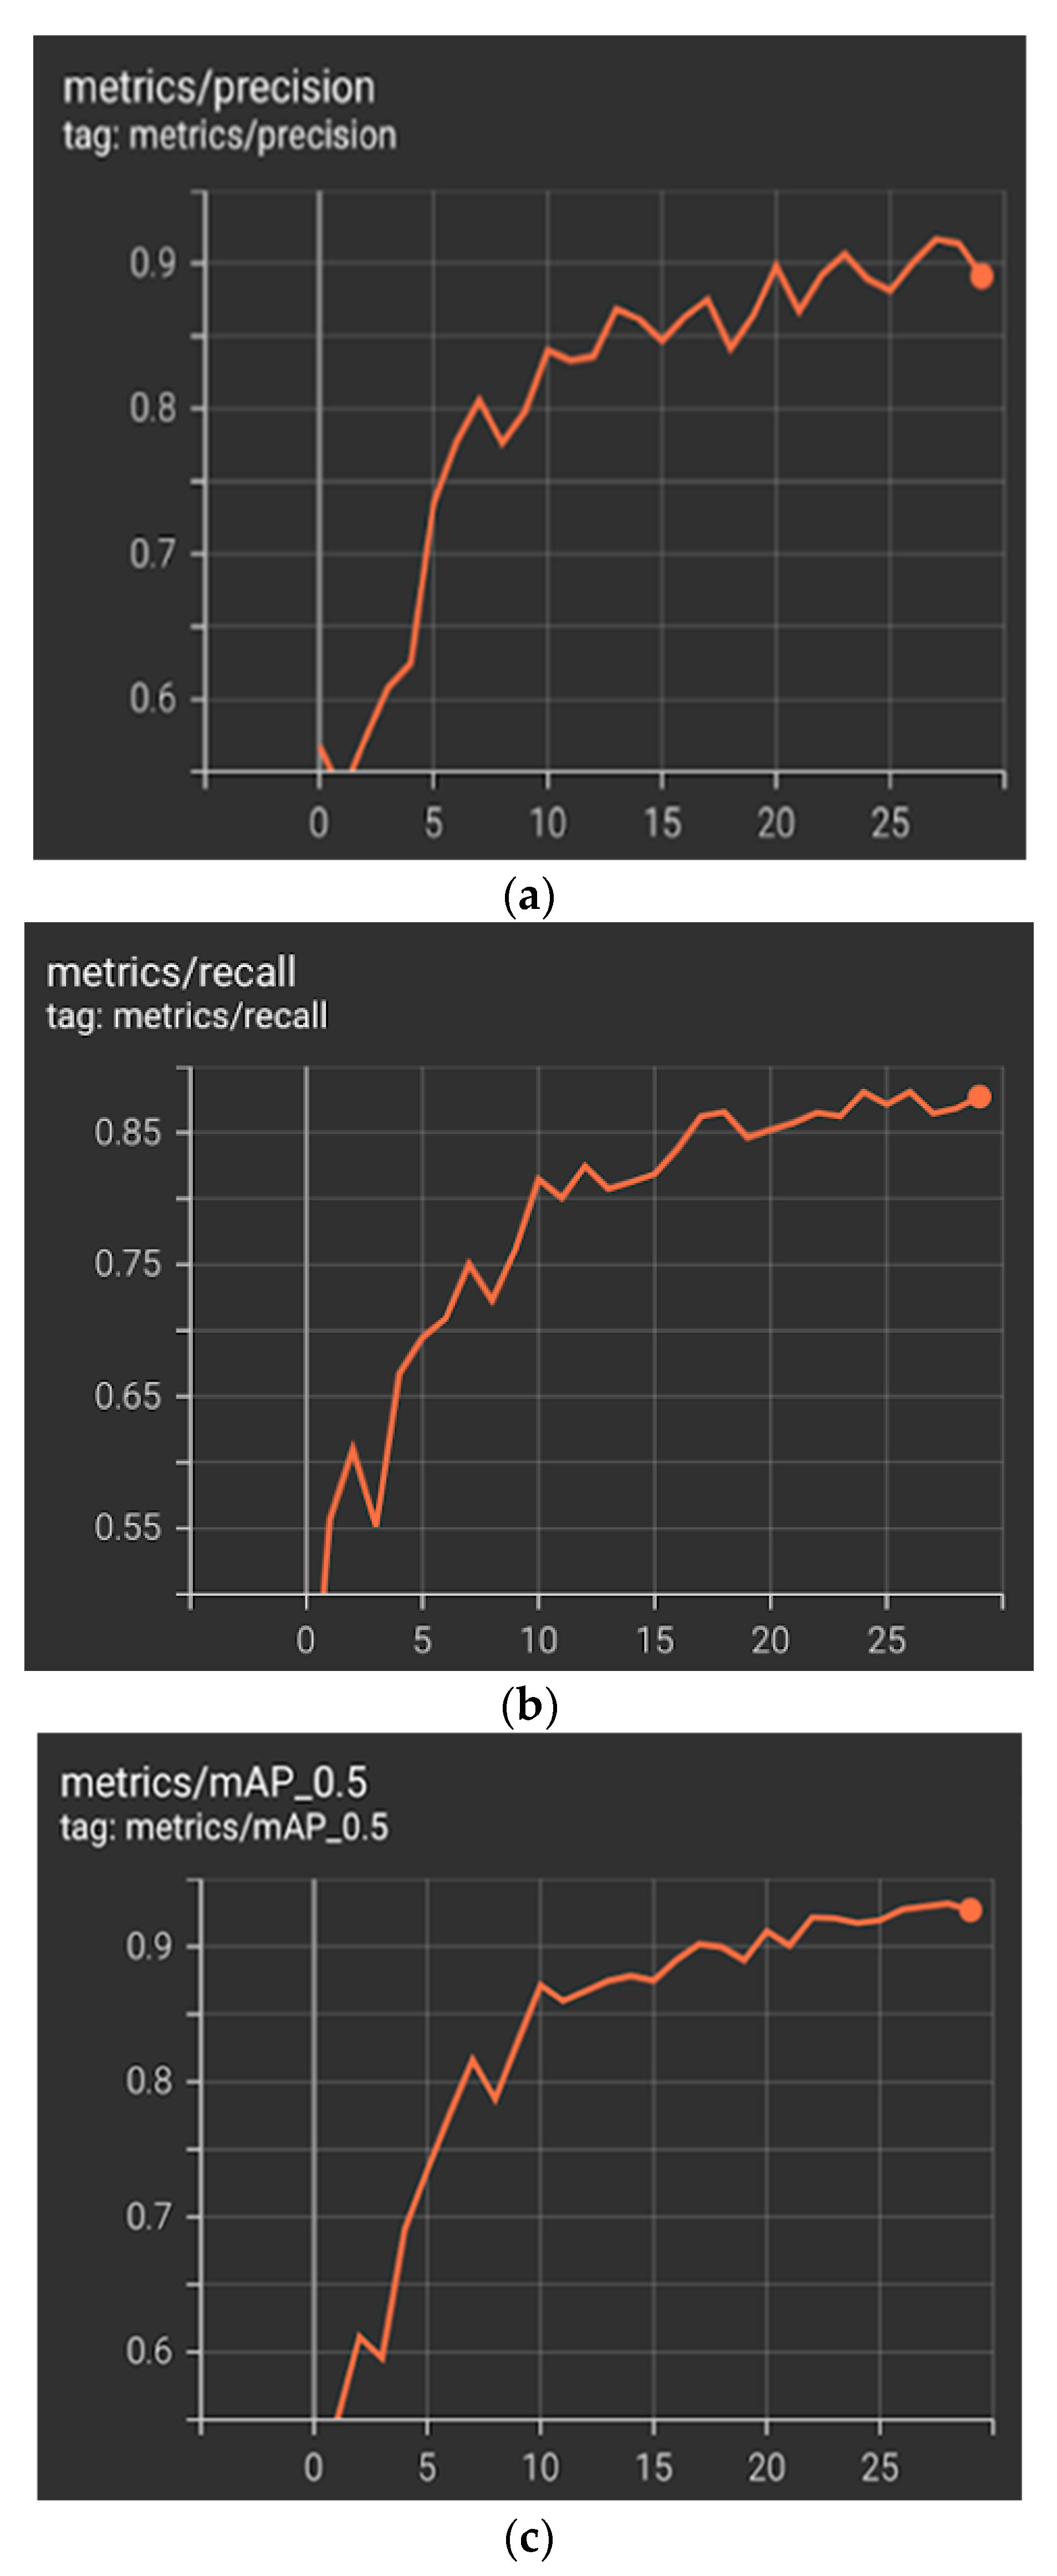
The model was trained for 30 epochs for the heavy equipment dataset, and the batch size was 16. The training time took approximately 18 minutes on a Google Colab GPU.
Figure 11 shows the performance of the model with the heavy equipment dataset in terms of precision, recall and mAP at the 50 IoU threshold.
The performance of YOLO-v5 on the validation worker/PPE dataset is summarized in
Table 3. The overall precision was approximately 90%, the recall was 77%, and the mAP at the 50 IoU threshold was 83%.
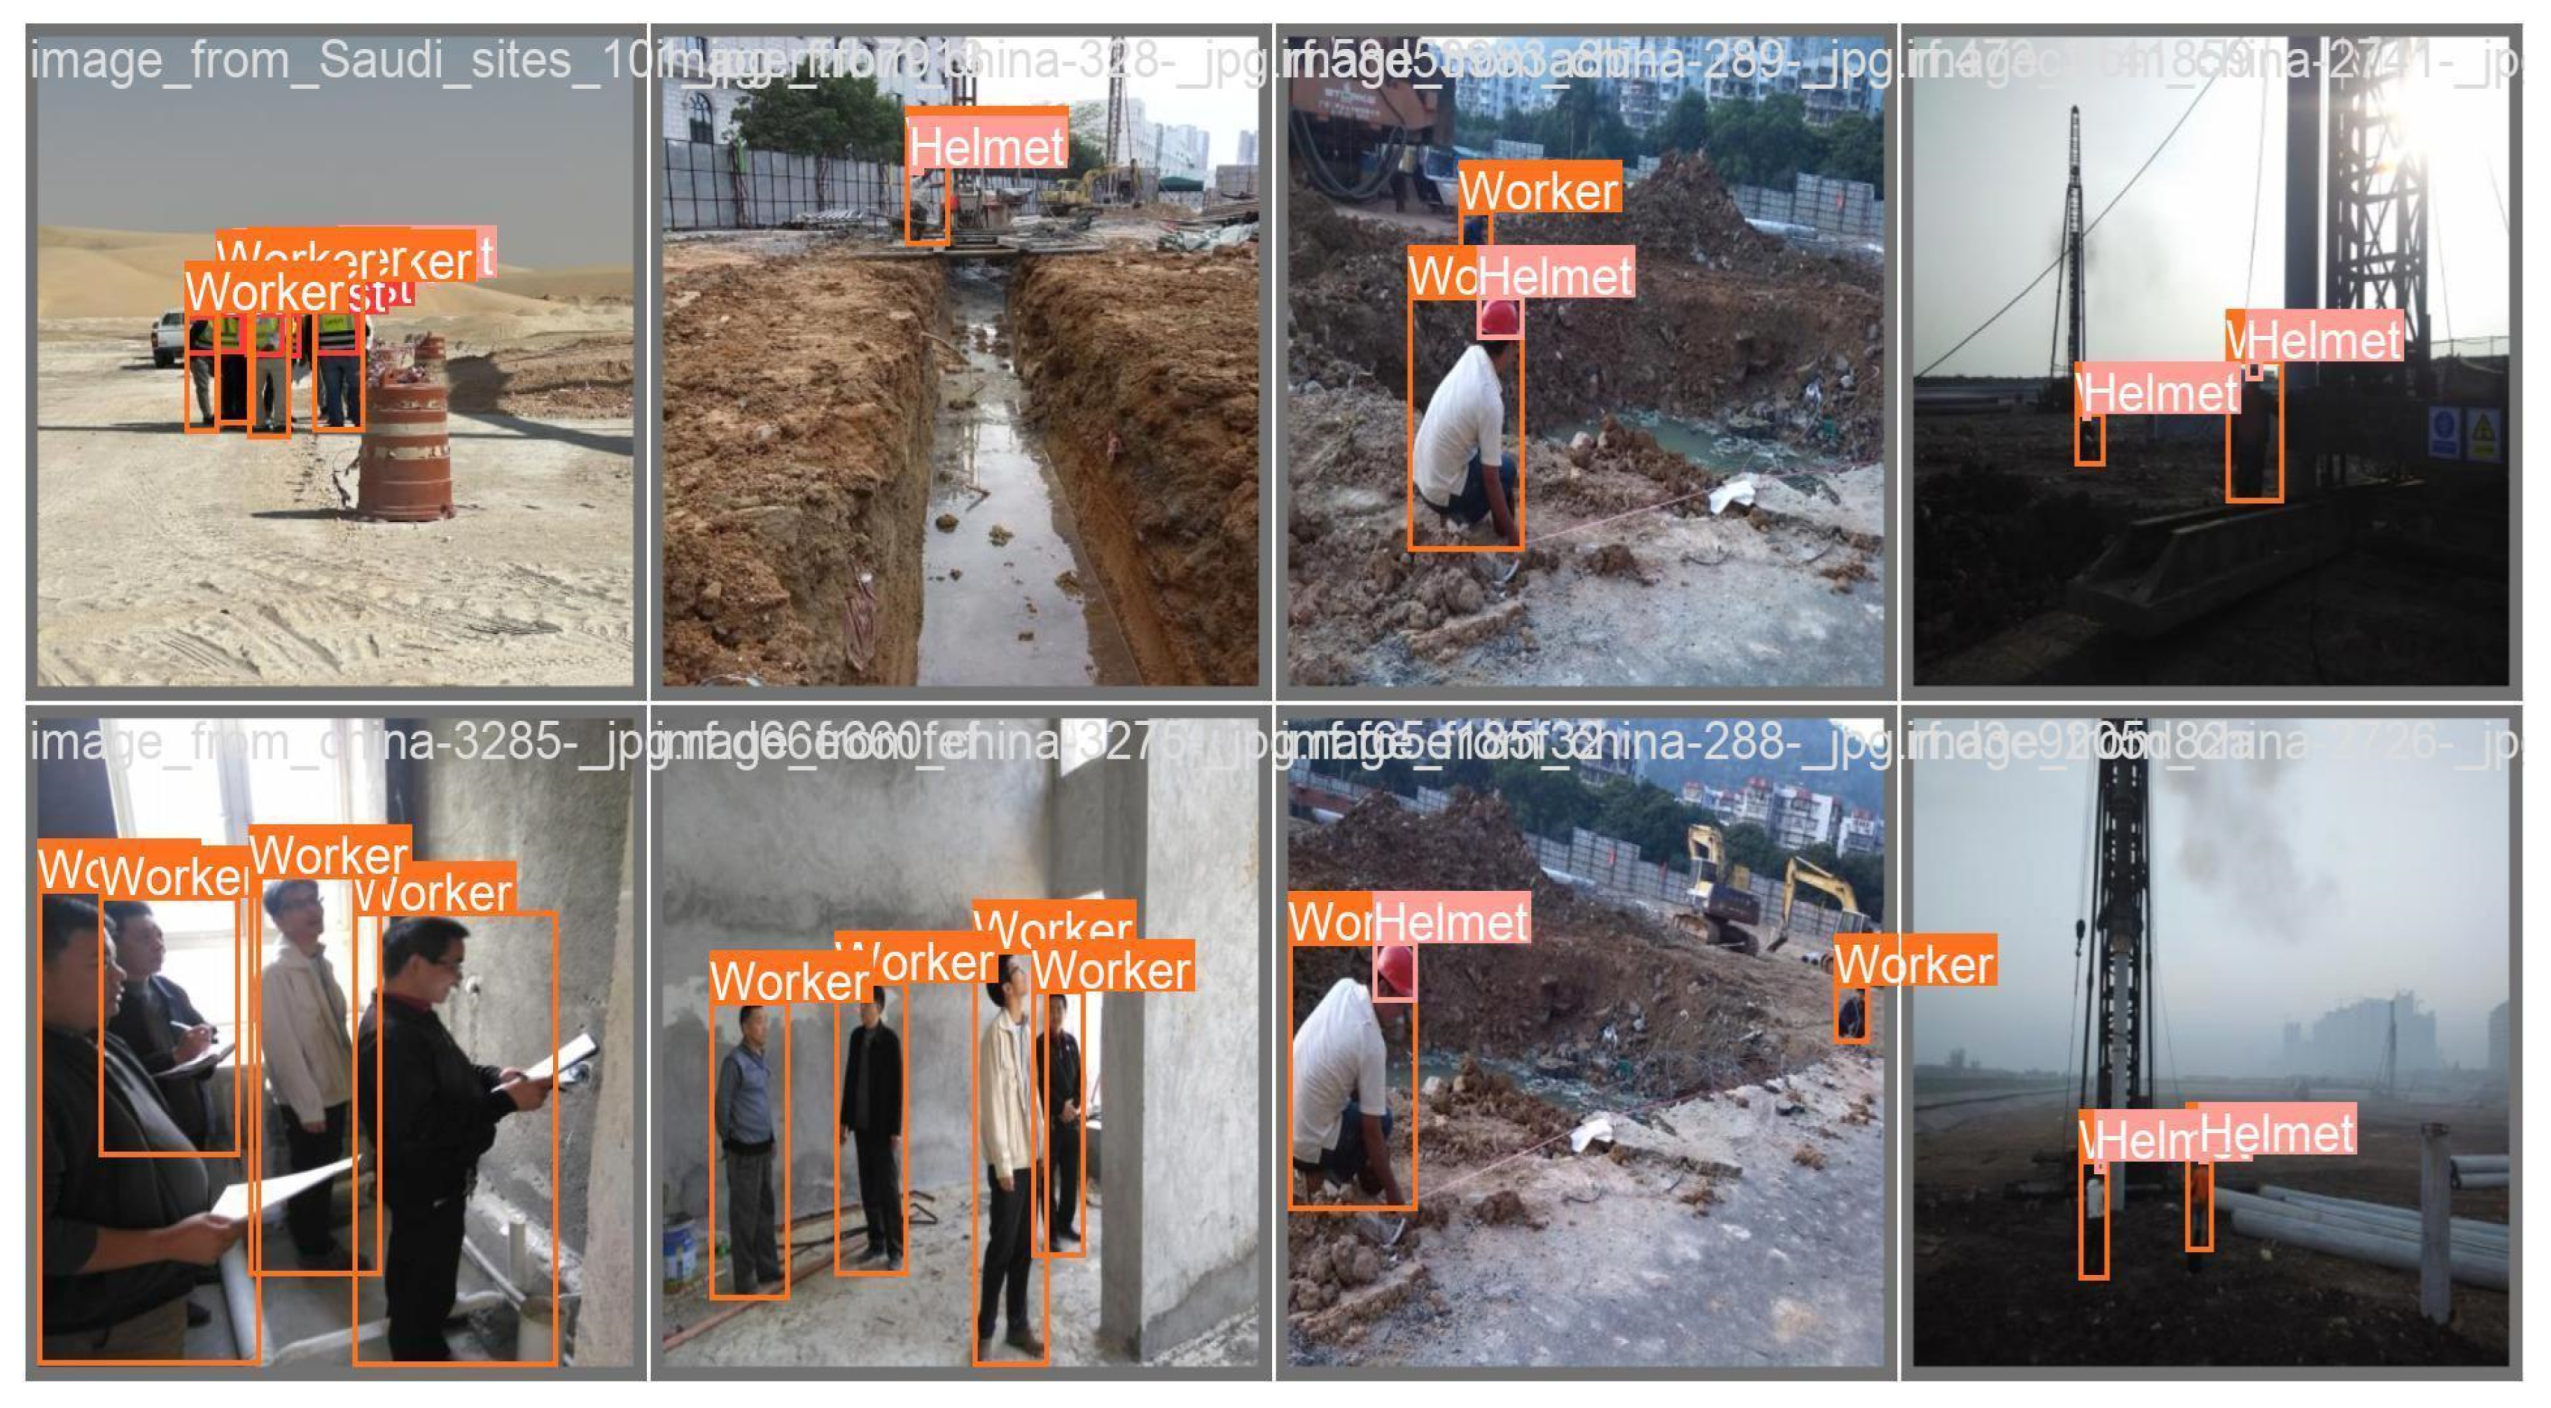
After training and validating the model, we tested the model with our worker/PPE test dataset. The performance of YOLO-v5 on the testing dataset is summarized in
Table 4. The overall precision was approximately 90%, the recall was 76%, and the mAP at the 50 IoU threshold was 83%. The preprocess speed was 0.5 ms, and the inference speed was 5.1 ms per image.
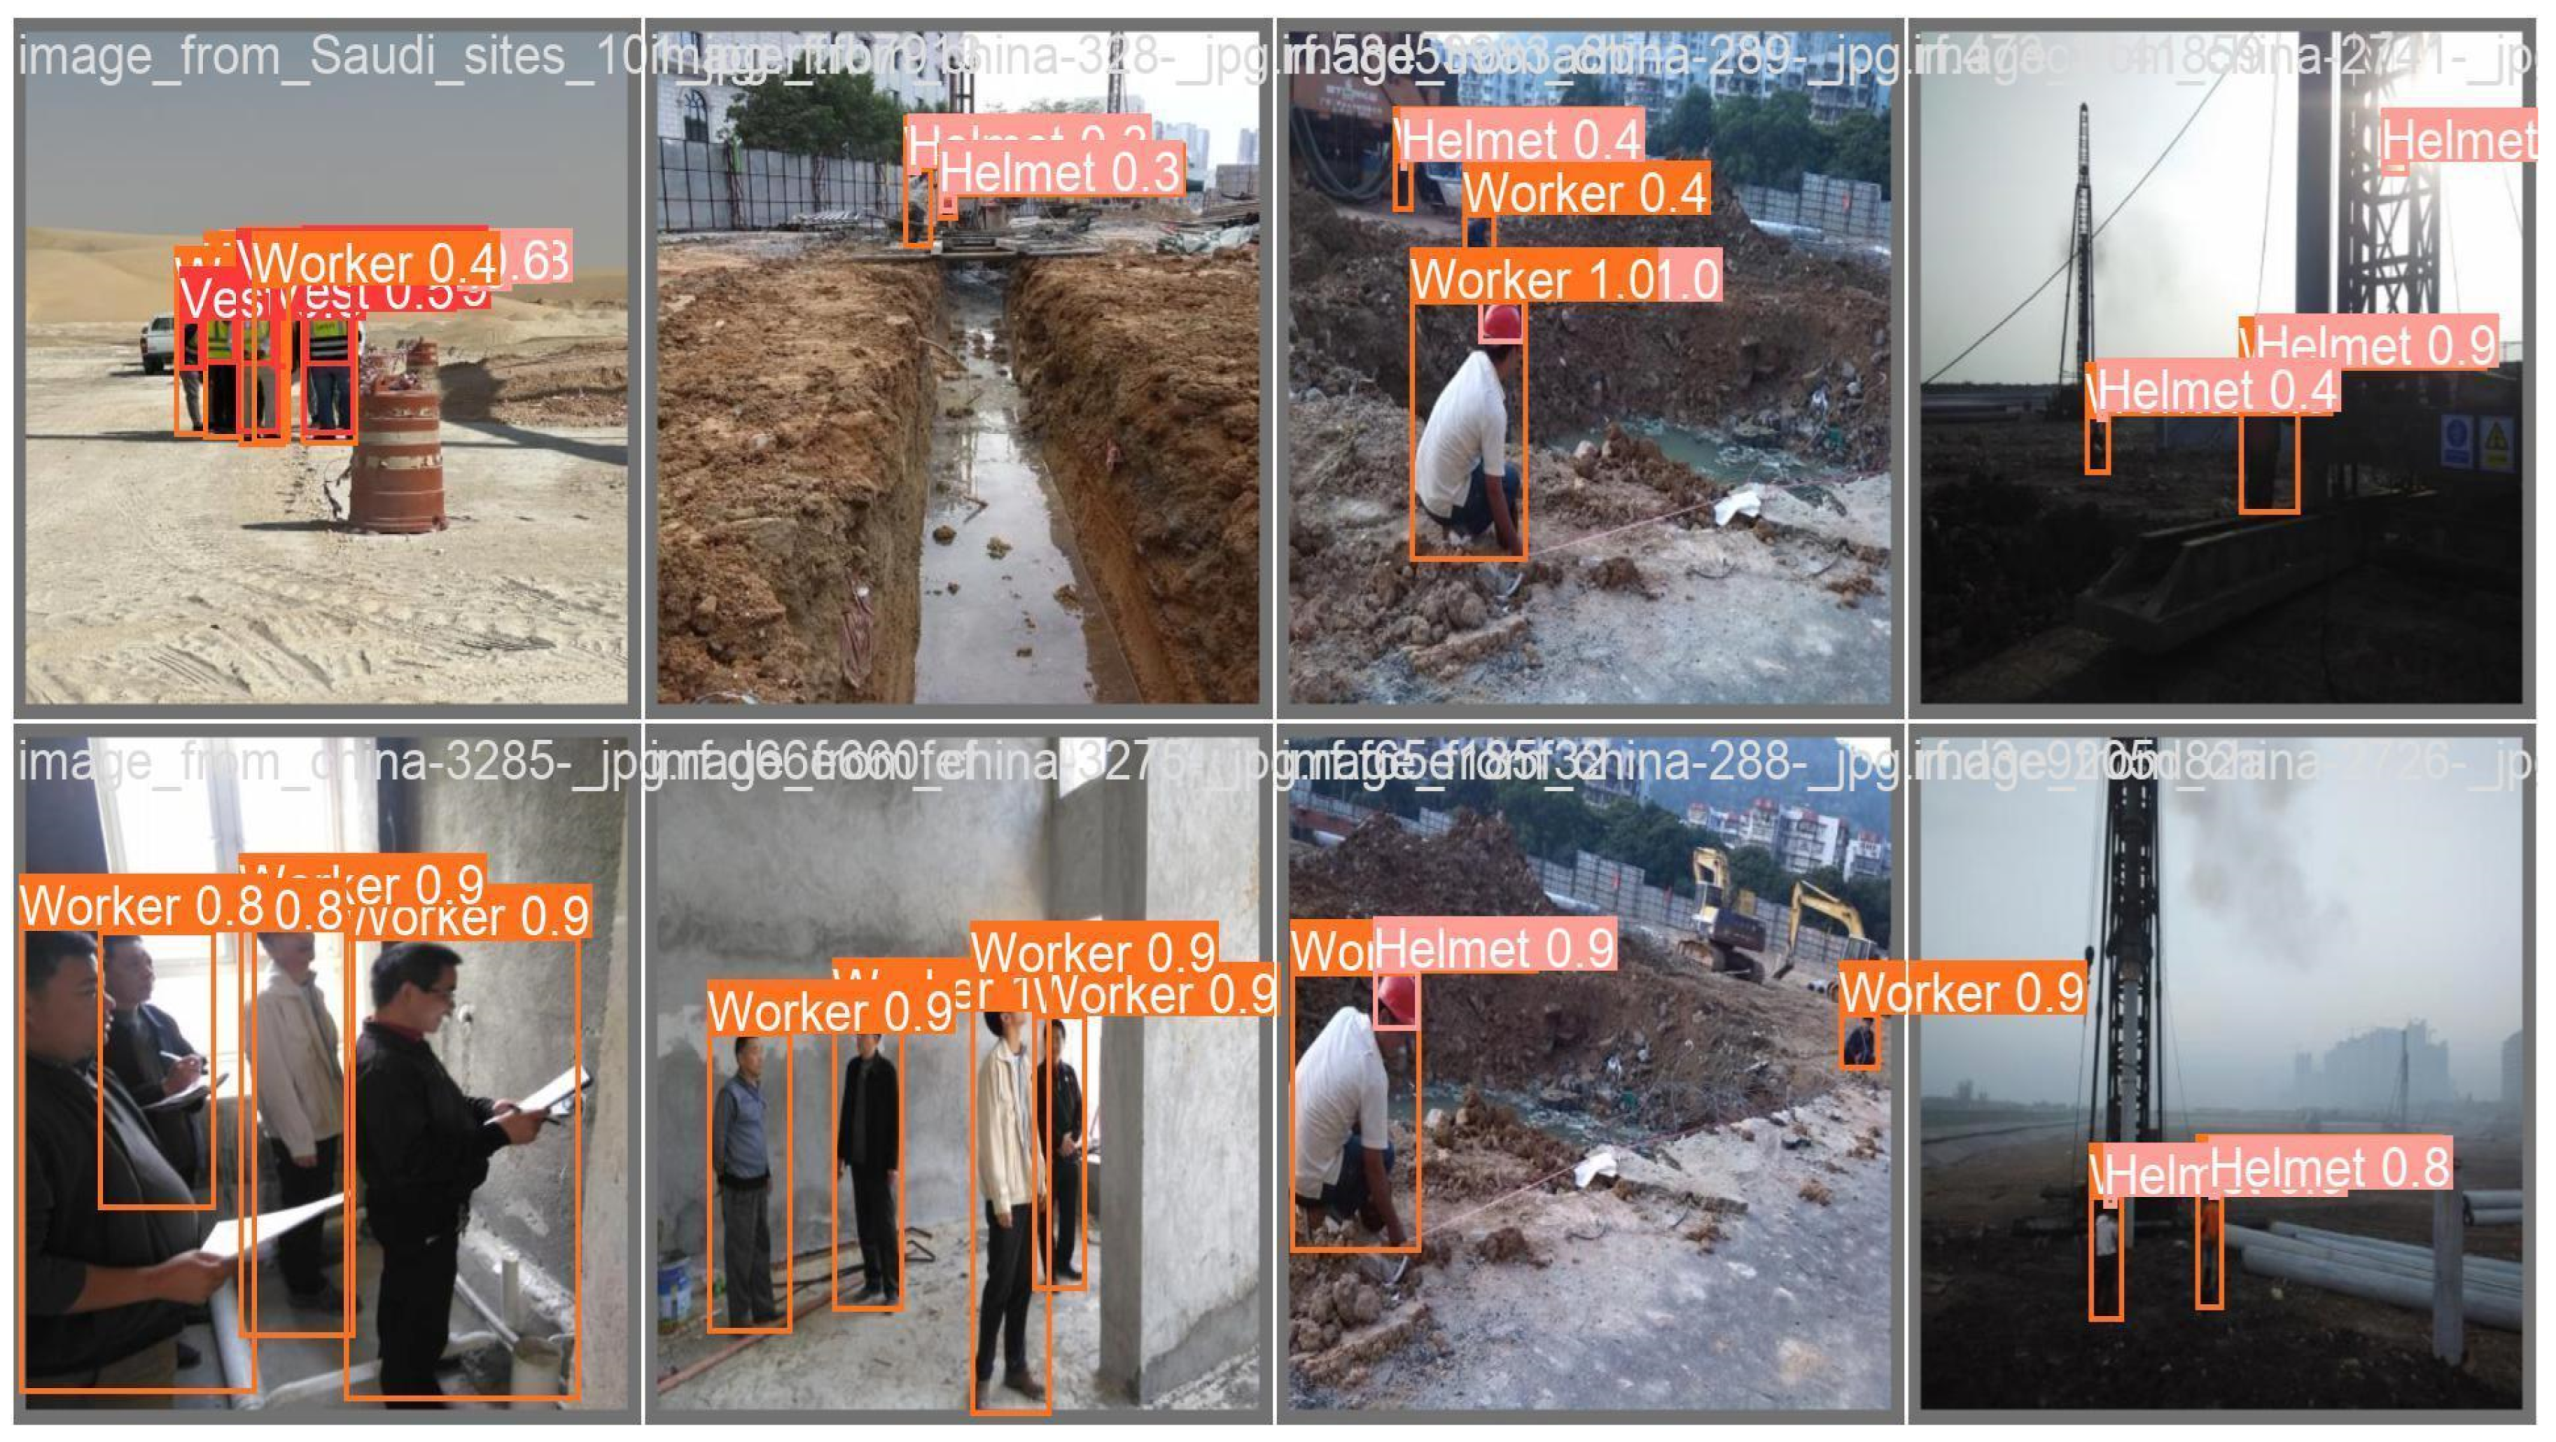
Figure 12 shows some examples of the actual labels of the testing dataset vs. the predicted labels for the model shown in
Figure 13.
From the validation and testing results, we can see that the model could detect the objects with high performance. However, the lowest performance was with the safety helmet class, which is considered a small object to be detected compared to the other classes in the dataset.
On the other hand, the performance of YOLO-v5 on the heavy equipment validation dataset is summarized in
Table 5. The overall precision was approximately 91%, the recall was 86%, and the mAP at the 50 IoU threshold was 93%.
After training and validating the model, the model was tested with our heavy equipment test dataset. The performance of YOLO-v5 on the testing dataset is summarized in
Table 6. The overall precision was approximately 87%, the recall was 88%, and the mAP at the 50 IoU threshold was 92%. The preprocess speed was 0.2 ms, and the inference speed was 1.5 ms per image.
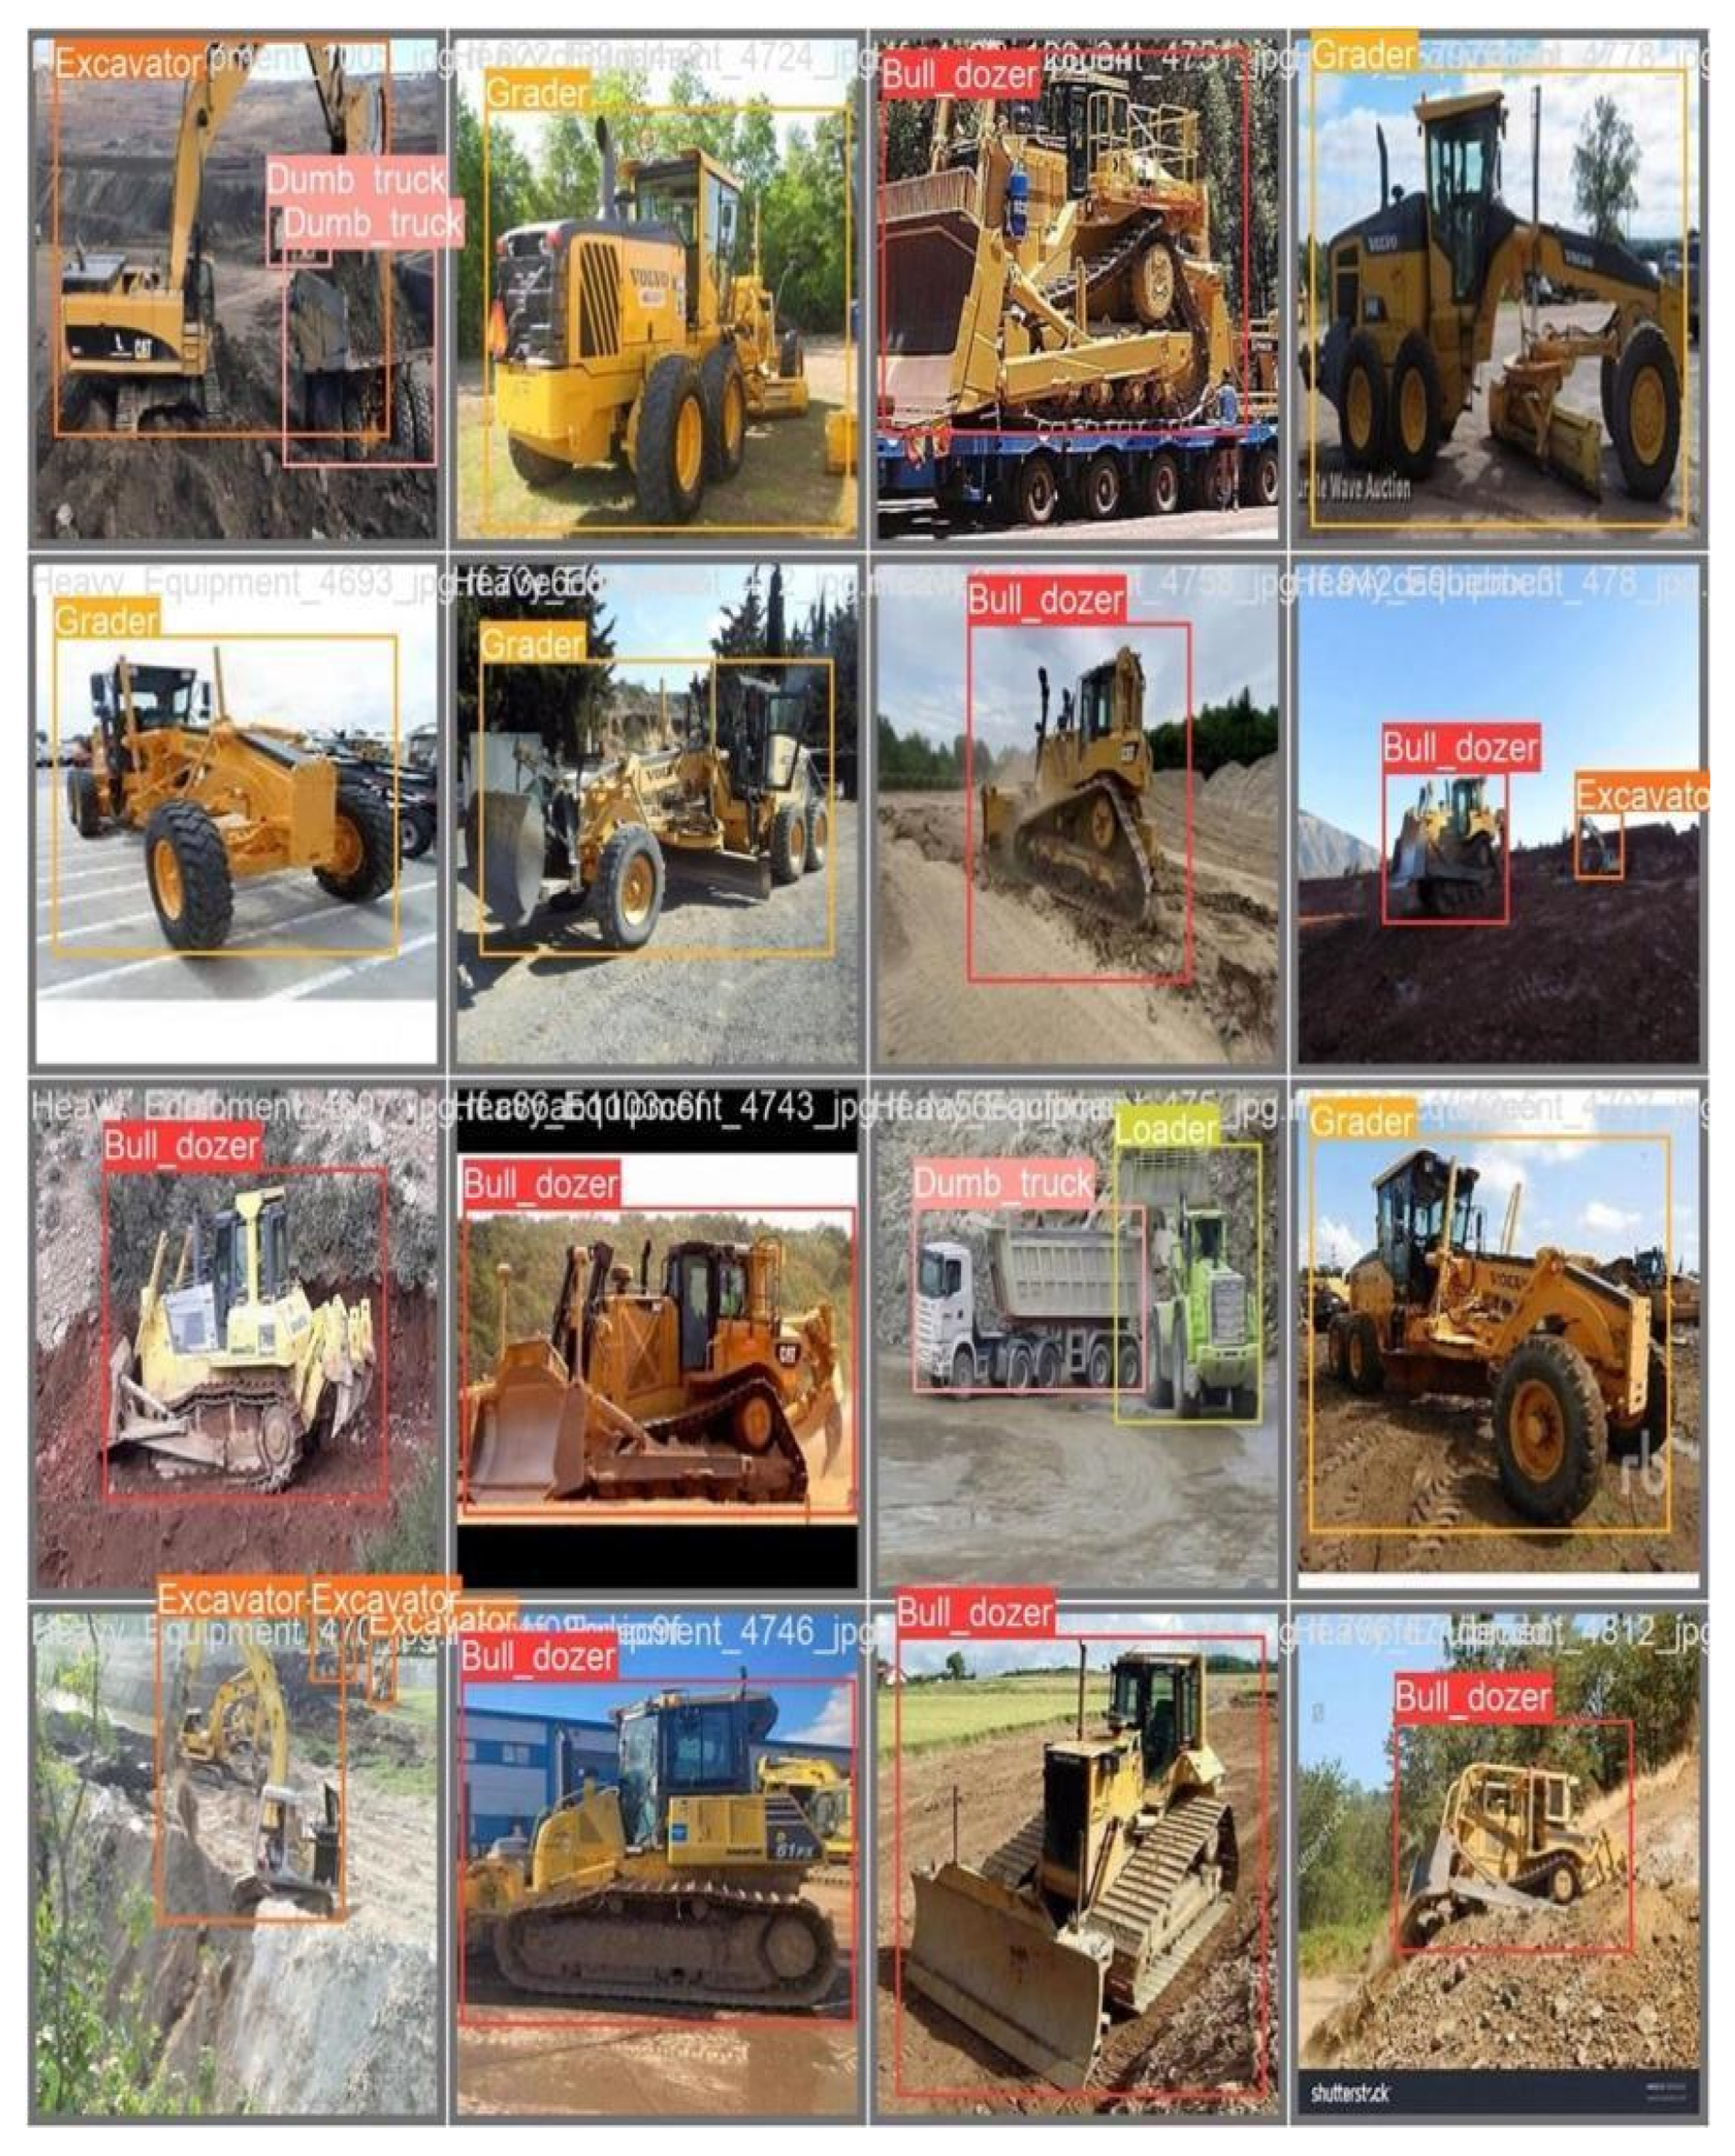
Figure 14 shows some examples of the actual labels of the testing dataset vs. the predicted labels for the model shown in
Figure 15.
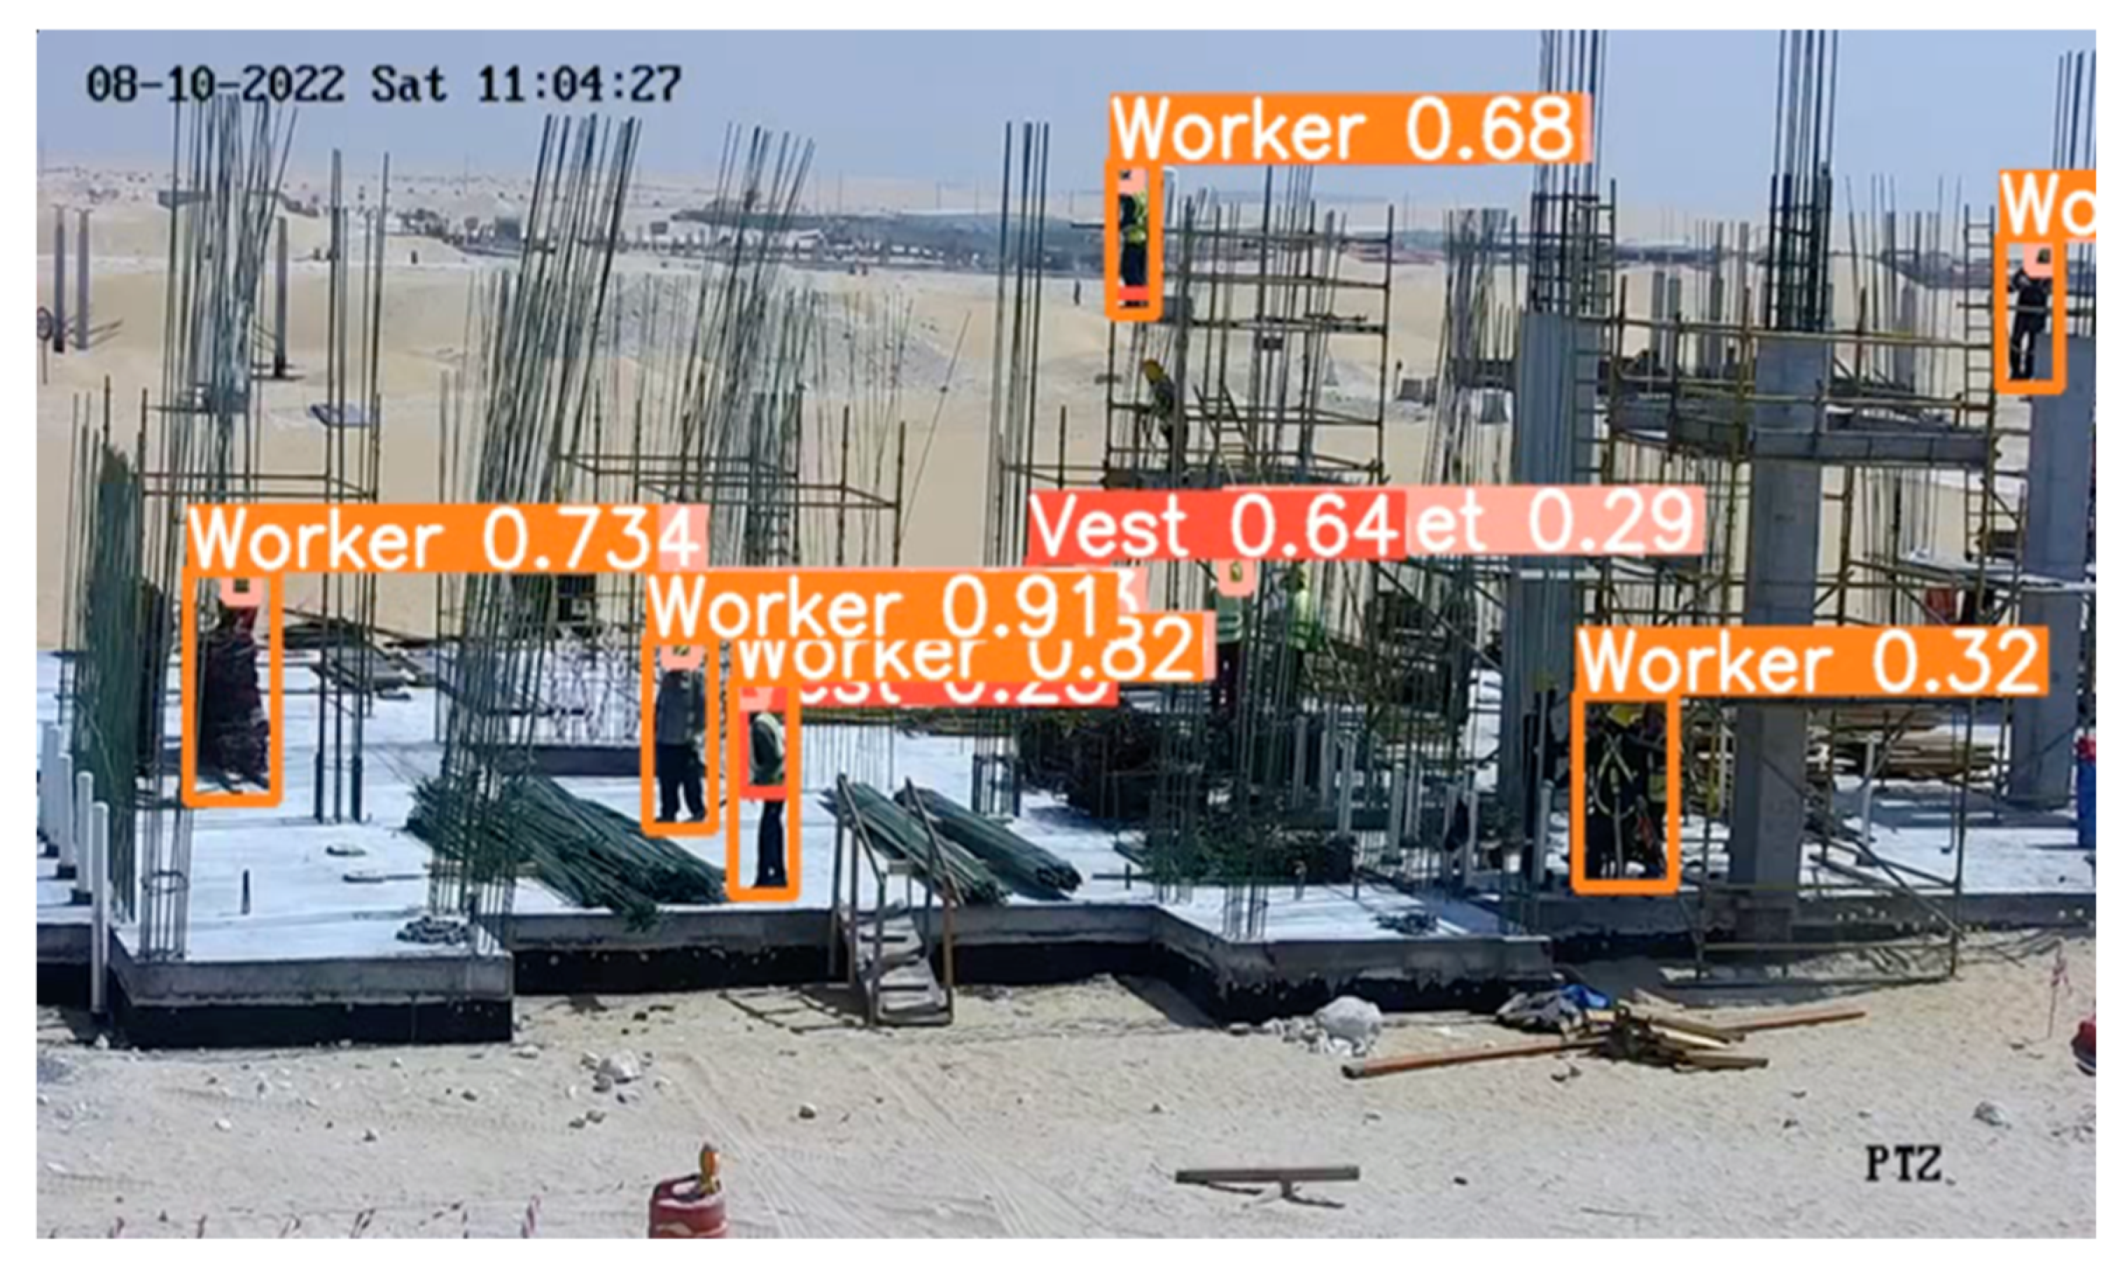
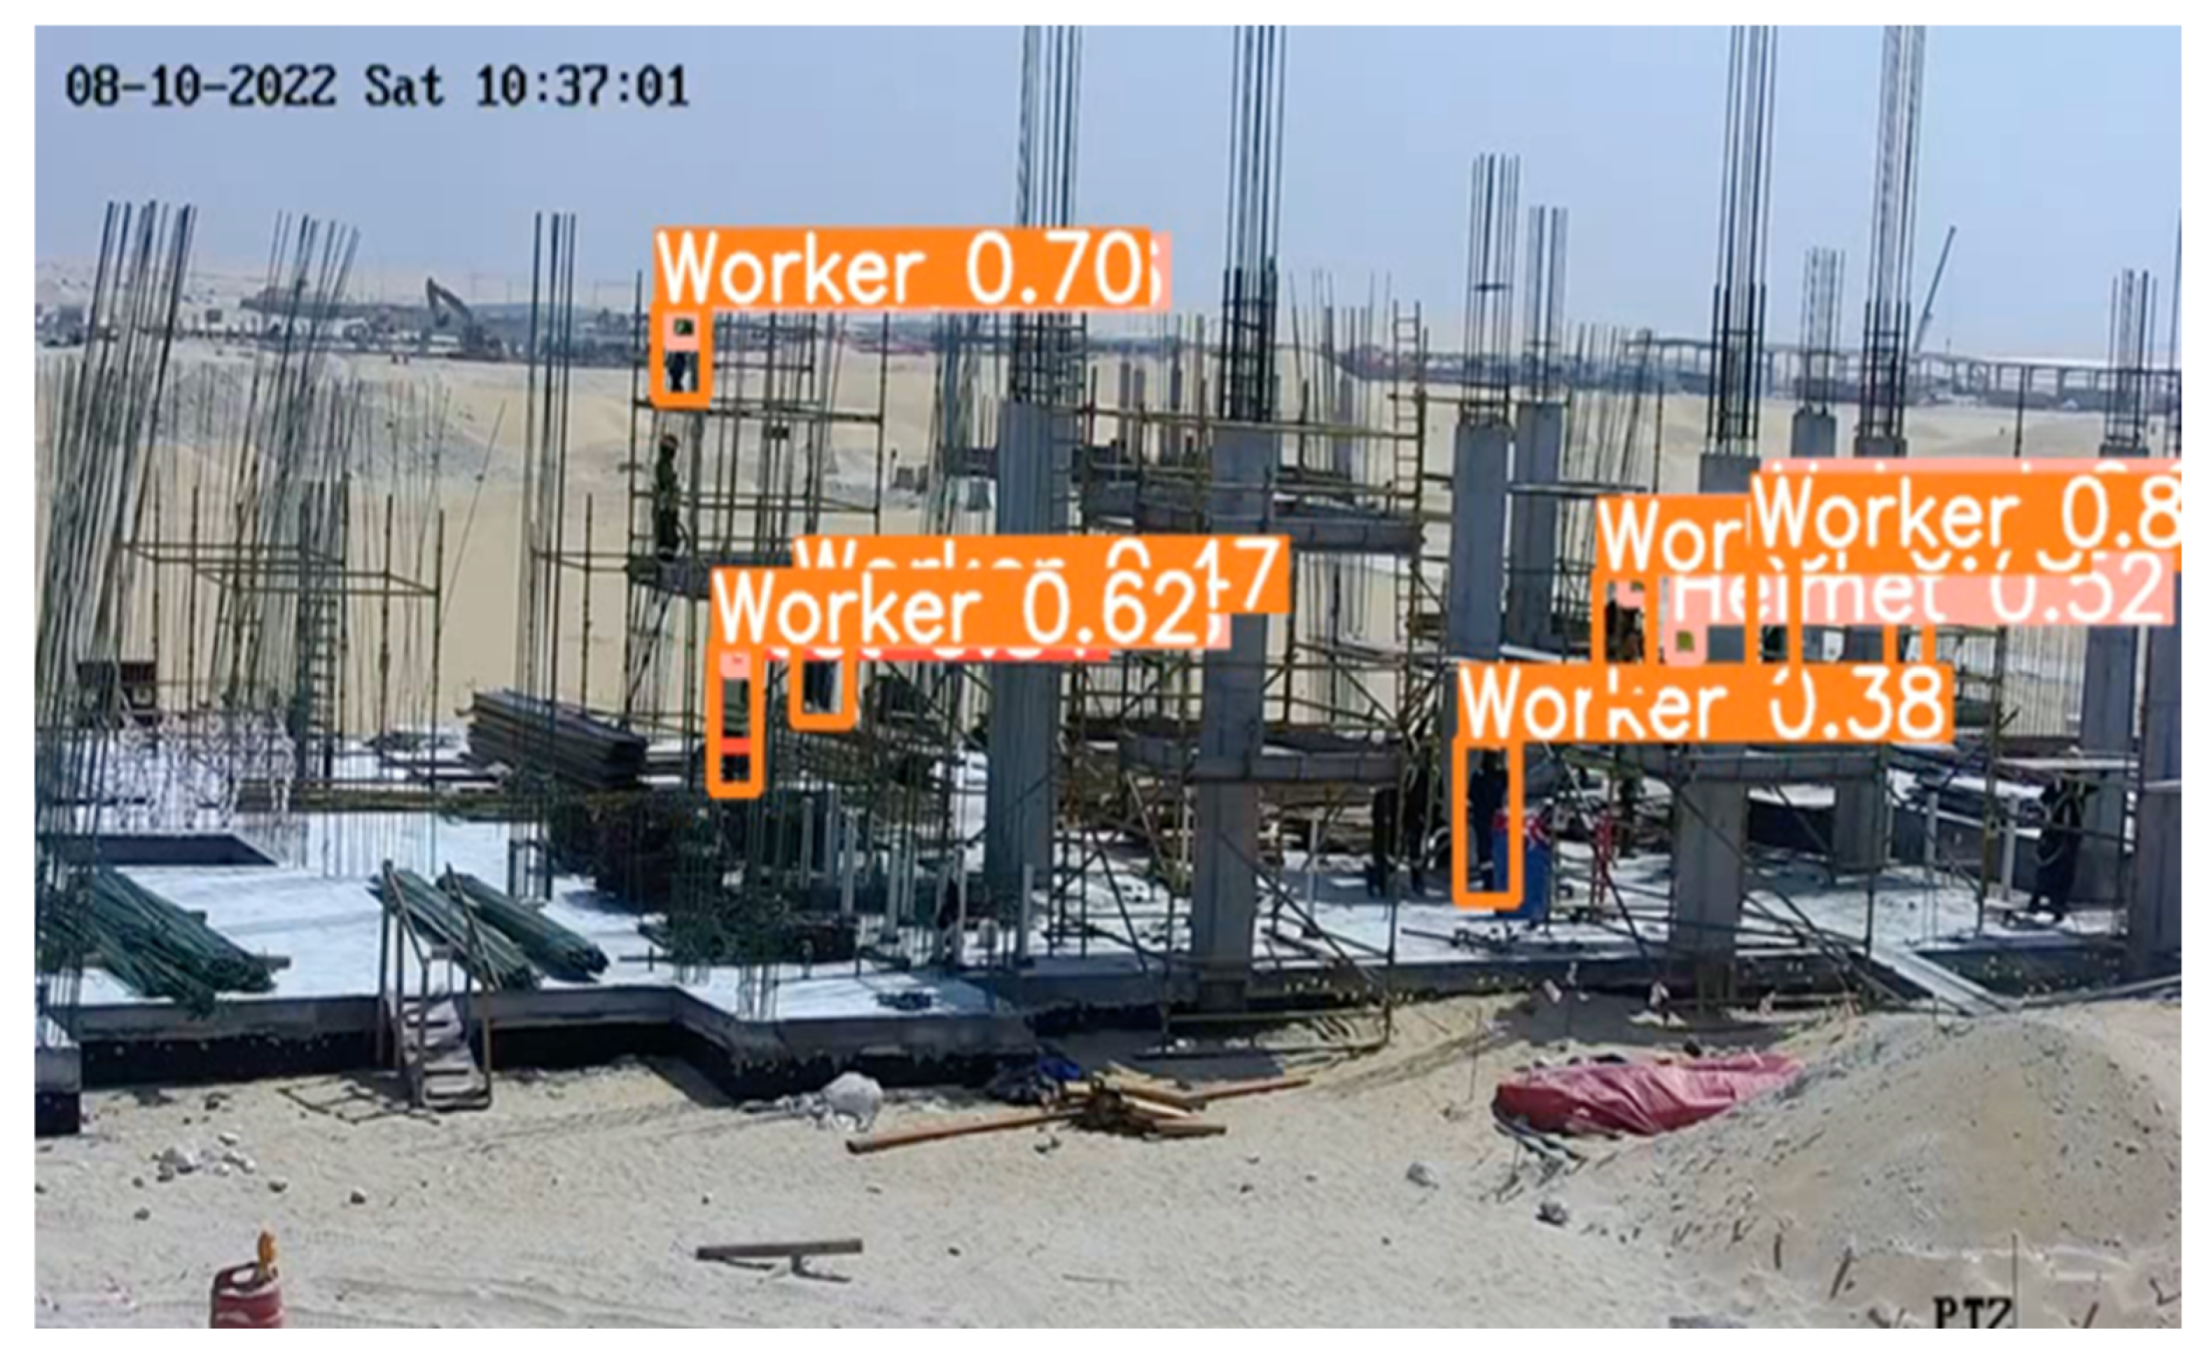
In addition, our model was tested with videos from local construction sites. The model was able to detect the objects with a high inference speed, which was 141 FPS.
Figure 16 and
Figure 17 show an example of the results of the detection.
5. Conclusions
As construction sites are highly hazardous environments, many efforts have been made to improve safety management. Computer vision and deep learning algorithms have made safety management at these sites more competent and efficient. In this study, we implemented the You Only Look Once model, version 5 (YOLO-v5), which was put to use as an object detection model for our dataset to detect workers, personal protective equipment (PPE) and heavy equipment. In addition, weather conditions were considered when designing the system GUI, due to their importance in detecting hazards, especially in extreme weather conditions such as those in Saudi Arabia. The model’s results were promising to detect workers, PPE and heavy equipment on the construction site in real time and with high precision. Moreover, we noticed that the model gave the lowest performance in detecting small objects such as the safety helmets worn by workers. This project may be the first step toward smarter and safer construction sites.
The future work includes enhancements of the proposed system to improve its small object detection. These enhancements will consist of using more data in the training datasets. Another improvement can be to determine the safety status of workers based on the detected PPE and heavy equipment and automatically notify safety officers to prevent accidents. Moreover, spatial–temporal analysis can be added to predict hazardous situations before they happen.


