1. Introduction
In the digital age, the delivery of products to consumers can affect both demand and sales. One effective sales channel in this area is online sales. With the increasing popularity of online shopping among consumers especially in a post-COVID-19 environment, e-commerce business is also becoming more prevalent. According to reports from the French Confederation of Trade Promotions, online sales by its member retailers increased disproportionately by 35% during the 2020 discount season [
1]. In addition, the environmental impact of e-commerce is undeniable, some studies that have analyzed this issue. These studies have found that by optimizing the delivery routes of delivery trucks, e-commerce can reduce the negative impact of consumer shopping and is more sustainable than using one’s own car for shopping [
2,
3]. Moreover, some consumers may be unwilling to shop at physical retail stores due to busy schedules or other inconveniences such as mismanagement, long queues, or inappropriate retailer behavior. A survey report indicates that about 42% of top suppliers in the high-level industry sell their products directly to consumers through online channels [
4].
Online shopping has changed the strategies of supply chain members. One of the crucial marketing strategies used to boost product sales is promotion. Promotions can be classified into three categories: trade promotions (supplier-to-retailer), retailer promotions (retailer-to-consumer), and consumer promotions (supplier-to-consumer). This article focuses on trade promotions while the consumer demand is under negative disruption. In this marketing strategy, suppliers offer a discounted price to retailers and expect that retailers also offer a discount to end consumers [
5]. The cost of this trade promotion is typically the second highest expenditure after the cost of goods. A survey conducted by MEI Computer Technology Group Inc., a leading provider of trade promotion services, found that 42% of the respondents, who were suppliers of consumer goods, indicated that they invested more in trade promotion than ever before in 2010. This significant spending on trade promotion strategies highlights the importance of optimizing these strategies throughout the process [
6]. Additionally, trade promotion practices may result in inefficiencies in cost management and high discounts in trade promotion can lead to inefficient practices and decreases manufacturer’s profit [
7]. Thus, it is crucial to identify and analyze the optimal strategies for promotions in different situations.
Numerous factors can impact the optimal design of trade promotions, such as sales targets, product characteristics, demand uncertainty, and product delivery [
8,
9,
10,
11,
12,
13]. Demand disruption can alter market uncertainty and, as a result, influence trade promotion strategies. There are various real-world examples of promotion strategies to manage demand disruption adopted by companies. For instance, the sudden outbreak of avian influenza (H7N9) in China in 2013 resulted in a decline in demand for caged eggs, leading farmers to offer large discounts to retailers and consumers on their products, while the opposite occurred for seafood and certain medications. Another example is the COVID-19 pandemic, during which companies with online sales were able to maintain their sales while many physical stores had to close, particularly in the second quarter of 2020 [
14]. These and other real-world situations demonstrate the significant economic impact that studying the effects of demand disruption on trade promotion can have. The examination of negative demand disruption within the context of trade promotions is crucial for several reasons. Firstly, trade promotions may be utilized as a means to generate demand in the face of a negative demand disruption. Secondly, firms may have a predetermined budget for marketing and promotions efforts, making it important to consider the impact of demand disruption in the formulation of sustainable trade promotion strategies.
Off-invoice and scan-back are two common types of trade promotion strategies in supply chain management. In the off-invoice, manufacturers offer direct subsidies to retailers. This means that for a limited period of time, a certain discount is given for each product purchased from the manufacturer, with no limit on the quantity of purchased products. The structure of the off-invoice strategy encourages retailers to focus on buying rather than marketing. In the scan-back strategy, manufacturers reimburse retailers a certain amount of money for each unit of goods sold during a promotion. This requires manufacturers to communicate with retailers and verify goods sales based on retailers’ scan data [
13]. This indicates that markets without a retail scanning system (such as point of sale, POS) cannot use the scan-back method.
This study aims to contribute to the literature on trade promotion strategies by addressing the following four questions:
What are the optimal pricing strategies for manufacturers and retailers in a supply chain with uncertain demand when a negative demand disruption occurs?
What is the optimal order quantity for the retailer in this scenario?
What promotional strategy, either scan-back or off-invoice, or contribution to the retailer’s supply costs would be profitable for the manufacturer, retailer, or integrated supply chain in the presence of a negative demand disruption?
How does delivery lead time affect the profits of the manufacturer and retailer during negative demand disruption?
To address these questions, we develop a Stackelberg model to study the impact of demand disruption on different trade promotion strategies in a decentralized channel. Delivery lead time is also investigated as an affected factor in analyzing the above mentioned questions. The model is based on an online retail channel during demand disruption and determines optimal pricing strategies for both manufacturers and retailers, as well as the optimal order quantity. The stochastic demand model considered in the model depends on various factors, including retail channel selling prices and online delivery lead time.
The paper is structured as follows: A literature review is presented in
Section 2. In
Section 3, we explain the problem statement. The model is presented in
Section 4, while an analysis of the model is provided in
Section 5. Finally, concluding remarks are made in
Section 6.
2. Literature Review
Trade promotions are price incentives that manufacturers offer to their retailers. These promotions can be implemented through various methods, such as off-invoice, co-op advertising, and scan-back, and are used in a variety of industries. Previous research in these areas will be reviewed in this section.
Trade promotions in different areas of the supply chain have been explored in several publications. For example, researchers examined a retail incentive in a two-stage supply chain dealing with scan-back trade. Their study found that the manufacturer and supplier in the supply chain can benefit from the scan-back trade mode, but this is not always the case for the retailer. However, they also found that scan-back trade can be profitable for both parties if it is accompanied by a buy-back agreement [
15]. In the study [
16], a two-stage supply chain model in which a manufacturer supplies a product to a retailer is presented and authors used a trade promotion method to supply chain by determining the optimal prices for multi-period wholesale. Their results demonstrated the benefits of supply chain coordination when the cost of set-up or reordering by the consumer is high and demand is low on average. Authors of [
17] designed a new model based on a promotional strategy that considers the benefits of the manufacturer and retailer separately. In their proposed strategy, they aimed to maximize both the manufacturer’s and retailer’s profits. They found that the retailer’s profit in their proposed strategy was better than it would be in an off-invoice manner. The effect of non-monetary product promotion based on the two channels was also studied in the literature. In [
18], authors proposed a strategy for a two-level supply chain that includes manufacturers and retailers and studied the buy-one-get-one (BOGO) process.
Although several studies in the literature examined various supply chain structures, including multiple manufacturers, wholesalers, retailers, and online retailers but few of them considered promotion strategies. Most of the studies in the area of trade promotion, studied a supply chain with a single manufacturer and retailer, and few studies examined a supply chain with more than two actors. However, some studies focused on other types of promotions in the supply chain with more than two actors. In [
19], a supply chain network with a dual-channel for remanufacturing was developed. They used two separate channels, the direct channel and the retail channel, where the manufacturer in the proposed network delivers and sells the goods to the consumer through both channels at the same price. The effect of price discount contracts and pricing policies in a dual-channel supply chain is examined in [
20]. Two Stackelberg and one Nash game were investigated, and authors showed that all scenarios with price discount contracts overcome the other scenarios. In the study [
21], authors investigated a two-echelon, multiple-retailer distribution channel while taking into account the promotional strategies used by the retailers and their sales learning curve. They stated that keeping a portion of promotion costs within a reasonable range increased the profits of all the channel coordination participants. The impact of asymmetric demand information on a multi-period price promotion in a supply chain with a single supplier but several retailers was studied in [
5]. They developed a stochastic bi-level optimization model while taking into account a Stackelbeg game, and they employed the linearization technique to find the precise solution. A three-echelon supply chain with two retailers in the downstream of the supply chain was studied in [
22]. The supplied products of the manufacturer include some imperfect quality items. Their findings indicated that while all unit quality discounts with franchise fees can resolve channel conflict, they are unable to generate profits that benefit all chain members equally.
As mentioned previously, optimal trade promotion is influenced by various factors, such as the uncertainty of demand, marketing budget, and product characteristics. Considering demand uncertainty, a trade promotion technique based on manufacturer-retailer channels is developed in [
13] and a technical analysis is conducted for two separate markets using off-invoice and scan-back discounts. The results of this study showed that manufacturers offer better discounts for off-invoice than for scan-back. Authors of [
23] also applied two separate models to analyze the promotional trade of retailers and manufacturers using an uncertain supply chain demand approach. The objective of the first model is to maximize the retailer’s profit by finding promotional efforts of the retailer based on trade promotion manner. In addition, the second model is an extension of the first model that considers how the manufacturer’s trade promotion manner is.
The delivery time of the product can also impact the uncertainty of demand. Several studies have examined the delivery time-dependent stochastic demand in the supply chain. The study [
24] examined the benefits of sharing demand forecast information in a two-level dual-channel supply chain. A dual-channel supply chain model for the newsvendor problem also is developed in [
25], considering the delivery lead time of the online channel. However, to the best of our knowledge, there are no articles in the literature that consider trade promotion in conjunction with delivery time-dependent stochastic demand.
Regarding demand uncertainty and disruption, some studies have investigated sustainable operations in the supply chain. Sustainable operations concepts investigated in [
26] and authors proposed appropriate guidelines for their implementation in Brazilian supply chains. The study [
27] analyzed the role of supply chain inventory control systems in a sustainable approach under nonlinear backorder costs. Authors of [
28] presented a new game-theoretic model to examine the impact of sustainability aspects on product line length and found that sustainability can reduce the length of the product line and the conflict between society and businesses, as well as the impact of channel decentralization. In Ref. [
29], authors studied the price discount of a sustainable supplier in a competitive environment in a two-level supply chain with two suppliers and one retailer, examining the impact of the supplier’s price discount on the retailer’s profit under uncertain demand. They found that the expected profit of a sustainable supplier increases as the price discount increases, but also found that when both suppliers offer a price discount and the retailer’s purchasing cost decreases, the supplier’s expected sustainable profit decreases. In Ref. [
6], researchers evaluated a trade promotion strategy based on sustainability, demand uncertainty, and capacity constraints in a supply chain network (while focusing on positive demand disruption), which is closely related to the current study. They analyzed three types of trade promotion separately and derived the optimal decision for each strategy. The results of their study confirm that both levels of the supply chain, including manufacturers and retailers, adopt aggressive pricing strategies when demand is disrupted. The results of their study indicate that, for a given level of demand disruption, the off-invoice method is preferred over revenue sharing.
This research makes several contributions to the existing literature on trade promotion. It determines the optimal pricing for the manufacturer and the optimal pricing and quantity for the retailer and compares the profits of different strategies under negative demand disruption. It also examines the coordination of delivery costs between the manufacturer and the retailer and compares trade promotion strategies, which has not been previously explored. Finally, it considers delivery time-dependent stochastic demand in the presence of sudden disruption in demand, which has not been addressed in previous studies. These contributions provide new insights into the impacts of trade promotion strategies on supply chain profitability under different demand and delivery scenarios.
3. Problem Statement
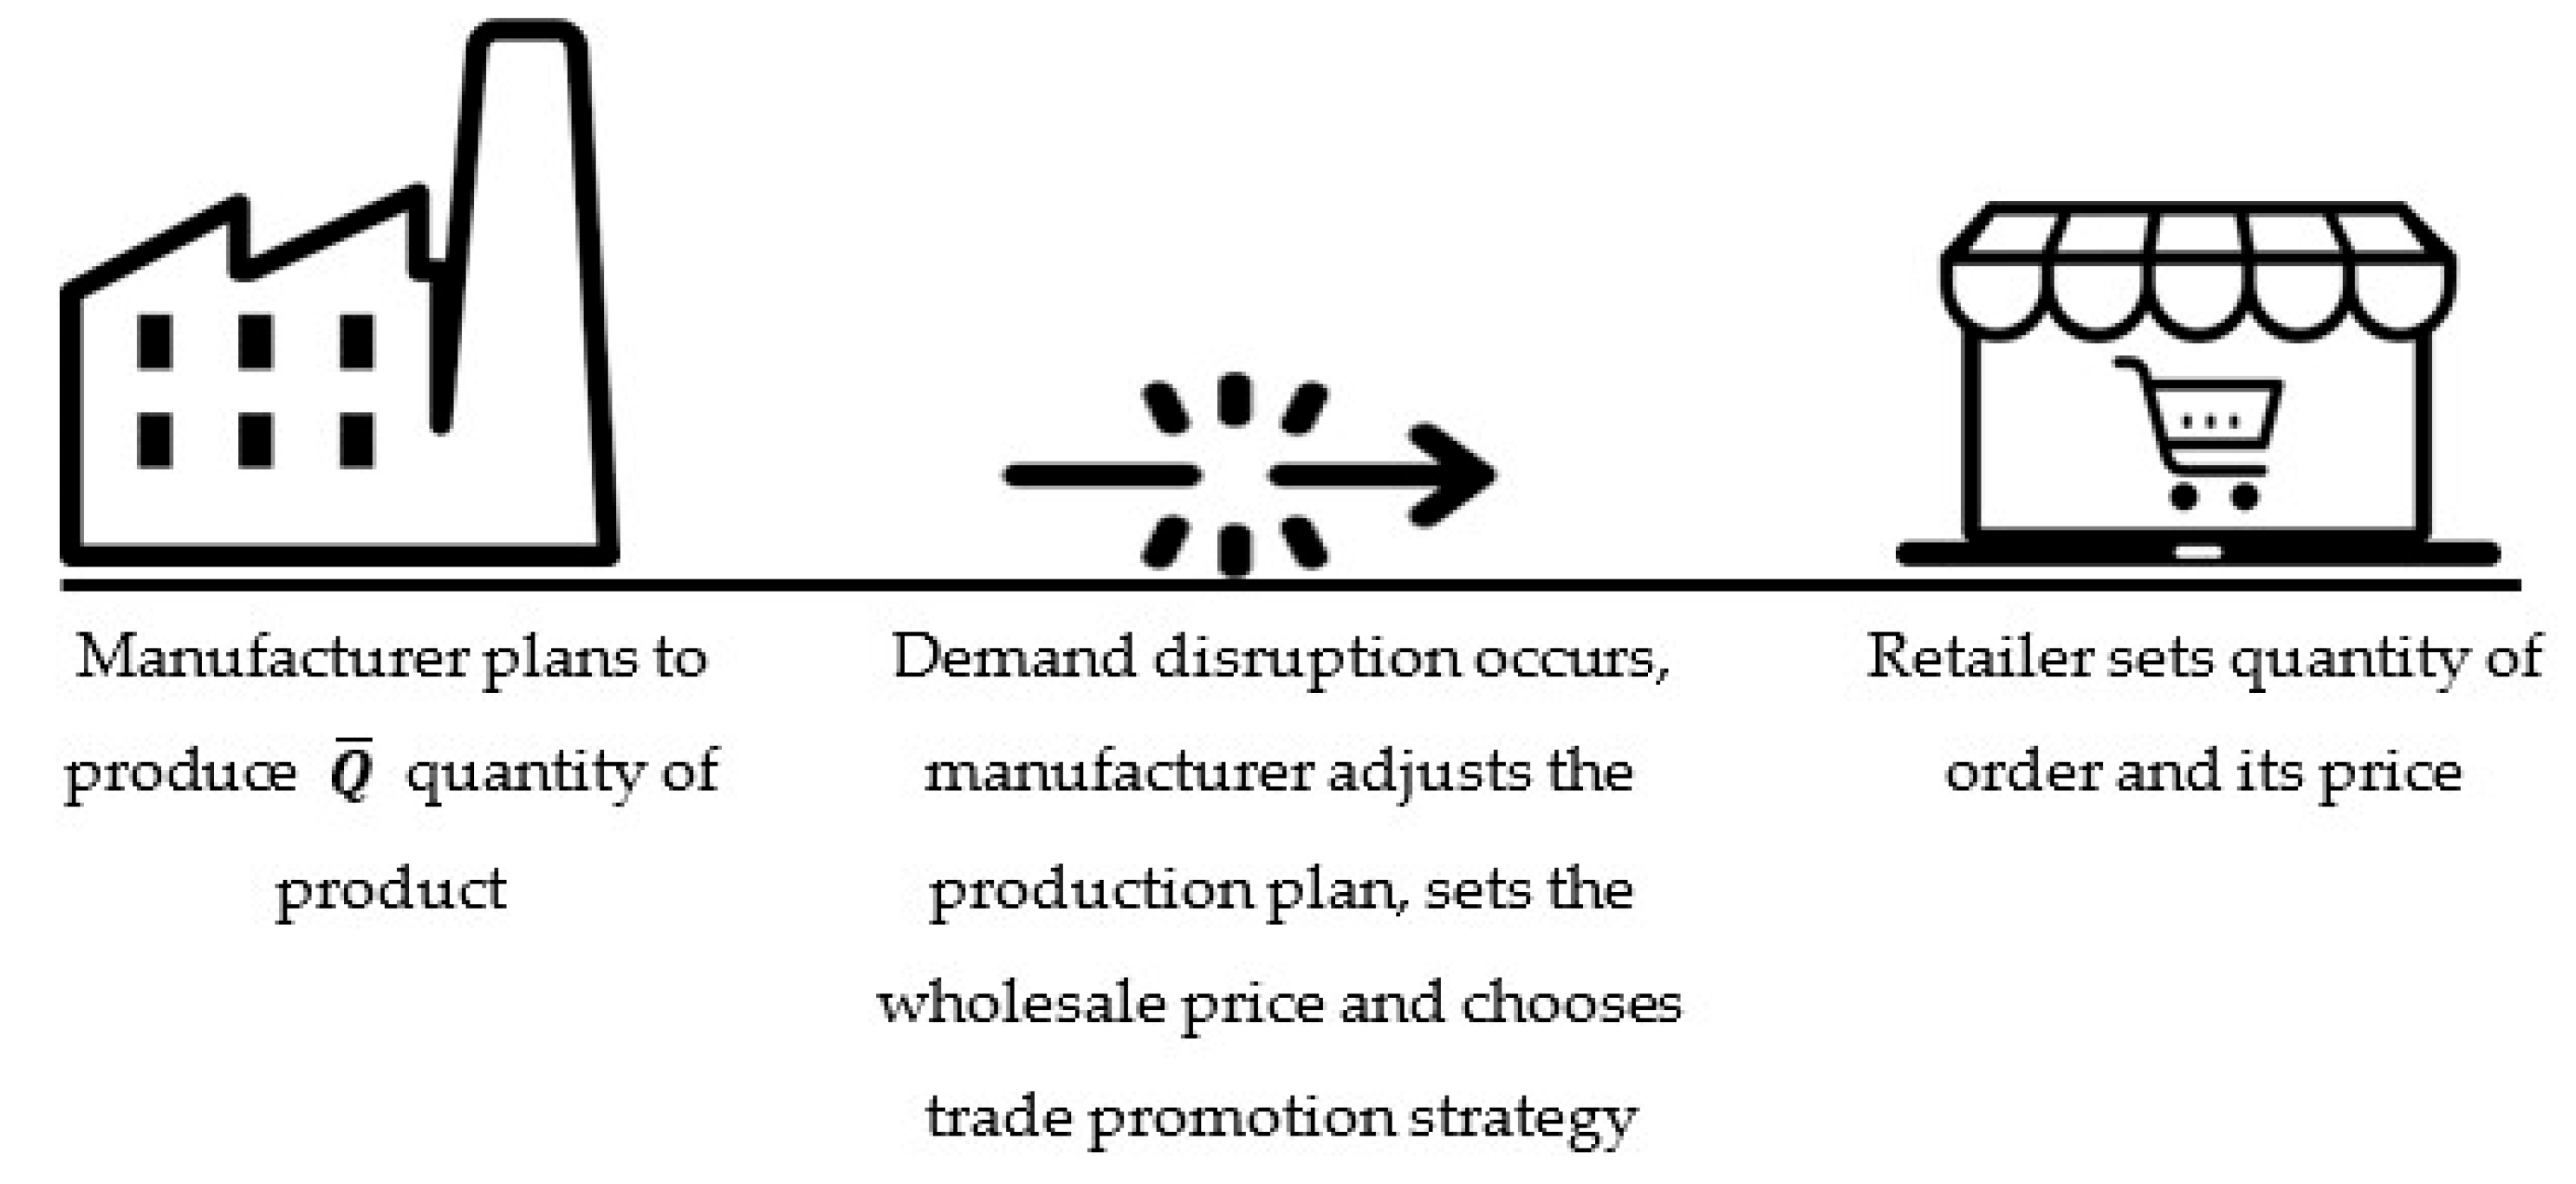
In this study, we examine a supply chain model comprising a manufacturer and a retailer. The model assumes two periods of operation. In the first period, the manufacturer produces a product based on forecast demand, which is a function of the retailer’s price and the delivery lead time and follows a uniform random variable. In the second period, the forecasted demand may be disrupted, resulting in a deviation from the original forecast. This disruption can take the form of a positive or negative deviation in demand. If the market experiences a sudden boom, the manufacturer must incur additional costs to increase production in order to meet the increased demand. This additional production is more costly. However, in the event of positive disruption, both the manufacturer and retailer have the option to raise their prices.
In the event of a negative disruption, however, the demand in the market would experience a sudden decrease. As a response, managers may consider implementing incentives for retailers in an effort to stimulate demand. In this study, we examine an appropriate trade promotion strategy for manufacturers to follow in case of negative demand disruption by setting an optimal wholesale price. The retailer, in turn, determines an optimal price and quantity of orders in order to maximize profit.
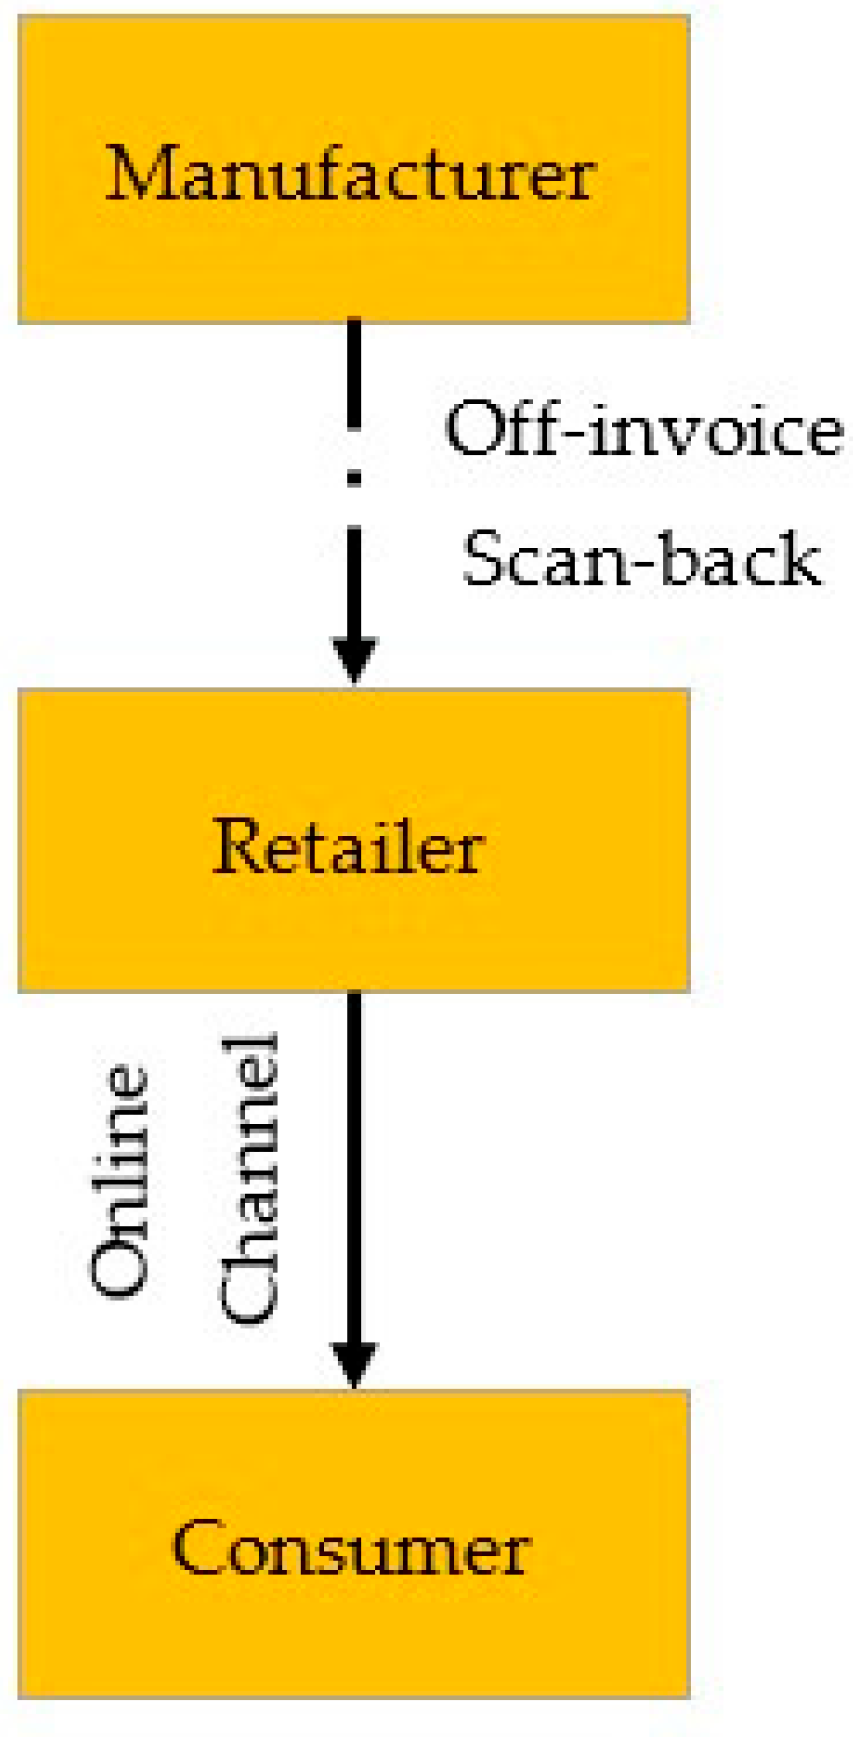
It is worth noting that the manufacturer may choose to utilize an off-invoice or scan-back promotion, or may opt to provide support to the retailer by covering a portion of delivery costs. The off-invoice policy involves offering discounts on products, while the scan-back policy involves manufacturers reimbursing retailers for each unit of goods sold during a promotion (
Figure 1 and
Figure 2).
Assumptions, Parameters, and Decision Variables
Initial delivery lead time is a given parameter that the retailer cannot change due to the related constraint of the system and its budget.
A given budget for marketing of manufacturer is considered and the discount for each product is fixed.
| Per-unit finished cost of the product for the manufacturer |
| Initial demand of the market |
| Initial demand of the market after a sudden change in demand |
| Price sensitivity in the online channel |
| Delivery lead time sensitivity parameter of Demand in the retail channel |
| Discount in the off-invoice policy |
| Discount in the scan-back policy |
| A continuous random variable that follows a uniform distribution |
| Previous production plan of the manufacturer |
| Additional unit cost of producing additional products, when |
| Per-unit disposal cost of products, when |
| : Price of the retail channel in the off-invoice policy | : Price of the retail channel in the scan-back policy |
| : Order of the retail channel in the off-invoice policy | : Order of the retail channel in the scan-back policy |
| : Wholesale price in the off-invoice policy | : Wholesale price in the scan-back policy |
| : Retailer’s profit in the off-invoice policy | : Retailer’s profit in the scan-back policy |
| : Manufacturer’s profit in the off-invoice policy | : Manufacturer’s profit in the scan-back policy |
The demand function is given as follows [
6,
30]:
where
denotes the retailer price and
is a continuous random variable that follows a uniform distribution on
),
].
We assume that the manufacturer plans production considering demand as
. Then an abrupt disruption occurs and demand changes to
, where
,
captures the disruption intensity. In the event of a positive disruption, the market suddenly increases and
, while in the event of a negative disruption, the market suddenly decreases and
. The demand uncertainty in the event of a disruption is assumed to follow a uniform distribution on
),
]. This assumption is based on observations in the internet industry, where high demand leads to high returns and high risk. It is also assumed that the disposal cost is lower than the unit cost of production, such that
and
[
6].
5. Model Implementation and Results
In this section, we investigate the effect of negative demand disruption and delivery lead time on the trade promotion strategies and profits of manufacturers and retailers. We also compare various marketing strategies under negative demand disruption in terms of the manufacturer’s profit, retailer’s profit, and integrated profit.
To conduct such a test, we compare the result of our model for different intensities of demand disruption, costs on trade promotions, and delivery lead times, using the parameters of [
6,
30], which are as follows:
.
For the sake of simplicity we just present the absolute value of negative disruption in this section.
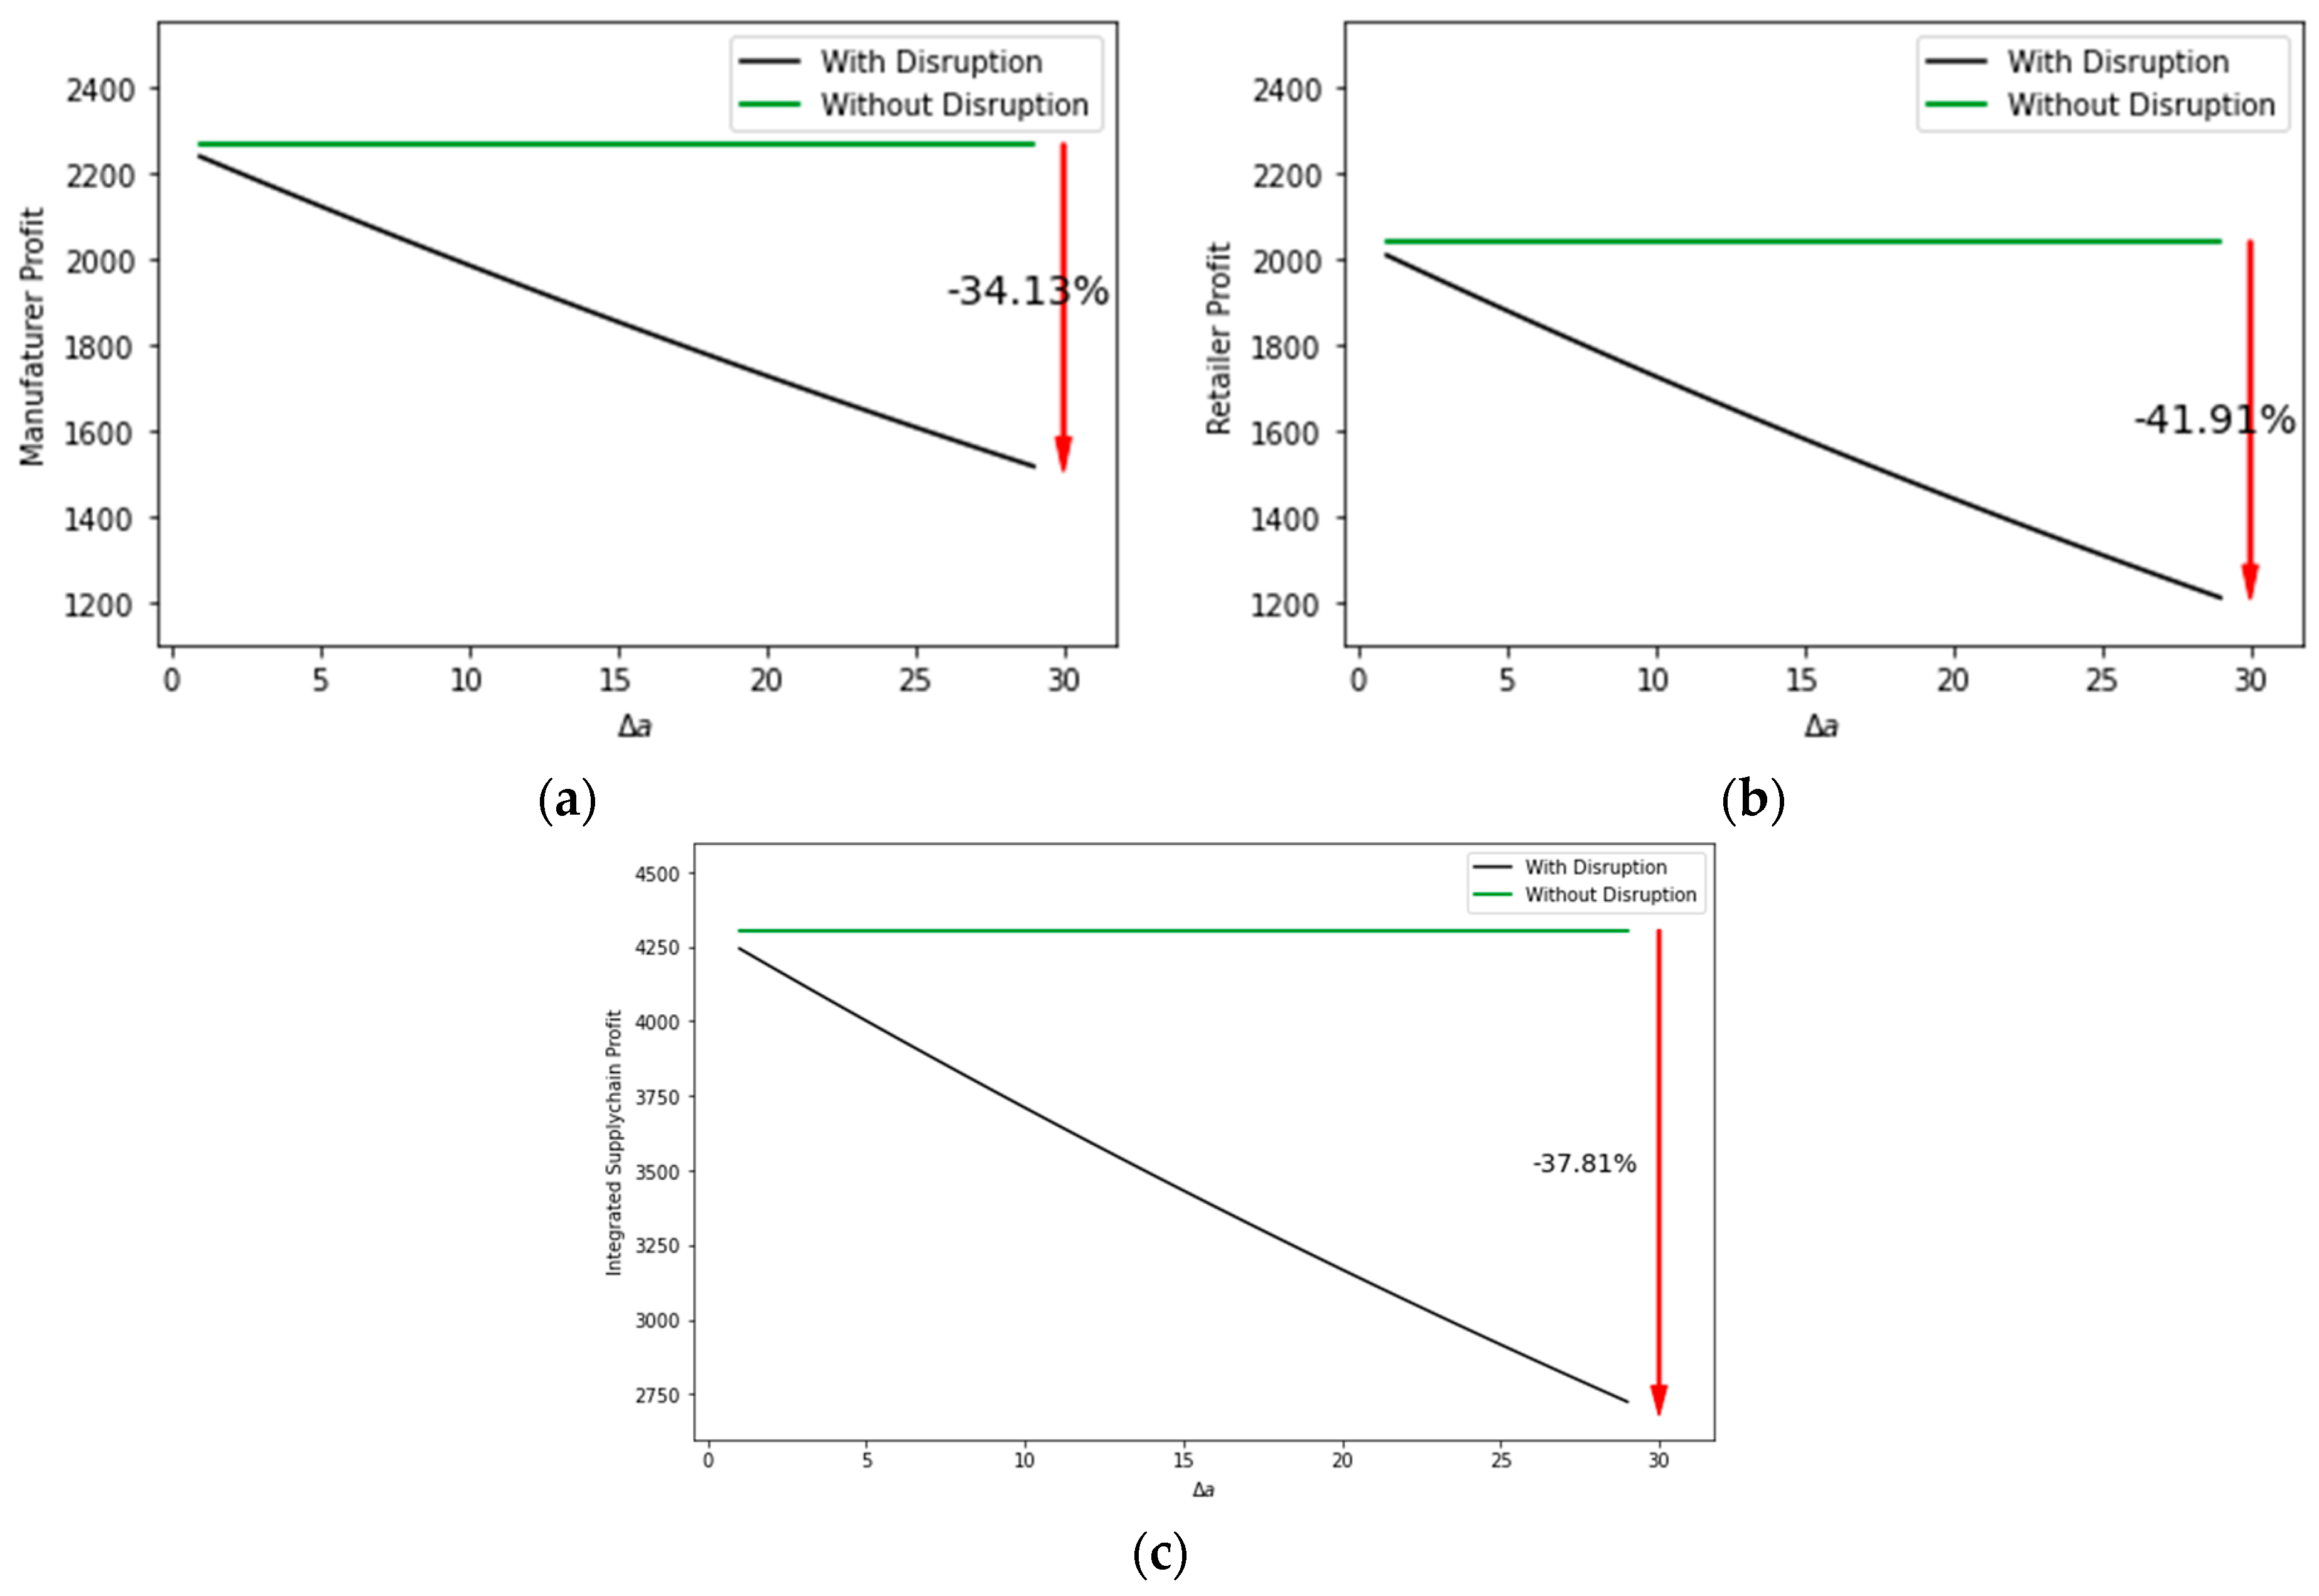
5.1. Impact of Demand Disruption on Profit
This section aims to examine the impact of negative demand disruption on the profits of manufacturers, retailers, and the integrated supply chain.
The integrated supply chain refers to the total profit of the supply chain, including the profits of both the manufacturer and the retailer. In this scenario, there is a single decision maker who possesses all relevant information about the supply chain, manages it, and is able to optimize the performance of the entire system (channel coordination) [
34]. The profit of the integrated supply chain is obtained by summing the profits of the manufacturer and the retailer.
As illustrated in
Figure 3a–c, a negative demand disruption in the range [0–30] or equally 0% to −26.8% negative disruption in demand leads to a decrease in the profit of the manufacturer, retailer, and integrated supply chain by −34.13%, −41.91%, and −37.81%, respectively. This is due to the fact that higher levels of disruption intensity result in a greater impact on the customer demand and manufacturer’s production schedule, leading to an increase in the manufacturer’s costs and a corresponding decrease in the profit of the manufacturer, supply chain, and its members. In addition, because disruption affects more factors of the retailer’s profit, including the wholesale price, order quantity, and retailer price, causes to decrease in the retailer’s profit more than the manufacturer’s.
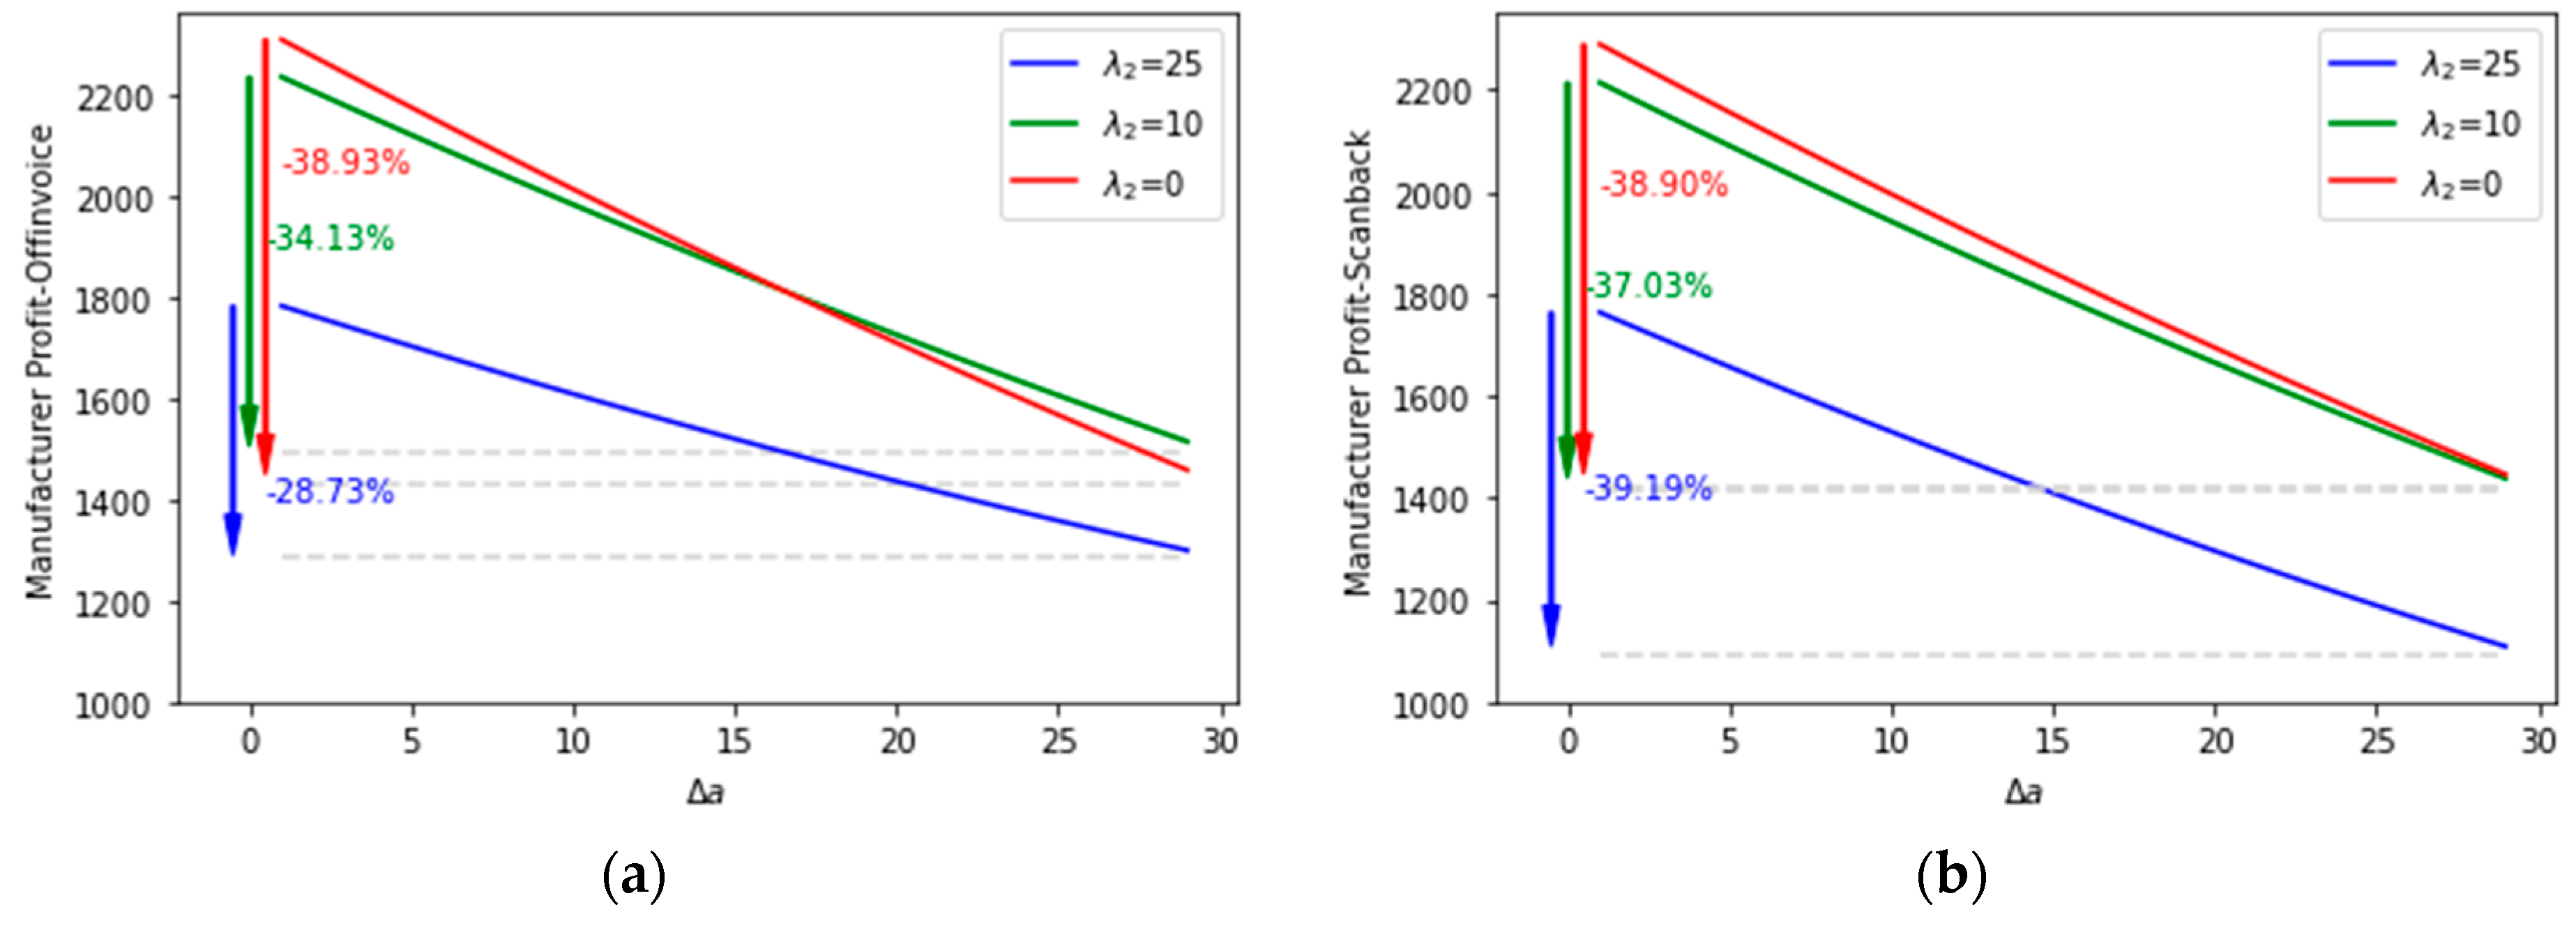
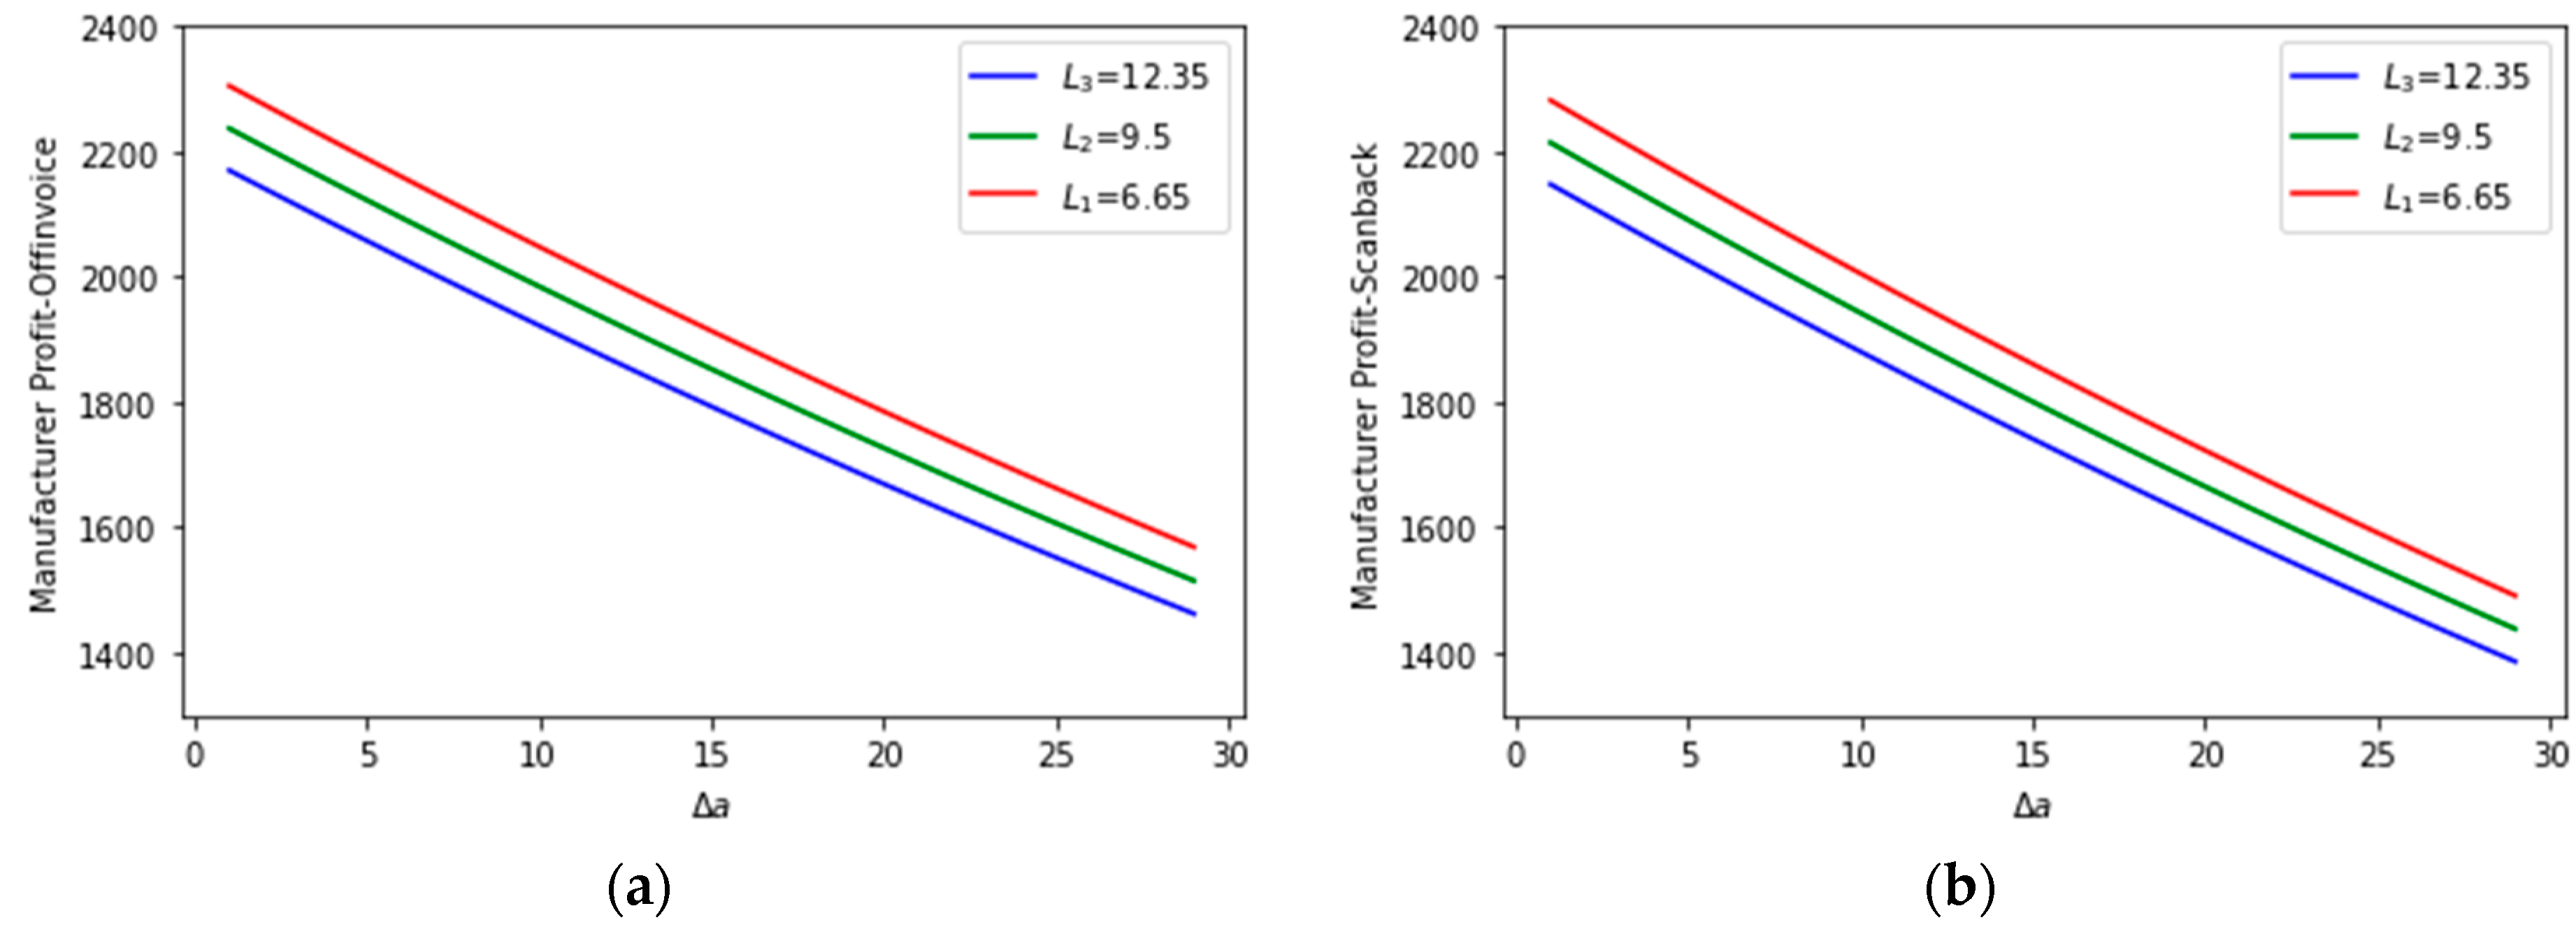
5.2. Impact of Demand Disruption and Manufacturer’s Cost on Trade Promotion and Profit
Figure 4 displays the profit of manufacturers under different trade promotion policies in the presence of negative demand disruption. As shown in both
Figure 4a,b, the profit of manufacturers decreases as the intensity of negative demand disruption increases. This is due to the fact that demand decreases with negative demand disruption. In the off-invoice policy, higher disposal costs lead to lower profit for manufacturers before
due to increased costs. However, after this point, disposal costs of
lead to higher profit as the wholesale price decreases and stimulates more consumers’ demand that compensates for the associated costs. In contrast, this phenomenon occurs later in the scan-back policy. This may be because, in the scan-back policy, discounts are only paid after the retailer has sold the products. Furthermore, the rate of diminishing returns is higher under the scan-back policy compared to the off-invoice policy, particularly when disposal costs are higher. This suggests that the off-invoice policy may be a more sustainable strategy in such circumstances. This may be because the retailer places larger orders in the off-invoice strategy than in the scan-back back [
23], allowing the manufacturer to earn more profit even in the presence of negative demand disruption.
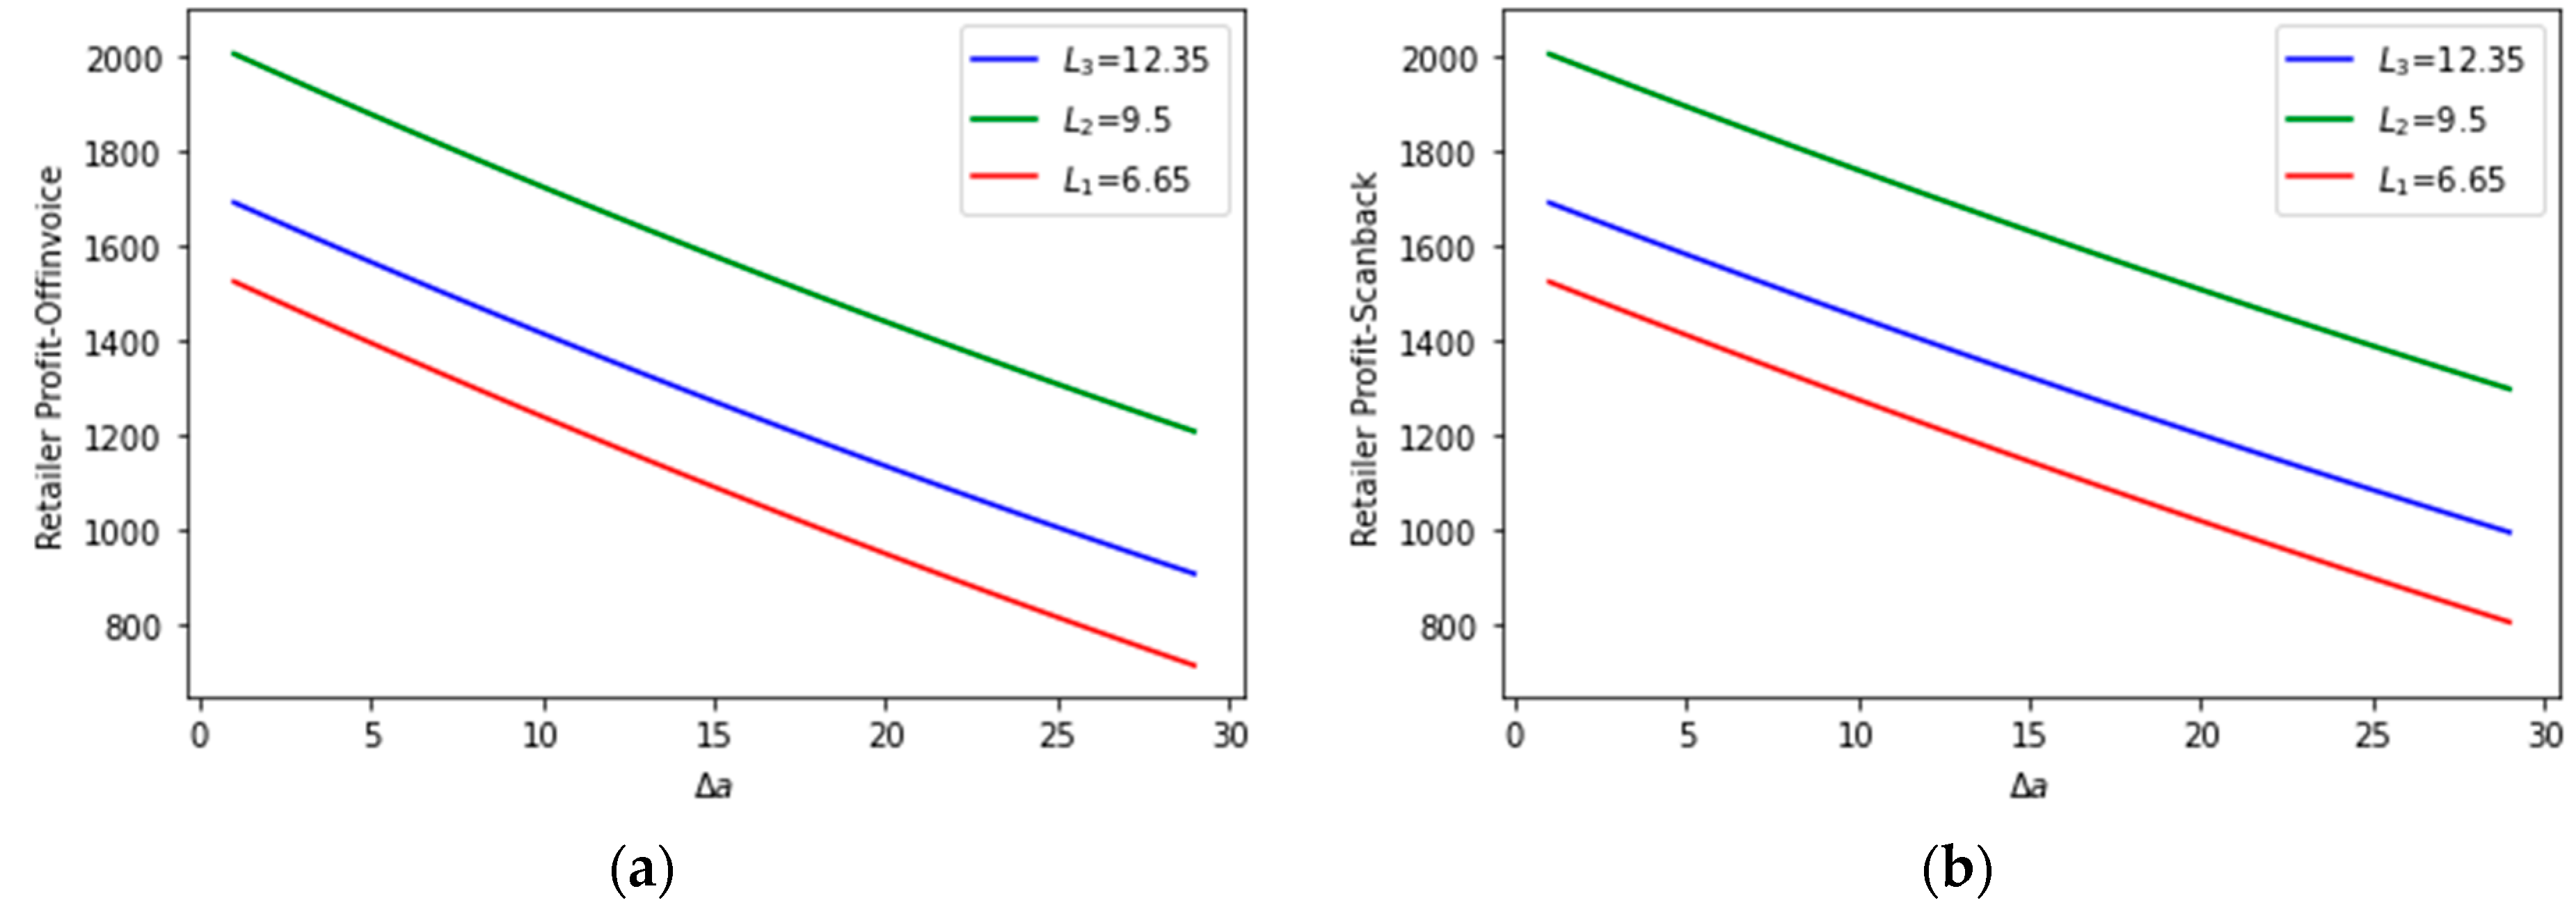
The profits of retailers under negative demand disruption for different trade promotion policies are depicted in
Figure 5a,b. As shown in these figures, retailers’ profits are higher when disposal costs are higher due to lower wholesale prices and increased order quantities and profits. In both off-invoice and scan-back policies, retailers’ profits exhibit similar behavior. It can also be observed that retailers’ profits decrease as the intensity of the disruption increases, resulting in a decline in demand.
Additionally, the rate of profit decline is higher under the off-invoice policy in the presence of negative demand disruption. Therefore, the manufacturer’s scan-back policy may be a more sustainable strategy in this case, potentially due to the lower order quantity of the retailer under the scan-back policy.
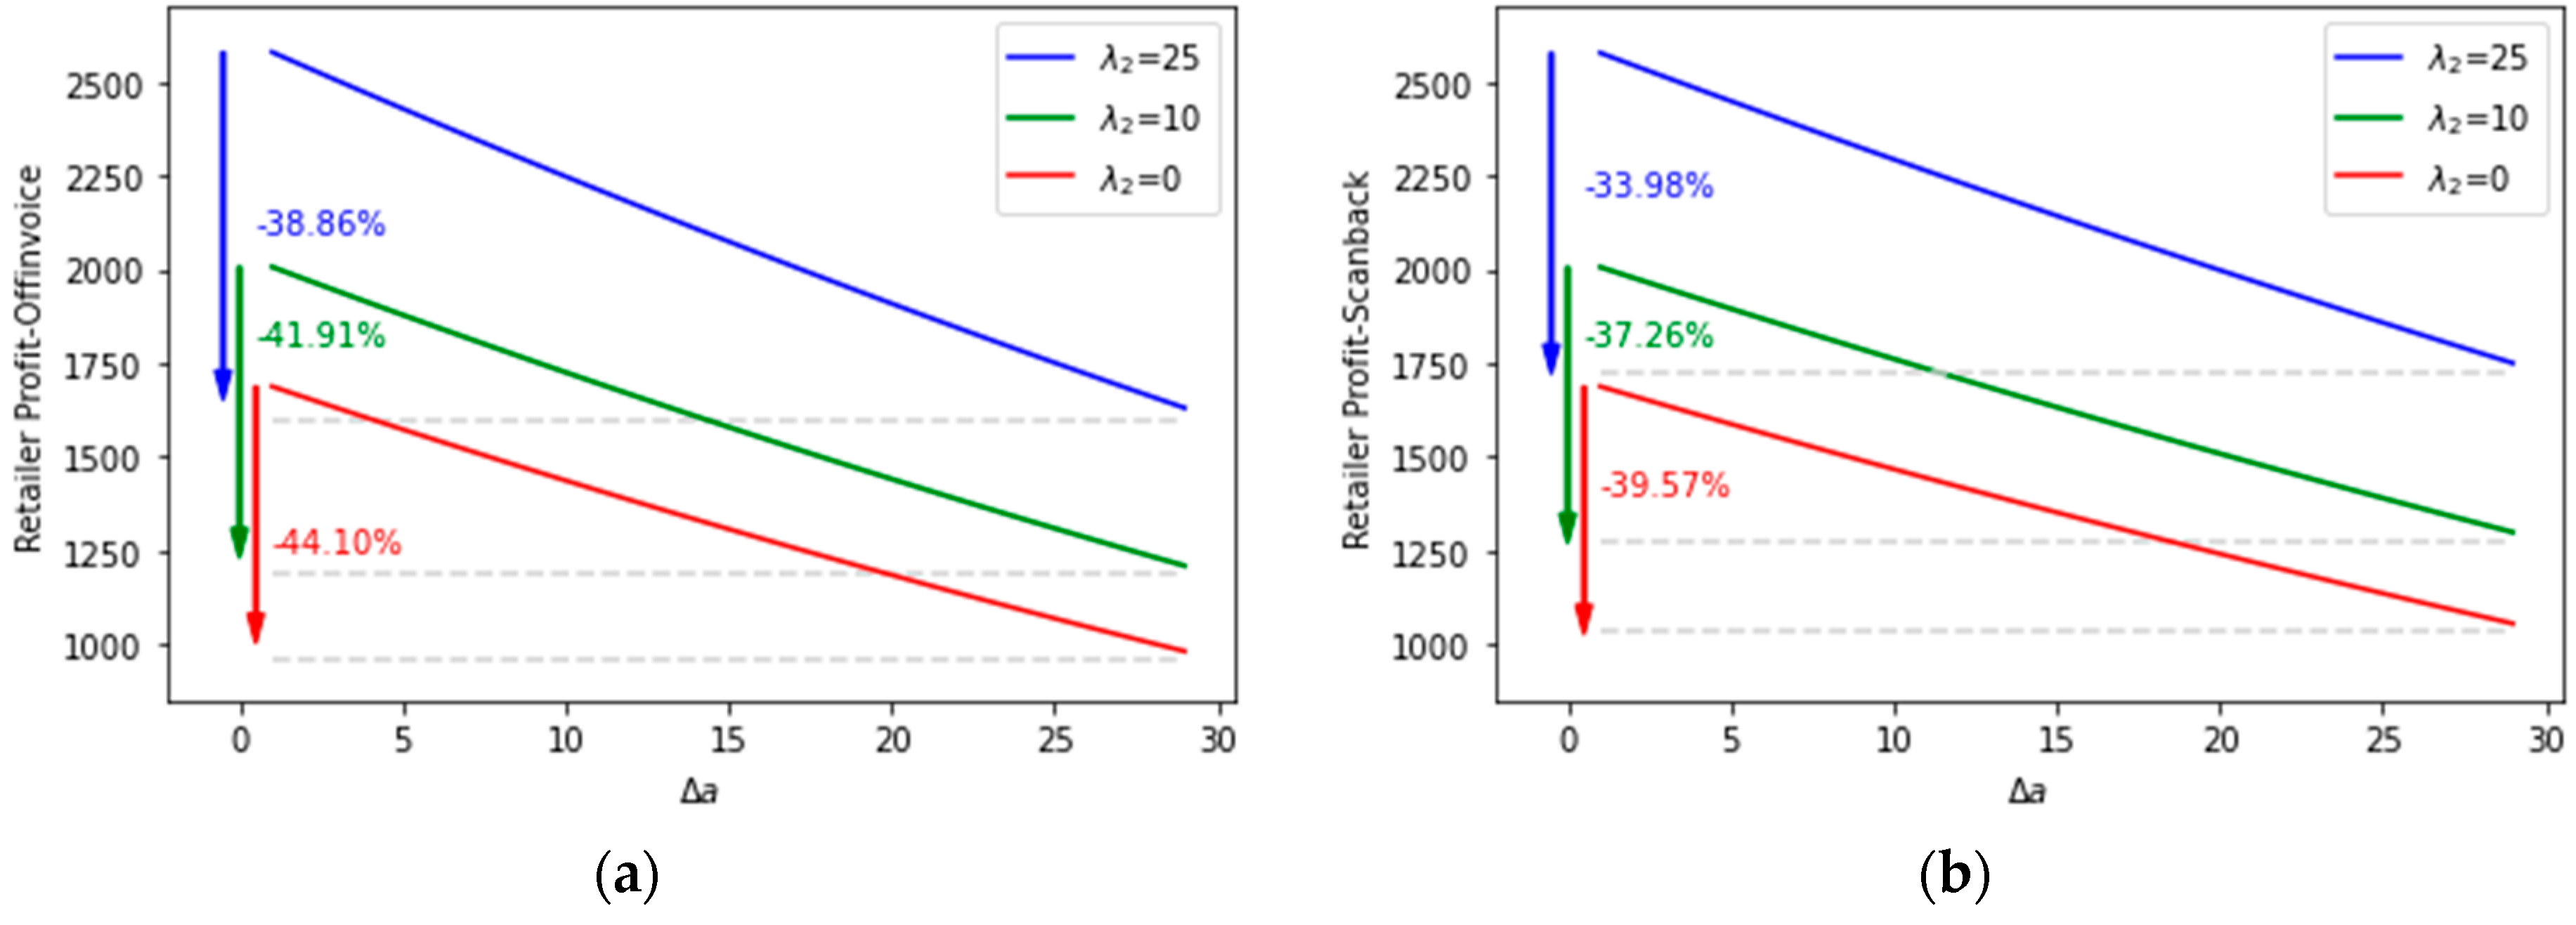
5.3. Impact of Demand Disruption and Online Delivery Lead Time on Trade Promotion and Profit
This section investigates the impact of a ±30% change in delivery lead time
on the profits of retailers and manufacturers. The profits of manufacturers under negative demand disruption for different trade promotion policies are depicted in
Figure 6a,b. As shown, negative demand disruption leads to a decrease in manufacturers’ profits regardless of the trade promotion strategy employed. Because a reduction in the retailer’s delivery lead time leads to an increase in demand and therefore the manufacturer’s profit. Additionally, for both policies in the range of negative demand disruption considered, the changes in the manufacturer’s profit relative to the demand disruption exhibit approximately linear behavior.
As demonstrated in
Figure 7a,b, negative demand disruption and a decline in demand lead to a reduction in retailers’ profits in both off-invoice and scan-back policies. However, the impact of a change in delivery lead time on retailers’ profits exhibits a non-linear pattern in the range considered in this study. Specifically,
results in higher retailer profit compared to
and
, and
leads to higher profit compared to
. This behavior is expected due to the quadratic form of the delivery lead time in the retailer’s profit.
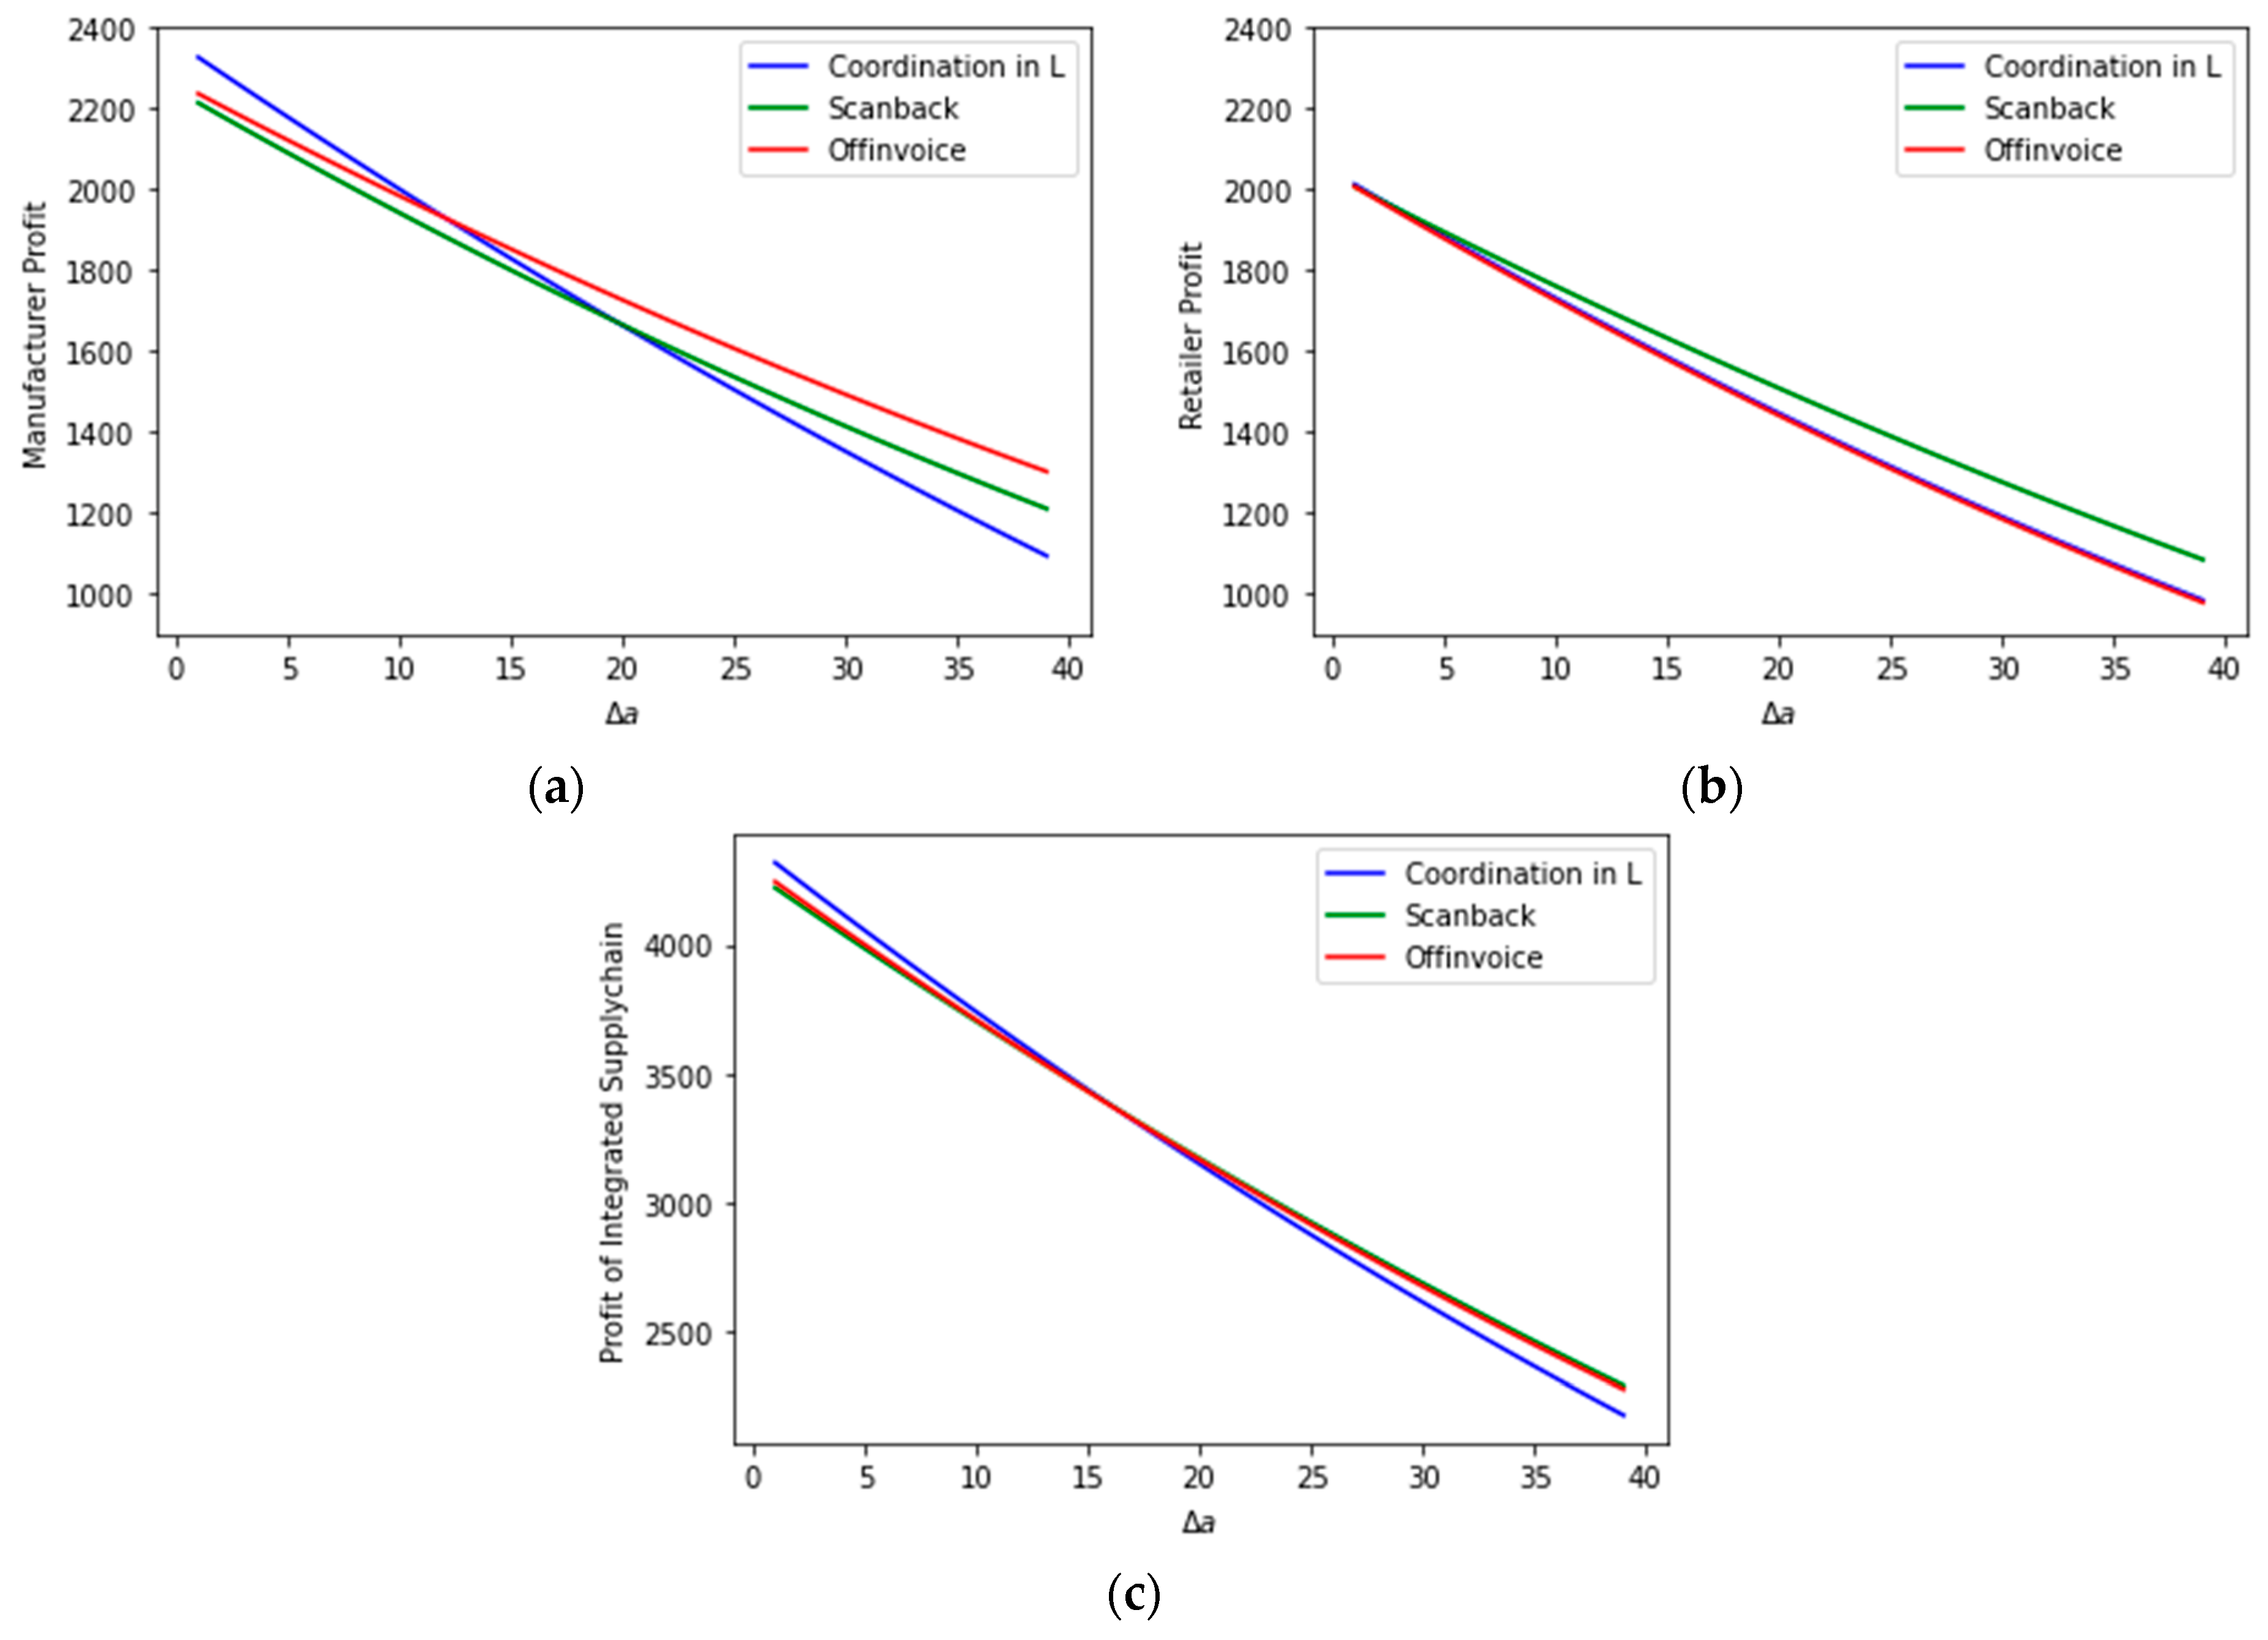
5.4. Comparing Different Strategies
In this section, we aim to determine which policy results in the highest profit for manufacturers, retailers, or the integrated supply chain under negative demand disruption.
In addition to the off-invoice and scan-back policies, we consider a new strategy called "Coordination in L" where the manufacturer assists the retailer by paying half of the delivery cost. In this proposed policy, the manufacturer is aware of the retailer’s delivery costs to consumers and coordinates with the retailer on these costs in order to improve the performance of the supply chain. In this study, we assume that the manufacturer assists the retailer by paying 50% of the delivery cost.
As depicted in
Figure 8a, the manufacturer’s profit decreases as the intensity of negative demand disruption increases.
Figure 8a also demonstrates that in the range of negative demand disruption considered, the scan-back policy leads to lower profit compared to the other policies when the intensity of disruption is low. In addition, when the intensity of disruption is low, the manufacturer’s profit is higher when the manufacturer contributes to the retailer’s delivery costs (which may be due to the lower cost to the manufacturer compared to offering discounts on products). On the other hand, the off-invoice strategy is more profitable than the other strategies at higher intensities of disruption.
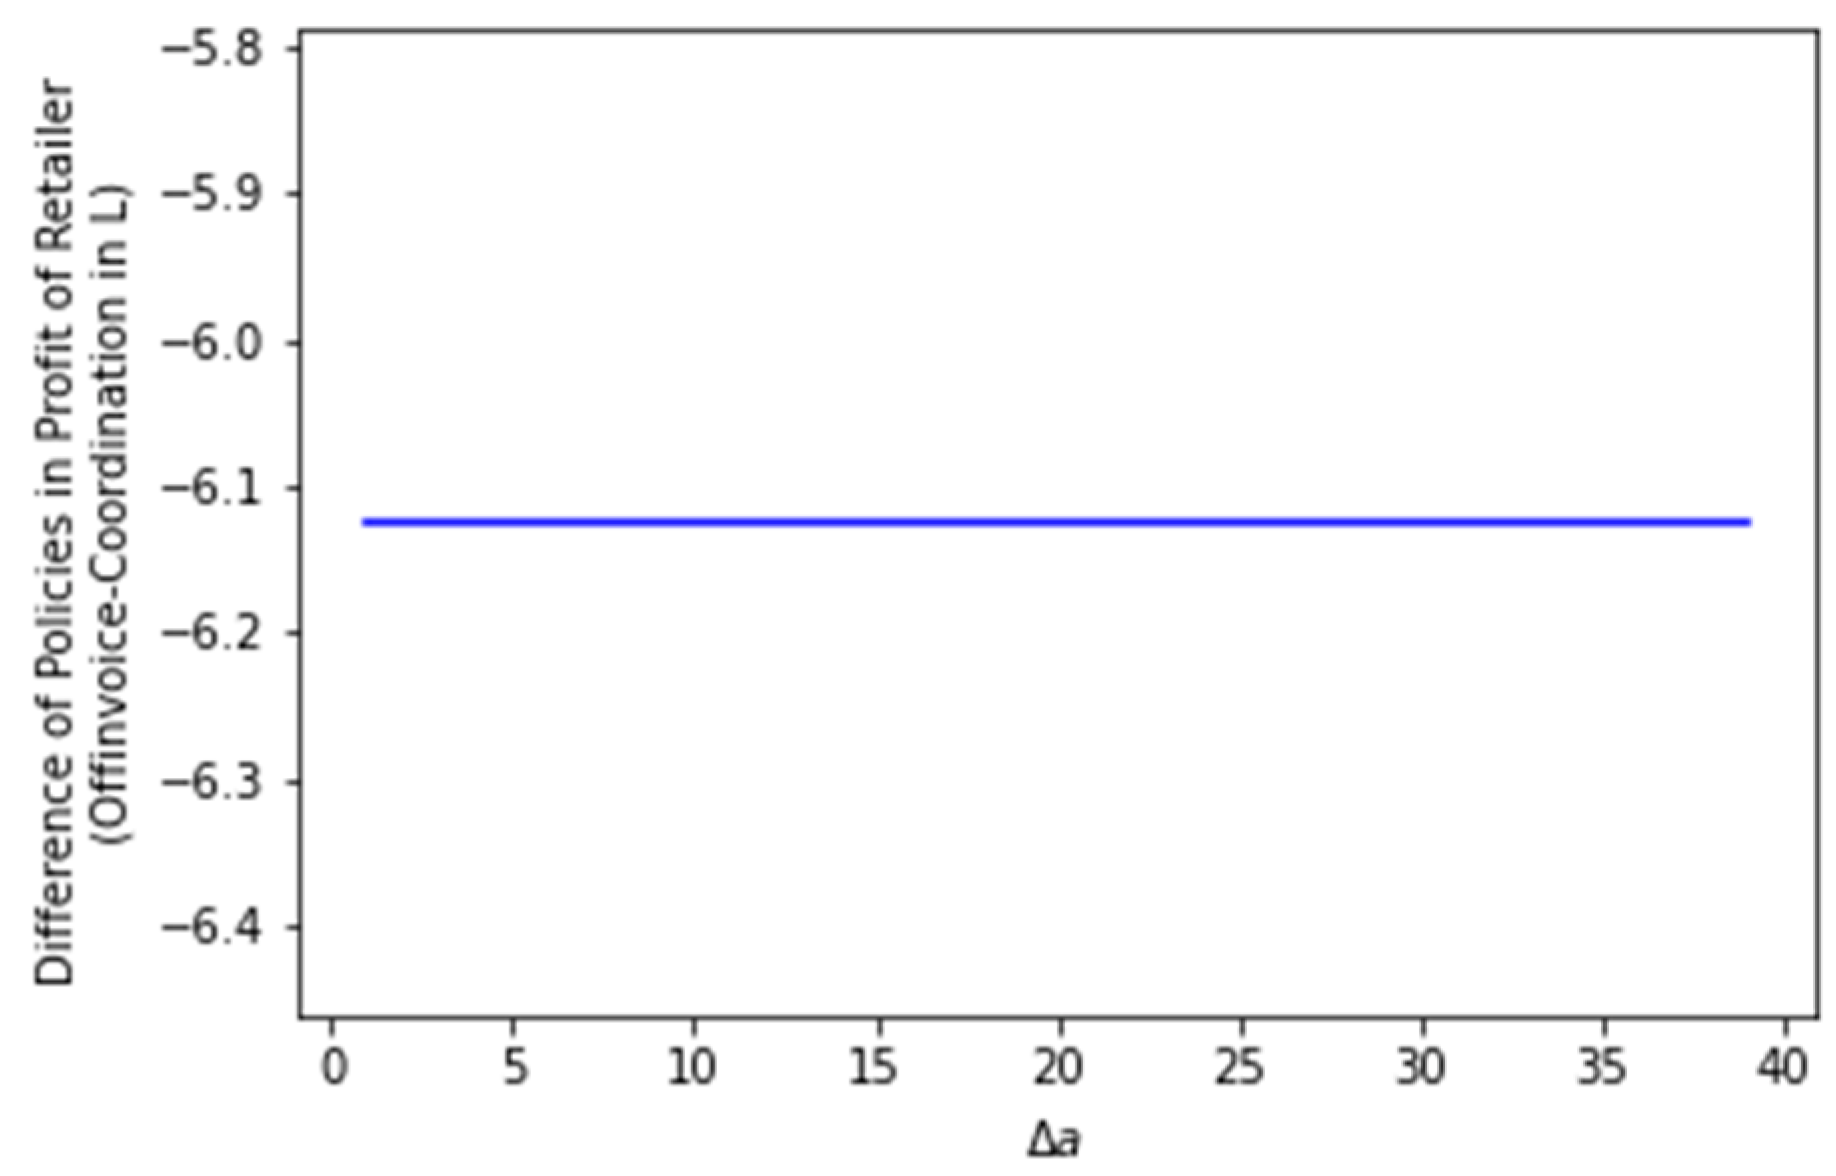
The profit of the retailer for the various strategies is depicted in
Figure 8b. This figure illustrates that when negative demand disruption is high, the manufacturer’s offer of a scan-back promotion leads to higher profit for the retailer, particularly at high intensities of disruption. In such situations, the wholesale price would be lower with the scan-back promotion compared to the off-invoice policy [
23], leading to increased profit for the retailer in the presence of negative demand disruption. Additionally, supply cost support results in higher profit for the retailer compared to the off-invoice strategy, which may be due to the lower cost (as shown in
Figure 9).
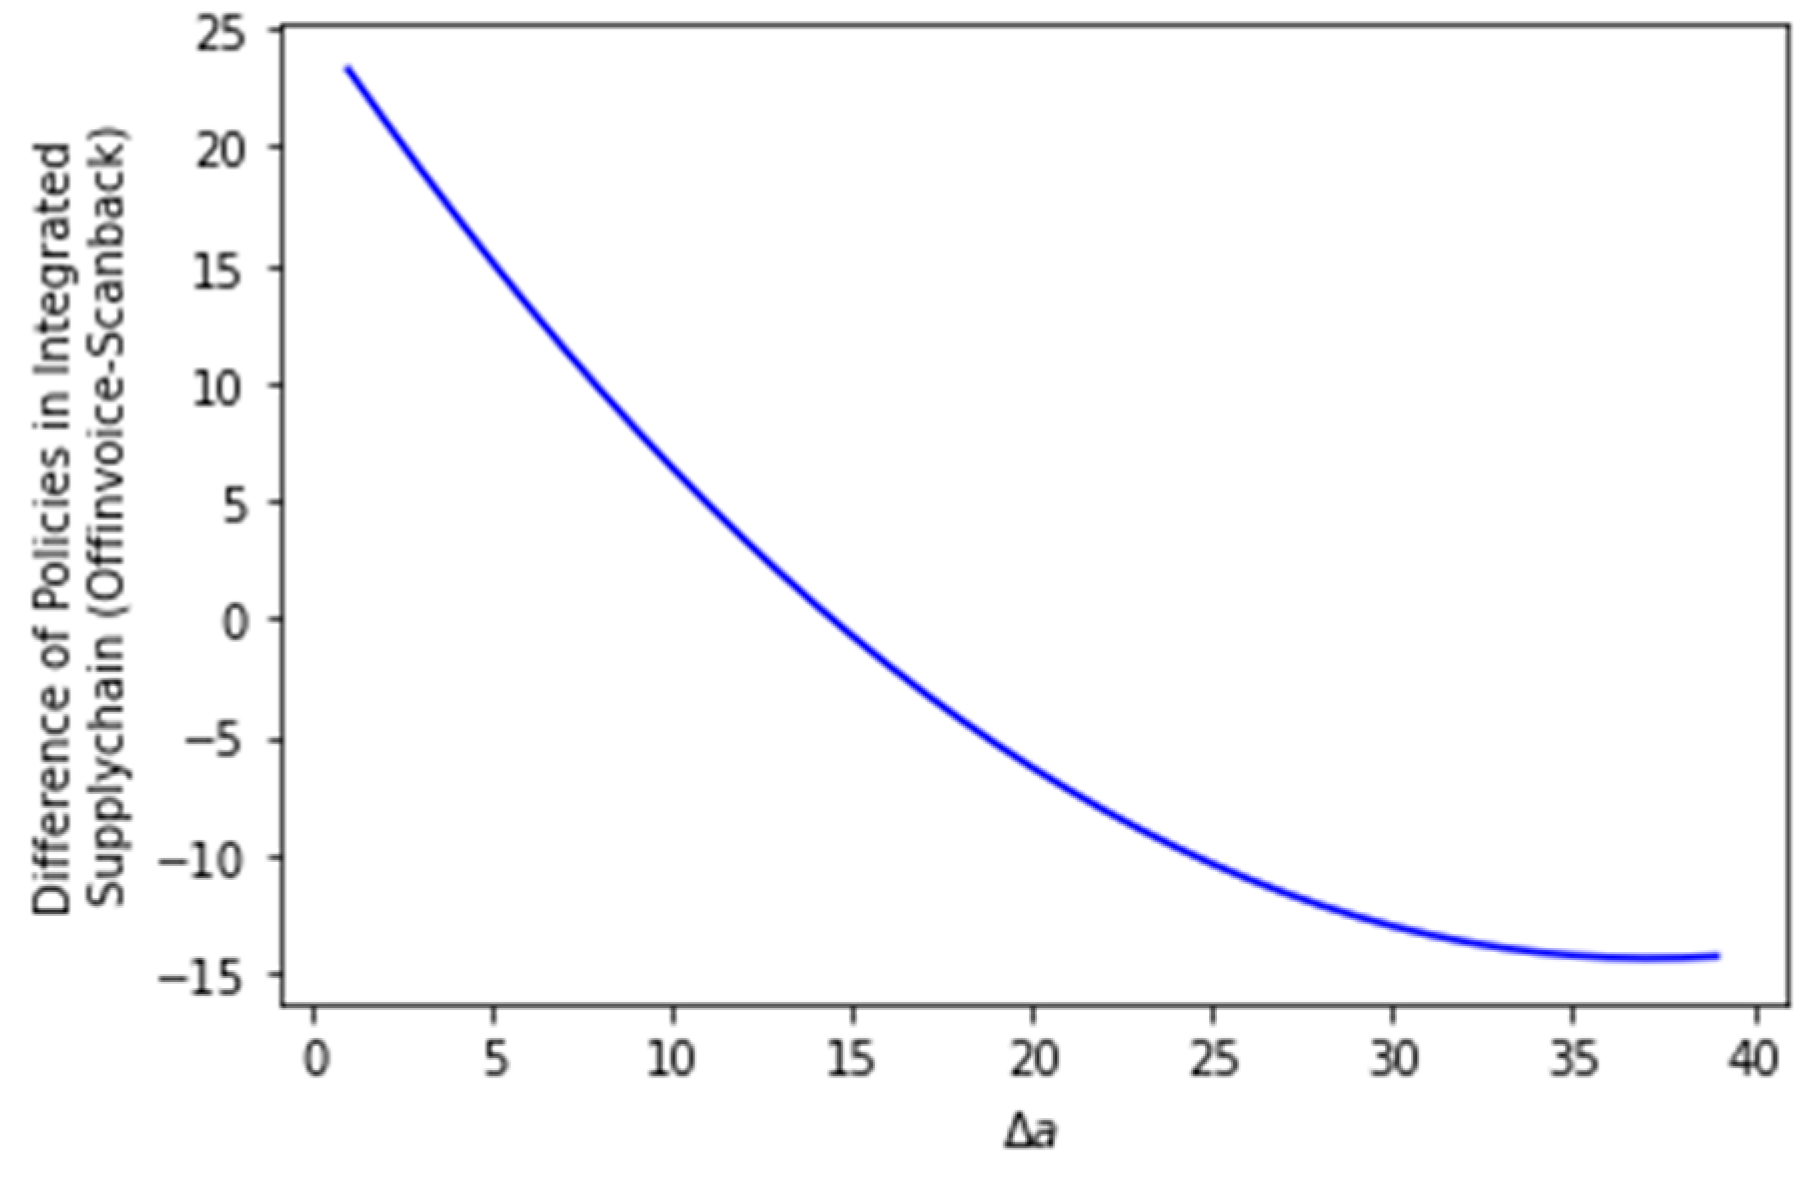
The profit of the integrated supply chain under negative demand disruption for the various strategies is depicted in
Figure 8c. As in the previous results, negative demand disruption leads to lower supply chain profit. The results also show that when the intensity of demand disruption is high, the manufacturer’s support of the retailer’s supply costs leads to lower profit compared to the other two strategies, while the opposite is true when the intensity of demand disruption is low. Additionally, the results indicate that the scan-back promotion yields more profit when the intensity of disruption is higher (as shown in
Figure 10). This may be due to the nature of the scan-back strategy, which offers a discount after the product has been sold, leading to increased benefits for the retailer and impact on supply chain profits.
6. Discussion and Conclusions
6.1. Managerial Insights
As previously mentioned, the results of this study indicate that negative demand disruption lead to profit losses for both individual supply chain members and the integrated supply chain as a whole. Based on these results, there are several implications for management to consider.
First, manufacturers should consider taking action to reduce disposal costs when negative demand disruption occurs, as higher disposal costs lead to lower profits. The results of this study suggest that in sudden crises such as a global or national outbreak of diseases (similar to COVID-19), massive earthquakes, or economic crises which causes huge negative disruption in demand [
6], the off-invoice policy in higher disposal costs may be a more beneficial and sustainable strategy for manufacturers. Thus, it is recommended that manufacturers use off-invoice policy in countries with high economical fluctuations. On the other hand, the scan-back policy may be more profitable for retailers, particularly when the intensity of negative disruption is high.
Managers in retailers should also consider the optimal delivery lead time, as there is an optimal point at which the retailer’s profit is maximized. Reducing delivery lead time can increase demand, but it may not offset the associated cost. Therefore, retailers should carefully manage delivery lead time, particularly during demand disruption. In the range of delivery times studied in this research, a shorter delivery time for the retailer leads to higher profit for the manufacturer. Thus, managers may want to consider actions to reduce the retailer’s delivery time in order to increase their profits.
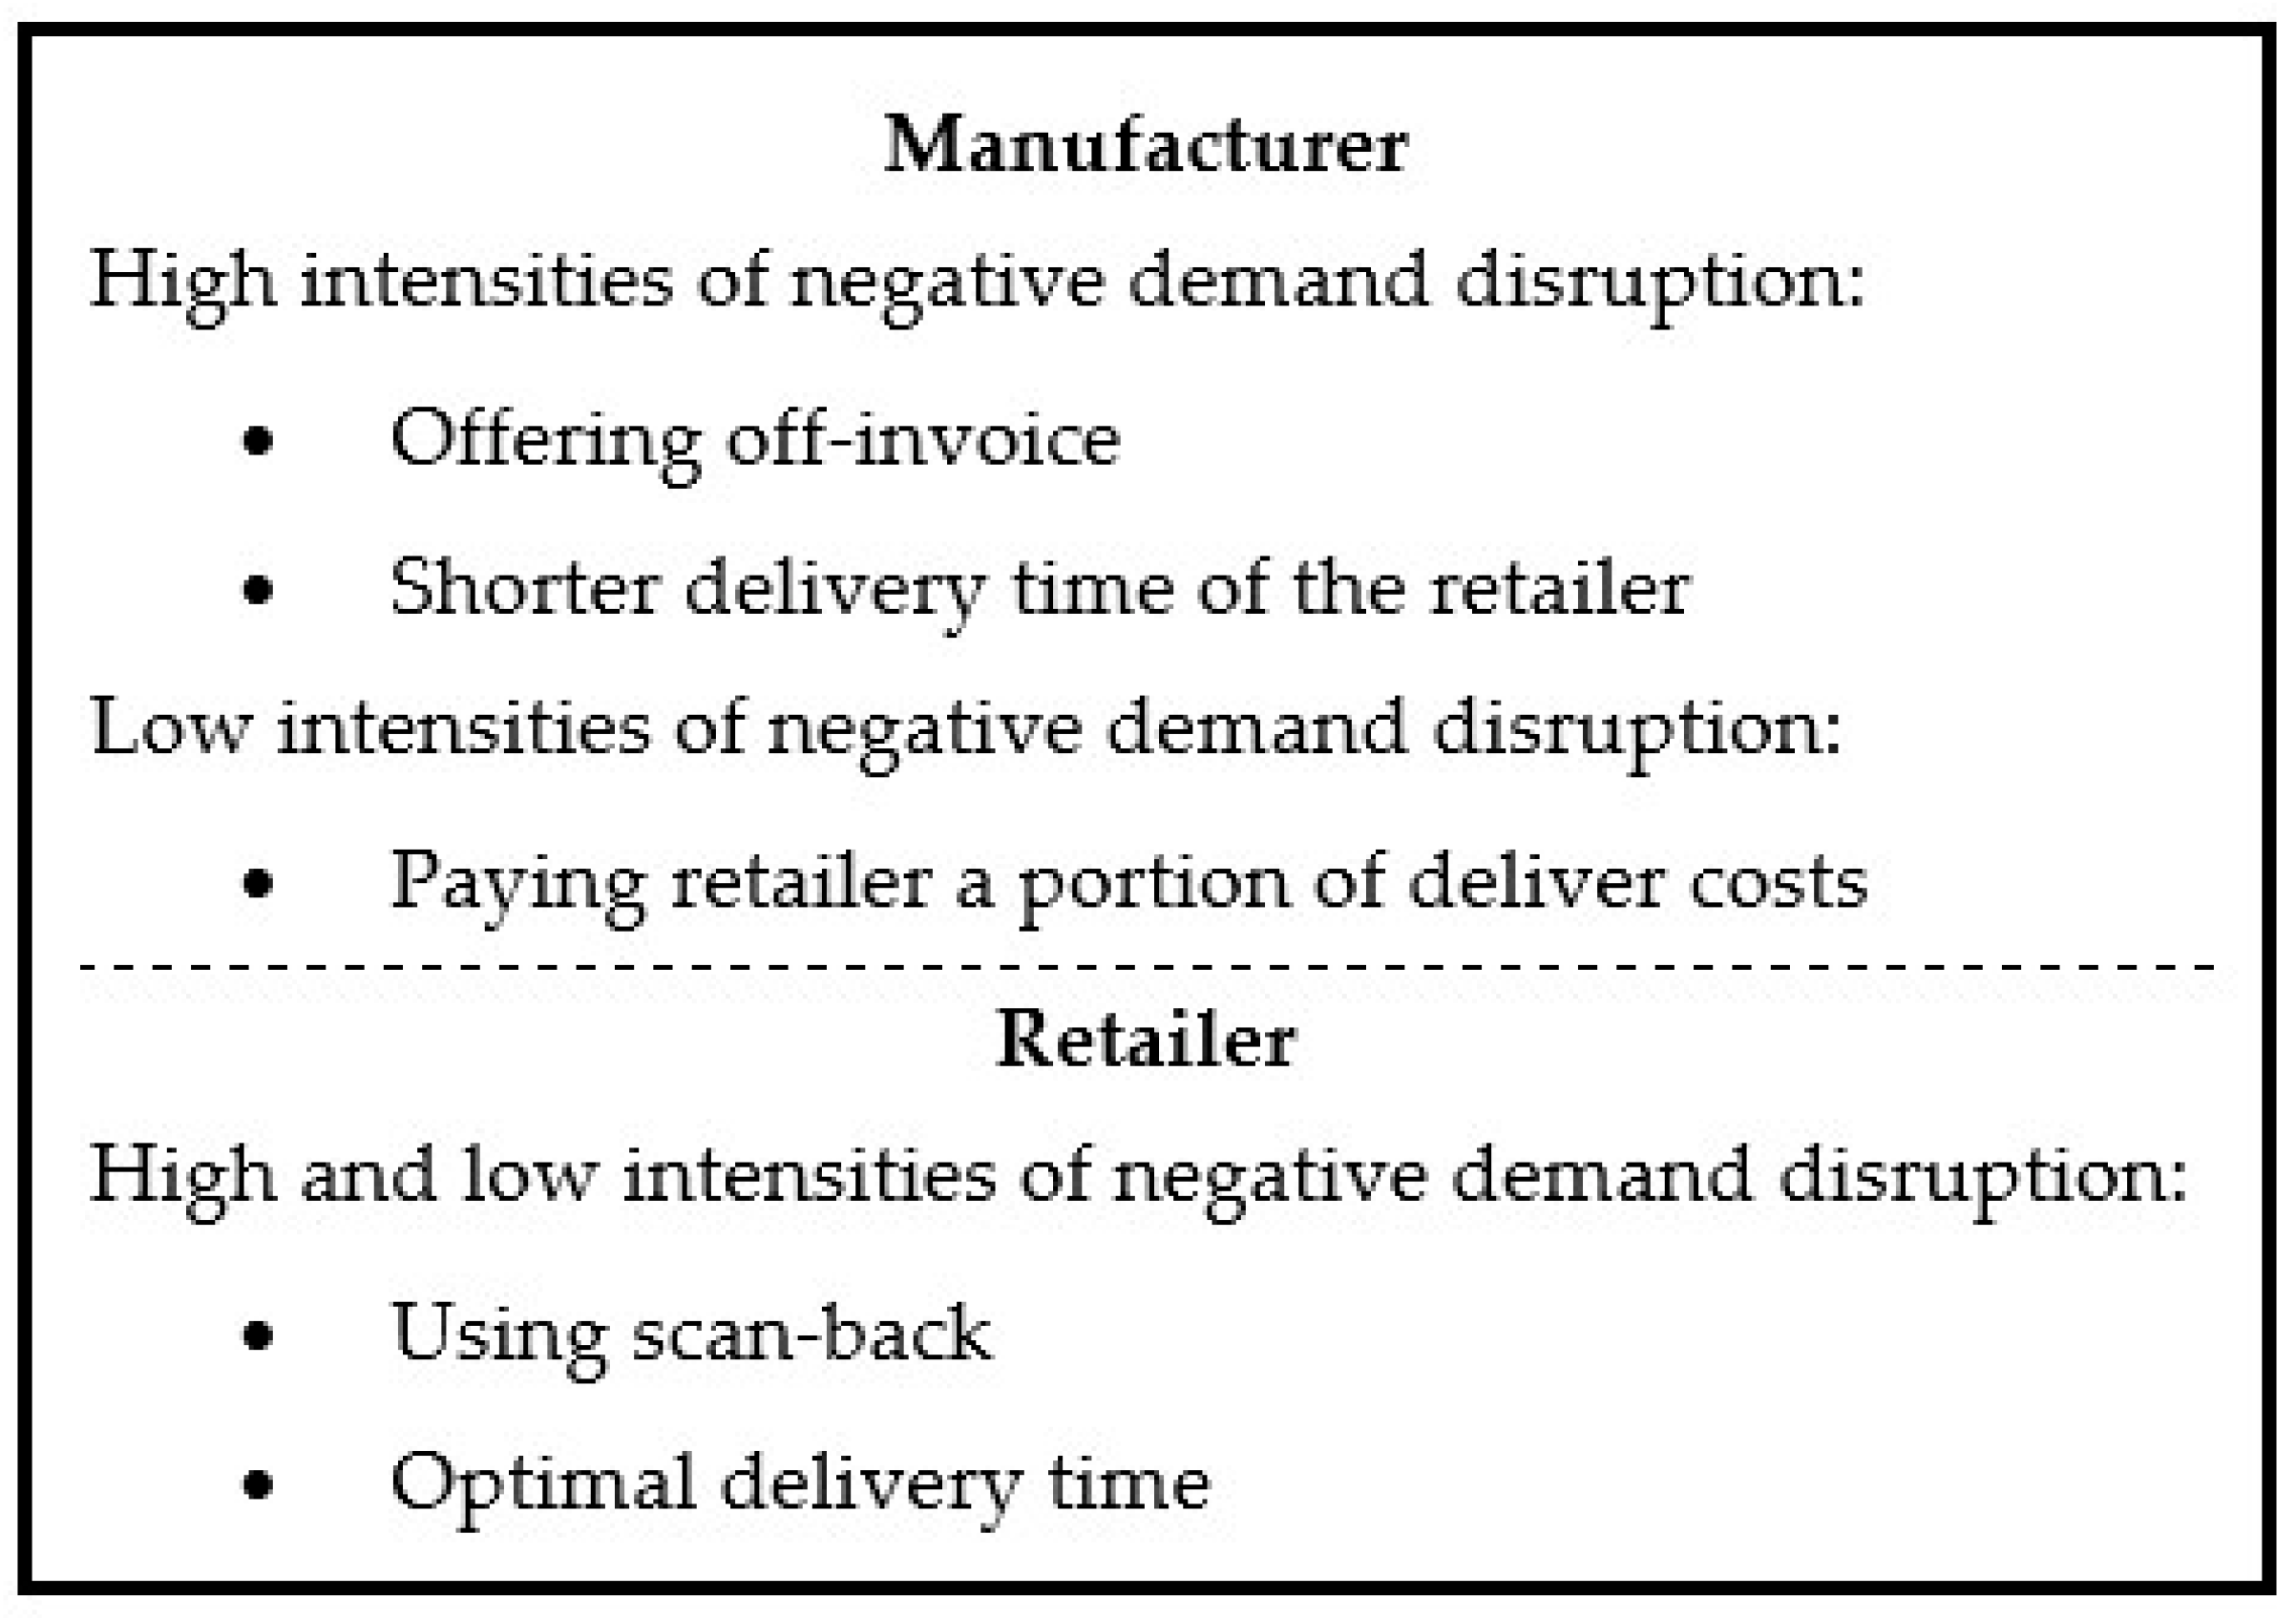
In terms of the overall supply chain, our results indicate that the off-invoice policy is preferable for the manufacturer when the intensity of negative demand disruption is high, while the scan-back policy may be more profitable for the retailer under such conditions. On the other hand, when a sudden rumor or bad news spread among consumers and reduces demand, if the intensity of negative disruption is low, paying the retailer a portion of the delivery lead time cost is more beneficial for the manufacturer. For the integrated supply chain, the scan-back policy is the most profitable option when the intensity of negative disruption is high, when is low paying the retailer a portion of the delivery lead time cost may be beneficial, while the off-invoice policy may be preferred under other circumstances (
Figure 11).
6.2. Conclusions and Future Research Directions
In this study, we examined the impact of negative demand disruption on the trade promotion strategies of a manufacturer in a supply chain with a retailer who has an online distribution channel. We constructed a theoretical game model and determined the optimal pricing for both the manufacturer and the retailer, as well as the optimal order quantity for the retailer. Our numerical studies demonstrated that negative demand disruption can alter demand, and the choice of trade promotion policy can have a significant effect on the profits of supply chain members.
It should be noted that this study has certain limitations. We have only considered a single manufacturer and retailer in our model, and the inclusion of market competition could potentially alter the results. Future research could consider the impact of market competition and online sales channels on trade promotion strategies in a supply chain, as well as other forms of consumer demand and the stochastic distributions of these and disruption parameters.
It has been observed that there are various types of consumers in the market, and some of them may be hesitant to make purchases from retail stores due to factors such as time constraints or negative experiences in these settings, such as poor management or rude behavior from retailers. On the other hand, some consumers are opposed to online shopping for various reasons. To accommodate both of these groups, many manufacturers have implemented dual channels for selling their products, comprising both traditional and online channels [
35]. As such, further research could focus on examining a dual channel approach or other supply chain structures with multiple manufacturers, wholesalers, distributers, classic retailers, and online retailers that takes into account decision variables such as delivery lead time, in the context of addressing this problem.
Additionally, an examination of trade promotions while considering promotions offered to end consumers could potentially influence the results of this study. Further research could also consider other types of promotions, such as non-monetary promotions offered by manufacturers or retailers.


