Article

Determinants of Health Management Practices’ Utilization and Its Effect on Poultry Farmers’ Income in Ondo State, Nigeria

by
Adewale Isaac Olutumise
1,2,*,
Taiwo Olarotimi Oladayo
3,
Lawrence Olusola Oparinde
4,
Igbekele Amos Ajibefun
4,
Taye Timothy Amos
4,
Yiseyon Sunday Hosu
2 and
Idowu Alimi
1
1
Department of Agricultural Economics, Adekunle Ajasin University, Akungba-Akoko 342111, Ondo State, Nigeria
2
Department of Economic and Business Sciences, Walter Sisulu University, Mthatha Campus, Mthatha 5117, South Africa
3
Department of Animal Production and Health, Federal University of Technology, Akure 340110, Ondo State, Nigeria
4
Department of Agricultural and Resource Economics, Federal University of Technology, Akure 340110, Ondo State, Nigeria
*
Author to whom correspondence should be addressed.
Sustainability 2023, 15(3), 2298; https://doi.org/10.3390/su15032298
Submission received: 9 December 2022 / Revised: 9 January 2023 / Accepted: 16 January 2023 / Published: 26 January 2023
(This article belongs to the Collection Sustainable Livestock Production and Management)

Abstract

:
Nigeria is the second largest poultry industry in Africa, with its poultry industry the most commercialized livestock sub-sector. Despite its significance, the farmers still experience economic losses due to disease outbreaks. Hence, the application of standard Health Management Practices (HMPs) is very important, as these practices improve the welfare of animals and increase animal production and farmers’ income. This paper examined the determinants of HMP’s utilization and its effect on poultry farmers’ income in Ondo State, Nigeria. We used multistage sampling procedures to select 120 respondents who provided data for the study. The study used Generalized Poisson Regression (GPR) and Conditional Quantile Regression (CQR) models to estimate the determinants of HMP’s utilization intensity, and its heterogeneous effects on farmers’ income, respectively. The results revealed that the HMP’s utilization intensity was significantly driven by variables such as education, training, experience, land ownership, stock size, mortality rate, and production system. In addition, HMP’s utilization had significant heterogeneous effects on farmers’ income. Therefore, the government and other developmental agencies should promote HMP’s utilization through the provision of poultry-based skills acquisition and vocational education.

1. Introduction

The global livestock industry is still not at rest on the challenges that could arise from endemic disease outbreaks and inefficient production management [1]. According to [2,3], the economic impact of parasites and disease outbreaks is inimical to the future growth of the livestock industry by further worsening the challenge of feeding the over nine billion world population by 2050 [4,5]. Thus, rescuing over 11% and 21% of the undernourished people in the world and Africa, respectively, [6] by rising to the needs of per capita consumption and the welfare of animal production, necessitates efficient and goal-oriented healthcare to control the disease spread and contaminations, and minimize the use of antibiotics.
Globally, poultry is the second most widely eaten meat among animal source foods and accounted for about 40% of the meat production that cut across various cultures, religions, and traditions [7]. Poultry production is an important part of farming in Africa’s agriculture, where about 80% of the poultry produced is raised by rural households [8]. Therefore, poultry production contributes a substantial part to the economy socioeconomically, as well as contributing to nutritionally and to the livelihood of the people [9,10]. Poultry generates income, provides food, improves the social status, and is a liquid household asset [11]. It serves as a source of protein and micronutrients [12], with the potential to improve food security and significantly reduce poverty, especially in low-income and developing countries [13]. However, due to the effect of COVID-19, farm disease outbreaks, and other management practice’s inadequacy [1,13], the total value of production, which was about $40 billion in 2019, fell by 11% in 2020 [8], hence, necessitating urgent strategies for the sustainable production in the poultry industry.
In Nigeria, poultry is a lucrative enterprise and is the second-largest poultry industry in Africa, with over 180 million birds producing 454 billion tons and 3.8 million tons of meat and eggs, respectively [14]. It is the most commercialized livestock sub-sector in Nigeria, that accounts for about 8% of the Gross Domestic Product (GDP) with about 30% of the total agriculture contribution [8,15]. The poultry sub-sector provides over 14 million employments to the Nigerian population and contributes nearly 58.2% of total of Nigeria’s animal production [14,16]. It is easier to acquire and maintain than other livestock, which has helped rural farming households to raise about 70% of the total poultry production.
Despite the enterprise’s importance, diseases continue to constitute one of the serious risks in the Nigerian poultry industry, threatening the benefits [13,17]. The major diseases are Newcastle disease, avian influenza, avian pox, infectious bursal disease, colisepticemia, coccidiosis, and worm infestation, with Newcastle disease being the most recognized by poultry farmers [18]. These diseases lower the bird productivity, giving rise to less meat or eggs of lesser quality. This offers lower-quality food and fiber. In terms of economics, output falls, costs rise, and profits fall [19,20], the estimated annual financial burden of livestock diseases in Nigeria is 29.2 billion Naira. Furthermore, the economic losses suffered by poultry farmers from 2009 to 2011 totaled more than three billion Nigerian currencies due to infectious bursal disease outbreaks alone [21].
Standard health management measures are critical in protecting poultry birds from the disease [22]. Poultry health management entails ensuring a hygienic environment and boosting cleanliness standards, as well as containment, to decrease the probability of introducing disease into a flock [23]. Augustine et al. [24] reported that adequate health management measures will go a long way towards minimizing disease outbreaks and spread in the poultry industry, as well as establishing consumer trust in poultry products. In addition, [25] also reported that trainings for both farmers and extension staff on disease control, improved housing, feeding, marketing, and entrepreneurship could assist poultry farmers in increasing their productivity. Therefore, poultry farmers worldwide face endemic disease challenges that threaten the animal health and welfare [26]. This disease can have a substantial economic impact on individual enterprises and on the farming industry as a whole [2]. Despite the fact that there have been a number of studies conducted in the sector with huge advances in the development of livestock vaccines and treatment options, the adoption and implementation of best management practices is still the most effective way to prevent and control many infectious diseases on the farms [2,13,27].
This study builds on the implementation and knowledge utilization theory as propounded by [24]. This theory is more appropriate because technology needs to be implemented first, and the knowledge derived will determine the rate of utilization. Adoption is a psychological decision-making process that an individual goes through in accepting an innovation or new practice. Innovation in this study refers to the recommended poultry Health Management Practices (HMPs), such as housing, medication, feeding, and environmental hygiene, which are applied in modern HMPs [28]. Despite several studies on the adoption of knowledge or innovation, there is still a gap in how innovation is implemented and utilized. This means that understanding the drivers for utilizing technology or knowledge forms a critical element in translational research [29]. It is for this reason that the study was conducted to empirically analyze the determinants of HMP’s utilization intensity and its impact on poultry farmers’ income in Ondo State, Nigeria. The specific objectives are to:
i.
Examine the main Health Management Practices (HMPs) utilized by the poultry farmers;
ii.
Describe the various vaccines and medications employed by the farmers;
iii.
Identify the factors influencing the intensity of HMP’s utilization in the area; and
iv.
Estimate the heterogeneous effects of HMPs and behavioral factors on the income of the farmers.
This study adds to the body of knowledge on sustainable agriculture by establishing the nexus between health management practices (HMPs) and farm income in three different ways. First, we examined the main HMPs available among poultry farmers and analyzed the factors responsible for the intensity of HMP’s utilization, with a focus on the number of HMPs used by the farmers. Previous studies [19,20,24,29] only identify HMPs using descriptive statistics, but failed to examine the extent to which the farmers adopted and utilized the practices. Again, the economic and behavioral factors underlying farmers’ intensity of HMP’s utilization are not well understood, and no study has been carried out on HMPs of this kind. Second, we employed a generalized Poisson regression (GPR) model, which helps in quantifying the effect of each explanatory variable on the intensity of HMP’s utilization, as it is a count data. Contrary to this study, prior studies had either examined the adoption and utilization of innovation by estimating binary or Tobit related regressions [3,9,30,31,32,33] by self-categorization or re-arrangement of the data, which might lead to selection bias. Third, we examined the heterogeneous effects of the intensity of HMP’s utilization and other behavioral factors on the farm income by estimating a conditional quantile regression (CQR) model. Many studies in the literature examined outcome continuous variables such as farm income, using Ordinary Least Squares (OLS) [23,34,35,36]. Although [37,38] also employed quantile regression to examine the profitability of cocoa marketers and egg poultry farmers, respectively, this study is different by modelling HMPs and behavioral factors into the heterogeneity of both layers and broiler poultry farmers’ income. Since the adoption and utilization of HMPs is indispensable in the poultry enterprise, understanding its effect on the farm’s performance will be a policy framework to promote sustainable development in the livestock industry.
The study’s rationale is that, despite the numerous benefits associated with HMP adoption, the intensity of HMP’s utilization remains low in developing countries [39,40]. Therefore, a better understanding of the factors responsible for the intensity of HMP’s utilization in connection with its impact on the farmer’s income will be important in designing agri-environmental policies that would improve farm economic performance and income. Again, the adoption of improved HMPs plays a dynamic role in Nigeria and other developing countries. As a matter of fact, the adoption of HMPs is indispensable for the economic growth, with a greater effect on farmers’ income. The adoption of HMPs among poultry farmers plays an important role in changing the knowledge and attitude of the farmers, reducing mortality rate, and preventing the wastage of feeds, drugs, and vaccines. It also prevents disease outbreaks, proper litter management and provides sufficient knowledge for other researchers, agricultural organizations, and is the right step to take while establishing a poultry farm. As the challenges are overcome and poultry production and industry are improved, the industry has the potential to employ more people, thereby helping to reduce the country’s unemployment problem. To produce properly, the poultry industry requires special attention coupled with knowledge [1]. Most poultry industries require professional assistance to avoid bankruptcy and to expand the industry. As a result, research such as this is critical to the development of the poultry industry.

2. Materials and Methods
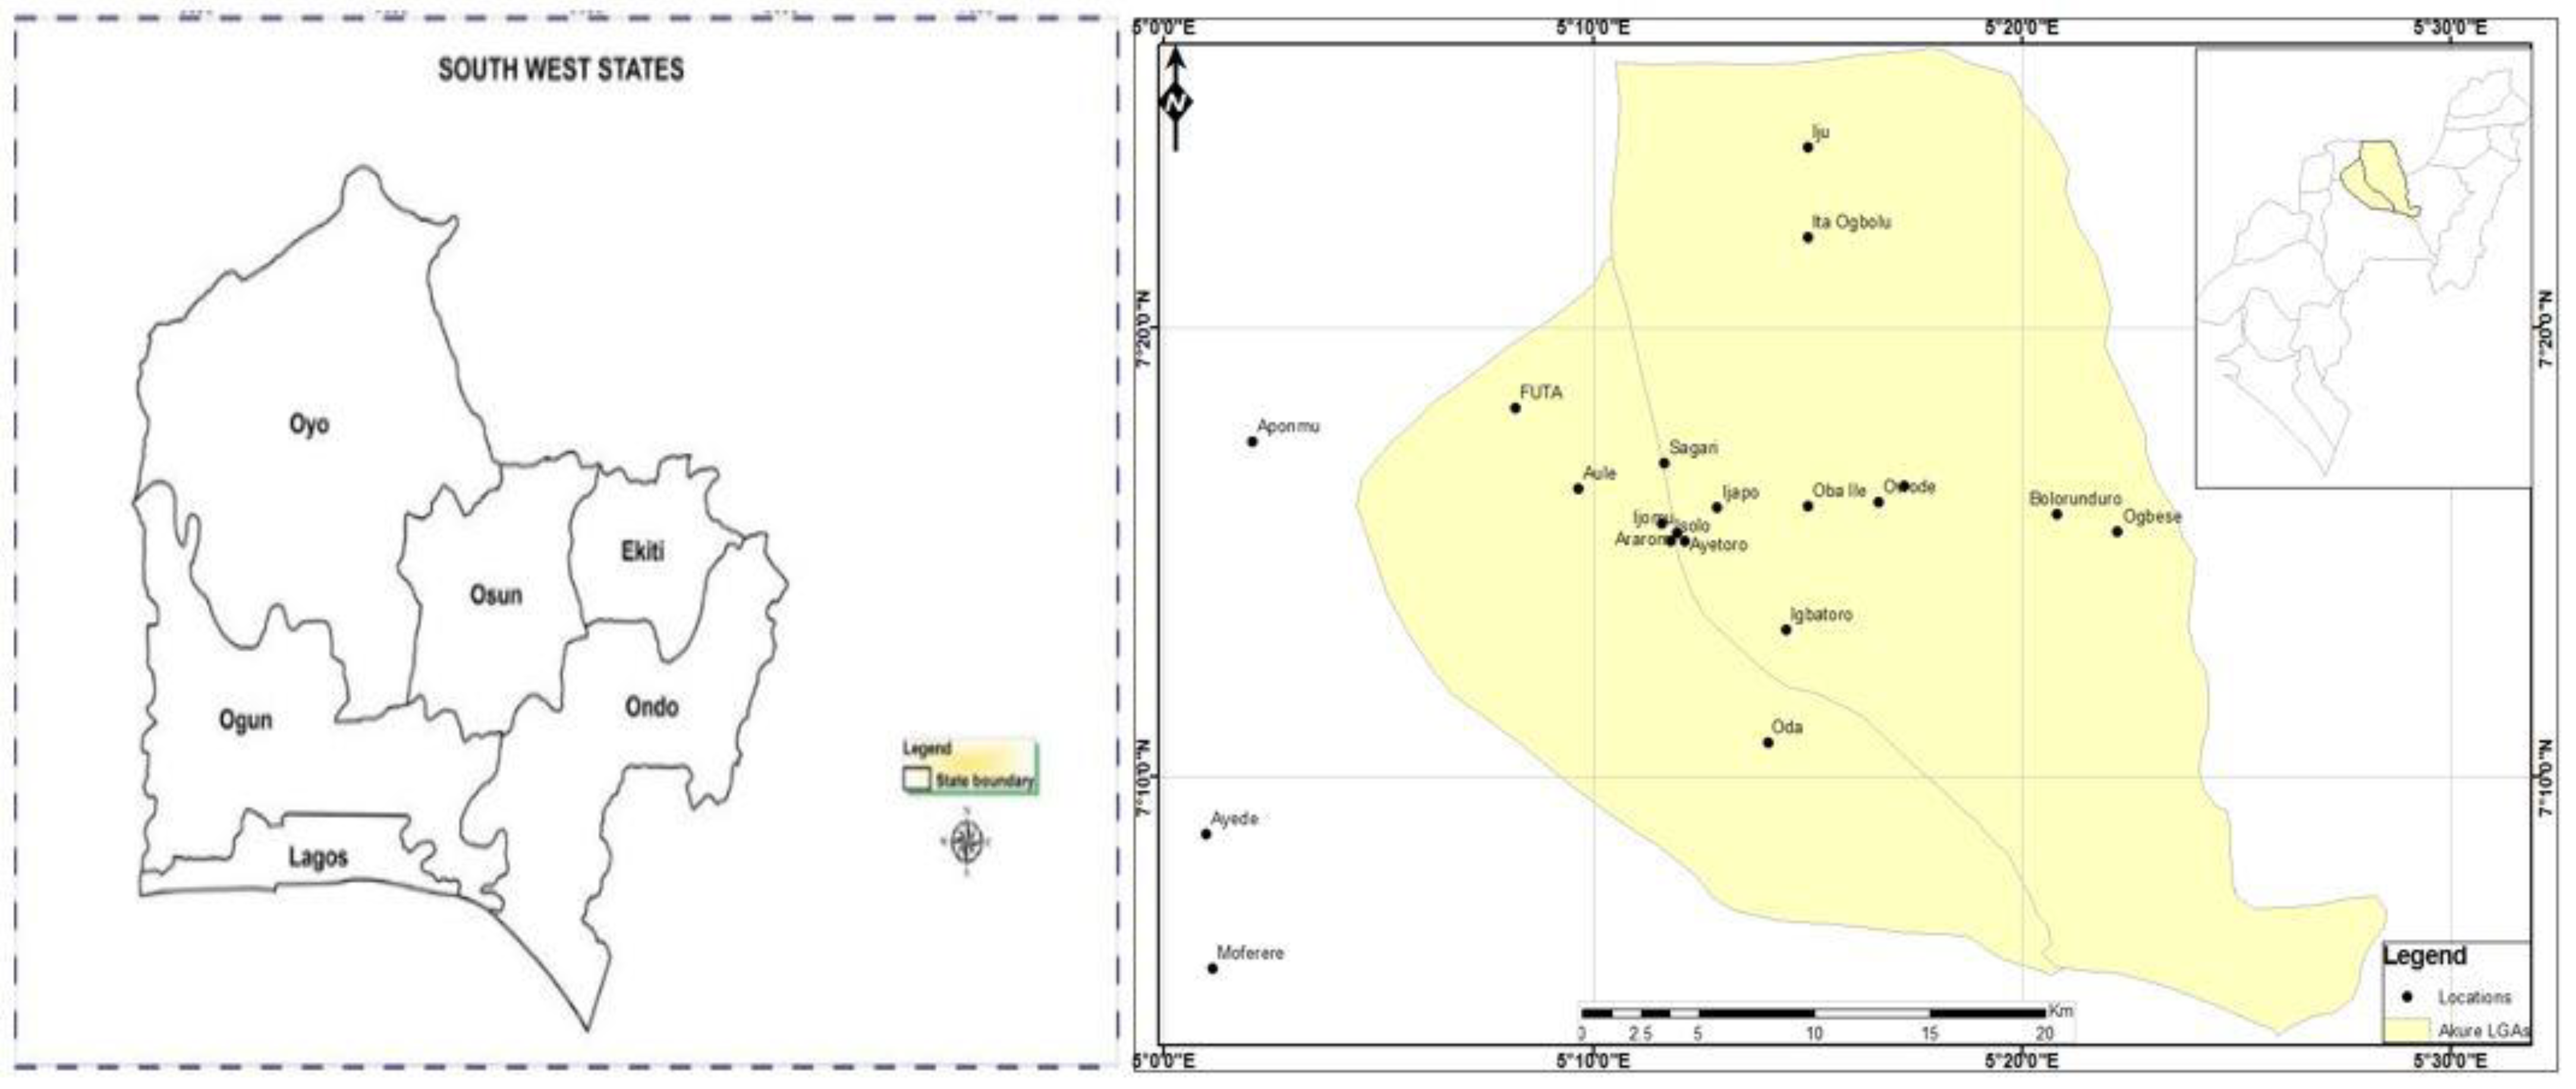
2.1. Study Area

Ondo State is centrally located in southwest Nigeria as one of the six states in the geo-political zone. Akure is the largest city and the capital of Ondo State (Figure 1). The city has a population of 484,798 as of the 2006 population census. It lies in the southern part of the forested Yoruba Hills and at the intersection of roads from Ondo, Ilesha, Ado-Ekiti, and Owo. The location (Akure region) of this study lies between longitude 4°3′ and 6°60′ east of the Greenwich meridian, and latitudes 5°45′ and 8°15′ north of the Equator. The climatic condition of the area is favorable to the production of poultry and other livestock. The temperature ranges from 21 °C to 29 °C and rainfall ranges from 200 mm to 1500 mm. The climate is tropical with two distinct seasons: the dry season (November–March) and the rainy season (April–October). Farming is one of the major occupations of the people, providing income and employment for over 70 percent of the population. The people in the study area are mainly farmers who engage in food crops and livestock production and marketing. Poultry farming is prominent and more commercialized in the area than in the other parts of the state. It covers an area extent of about 3402 km. It is about 700 km southwest of Abuja and 311 km north of Lagos State. Akure is an agricultural trade center for crops such as cassava, corn (maize), cocoa, and livestock such as pigs, poultry, and goats.

2.2. Data Collection and Sampling Techniques

Primary data were used in this study. The instruments were validated by the experts in the fields of agricultural economics and animal science. The data were collected through a well-designed questionnaire which was administered to 120 poultry farmers to collate vital information on HMPs, vaccinations, and medications, and the performance of the enterprise. The sampled poultry farmers were selected using a multi-stage sampling procedure between March and May 2022 (three months). Stage one involved the use of purposive sampling technique to select two Local Government Areas (LGAs) in Ondo State that has the preponderance of poultry production based on the information obtained from the Ondo State Agricultural Development Project (ADP), Alagbaka, Akure. They are the Akure South and Akure North LGAs. In stage two, ten communities were chosen from the two LGAs using a simple random sampling procedure. Aponmu, Gbogi, Isikan, Oko-aro, and Ijoka were selected in Akure South LGA, while Oba-Ile, Iju-Alaafia, Ayede-Ogbese, Igoba, and Iluabo were selected in Akure North LGA. It is worth mentioning that most of these farmers were not registered with the government and their contact addresses were difficult to locate. To overcome this challenge, we employed the extension officers allocated to each LGA as a guide. The work of the officers in each LGA was to introduce the enumerators to the prominent poultry farmer in each location. Based on this, the third stage involved a snowball sampling technique to select twelve poultry farmers from each of the communities selected from the two LGAs. This helped us to interview the main poultry farmers and get accurate information on the set objectives. Thus, the study successfully interviewed 120 poultry farmers, who supplied valid data for the analysis.

2.3. Analytical Tools, Concepts and Estimation Strategies

2.3.1. Selection Bias Issue and Model Specification

The study presents a simple concept to explain factors influencing the intensity of Health Management Practices’ (HMP) utilization and its effect on the welfare (income) of poultry farmers. It was observed that poultry farmer uses more than one HMP simultaneously, which makes the use of choice or polynomial regression not appropriate. This is contrary to several studies on the adoption and rate of utilization/adoption [3,9,30,31,32,33], where farmers were restricted to the main practices/methods (health management practices in this case) out of many discrete alternatives. The self-arrangement of the choices/options could lead to misconceptions [41]. Ali et al. [41] and Bryan et al. [42] stated that one way to understand adoption decisions is to group alike HMPs into a particular category. Again, [41] suggested binary regression instead of choice regression, which provides the facility to understand the factors influencing farmers’ decisions on each choice or option individually and independently. The use of binary regression is always cumbersome and boresome in the case of many choices and it is prone to estimation errors. Again, grouping the farmers into a particular category based on their choices might be impossible because of the multiple HMPs adopted by the poultry farmers. In this study, we employed a generalized Poisson regression (GPR) model, being a count model to estimate the factors influencing the intensity of HMP utilization. This is justifiable because it is easy and simple to count the numbers of HMPs adopted by the poultry farmers given a set of available options. GPR could also avoid the bias associated with categorization [43] and it introduces the use of a robust variance estimator [44]. The dependent variable is the counting of events using positive integer numbers and it is appropriate in predicting the expected level of adoption by the poultry farmers given the HMP which the farmer utilized with his/her demographic characteristics [45].
Again, the study went further to determine the effect of HMPs on the welfare (income) of the poultry farmers in the area. To achieve this, we used conditional quantile regression (CQR) to determine the heterogeneity effects of HMPs on the income. Previous studies in the literature have failed to harness the nexus between the adoption of HMPs and the economic performance of the farmers. We did not only determine the connectivity and interplay between household and farm-level characteristics and income in this study, but we also vividly explain how HMP utilization affects farm income distribution. Previous studies on the continuous outcome (income) used OLS [23,34,35,36], which based the estimate on the mean function. However, this study employed CQR over OLS because of the following advantages: (i). CQR characterizes the whole heterogeneous conditional distribution of the outcome variable (income); (ii). It detects the heterogeneous effects of covariates at different quantiles, that is, it describes the relationship at different points of the outcome variable; (iii). It is more robust to outliers, non-normal data, and the misspecification of error of distribution; (iv). Under- and over-dispersions in the data are taken care of; and (v). The sum of the absolute residual is minimized by the predicted regression line.

2.3.2. Generalized Poisson Regression (GPR) Model

Following [46,47], the GPR model proposed by [48] is employed to model how some known predictor variables affect the number of HMP (count data) utilized by the poultry farmers. The model is based upon the generalized Poisson distribution, which has been widely used in the literature [45,46,47,49]. We discovered that about three Poisson distributions had been used by researchers in modelling count data, such as the number of HMPs utilized by the poultry farmers [47,50,51,52,53], and each of them is based on certain assumptions before it can be used. The first one was the Standard Poisson Regression (SPR) and the assumption is that the mean must be equal to the variance. The equality assumption of SPR is practically not always true because the variance could be either more than the mean (over-dispersion) or less than the mean (under-dispersion) properties. Second, is the Negative Binomial Regression (NBR) model, which can only be used in the case of the over-dispersion property. Despite the fact that NBR is more flexible than SPR, the violation of any of these properties could result in biased standard errors and undesirable estimates of the regression coefficients [47]. The third is the generalized Poisson regression (GPR) model, which is adopted by this study following [45,46,47,54]. The GPR model has an advantage over SPR and NBR by capturing both the under-dispersion property and the over-dispersion property, which makes this model even more flexible for interpretations and applications (1), (2), (3), [54]. However, most of the adoption studies in agriculture in a count form, such as the number of HMP, frequently show either over- or under-dispersion properties [45,53]. The data for this study also show the over-dispersion property, therefore, justifying the application of the GPR model to our data.
Again, the decision to utilize any HMP could fall under the general framework of utility and profit maximization. A rational being (poultry farmer) adopts and utilizes the HMP options if s/he derives benefits or profits from, or is satisfied by the continued utilization of the practices. Since we assume that the intensity of HMP utilization will improve farmers’ performance, it is crucial to examine the factors responsible for the intensity of utilizing HMP among poultry farmers. The GPR model is based on the generalized Poisson probability function associated with the number of HMPs used in poultry production (dependent variable (H)), and the equation is written as:
h ,   θ ,   γ = θ 1 + γ θ h 1 + γ h h 1 h !   e x p 1 + γ h 1 + γ θ ,   h = 0   , 1   , 2
The mean and variance of H are given by E H i | l i = θ i and V H i | l i = θ i 1 + γ θ i 2 , respectively, where the mean of the dependent variable (H) is related to the independent variables (l) by the link function θ i = θ i l i = e x p l i β . Where, li is a k-1 dimensional vector of covariance, β is a k-dimensional vector of regression parameters, and γ is a dispersion parameter. In Equation (1), when γ = 0, the probability function of the generalized Poisson random variable decreases to the Poisson probability function. When the value of γ is positive, it means over-dispersion, whereas the negative means that the distribution has the under-dispersion property.
At this point, it is critical to check for the presence of a dispersion problem in the data set so that an appropriate type of Poisson regression model can be chosen for the analysis. According to [47,55], the moment estimators of the Poisson distribution parameters are:
θ ^ = h ¯ 3 s 2   and   γ = 1 h ¯ s 2
where, h ¯   a n d   s 2 are the sample mean and variance, respectively.
Again, [52,56] gave the asymptotic variances of the moment estimators as:
V θ ^   θ ^ 2 n   θ ^ + 2 2 γ ^ + 3 γ ^ 2 1 γ ^   ,   and   V γ ^     1 γ ^ 2 n θ ^   θ ^ θ ^ γ ^ + 2 γ ^ + 3 θ ^ 2
Next is to set hypothesis for the appropriateness of the GPR model. This is necessary to determine if the dispersion parameter is statistically different from zero.
The null form is H 0 :   γ = 0 , while the alternative form is H a :   γ   0 .
The rejection of the null hypothesis in favor of the alternative recommends the use of the GPR model over the other types of Poisson distribution models. The asymptotically normal Wald “Z” statistic test was used for the test, which is the ratio of γ ^ to its standard error.
The maximum likelihood method was used to estimate the regressor coefficients β . The GPR model’s log-likelihood functions are given as:
L o g L β ,   γ , h = i = 1 n h i l o g θ i 1 + γ θ i + h i 1   l o g 1 + γ h i θ i 1 + γ h i 1 + γ θ i l o g h !
where θ i = θ i l i = e x p l i β .
The variable measurement for the predictors (ls) and predicted were stated as
H = HMP utilized by poultry farmers (number/count);
l1 = Educational level (categorical: 1 = no formal education, 2 = primary school education, 3 = secondary school education, 4 = tertiary education, 5 = others);
l2 = Training attendance (Dummy: trained = 1 and 0, otherwise);
l3 = Production system (Categorical: deep litter only = 1; battery cage only = 2; deep litter and battery cage = 3);
l4 = Land ownership (Dummy: owned = 1 and 0, otherwise);
l5 = Stock size (number of birds);
l6 = Experience in poultry farming (years);
l7 = Access to extension services (Dummy: accessed = 1 and 0, otherwise);
l8 = Access to credit (Dummy: accessed = 1 and 0, otherwise);
l9 = Mortality rate (percentage of total number of stock birds per cycle).

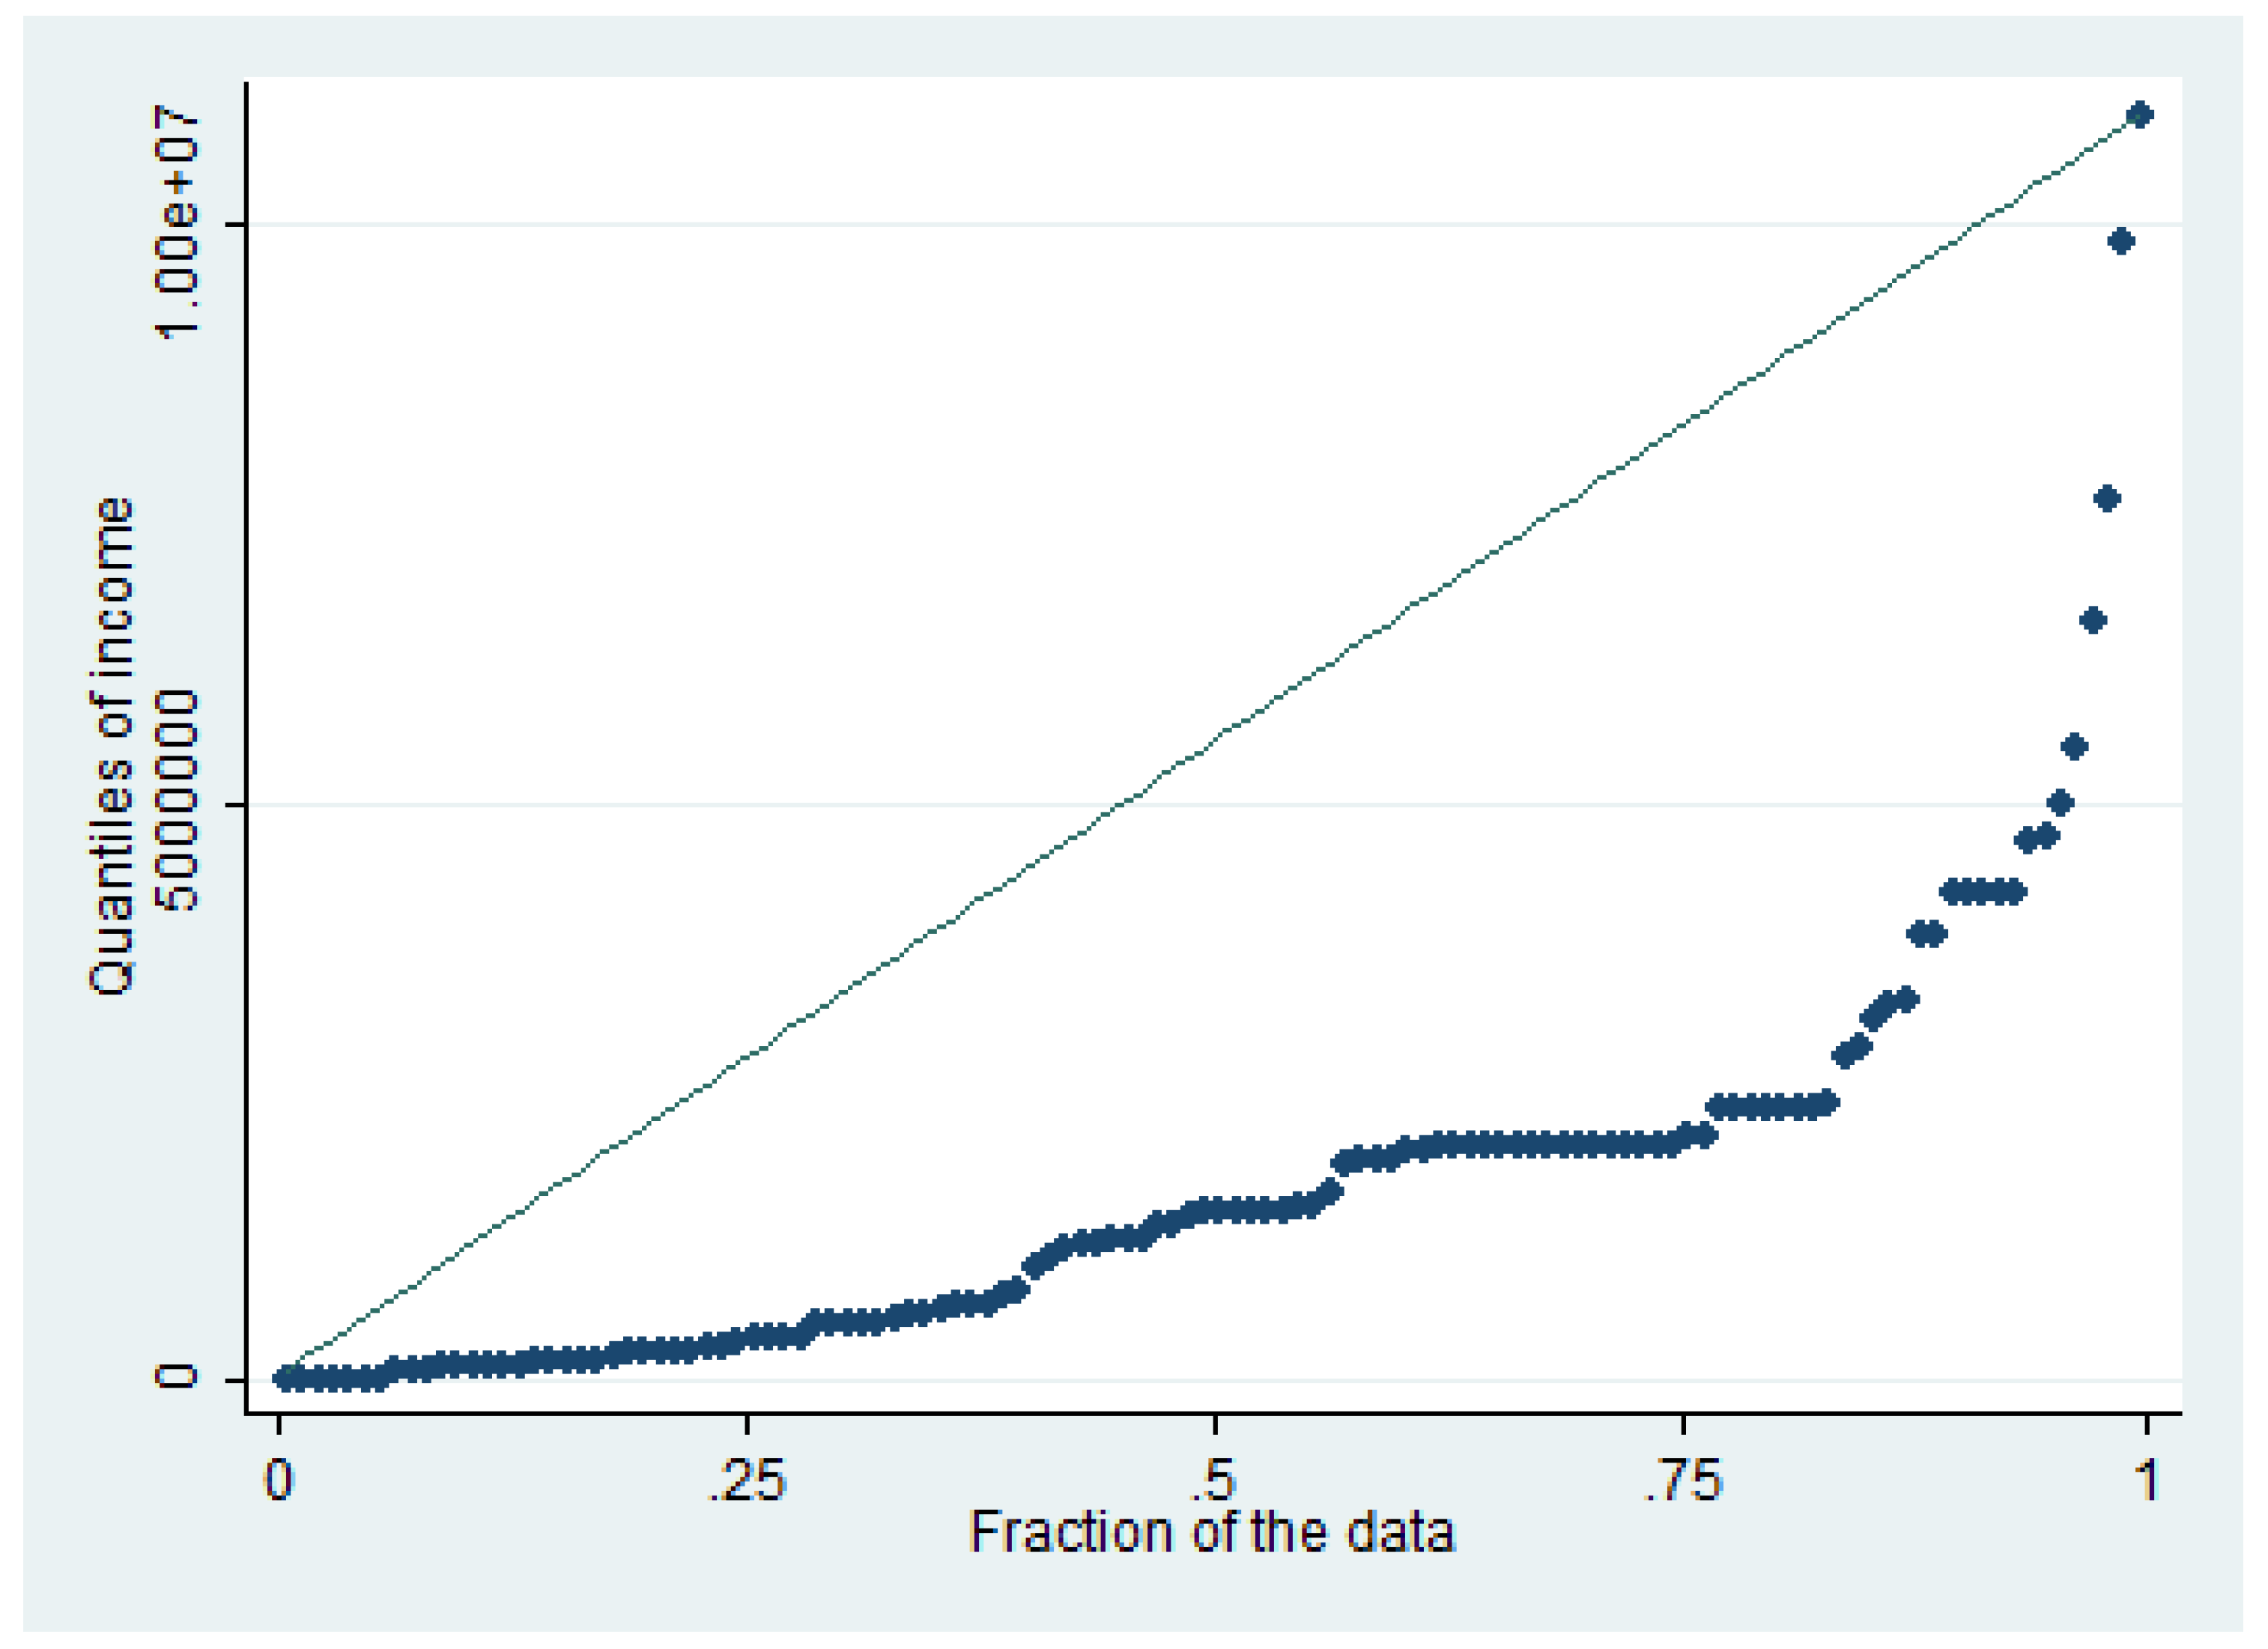
2.3.3. Conditional Quantile Regression (CQR) Model

The CQR dwells on the OLS model as stated in the Equation (5):
T i = V i ω τ
where Ti is the income of the poultry farmer’s ith; V i is the vector of explanatory variables predicting the τ t h quantile.
The OLS minimizes i μ i 2 , which is the sum of squares of the model prediction error, μ i .
The median regression (least absolute deviation (LAD) regression) minimizes i μ i . According to [57], the quantile regression minimizes i τ μ i + i 1 τ μ i , which is a sum that produces the asymmetric penalties, τ μ i and 1 τ μ i , representing the under-prediction and over-prediction, respectively. It is very important to note that the estimator of the τ t h   ω τ ^ minimizes over ω τ .
The objective function expressed as:
m i n w S k   i i : T i     V i ω τ T i V i ω τ + i ϵ i : T i < V i ω 1 τ T i V i ω τ  
where 0 < τ < 1.
Unlike the OLS and maximum likelihood estimates, CQR employs a linear programming (LP) approach. Again, ω τ instead of ω identifies the coefficient estimate related to the τ quantile.
Recall that the standard conditional quantile, which is the conditional function of the response variables, is specified to be linear:
T τ T i | V i = V i ω τ
To incorporate HMP as a determinant factor of the farm income (T), the Equation (7) was written as:
T τ T i | H i L i = H i L i ω τ
where V i in Equation (3) is H i L i .
Therefore, the explicit functional form can be written as:
T τ = ω o τ + ω 1 τ H i + ω 1 τ L 1 + ω 2 τ L 2 + ω 3 τ L 3 + + ω n τ L n + μ i
The variables were converted and estimated in their natural logarithm (ln) for the easy interpretation of the coefficients in a standardized form of percentage [58,59]. Where T τ is the average income (meat and eggs) of the poultry farmers ith in Naira.
V i = Vector of the explanatory variable of the ith respondent with the summary statistics presented in Table 1.
Hi = Number of HMP utilized by the farmers
Li = Vector of the household and farm-level characteristics
ω i = Vector of the parameters to be estimated
μ = Random error term (independently distributed with mean 0 and variance)
ith = Number of respondents (i.e., 1, 2, 3, …n)
L1= Age of poultry farmers (years)
L2 = Education (number of years spent in school)
L3 = Sex (dummy: 1 = male, and 0 = otherwise)
L4 = Family size (number)
L5 = Stock size (number of birds)
L6 = Experience in poultry farming (years)
L7 = Cost of medications (N/dose used)
L8 = Cost of feed (N/kg)
L9 = Cost of day-old-chicks (N/bird)
Table 1. Summary statistics of the explanatory variables.
VariableDescriptionMeanStandard Deviation
HMPsNumber of health management practices utilized4.812.20
AgeAge of the respondents (years)42.813.37
GenderGender of the respondents (male = 1; female = 0)0.590.49
Marital StatusMarital status of the respondent (single = 1; married = 2; divorced = 3; widowed = 4)1.940.65
EducationNumber of years spent in school11.144.29
Level of EducationRespondents highest level of education attained (no formal education = 1; primary education = 2; secondary education = 3; tertiary education = 4; others = 5)2.610.65
Family SizeNumber of persons in a household4.534.03
ExperienceYears of experience (years)13.04.70
CreditAccess to credit (accessed = 1; and 0, otherwise)0.480.56
ExtensionAccess to extension agent (accessed = 1; and 0, otherwise)0.640.48
TrainingDo you attend poultry management workshop/trainings (trained = 1; and 0, otherwise)0.860.31
LaborSource of labor (hired = 1; family = 2; both = 3)2.040.97
Land ownershipDo you own land in which poultry is built (owned = 1; and 0, otherwise)0.430.50
Production systemWhat production system do you practice (deep litter = 1; battery cage = 2; both = 3)2.660.88
Stock sizeNumber of birds purchased2861.015328.14
Cost of medicationMoney spent on drugs and vaccines3199.606639.50
Cost of feedMoney spent per kg (Naira)8100.205290.11
Cost of DOCsMoney spent per bird (Naira)298.23181.33
Mortality rateNumber of mortalities113.77300.72
IncomeAverage farmer’s income (Naira)1,714,920.001,860,914.00
q25Average farmer’s income (Naira)342,000.00
q50Average farmer’s income (Naira)1,440,000.00
q75Average farmer’s income (Naira)2,070,000.00
Note: $1 USD = N 415.81; number of observations = 120. Source: Field Survey, 2022.

3. Results

3.1. Health Management Practices (HMPs) Adopted by Respondents

The results in Table 2 show that there was a high adoption of some recommended practices. It indicates that 94.2% adopted proper vaccination, which makes it to be ranked first; 92.5% adopted breeding stock from a reliable source; 90% adopted ideal pre-placement preparation; 86.7% adopted cleaning, disinfecting, and fumigating housing equipment; 84.2% adopted the timely treatment and removal of dead birds; 83.3% adopted proper feed management; 81.7% adopted multivitamins’ administration; 79.2% adopted proper stock density of birds; 78.3% adopted ideal feeding troughs/drinkers; 77.5% adopted adequate record keeping; 73.3% adopted proper medication; 72.5% adopted adequate lighting, heat, and humidity; and 71.7% adopted screening out pest and disease vectors.

3.2. Various Vaccines and Medications Used by the Respondents

The result Table 3 showed the distribution of respondents based on the use of vaccines/medication used. The results showed that the majority of respondents (84.2%) were using anti-coccoidal drugs and vaccines, ranking it first; 82.5% used infectious bursal disease vaccines and drug; 81.7% used dewormers; 80.8% used the Newcastle disease vaccine; 80% used the fowl pox vaccine and drugs; 79.2% used Mareks; 72.5% used infectious coryza; 60.8% used chronic respiratory disease; 52.5% used the egg disease syndrome vaccine; 50% used the salmonella vaccine; 48.3% used aspergillosis vaccine; and 44.2% used the fowl cholera vaccine.

3.3. Factors Influencing the Intensity of Health Management Practices (HMPs) Utilization

Prior to the main estimates, some statistical analyses were performed to ascertain the predictability of the model (Table 4). The values of the mean and variance of HMPs utilized were 4.808 and 5.845, respectively, which revealed the over-dispersion property of the data, as shown in Table 4. Again, the null hypothesis (the dispersion is statistically different from zero) using the Z test was rejected in favor of the alterative (Ha ≠ 0). This justifies the appropriateness of the GPR model over other Poisson distribution models. The “estat gof” command in stata was used to estimate the goodness-of-fit of the model. It was revealed that the chi-square tests were not significant from zero, meaning that the data fit reasonably well, and the dependent variable (HMPs) is more appropriate. Other tests as presented in the Table supported the desirability of the model and adequacy of the data.
Table 5 shows the GPR model results given the coefficient and the incidence rate ratio (IRR), along with their level of significance. Out of nine variables subjected to the data analysis, seven were positively related to HMPs, while the remaining two were negative in explaining the intensity of HMP’s utilization. Seven variables were statistically significant, and they were: level of education, training attendance, land ownership, production system, poultry farming experience, stock size, and mortality rate. The results of the educational level showed that secondary school education, tertiary education, and no formal education had a negative association with the intensity of HMP’s utilization compared with primary school education. However, there is a positive but insignificant relationship between HMP utilization and other sources of education, such as adult education and Quranic education. This can be interpreted that poultry farmers that had secondary school education, tertiary education, and no formal education are about 41.2%, 47.2%, and 38.3% less likely to utilize HMPs than the poultry farmers that had primary school education. The incident rate for those with other sources of education is 1.613 times higher in utilizing HMPs than poultry farmers that had primary educations. Training attendance had a positive coefficient and significantly addressed HMP utilization. It means that the incident rate of utilizing HMPs by those that attended the training on poultry production is 1.077 times higher than those that did not attend the training. The land ownership coefficient is positive and significant in explaining HMP utilization. It means that the likelihood of utilizing HMPs by the landowners is about 0.1% higher than those that are not landowners. Again, the production system adopted by the farmers also had a positive and significant association with the HMP utilization. It indicates that poultry farmers with battery cage and deep litter have 1.292 times higher incident rate of utilizing HMPs than those that only used deep litter. However, poultry farmers with only the battery cage have 1.130 times higher incident rates of utilizing HMPs than those with only deep litter. The results of the poultry farming experience indicated a positive and significant relationship, which means that a percentage change in the incident rate of utilizing HMPs is an increase of about 0.5% for every year increase in experience. In terms of HMP utilization, the stock size coefficient is positive and statistically significant. This can be interpreted as a percent change in the incident rate of utilizing HMPs is an increase of 16.8% for every unit increase in the number of birds. The mortality rate’s coefficient is also positive and statistically significant with the HMP’s utilization. This indicates that for every death of a bird recorded, there is about 11.2% increase in the incident rate of utilizing HMPs in the area. However, the estimates of ordinary least squares (OLS) do not predict HMPs as it was with the GPR model. This is not plausible since only three variables were significant, suggesting that OLS underestimated the factors affecting the intensity of HMP’s utilization.

3.4. Determinants Effect of Intensity of HMPs Utilization and Socioeconomic Factors on the Poultry Farmer’s Income

The linear regression was subjected to diagnostic tests to assure the desirability of the model. Many variables were included in the model, but some were removed because of the multicollinearity. Only ten variables were screened and eventually employed for this study. To test for multicollinearity, the Variance Inflation Factor (VIF) and Tolerance Levels (TL) tests were used. The average values of VIF and TL were 1.98 and 0.58, respectively, which are less than the threshold of 4.0 for VIF and greater than 0.10 for the TL. This implies that there is no multicollinearity problem in the model. Again, the Breusch-Pagan/Cook-Weisberg test for heteroskedasticity was conducted and the value (0.26) of the chi-square test was not statistically significant, meaning that the null hypothesis of constant variance (homoskedasticity) is failed to be rejected. The Ramsey RESET test was used to check whether the model has omitted variables or not. The null hypothesis of no omitted variables in the model was also failed to be rejected given the insignificant value (0.46) of the F-statistics. The F-value of 56.23 was significant at the 1% level of probability, indicating that all predictors had an exact influence on the predicted variable. Similarly, the R-square of the OLS was 0.792, implying that the explanatory variables in the model account for nearly 79.2% of the variations in farm income. In the case of the CQR, the pseudo R-square values for the τ.25, τ.50, and τ.75 were 0.436, 0.681, and 0.631, respectively. Despite the false or unreliable estimate of the pseudo R-square in econometrics, it can still be interpreted that the independent variables explained about 44%, 68%, and 63% of variations in the τ.25, τ.50, and τ.75 quantiles, respectively.
Therefore, the results of CQR and OLS are presented in Table 6, showing the coefficients and their probability levels, while Figure 2 depicts the level of dispersion in the farm income of the poultry farmers in the area. The result of the Figure reiterated the heterogeneity effects of the predicted variable. Most (8) of the variables affect the lowest quantile (τ.25), while seven variables affect the highest quantile (τ.75), and only five variables affect the intermediate quantile (τ.50). It was observed that the lowest and highest quantiles had more significant variables than the OLS, which had six variables. This confirms the heterogeneity across the quantiles because the magnitude of the coefficients is also varied. Four out of ten variables statistically influenced all quantiles and they are: years of schooling (education), poultry farming experience, stock size, and cost of feed. Age and cost of feed had negative coefficients across the quantiles while education, stock size, and production system had positive coefficients across the quantiles.
The HMPs results are mixed, where all the quantiles showed a significant influence at the 5% probability level, except the τ.50 and τ.75 quantiles which had negative influences on the income. In addition, T.25 had the highest magnitude of coefficient, and the least was observed in the τ.50 quantile. The interpretation is that a unit increase in the number of HMPs utilization will lead to about 0.34% and 0.16% increases in the income of the poultry farmers, while it decreases the income by 0.21% in the case of the τ.75 quantile, ceteris paribus.
The coefficient of the farmers’ age was negative but statistically affected the τ.25 quantile, which means that a year increase in farmer age results in a 1.32% decrease in farmer income for the τ.25 quantile farmers.
The coefficient of education had a significant and positive relationship with the income across the quantiles, which means that a unit increase in the year of schooling causes a 2.15%, 1.79%, and 0.63% change in income for the τ.25, τ.50, and τ.75 quantiles, respectively.
The sex of the respondents had a negative but significant effect on the income at the τ.25 quantile, while a positive relationship at the τ.75 quantile. This implies that being a female poultry farmer might reduce income by 0.39% compared with the male counterpart, but male household increases income at τ.75 quantiles by 0.05% compared with the female counterpart.
The experience of the farmers showed both positive and negative relationships with the income of the farmers but were statistically significant at the 5%, 1%, and 1% probability levels for τ.25, τ.50, and τ.75 quantiles, respectively. The interpretation is that a year advance in the enterprise will result to about 0.002% and 0.105% increases in the income of the farmers in the τ.50 and τ.75 quantiles, respectively. However, it decreases the income at the τ.25 quantile by 0.118%, all things being equal.
The stock size coefficient was positive and significant in addressing farmer income by the 1%, 1%, and 5% probability levels for the τ.25, τ.50, and τ.75 quantiles, respectively. It means that an increase in the number of birds in the stock will result in a significant increase in the farmer’s income by 0.527%, 0.676%, and 0.524% for the τ.25, τ.50, and τ.75 quantiles, respectively.
The coefficient of family size was positive across the quantiles, but only in the τ.25 and τ.50 quantiles was it statistically significant. This indicates that a change in the family size will cause a change in the farm income by 0.138% and 0.344% for the τ.25 and τ.50 quantiles, respectively.
The cost of Day-Old Chicks (DOC) was only positive and significant in the highest (τ.75) quantile, implying that a money (naira) increase in the cost of DOC will result in a 0.055% increase in the farmers’ income.
The cost of feed’s coefficient had a negative effect on income across the quantiles, which means that a money increase in the cost of feed will result in a negative change in the income of the farmers by 0.107%, 0.472%, and 0.816% for the τ.25, τ.50, and τ.75 quantiles, respectively.

4. Discussion

The findings on the HMPs utilized by poultry farmers with the vaccination and medication used in this study area agreed with the assertion of [60], who observed that the majority of farmers adopted the recommended improved HMPs.
The first key objective of our research is to determine the practicability of using the GPR model as an analytical tool to investigate the intensity of HMP use among poultry farmers (Table 5). The diagnostic tests performed for the acceptability of the GPR models over other Poisson distribution models and alternative regression models were plausible and reiterated the application of the GPR model as a good alternative for the count data, such as the number of HMPs utilized in this study. The model is also a viable option because the beta coefficients of most of the variables support the a priori expectation, and also align with the findings of other studies in the literature [45,46,47,61]. The significant and negative relationships between HMP utilization and secondary school education and tertiary education compared with primary education indicated that a higher level of education might not be a prerequisite to the HMP utilization. Although, several studies in the literature [30,33,62,63] have reported a positive relationship between educational level and the adoption or intensity of adoption. However, most of these studies coded education in either categorical or dummy forms, which makes it difficult to really identify the threshold at which the level of education contributes to the degree of adoption or utilization of technologies. A plausible reason for the negative relationship might be either that the adoption or the intensity of utilizing technologies is only influenced by primary school education when the farmer can read and write. At this level, farmers can acquire the needed skills for utilizing HMPs either from seminars or agricultural shows or workshops or through extension agents. The result is equivocal and, to avoid misguided information, it is better to conduct a historical data analysis of the farmers as also suggested by [64]. This is because, in Nigeria and other developing countries, most educated people only engage in farming activities because of unemployment, and they are not committed to farming as many of them will still be hunting for white-collar jobs. Similar findings have been reported by [61,65,66] using the Poisson regression model and they asserted that educated people with more than a primary school education may have adequate knowledge of alternative methods that appear to be superior to utilizing many technologies, HMPs in the case of this study. The submission might not be totally true for the case of Nigeria and other developing countries where farmers are still struggling with technologies and innovations. Despite the finding of [45] being contrary to this study as the higher school education increased degrees of adoption, they submitted that education tends to be a crucial factor of technology utilization when a poorly educated population is targeted. The studies of [30,62] argued that farmers who are more educated or exposed to formal education have a high propensity towards adoption and would have a higher perception of environmental problems than those with a low level of educational qualification. The findings might not reflect the situation in the area, as both studies failed to indicate the category of educational level that could contribute to the adoption of technologies. Again, the poultry farmers that attended training on poultry production have the likelihood of utilizing more HMPs. A plausible reason could be that the required knowledge with diverse practices must have been learned by the farmers since the trained poultry farmers utilize HMPs for about 7.7% over the respondents that did not attend the training. This finding backs up [63], who discovered a positive connection between the training and the intensity of technology adoption. The authors concluded in their studies that providing basic education and training enhances the intensity of knowledge and innovation utilization. In addition, [2] also reported that extension tools such as training will provide technical information and influence the rate of technology utilization. Poultry farmers that own lands (land ownership) are more likely to utilize HMPs compared with farmers that did not own land. The probable reason might be that those without land ownership may feel insecure about their long-term rights. This is contrary to the argument of [45], who reported that the lack of formal land title does not strongly influence the rate of adoption. The type of production system employed by the farmers significantly influences the HMP’s utilization. The farmers that combined the battery cage and deep litter are likely to utilize HMPs more than those that use deep litter alone. This is expected because most of the poultry farms in the study area and in other developing countries [67] do not employ biosecurity practices and also lack access to well-equipped veterinary services, thereby necessitating the frequent use of different HMPs to prevent, control, and resolve any problem. This is due to the fact that direct contact between the litter and birds might fuel the infestation of pathogens that will harm the productivity and welfare of the birds [2], which necessitates the utilization of HMPs. The significant and positive relationship between poultry farming experience and HMP’s utilization follows expected a priori. This result is consistent with the several studies on the intensity of adoption, such as [13,33,68] carried out in Karnataka, Kenya, and Nigeria, respectively. The larger the birds, the more likely their welfare will be jeopardized, which may lead to an increase in the use of HMPs. This is reiterated by an almost 17% increase in the incident rate. It was observed from the field that some of the poultry farmers do not follow standards in terms of housing, feeding, vaccinations, and medications, and the only way to cover up for the lapses is to frequently utilize different HMPs. According to [27,69], strained poultry production by increasing the density and population size will promote disease transmission. Again, the mortality rate significantly increases the utilization of HMPs in the area. The incident rate of about 1.11 times tells that the utilization of HMPs increased by 11% each time a death of birds is recorded. This is inimical to the productivity and economic performance of the farmers as also reported by [2]. Furthermore, [19] asserted that diseases have been a major problem in the production of meat and eggs in low-income and developing countries due to a lack of resources for proper management and a lack of technological know-how. As also observed in the study, the author reported that most commercial poultry farms typically put no or few biosecurity programs in place.
The second main objective is to examine the heterogeneous effect of HMP’s utilization and the socioeconomic factors on the poultry farmers’ income using the CQR model (Table 6). The model passed the necessary econometric properties, therefore, making the predictions desirable. The variations in the coefficients and significant variables between the OLS and CQR models justify the heterogeneity in the income of the poultry farmers, as also revealed in Figure 2. The significant relationship between farm income and HMP’s utilization cuts across the quantiles except at the T.50 quantiles at the 5% probability level. The magnitude of the coefficient was higher at the T.25 quantile, meaning that the HMP’s utilization decreases income at the upper quantile. The probable reason is that the income at the upper quantile could be assumed as farmers operating on a large scale. It is assumed that farmers with large stock of birds will utilize more HMPs, which might negatively affect their incomes. It is expected that farmers with large birds, especially in the deep litter housing system, will frequently utilize HMPs to avoid the invasion of insects, rodents, and predators that could affect the welfare, productivity, and performance of the birds [2]. Some of these practices will involve increase in the cost of labor, medications, vaccinations, and others, that will infringe on the income realized by the farmers [63,70]. The age was negatively related with the income in all the quantiles but significant at the T.25 quantile, being the highest magnitude in terms of the coefficient. The issue of age in relation with income has been viewed from two perspectives: (i) some researchers reported that the increase in age would lead to decrease in productivity and thereby reduce the income of the farmers [31,37,71]; and (ii) some researchers as well linked age with experience, and believed that aged farmers would have gathered adequate knowledge and skills over the years on how to improve productivity and income [33,38,72,73]. The present study disagreed with the later school of thought because age is not a prerequisite for engaging in the poultry business. Since the relationship is negative across the quantiles, one will go with the former assertion that a year increase in the age of the farmer will lead to a decrease in their income. The possible explanation is that young and active poultry farmers will contribute tangible labor input and will be agile to utilize HMPs that could lead to more income. The routine poultry production activities are seriously engaging and somehow laborious in terms of prompt attention required by the birds. The case gets worse in areas, such as Nigeria and other developing countries, where there are inadequate facilities and other modern poultry-based infrastructures. The positive and significant effect of education on farm income followed an a priori expectation. The magnitude was also higher at the T.25 than other quantiles, meaning that educated poultry farmers might acquire more skills and knowledge that could increase income than the uneducated farmers. However, the results justified that higher education beyond primary school does not significantly contribute to the income. This might be the probable reason why higher educated farmers do not utilize many HMPs, as it was also negatively related in Table 5. The findings do not entirely support the report of [61,65,66] that educated people with more than a primary school education may have accurate knowledge of alternative methods that seem to be superior in terms of increasing their income. The results support the findings of [15,74], who reported that basic education would allow farmers to gain access to relevant information that would boost their production. The study of [38] that was carried out in Nigeria also reported that farmers might not need higher education in poultry production because they could acquire the needed skills through extension services, seminars, and workshops. Again, at the lower quantile, female poultry farmers significantly contributed to income compared with their male counterparts, while male poultry farmers contributed more positively to income than the female counterpart at the upper quantile. The probable reason might be that the females at the upper quantile might find the poultry business tasking when combined with domestic works. There is a negative association between the poultry farming experience and income at the T.25 quantile, and the OLS results do not agree with the theory. It might be assumed that those at the lower quantile were farmers who had secondary occupations and they are not committed, such as those in full-time business in a large quantity. The quantiles T.50 and T.75 results followed expected a priori, meaning that a year increase in the poultry business will lead to a significant increase in the farm income. This is because farmers would have been cautious and mastered the areas of production risks and understood the best HMPs for the best possible output over the years. This is also consistent with the studies by [33,34,35,75] that reported a positive and significant influence of experience on the farm performance. The significant and positive relationships between income and stock size are supported with several studies in the literature [15,34,38,76]. It means that the larger the stock size, the more the income accrues from the poultry enterprise, ceteris paribus. As it has been said, more stock size incurs more cost, but large-scale farmers always enjoy diseconomies return-to-scale (DRTS) in production if properly managed; that is, the cost decreases as the output increases. The relationship between family size and income was only significant and positive at the T.25 and T.50 quantiles. This is evident that family members immensely contribute to poultry production, especially among the Small and Medium Scale (SMS) farmers. It has formed a major family business among farming households in Nigeria. The insignificant contribution of family size at the upper quantile is justifiable because most commercial poultry farms used hired labor with little or no contribution of the family members. In addition, [77] argued that the large family enables labor requirements to be met by the family members, thus, reducing the additional cost of hiring labor. Furthermore, [76] reported that family size considerably influences the farm income among egg poultry farmers in Nigeria. The cost of Day-Old Chicks (DOCs) was only significant to explain the income at the upper quantile. A plausible reason might be the bulkiness and discount received in buying in large quantity. Again, the turnover in the large-scale farming might also subsume the cost of DOCs in the total cost. The negative relationship at the T.25 and T.50 quantiles might result from the statement made by [78], that the availability and quality of DOCs has been reflected as a weakness in the Nigerian poultry industry. Furthermore, the cost of feed is negatively but significantly related with farm income across all the quantiles. Recently, the sporadic hike in the cost of feed in the livestock generally has dragged many farmers out of the business. It has been worsened since the inception of the COVID-19 pandemic, where the inflation, exchange rate, and other macroeconomic parameters have not been favorable to Nigeria’s economy. Again, many of the poultry farmers solely depend on imported feed and those locally prepared have suffered from the high cost of ingredients and other resources. It has been reported by [13] that poultry farmers are now subjected under perpetual pressure to produce poultry products in the shortest possible time with optimal output to meet the increasing demand. The observed indirect implication is getting poor quality and low quantity of poultry products at exorbitant prices so as to meet up demand. Again, [70] reported that feed is expensive, with low optimal performance and leaving Nigerian farmers with high costs, knowing that feed accounts for nearly 70% of the total cost of production [79]. In addition, similar findings have been reported by [5] on the fish enterprise in Nigeria, that feed cost accounts for a large proportion of the cost of production, thus, negatively affecting the income of the farmers.

5. Conclusions

Following the findings, it was concluded that the poultry farmers adopt and utilize different recommended HMPs in the area. It is clear that farmers are aware of the recommended HMPs, vaccinations, and medications that could promote the welfare of animal production, as well as guarantee sustainable agri-environmental development. Again, the study established the significance of the GPR model in estimating count data outcomes using the HMP utilization of the poultry farmers as an example. The results from the GPR model revealed relevant policy implications that would promote the poultry industry. As much as education is significant in the poultry enterprise, the study concluded that basic education (primary school education) and training through workshops, seminars, and extension services contributes more significantly to the adoption and utilization of technologies, HMPs in the case of this study. Land ownership is also an important factor in the use of HMPs. Thus, it was concluded that access to the formal land title makes the poultry farmers feel secure in utilizing technologies and also in erecting structures that could promote long-term HMPs. The type of housing production system, farming experience, stock size, and mortality rate were concluded to significantly increase the utilization of HMPs. Therefore, the study reiterates the importance of farmers’ behavioral factors in knowledge adoption and implementation theory.
The study further concluded that there is an existence of heterogeneity in the poultry farmers’ income. The idea of modelling HMPs with the socioeconomic factors in explaining the heterogeneity in the income of the farmers using the CQR over the OLS model also gives robust policy implications. It was concluded that different factors affect farmers’ income at different quantiles, while some variables seemed to be indispensable in addressing the performance of the farmers across the quantiles. Despite the variations, variables such as education, experience, stock size, and cost of feed were concluded to be paramount in the poultry production at all quantiles. The significant relationship between HMPs and farmers’ income inferred that HMPs have an upward contribution at the lower quantile but downward contribution at the upper quantile. It is a signal that one incurs cost in utilizing HMPs, which might tell on the income with an increase in the stock density. Thus, HMP utilization is very key to the success of poultry production, and it is a two-coin relationship that depends on how properly it is being utilized. The study, therefore, established that farmers in the area cannot be treated the same in terms of policies, but rather be addressed based on their scale of production in order to achieve sustainable agricultural development, not only in Nigeria, but across Africa and other developing countries.
Premised on the findings of this study, the following recommendations were made:
  • The government, through the help of extension agents, should organize and promote poultry skills acquisition and poultry-based vocational education that will intensify relevant HMP’s utilization. Having attained at least one form of formal education will allow them to make rational choices and decisions. This idea will also adequately train poultry farmers to be technically competent to handle modern farming practices.
  • The government and the relevant stakeholders should be interested in reviewing the current land use act. This can be conducted by providing suggestions on how to reform the land in favor of agriculture and food production in the area. This will assure and strengthen the land-use security by the farmers and also encourage them to observe hygiene practices and apply sanitary regulations in and outside of the farm.
  • Since farmers’ behaviors affect the decision to adopt and utilize HMPs, the government should improve the farmers’ welfare and standard of living by providing soft credit/loans, subsidies on poultry-based technologies, and incentives to the farmers.
  • Due to the presence of heterogeneity in the poultry farmers’ income, it is high time the government, non-governmental organizations (NGOs) and other stakeholders desisted from treating farmers the same when making policies. They should be addressed based on their production scale. This can be achieved through compulsory registration of the farms with the farmer’s details. This will also assist them in forming farmer’s groups and cooperative societies, which may be beneficial in terms of credit, information, and the like. Researchers in Nigeria and other developing countries face a significant challenge in determining the number of farmers engaged in a specific enterprise (e.g., poultry). It is always difficult and costly to identify genuine farmers due to the lack of proper records and data on farmers due to the subsistence nature of farming.
  • The government and farmers should be interested in policies that increase farmers’ income by lowering production costs, particularly feed costs, which account for more than 70% of total costs. This can be accomplished by creating a favorable environment for local feed producers to thrive and produce feed of the same quality as imported feeds. If this is accomplished, farmers will be encouraged to use locally produced feed, which will boost the economy while also lowering feed costs in the long run.
  • The negative coefficient of age in relation to income call for the urgent recruitment of youths into the poultry agri-entrepreneur. Not only that it will boost poultry production, but it is an antidote to poverty reduction and unemployment if properly handled. This can be achieved through the farm village approach, where the youths will be accommodated, trained, and empowered for a particular period. This will also make the educated youths be more interested and committed to the business rather than looking for white-collar jobs.

Author Contributions

Conceptualization, A.I.O.; methodology, A.I.O.; formal analysis, A.I.O.; writing—review and editing, A.I.O., L.O.O., I.A.A. and Y.S.H.; survey design, T.O.O. and I.A.; project administration, T.O.O., L.O.O. and I.A.; writing—original draft preparation, T.O.O. and A.I.O.; validation, L.O.O.; investigation, L.O.O.; supervision, I.A.A. and T.T.A.; resources, T.T.A. and I.A.A.; visualization, T.T.A.; funding acquisition, Y.S.H. All authors have read and agreed to the published version of the manuscript.

Funding

This research received no external funding.

Institutional Review Board Statement

Not applicable.

Informed Consent Statement

Informed consent was obtained from all poultry farmers involved in the study.

Data Availability Statement

The data presented in this study are available on request from the corresponding author.

Acknowledgments

We appreciate the Poultry Association of Nigeria (PAN), Ondo State chapter, and Ondo State Agricultural Development Programme (ADP) officers for their support and assistance during the data collection.

Conflicts of Interest

The authors declare no conflict of interest.

References

  1. Hafez, H.M.; Attia, Y.A. Challenges to the poultry industry: Current perspectives and strategic future after the COVID-19 outbreak. Front. Vet. Sci. 2020, 7, 516. [Google Scholar] [CrossRef] [PubMed]
  2. Ritter, C.; Jansen, J.; Roche, S.; Kelton, D.F.; Adams, C.L.; Orsel, K.; Erskine, R.J.; Benedictus, G.; Lam, T.J.G.M.; Barkema, H.W. Invited review: Determinants of farmers’ adoption of management-based strategies for infectious disease prevention and control. J. Dairy Sci. 2017, 100, 1–19. [Google Scholar] [CrossRef] [PubMed] [Green Version]
  3. Um, M.; Adenrele, M.J. Assessment of the Knowledge, Attitude and Compliance of Poultry Workers with Preventive Measures for Poultry Diseases in Sokoto Metropolis. EAS J. Vet. Med. Sci. 2020, 2, 61–64. [Google Scholar] [CrossRef]
  4. Food and Agriculture Organisation (FAO). The State of World Fisheries and Aquaculture 2016. Contributing to Food Security and Nutrition for All. Available online: https://www.fao.org/3/i5555e/i5555e.pdf (accessed on 12 July 2022).
  5. Adelesi, O.O.; Baruwa, O.I. Profitability analysis of smallholder aquaculture farms: The case of Lagos State, Nigeria. J. Agric. Rural Dev. Trop. Subtrop. 2022, 123, 109–120. [Google Scholar]
  6. FAO; IFAD; UNICEF; WFP; WHO. The State of Food Security and Nutrition in the World 2018. Building Climate Resilience for Food Security and Nutrition; FAO: Rome, Italy, 2018; Available online: http://www.fao.org/3/I9553EN/i9553en.pdf (accessed on 12 January 2022).
  7. Food and Agriculture Organisation (FAO). Fisheries and Food Security. 2018. Available online: http://www.fao.org/focus/e/fisheries/intro.htm (accessed on 12 July 2022).
  8. Food and Agriculture Organisation (FAO). The State of Food Security and Nutrition in the World 2020. Available online: https://www.fao.org/publications/sofi/2020 (accessed on 12 July 2022).
  9. Lawal, B.O.; Torimiro, D.O.; Makanjuola, B.A. Impact of agricultural extension practices on the Nigerian poultry farmers’ standard of living: A perceptional analysis. Trop. Subtrop. Agroecosystems 2009, 10, 465–473. [Google Scholar]
  10. Kwaghe, A.V.; Vakuru, C.T.; Ndahi, M.D.; Usman, J.G.; Abubakar, A.; Iwar, V.N. Veterinary services as a panacea for agricultural development and increase in Nigeria’s gross domestic product (GDP): A review. Int. J. Life Sci. 2015, 4, 134–146. [Google Scholar]
  11. Alders, R.; Pym, R. Village poultry: Still important to millions, eight thousand years after domestication. Worlds Poult. Sci. J. 2009, 65, 181–190. [Google Scholar] [CrossRef]
  12. Randolph, T.; Schelling, E.; Grace, D.; Nicholson, C.; Leroy, J.; Cole, D.; Demment, M.W.; Omore, A.; Zinsstag, J.; Ruel, M. Invited Review: Role of livestock in human nutrition and health for poverty reduction in developing countries. J. Anim. Sci. 2007, 85, 2788–2800. [Google Scholar] [CrossRef] [Green Version]
  13. Campbell, Z.A.; Marsh, T.L.; Mpolya, E.A.; Thumbi, S.M.; Palmer, G.H. Newcastle disease vaccine adoption by smallholder households in Tanzania: Identifying determinants and barriers. PLoS ONE 2018, 13, e0206058. [Google Scholar] [CrossRef] [Green Version]
  14. Poultry World. FAO Sustainable Livestock Africa 2050 Report. 2022. Available online: https://www.poultryworld.net/home/fao-sustainable-livestock-africa-2050-report/ (accessed on 4 May 2022).
  15. Heise, H.; Crisan, A.; Theuvsen, L. The poultry market in Nigeria: Market structures and potential for investment in the market. Int. Food Agribusiness Manag. Rev. 2015, 18, 197–222. [Google Scholar]
  16. Ogunyemi, O.I.; Orowole, P.F. Poultry farmers socio-economic characteristics and production limiting factors in Southwest Nigeria. J. Sust. Dev. Afri. 2020, 22, 151–165. [Google Scholar]
  17. Mohammed, B.R.; Sunday, O.S. An overview of the prevalence of avian coccidiosis in poultry production and its economic importance in Nigeria. Vet. Res. Int. 2015, 3, 35–45. [Google Scholar]
  18. Eze, C.O.; Chah, J.M.; Uddin, I.O.; Anugwa, I.J.; Igbokwe, E.M. Bio-security measures employed by poultry farmers in Enugu State Nigeria. J. Agric. Ext. 2017, 21, 89–104. [Google Scholar] [CrossRef] [Green Version]
  19. Kwaghe, A.V.; Vakuru, C.T.; Ndahi, M.D.; Abubakar, A.; Iwar, V.N.; Eze, E. Proper hygiene and effective management of livestock as a Panacea for agricultural development and increase in Nigeria’s gross domestic product (GDP): A review. CAB Rev. 2016, 11, 1–21. [Google Scholar] [CrossRef]
  20. Alalade, O.A.; Olorunfemi, O.D.; Olaoye, I.J.; Ladipo, T.O.; Yusuf, A. Assessment of factors influencing biosecurity measures employed by livestock farmers in selected LGAs of Kwara State Nigeria. J. Sci. Technol. Math. Edu. 2018, 14, 90–100. [Google Scholar]
  21. Musa, I.W.; Saidu, L.; Abalaka, E.S. Economic impact of recurrent outbreaks of gumboro disease in a commercial poultry farm in Kano, Nigeria. Asian J. Poult. Sci. 2012, 6, 152–159. [Google Scholar] [CrossRef] [Green Version]
  22. Dórea, F.C.; Cole, D.J.; Hofacre, C.; Zamperini, K.; Mathis, D.; Doyle, M.P.; Lee, M.D.; Maurer, J.J. Effect of Salmonella vaccination of breeder chickens on contamination of broiler chicken carcasses in integrated poultry operations. Appl. Environ. Microbiol. 2010, 76, 7820–7825. [Google Scholar] [CrossRef]
  23. Fasina, F.O.; Ali, A.M.; Yilma, J.M.; Thieme, O.; Ankers, P. The cost–benefit of biosecurity measures on infectious diseases in the Egyptian household poultry. Prev. Vet. Med. 2012, 103, 178–191. [Google Scholar] [CrossRef] [Green Version]
  24. Augustine, C.; Majaba, D.I.; Igwebuike, J.U. An assessment of biosecurity status of poultry farms in Mubi zone of Adamawa state, Nigeria. J. Agric. Vet. Sci. 2010, 2, 65–67. [Google Scholar]
  25. Moges, F.; Tegegne, A.; Dessie, T. Indigenous Chicken Production and Marketing Systems in Ethiopia: Characteristics and Opportunities for Market-Oriented Development; IPMS (Improving Productivity and Market Success) of Ethiopian Farmers Project Working Paper 24; ILRI: Nairobi, Kenya, 2010. [Google Scholar]
  26. Wierup, M. Principles and strategies for the prevention and control of infectious diseases in livestock and wildlife. In Ecology and Animal Health; Norrgren, L., Levengood, J., Eds.; Baltic University Press: Uppsala, Sweden, 2012. [Google Scholar]
  27. Muaz, K.; Riaz, M.; Akhtar, S.; Park, S.; Ismail, A. Antibiotic residues in chicken meat: Global prevalence, threats, and decontamination strategies: A review. J. Food Prot. 2021, 81, 619–627. [Google Scholar] [CrossRef]
  28. Egwuma, H.; Muhammed, A.E.; Ojeleye, O.A.; Oladimeji, Y.U.; Hassan, A.A. Adoption of recommended broiler management practices among women farmers in Igabi local government area of Kaduna State. Nig. J. Agric. Ext. 2018, 19, 31–39. [Google Scholar]
  29. Green, L.W.; Ottoson, J.M.; Garc, C.; Hiatt, R.A. Diffusion theory and knowledge dissemination, utilization, and integration in public health. Annu. Rev. Public Health 2014, 30, 151–174. [Google Scholar] [CrossRef] [PubMed] [Green Version]
  30. Ofuoku, A.U.; Egbuchua, C.; Okonmah, L.U. A Tobit analysis of propensity to adopt soil conservation practices among arable crop farmers in Delta State, Nigeria. Agricultura 2011, 77, 10–18. [Google Scholar]
  31. Fatuase, A.I.; Aborisade, A.S.; Omisope, E.T. Determinants of adaptation measures to climate change by arable crop farmers in Owo Local Government Area of Ondo State, Nigeria. World Rural Observ. 2015, 7, 49–57. [Google Scholar]
  32. Ehinmowo, O.O.; Fatuase, A.I. Adoption of improved cassava processing technologies by women entrepreneur in South-West, Nigeria. World J. Agric. Res. 2016, 4, 109–113. [Google Scholar]
  33. Olutumise, A.I.; Adene, I.C.; Ajibefun, A.I.; Amos, T.T. Adoption of improved technologies and profitability of the catfish processors in Ondo State, Nigeria: A Cragg’s Double-Hurdle Model Approach. Sci. Afr. 2020, 10, e00576. [Google Scholar] [CrossRef]
  34. Oladunni, M.E.; Fatuase, A.I. Economic analysis of backyard poultry farming in Akoko Northwest Local Government Area of Ondo State, Nigeria. Glob. J. Biol. Agric. Health Sci. 2014, 3, 141–147. [Google Scholar]
  35. Ehinmowo, O.O.; Afolabi, J.A.; Fatuase, A.I. Determinants of profitability among small-scale cassava processors in South Western Nigeria. Russ. J. Agric. Soc.-Econ. Sci. 2015, 37, 23–27. [Google Scholar] [CrossRef]
  36. Bobola, O.M.; Afolayan, J.A.; Olutumise, A.I. Market inequality and performance of gari marketing in Ondo State, Nigeria. Appl. Trop. Agric. 2019, 24, 23–32. [Google Scholar]
  37. Oseni, J.O.; Olutumise, A.I.; Olutumise, B.O. Performance evaluation of cocoa marketing in Osun State, Nigeria. J. Perspect. Financ. Reg. Dev. 2018, 6, 97–112. [Google Scholar] [CrossRef] [Green Version]
  38. Johnson, S.B.; Mafimisebi, T.E.; Oguntade, A.E.; Mafimisebi, O.E. Factors affecting the profitability of poultry egg production in Southwest Nigeria: An application of quantile regression. Rev. Agric. Appl. Econ. 2020, 23, 65–72. [Google Scholar] [CrossRef]
  39. Midingoyi, S.G.; Kassie, M.; Muriithi, B.; Diiro, G.; Ekesi, S. Do farmers and the environment benefit from adopting integrated pest management practices? Evidence from Kenya. J. Agric. Econ. 2019, 70, 452–470. [Google Scholar] [CrossRef]
  40. Ma, W.; Wang, X. Internet use, sustainable agricultural practices and rural incomes: Evidence from China. Aust. J. Agric. Resour. Econ. 2020, 64, 1087–1112. [Google Scholar] [CrossRef]
  41. Ali, M.F.; Rose, S. Farmers’ perception and adaptations to climate change: Findings from three agro-ecological zones of Punjab, Pakistan. Environ. Sci. Pollut. Res. Int. 2020, 28, 14844–14853. [Google Scholar] [CrossRef]
  42. Bryan, E.; Ringler, C.; Okoba, B.; Roncoli, C.; Silvestri, S.; Herrero, M. Adapting agriculture to climate change in Kenya: Household strategies and determinants. J. Environ. Manage. 2013, 114, 26–35. [Google Scholar] [CrossRef]
  43. Loomis, D.; Richardson, D.B.; Elliott, L. Poisson regression analysis of ungrouped data. Occup. Environ. Med. 2005, 62, 325–329. [Google Scholar] [CrossRef] [Green Version]
  44. Chau, A.M.H.; Lo, E.C.M.; Wong, M.C.M.; Chu, C.H. Interpreting Poisson Regression Models in Dental Caries Studies. Caries Res. 2018, 52, 339–345. [Google Scholar] [CrossRef]
  45. Octavio, A.R.; Steven, D.S. Poisson Count Models to Explain the Adoption of Agricultural and Natural Resource Management Technologies by Small Farmers in Central American Countries. J. Agric. Appl. Econ. 2000, 32, 21–33. [Google Scholar]
  46. Bae, S.; Famoye, F.; Wulu, J.T.; Bartolucci, A.A.; Singh, K.P. A rich family of generalized Poisson regression models with applications. Math. Comput. Simul. 2005, 69, 4–11. [Google Scholar] [CrossRef]
  47. Islam, M.M.; Alam, M.; Tariquzaman, M.; Kabir, M.A.; Rokhsona Pervin, R.; Begum, M.; Khan, M.M.H. Predictors of the number of under-five malnourished children in Bangladesh: Application of the generalized Poisson regression model. BMC Public Health 2013, 13, 11. [Google Scholar] [CrossRef] [Green Version]
  48. Consul, P.C.; Famoye, F. Generalized Poisson regression model. Commun. Statist. Theor. Methods 1992, 21, 89–109. [Google Scholar] [CrossRef]
  49. Consul, P.C. Generalized Poisson Distributions: Properties and Applications; Marcel Dekker Inc.: New York, NY, USA, 1989. [Google Scholar]
  50. Winkelmann, R.; Zimmermann, K.F. Count data models for demographic data. Math Popul. Stud. 1994, 48, 205–221. [Google Scholar] [CrossRef] [PubMed] [Green Version]
  51. Wang, W.; Famoye, F. Modeling household fertility decisions with generalized Poisson regression. J. Popul. Econ. 1997, 10, 273–283. [Google Scholar] [CrossRef] [PubMed]
  52. Xie, F.C.; Wei, B.C. Influence analysis for count data based on generalized Poisson regression models. Statistics 2010, 44, 341–360. [Google Scholar] [CrossRef]
  53. Mugenyi, A.; Muhanguzi, D.; Hendrickx, G.; Nicolas, G.; Waiswa, C.; Torr, S.; Welburn, S.C.; Atkinson, P.M. Spatial analysis of G.f.fuscipes abundance in Uganda using Poisson regression models. PLoS Negl. Trop. Dis. 2021, 15, e0009820. [Google Scholar] [CrossRef]
  54. Famoye, F.; Wulu, J.T.; Singh, K.P. On the generalized Poisson regression model with an application to accident data. J. Data Sci. 2004, 2, 287–295. [Google Scholar] [CrossRef]
  55. Consul, P.C.; Jain, G.C. A generalization of the poisson distribution. Technometrics 1993, 15, 791–799. [Google Scholar] [CrossRef]
  56. Shoukri, M.M. Estimation Problems for Some Generalized Discrete Distributions. Ph.D. Thesis, University of Calgary, Calgary, AB, Canada, 1980. [Google Scholar]
  57. Nyantakyi, K.A.; Peiris, B.L.; Gunaratne, L.H.P. Analysis of the interrelationships between the prices of Sri Lankan rubber, tea and coconut production using multivariate time series. Adv. Econ. Bus. 2015, 32, 50–56. [Google Scholar] [CrossRef] [Green Version]
  58. Kostov, P.; Davidova, S. A quantile regression analysis of the effect of farmers’ attitudes and perceptions on market participation. J. Agric. Econ. 2013, 64, 112–132. [Google Scholar] [CrossRef] [Green Version]
  59. Alhassan, A.L.; Fiador, V. Insurance-growth nexus in Ghana: An autoregressive distributed lag bounds cointegration approach. Rev. Dev. Finance 2014, 4, 83–96. [Google Scholar] [CrossRef] [Green Version]
  60. Olaniyi, A.O.; Adesiyan, I.O.; Ayoade, R.A. Constraints to utilization of poultry production technology among farmers in Oyo State, Nigeria. J. Hum. Ecol. 2008, 24, 305–309. [Google Scholar] [CrossRef]
  61. Wahyudi, A.; Kuwornu, J.K.M.; Gunawan, E.; Datta, A.; Nguyen, L.T. Factors influencing the frequency of consumers’ purchases of locally-produced rice in Indonesia: A Poisson regression analysis. Agriculture 2019, 9, 117. [Google Scholar] [CrossRef] [Green Version]
  62. Ajayi, M.T.; Banmeke, T.O. Farmers’ perception and knowledge of environmental problems affecting sustainable food production in Edo State. J. Environ. Ext. 2007, 6, 86–91. [Google Scholar] [CrossRef]
  63. Oladimeji, Y.U.; Ajao, A.M.; Abdullahi, A.N.; Abdulsalam, Z.; Damisa, M.A. Adoption of improved technologies and management practices among bee farmers in North Central and North Western Nigeria towards sustainable development goals. Ethiop. J. Appl. Sci. Technol. 2017, 8, 1–13. [Google Scholar]
  64. Ngango, J.; Nkurunziz, F.; Mbarakad, S.R.; Cyamweshie, A.R. Determinants of sustainable agricultural intensification adoption and impacts on household productivity and consumption in Rwanda. J. Agric. Rural Dev. Trop. Subtrop. 2022, 123, 39–50. [Google Scholar] [CrossRef]
  65. Cranfield, J.; Henson, S.; Blandon, J. The effect of attitudinal and socio-demographic factors on the likelihood of buying locally-produced food. Agribusiness 2012, 28, 205–221. [Google Scholar] [CrossRef]
  66. Mirosa, M.; Lawson, R. Revealing the lifestyles of local food consumers. Br. Food J. 2012, 114, 816–825. [Google Scholar] [CrossRef]
  67. Food and Agriculture Organisation (FAO). FAO Country Programming Framework (CPF) Federal Republic of Nigeria. Available online: https://www.fao.org/TC/CPF/Countries/Nigeria/CPF_Nigeria_2013_2017.pdf (accessed on 2 July 2014).
  68. Kiresur, V.R.; Nayak, M.R.; Gaddi, G.M.; Khyadagi, K.S. Improved farm technology adoption and its role in doubling farmers’ income: A case of dry zones in Karnataka. Agric. Econ. Res. Rev. 2017, 30, 217–231. [Google Scholar] [CrossRef] [Green Version]
  69. Drew, T.W. The emergence and evolution of swine viral diseases: To what extent have husbandry systems and global trade contributed to their distribution and diversity? Rev. Sci. Technol. 2011, 30, 95–106. [Google Scholar] [CrossRef]
  70. NABC (Netherlands Africa Business Council). Poultry Sector Study Nigeria. Commissioned by the Netherlands Enterprise Agency. Available online: https://www.rvo.nl/sites/default/files/2020/10/Poultry-Sector-Study-Nigeria.pdf (accessed on 20 April 2022).
  71. Bankole, A.S.; Ojo, S.O.; Olutumise, A.I.; Garba, I.D.; Abdulqadir, M.I. Efficiency evaluation of smallholders palm oil production in Edo State, Nigeria. Asian J. Agric. Ext. Sociol. 2018, 24, 1–9. [Google Scholar]
  72. Farayola, C.O.; Akintaro, O.S.; Yahaya, A.A.; Oni, O.O. Determinants of Marketing Efficiency among Small-Holder Cocoa Marketers in Oyo State, Nigeria. Int. J. Manag. Soc. Sci. Res. 2013, 2, 33–43. [Google Scholar]
  73. Oparinde, L.O.; Olutumise, A.I. Impact of credit constraints on aquaculture production and risk exposure in Ondo State, Nigeria. J. Appl. Aquac. 2022, 34, 79–96. [Google Scholar] [CrossRef]
  74. Onubuogu, G.C.; Esiobu, N.S.; Nwosu, C.S.; Okereke, C.N. Resource use efficiency of smallholder cassava farmers in Owerri Agricultural Zone, Imo State, Nigeria. Sch. J. Agric. Sci. 2014, 7, 142–152. [Google Scholar]
  75. Adene, D.F.; Oguntade, A.E. The Structure and the Importance of the Commercial and Village-Based Poultry Industry in Nigeria; FAO: Rome, Italy, 2006. [Google Scholar]
  76. Esiobu, N.S.; Onubougu, G.C.; Okoli, V.B.N. Determinants of Income from Poultry Egg Production in Imo State, Nigeria: An Econometric Model Approach. Glob. Adv. J. Agric. Sci. 2014, 3, 186–199. [Google Scholar]
  77. Emaikwu, K.K.; Chikwendu, D.O.; Sani, A.S. Determinants of flock size in broiler production in Kanduna State of Nigeria. J. Agric. Ext. Rural Dev. 2011, 3, 202–211. [Google Scholar]
  78. Nse-Nelson, F.A.; Kurumeh, J.C.; Osondu, K.R. Evaluation of poultry egg marketing in Ikwuano Local Government Area of Abia State, Nigeria. Agro-Science 2018, 17, 1–6. [Google Scholar] [CrossRef]
  79. Oladokun, V.O.; Johnson, A. Feed formulation problem in Nigerian poultry farms: A mathematical programming approach. Am. J. Sci. Ind. Research. 2012, 3, 14–20. [Google Scholar] [CrossRef]
Figure 1. Map of the Study Area.
Sustainability 15 02298 g001
Figure 2. Quantile Distribution of the Poultry Farmers’ Income.
Sustainability 15 02298 g002
Table 2. Distribution of HMPs adopted by the poultry farmers.
Health Management Practice AdoptedFrequencyPercentageRank
Proper vaccination11394.21st
Breeding stock from a reliable source11192.52nd
Ideal pre-placement preparation108903rd
Clean, disinfect, and fumigate housing equipment10486.74th
Timely treatment and removal of dead birds10184.25th
Proper feed management10083.36th
Administering multivitamins/antibodies at early stage9881.77th
Proper stock density of birds9579.28th
Ideal feeding troughs/drinker (10–15 chicks per tray/drinker)9478.39th
Adequate record keeping9377.510th
Proper medication8873.311th
Adequate lighting, heat, and humidity8772.512th
Screening out pest and disease vector8671.713th
Source: Field Survey, 2022.
Table 3. Distribution of the vaccination and medication used by the poultry farmers.
Vaccination and Medication UsedFrequencyPercentageRank
Anticoccidial (against coccidiosis) drugs and vaccines10184.21st
Infectious bursal disease vaccines and drugs (Gumboro)9982.52nd
Dewormer9881.73rd
Newcastle diseases (lasota) vaccines and drugs9780.84th
Fowl pox vaccines and drugs96805th
Marek’s vaccines and drugs9579.26th
Infectious coryza vaccines and drugs8772.57th
Chronic respiratory disease (mycoplasma) vaccines7360.88th
Egg disease syndrome vaccine6352.59th
Salmonella polurum vaccines and drugs605010th
Aspergillosis vaccines5848.311th
Fowl cholera vaccines and drugs5344.212th
Source: Field Survey, 2022.
Table 4. Results of statistical analysis for the appropriateness of the GPR Model.
Model DiagnosticEstimate
Mean4.808
Variance5.845
Z test value (df)23.929 ** (119)
Deviance goodness-of-fit
Prob > chi2 (13)
7.722
0.861
Pearson goodness-of-fit
Prob > chi2 (13)
7.894
0.850
Likelihood-ratio test:LR chi2 (1)
Prob > chi2 (1)
0.570
0.450
Kolmogorov-Smirnov Z
Asymp. Sig. (2-tailed)
1.192
0.117
Log likelihood–215.831
LR chi2 (13)
Prob > chi2
34.070
0.001
Note: ** = significant at a 1% level.
Table 5. Results of GPR model on the factors affecting the intensity of health management practices’ (HMPs) utilization.
VariableCategoryCoefficientStd. Err.P-ValueIRROLS
EducationSecondary school education–0.531 *0.2200.0160.588–0.051
Tertiary education–0.638 **0.2160.0030.528–0.623
No formal education–0.4830.3370.1520.617–0.071
Others0.4780.4360.2731.6135.470 *
Training Trained0.075 **0.0260.0051.077–0.007
Extension Accessed 0.0490.0270.0731.050–0.201
Land owner Owned0.001 **3.33 × 10−40.0021.0010.383
Credit Accessed–0.0120.1360.9300.9880.119
Production systemBattery cage and deep litter0.256 *0.1110.0221.292–0.204
Battery cage0.1220.1730.4821.130–0.141
Experience 0.005 **0.0020.0031.0050.007
Stock size 0.155 *0.0780.0451.1680.641 **
Mortality 0.106 **0.0270.0001.1120.002 **
Constant 1.7420.2810.0005.7093.464
Note: ** = significant at a 1% level; * = significant at a 5% level. Source: Field Survey, 2022.
Table 6. Results of CQR model on the determinants effect of HMP’s utilization on poultry farmer’s income.
Variable OLS   ( X ¯ ) τ.25τ.50τ.75
Coef.PCoef.PCoef.PCoef.P
HMPs0.293 *0.0260.342 *0.0290.1610.077–0.211 **0.006
Age–0.6600.478–1.324 **0.004–0.3290.792–0.3260.755
Years of schooling1.974 *0.0112.153 **0.0031.791 *0.0170.631 *0.016
Sex0.032 *0.044–0.392 *0.0400.0270.9710.045 *0.049
Experience–0.065 *0.020–0.118 *0.0260.002 **0.0060.105 **0.008
Stock size0.524 **0.0030.094 **0.0080.527 **0.0040.676 *0.046
Family size0.3580.0820.138 *0.0480.344 *0.0320.2990.583
Cost of day-old chicks–0.0700.516–0.2620.1850.0540.0970.055 *0.010
Cost of feed–0.411 **0.002–0.107 **0.004–0.472 **0.008–0.816 **0.006
Cost of medication0.0830.071–0.2300.5920.0020.096–0.1270.094
Constant8.0160.05311.1200.6117.4870.7149.2000.662
F-value56.231 **- - -
R20.792- - -
Pseudo R2-0.436 0.681 0.631
Breusch-Pagan test (chi2 (1))0.26 NS
Ramsey RESET test0.46 NS
Mean VIF1.98
Tolerance levels0.58
Note: ** = significant at a 1% level; * = significant at a 5% level; NS = non-significant. Source: Field Survey, 2022.
Disclaimer/Publisher’s Note: The statements, opinions and data contained in all publications are solely those of the individual author(s) and contributor(s) and not of MDPI and/or the editor(s). MDPI and/or the editor(s) disclaim responsibility for any injury to people or property resulting from any ideas, methods, instructions or products referred to in the content.

