

Portfolio Analysis of Clean Energy Vehicles in Japan Considering Copper Recycling

Department Management Systems, College of Informatics and Human Communication, Kanazawa Institute of Technology, Nonoichi 921-8501, Japan
Sustainability 2023, 15(3), 2113; https://doi.org/10.3390/su15032113
Submission received: 11 December 2022
/
Revised: 11 January 2023
/
Accepted: 19 January 2023
/
Published: 22 January 2023
(This article belongs to the Special Issue Resources Conservation, Recycling and Waste Management)
Abstract
:Several countries are moving toward carbon neutrality to mitigate climate change. The introduction of clean energy vehicles (CEVs) is a measure to offset the adverse effects of global warming. However, each CEV has its strengths and weaknesses. An optimal CEV portfolio must be formulated to create effective policies that promote innovative technologies and introduce them into the market. CEVs also consume more copper than gasoline vehicles. Copper is associated with supply risks, which most previous conventional studies have failed to address. Therefore, this study proposes a novel CEV optimization model for sustainable consumption of copper resources through recycling along with reduction of CO2 emissions. This study aims to analyze the optimal portfolio for domestic passenger vehicles and the assumed effects of copper recycling and usage reduction. For this analysis, this study set up scenarios for the recycling rate of copper contained in end-of-life vehicles and the reduction rate of copper used in newly sold vehicles. Our simulation results showed that increased recycling rates and reduced use of copper are necessary for the diffusion of battery electric vehicles. Furthermore, the simulation results indicated that if these improvements are not implemented, the deployment of fuel cell vehicles needs to be accelerated.
1. Introduction
Several countries are moving toward carbon neutrality to mitigate the negative impacts of greenhouse gas (GHG) emissions and climate change. The Japanese government aims for carbon neutrality and supports the development of various new technologies that can reduce CO2 emissions. The transportation sector contributed to approximately 17.7% of all domestic CO2 emissions in 2020 [1]. Hence, there is growing demand for measures to reduce these emissions.
A remedial measure under consideration is the introduction of clean energy vehicles (CEVs), such as hybrid electric vehicles (HEVs), plug-in hybrid electric vehicles (PHEVs), battery electric vehicles (BEVs), and fuel cell vehicles (FCVs). However, each type of CEV has strengths and weaknesses. In addition to CO2 emission rates, they also differ in terms of purchase costs, fuel costs, additional infrastructure development costs, and other factors. Thus, widespread adoption of a single type of vehicle is not necessarily optimal. Although a certain vehicle type may be superior in one aspect, it may be inferior in other characteristics. Therefore, to create an effective policy to introduce CEVs, it is necessary to consider an optimal portfolio combining gasoline vehicles (GVs) and CEVs, along with multiple indicators such as CO2 emissions, costs, and other metrics. The portfolio of vehicles means the composition of the number of vehicles sold by vehicle type.
Ichinohe and Endo [2] and Yeh et al. [3] have used the linear programming model (MARKAL energy system model) to calculate passenger vehicle portfolios that minimize the total energy system cost under the constraint of the target CO2 emission rates in Japan and the United States, respectively. Yamada and Hondo [4] set fuel and vehicle purchase costs as constraints to construct a domestic passenger vehicle portfolio generating the lowest achievable life cycle CO2. The authors examined CO2 emissions from the vehicle production and disposal stages in addition to the energy production stage (well-to-tank) and the driving stage (tank-to-wheel). Arimori and Nakano [5] and Romejko and Nakano [6] set the total of vehicle purchase, fuel, and infrastructure costs as the objective function with oil consumption and CO2 emissions as constraints when calculating the optimal portfolios for passenger vehicles, trucks, and buses in Japan and Poland, respectively. The authors focused on energy security based on oil dependence in the transportation sector. These previous studies [4,5,6] have also used the linear programming model.
The focus of previous studies remained on the energy sources used by vehicles and their CO2 emissions. Nevertheless, these studies did not consider the sustainability of metal resources, such as copper. Part compositions differ between GVs and CEVs. Consequently, the types and amounts of metal resources required to produce GVs and CEVs also differ. For example, large amounts of copper are used in BEV lithium-ion batteries and motor windings. Therefore, the demand for these metal resources is expected to increase in the future. In other words, there is a trade-off between reduction in CO2 emissions and consumption of metal resources. Furthermore, the primary supply of copper and other metals remains uncertain due to the reserve-to-production ratios and uneven distribution of ore-producing countries and regions.
Kato et al. [7] have used linear programming to calculate optimal passenger vehicle portfolios in six regions (OECD North America, OECD Europe, OECD Pacific, China, India, and All Other). The authors analyzed the case for minimizing the consumption of copper under the constraints of the CO2 emissions reduction targets. The authors focused on copper demand but did not consider copper supply availability, including recycling. The global demand for copper is expected to increase as CEVs become more widely used, and copper supply shortages may become a real problem. Primary copper resource supply is insecure, hence copper sustainability must be considered in terms of secondary resource supply from recycling. Thus, it is necessary to develop an optimization model that integrates costs, CO2 emissions, and metal supply and demand.
While not examining the optimal portfolio of GVs and CEVs, several studies have forecasted the demand for metal resources and estimated the amount of recycling. Habib et al. [8] used an S-curve to estimate the number of HEVs, PHEVs, and BEVs and future demand for metal resources, such as copper and rare metals, in five global regions. Similarly, Li et al. [9] and Shi [10] used the Bass model to estimate the future demand for rare-earth elements and cobalt, respectively, in China. Yano et al. [11] estimated the number of end-of-life vehicles (ELVs) among passenger HEVs and the recycling potential of rare earth elements in Japan, while Li et al. [12,13] estimated ELVs in China and the amount of recyclable nonferrous metals and plastic, respectively. However, these studies focused on specific vehicle type and did not consider the impact of recycling on supply constraints. The authors focused only on metal resources and did not consider other factors such as CO2 emissions and costs. Each CEV type should be considered for implementation from multiple perspectives.
These findings demonstrate the need for strategies and policies that consider metal resources recycling and supply constraints in addition to other factors such as CO2 emissions during CEV promotion. In this study, we focus on copper since the demand is expected to increase with the spread of CEVs in the future. It is also widely used as a base metal in industries other than the automotive industry, which could lead to a supply-demand crunch. Moreover, the estimated reserves-to-production ratio is relatively short, at approximately 40 years [14].
For these reasons, we propose a new model that optimizes portfolios by considering copper demand and supply, including copper recycling, social system costs (vehicle purchase, energy consumption, and infrastructure costs), and CO2 emissions in the process of introducing CEVs. This study aims to analyze the optimal portfolio for domestic passenger vehicles and the assumed effects of copper recycling and usage reduction. Passenger GVs, HEVs, PHEVs, BEVs, and FCVs were considered in this study.
Section 2 describes the innovative optimization model. Section 3 elaborates on the various preconditions for the optimization model. Section 4 presents the portfolio calculation results generated by the optimization model and explains the differences between portfolios and the amount of recycled and consumed copper due to changes in recycling and usage reduction rates. In addition, the quantitative analysis results for the effects of copper recycling and usage reduction are presented by comparing the social system costs in each case. Section 5 presents the conclusions of this study and discusses future prospects based on the discoveries made herein.
2. Optimization Model
2.1. Framework
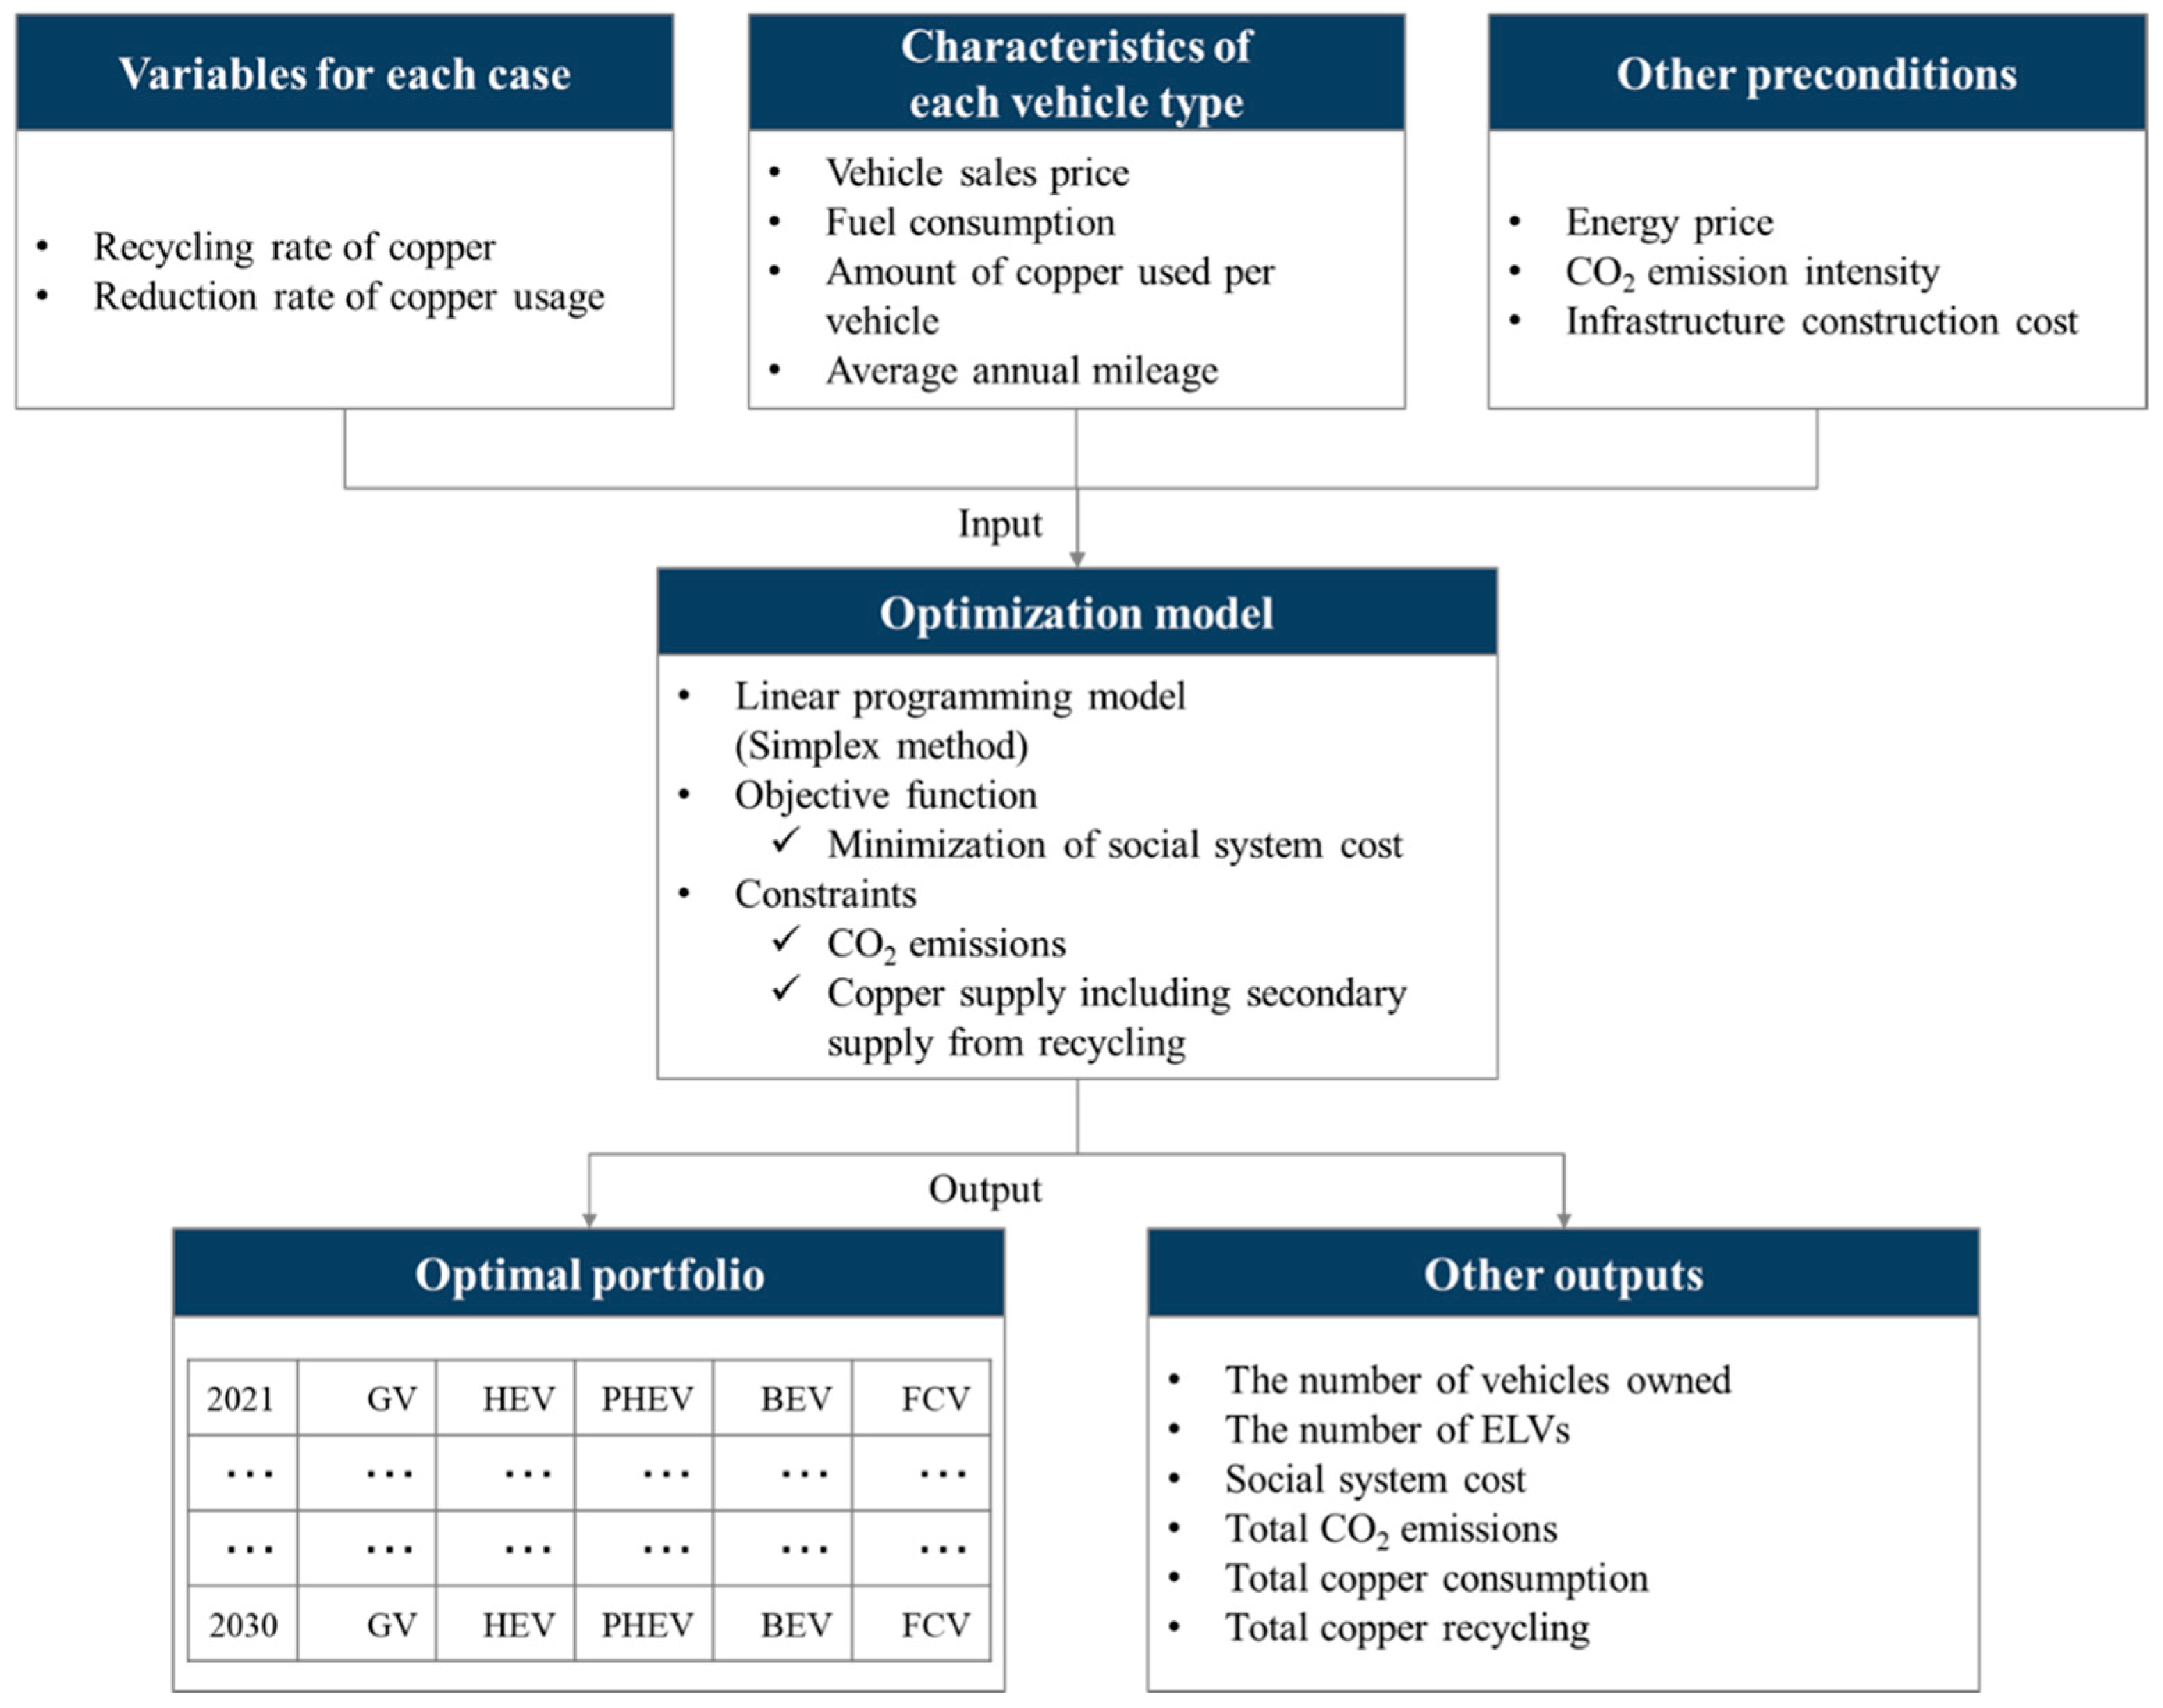
In this study, we developed an optimization model that considers costs, CO2 emissions, and copper supply and demand, including recycling. Figure 1 shows an overview of the optimization model constructed herein. The input consisted of the characteristics of each vehicle type and other prerequisite data. Furthermore, the impact could be analyzed by inputting the recycling and usage reduction rates for each case. The output was the optimal number of new vehicles of each type sold in each target year. The number of vehicles owned, the number of ELVs, CO2 emissions, amount of copper consumed and recycled, and social system costs were calculated for each optimal portfolio.
The objective function was set for the social system cost. The optimization problem was then solved using the constraint method with CO2 emissions and the supply of copper as the constraint conditions. Based on the foregoing parameters, “optimal” in this study refers to the following: the social system cost was the lowest when the CO2 emission reduction target was achieved and the demand for copper was lower than or equal to its supply. In the present study, the target area was Japan, while the target years were set between 2021 and 2030. The mathematical formulae of the model are explained below.
Compared with previous studies, this study added new factors to assess copper demand and supply, including recycling. Specifically, copper supply constraint was added to the optimization model, and copper consumption per vehicle, copper recycling rate, and usage reduction rate were added to the inputs.
2.2. Objective Function
The objective function is defined as the social system cost, which is the sum of the vehicle purchase cost, energy consumption cost associated with fuel use while driving, and cost of building new infrastructure, such as charging stations. The calculation was performed using Equation (1).
where i is the vehicle type [GV, HEV, PHEV, BEV, FCV]; j is the energy source [gasoline, electricity, hydrogen]; t is the target year [2021–2030]; k is the vehicle age; SCt is the social system cost in year t [Yen]; Xit is the sale of a new vehicle type i in year t [Units]; Sit is the number of vehicle types i owned in year t [Units]; Pit is the sales price of vehicle type i in year t [Yen]; FCit is the average fuel consumption of vehicle type i in year t [MJ/km]; EPjt is the price of energy j in year t [Yen/MJ]; AM is the annual average mileage [km]; ICit is the additional infrastructure construction cost for each vehicle type i in year t [Yen/Unit], and ELVikt is the number of ELVs for each vehicle type i with k years of age in year t [Units].
The Weibull distribution was used to calculate the number of ELVs. The cumulative retirement probability based on the Weibull distribution is expressed in Equation (3). The survival probability is 1 minus the distribution function in Equation (3). Also, the shape parameter m and scale parameter η were set to be 2.59 and 14.44, respectively, from Osawa [15]. These parameters were estimated to minimize the sum of squares of the errors between the estimated survival probability and the actual survival rate in 2020. The actual survival rate in 2020 was calculated from the number of units sold in the year of registration and the number of units remaining in 2020 according to the existing literature [16]. The number of units remaining represents the number of units sold in each registration year that had not been retired by 2020. In addition, ELVs can be calculated using Equation (4).
where m is shape parameter (m > 0); η is scale parameter (η > 0); Wkt is the cumulative retirement probability of vehicle with k years of age in year t [%], and Xikt is the sales of new vehicle type i in year t-k [Units].
2.3. Constraint Conditions
2.3.1. CO2 Emissions
CO2 emissions were set as the constraint in this study, as shown in Equations (5) and (6). The CO2 emissions reduction target was set based on the Sixth Strategic Energy Plan of the Agency for Natural Resources and Energy [17].
where t0 is the base year [2013]; TCt are the CO2 emissions in year t [t-CO2]; CUit is the CO2 emission intensity of vehicle type i in year t [g-CO2/MJ], and EGt is the CO2 emission reduction rate target in year t [%].
2.3.2. Copper Supply
Copper supply was set as a constraint in this study. Specifically, the constraint was set such that the demand for copper was less than or equal to the supply, as shown in Equations (7) and (8). The formula for estimating the amount of copper recycled was established with reference to previous research [18].
where BCit is the copper consumption per vehicle type i in year t [g/Unit]; PSt is the primary supply of copper in year t [kg]; TRt is the total amount of copper recycled in year t [kg]; VRt is the recovery rate of ELVs in year t [%], and BRt is the recycle rate of copper in year t [%].
3. Preconditions
3.1. New Vehicle Sales and Vehicle Sales Price
The total number of new passenger vehicles sold after 2021 was assumed to be proportional to Japan’s population. The number of new passenger vehicles sold between 2021 and 2030 was set based on reference materials [19,20]. Furthermore, the sales volume of each vehicle type in the past (1993–2020), the premise for calculating the number of ELVs, was set based on the existing literature [19].
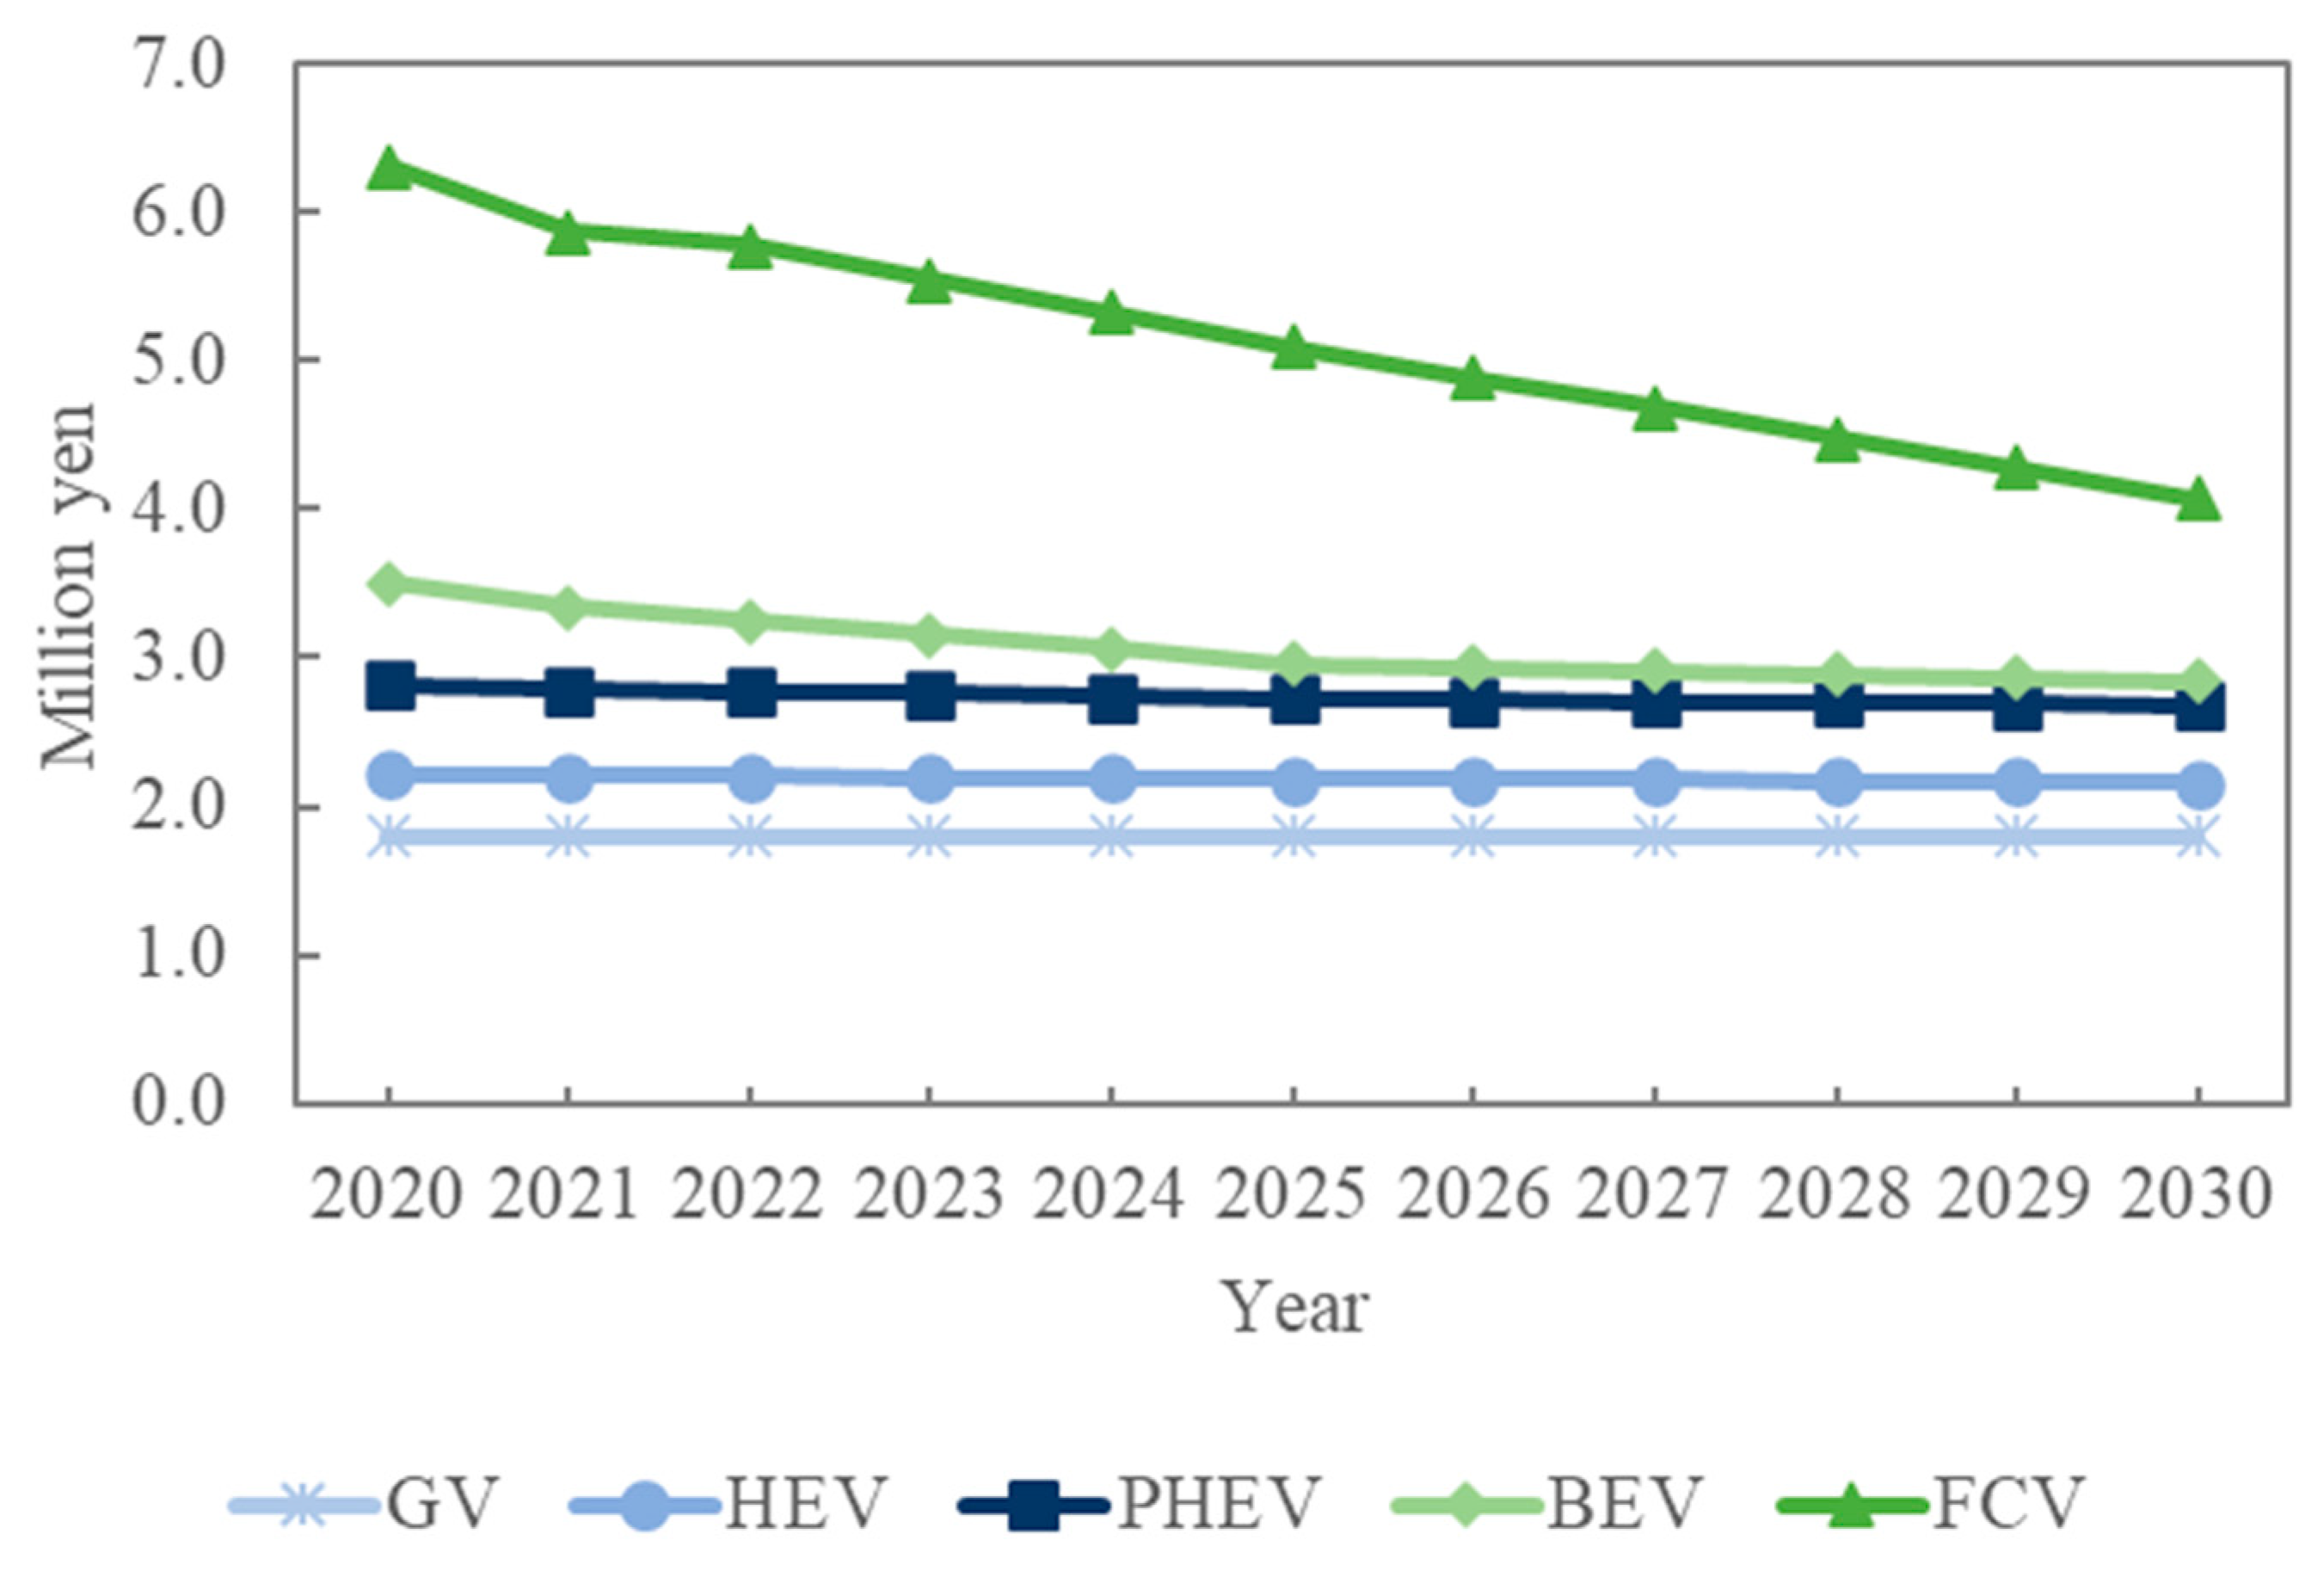
According to Kimura [21], the GV sales price is set at 1.8 million yen. The differences in part composition between GVs and HEVs, PHEVs, and BEVs and their amounts were also set based on previous studies [21,22,23]. Then, the sales prices of HEVs, PHEVs, and BEVs were set by multiplying the amount of increase or decrease in parts by the producer price freight rate and commercial margin rate [24] and adding or subtracting it to the GV sales price. For FCVs, the sales price was set by multiplying the shipment value in the literature [25] by the producer price freight rate and commercial margin rate [24]. For years with insufficient data, such as 2026–2029, prices were estimated by assuming a change equivalent to the average annual change in the preceding and following years. Figure 2 presents the results of the preceding estimates.
3.2. Fuel Consumption
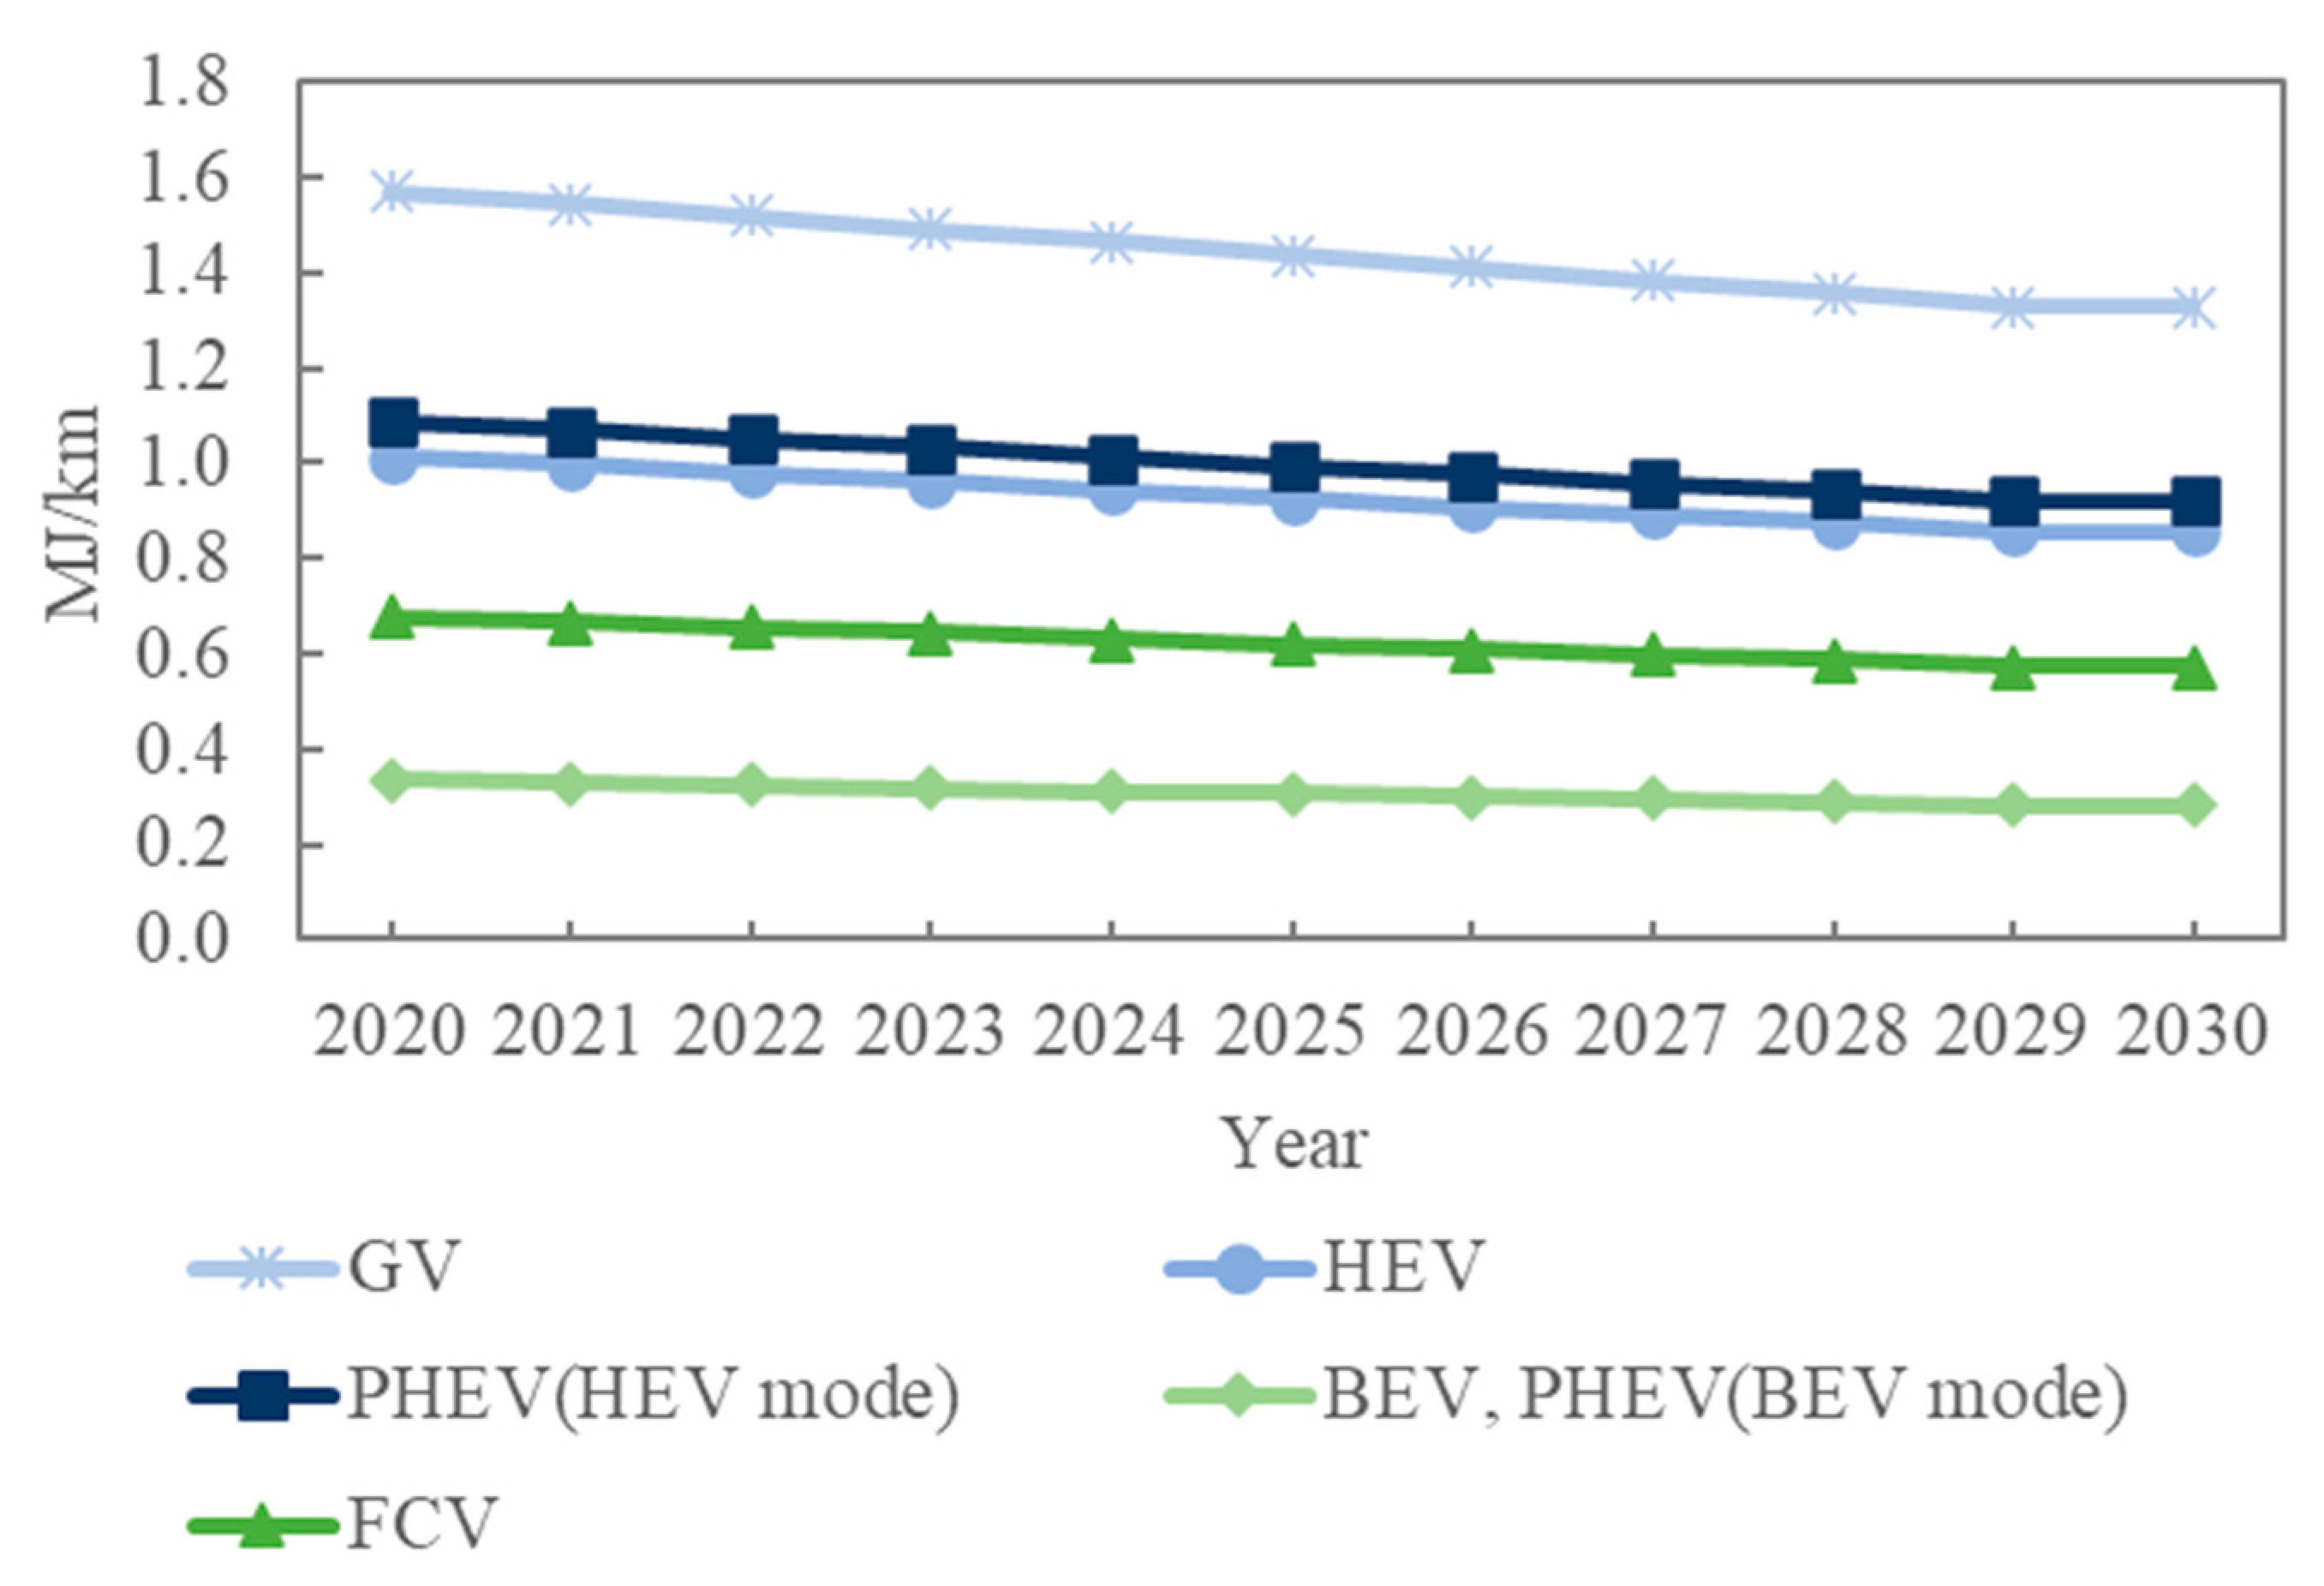
The fuel consumption rates for passenger vehicles sold in 2013 and 2020 were derived from the Ministry of Land, Infrastructure, Transport, and Tourism [26]. The fuel consumption of passenger vehicles sold in 2030 was based on the standard fuel consumption value reported by the Automobile Fuel Economy Standards Subcommittee [27]. CEV fuel consumption was determined by multiplying the foregoing values by the ratio of each CEV to GV fuel consumption per km tank-to-wheel [28]. Figure 3 shows the changes in fuel consumption for each vehicle type. The fuel economy between 2021 and 2029 was estimated assuming improvement as per the average change per year between 2020 and 2030.
Furthermore, the average fuel consumption of owned vehicles in the target year was calculated from the weighted average of the fuel consumption of sold vehicles in the target year and the average fuel consumption of owned vehicles in the previous year.
3.3. Energy Price
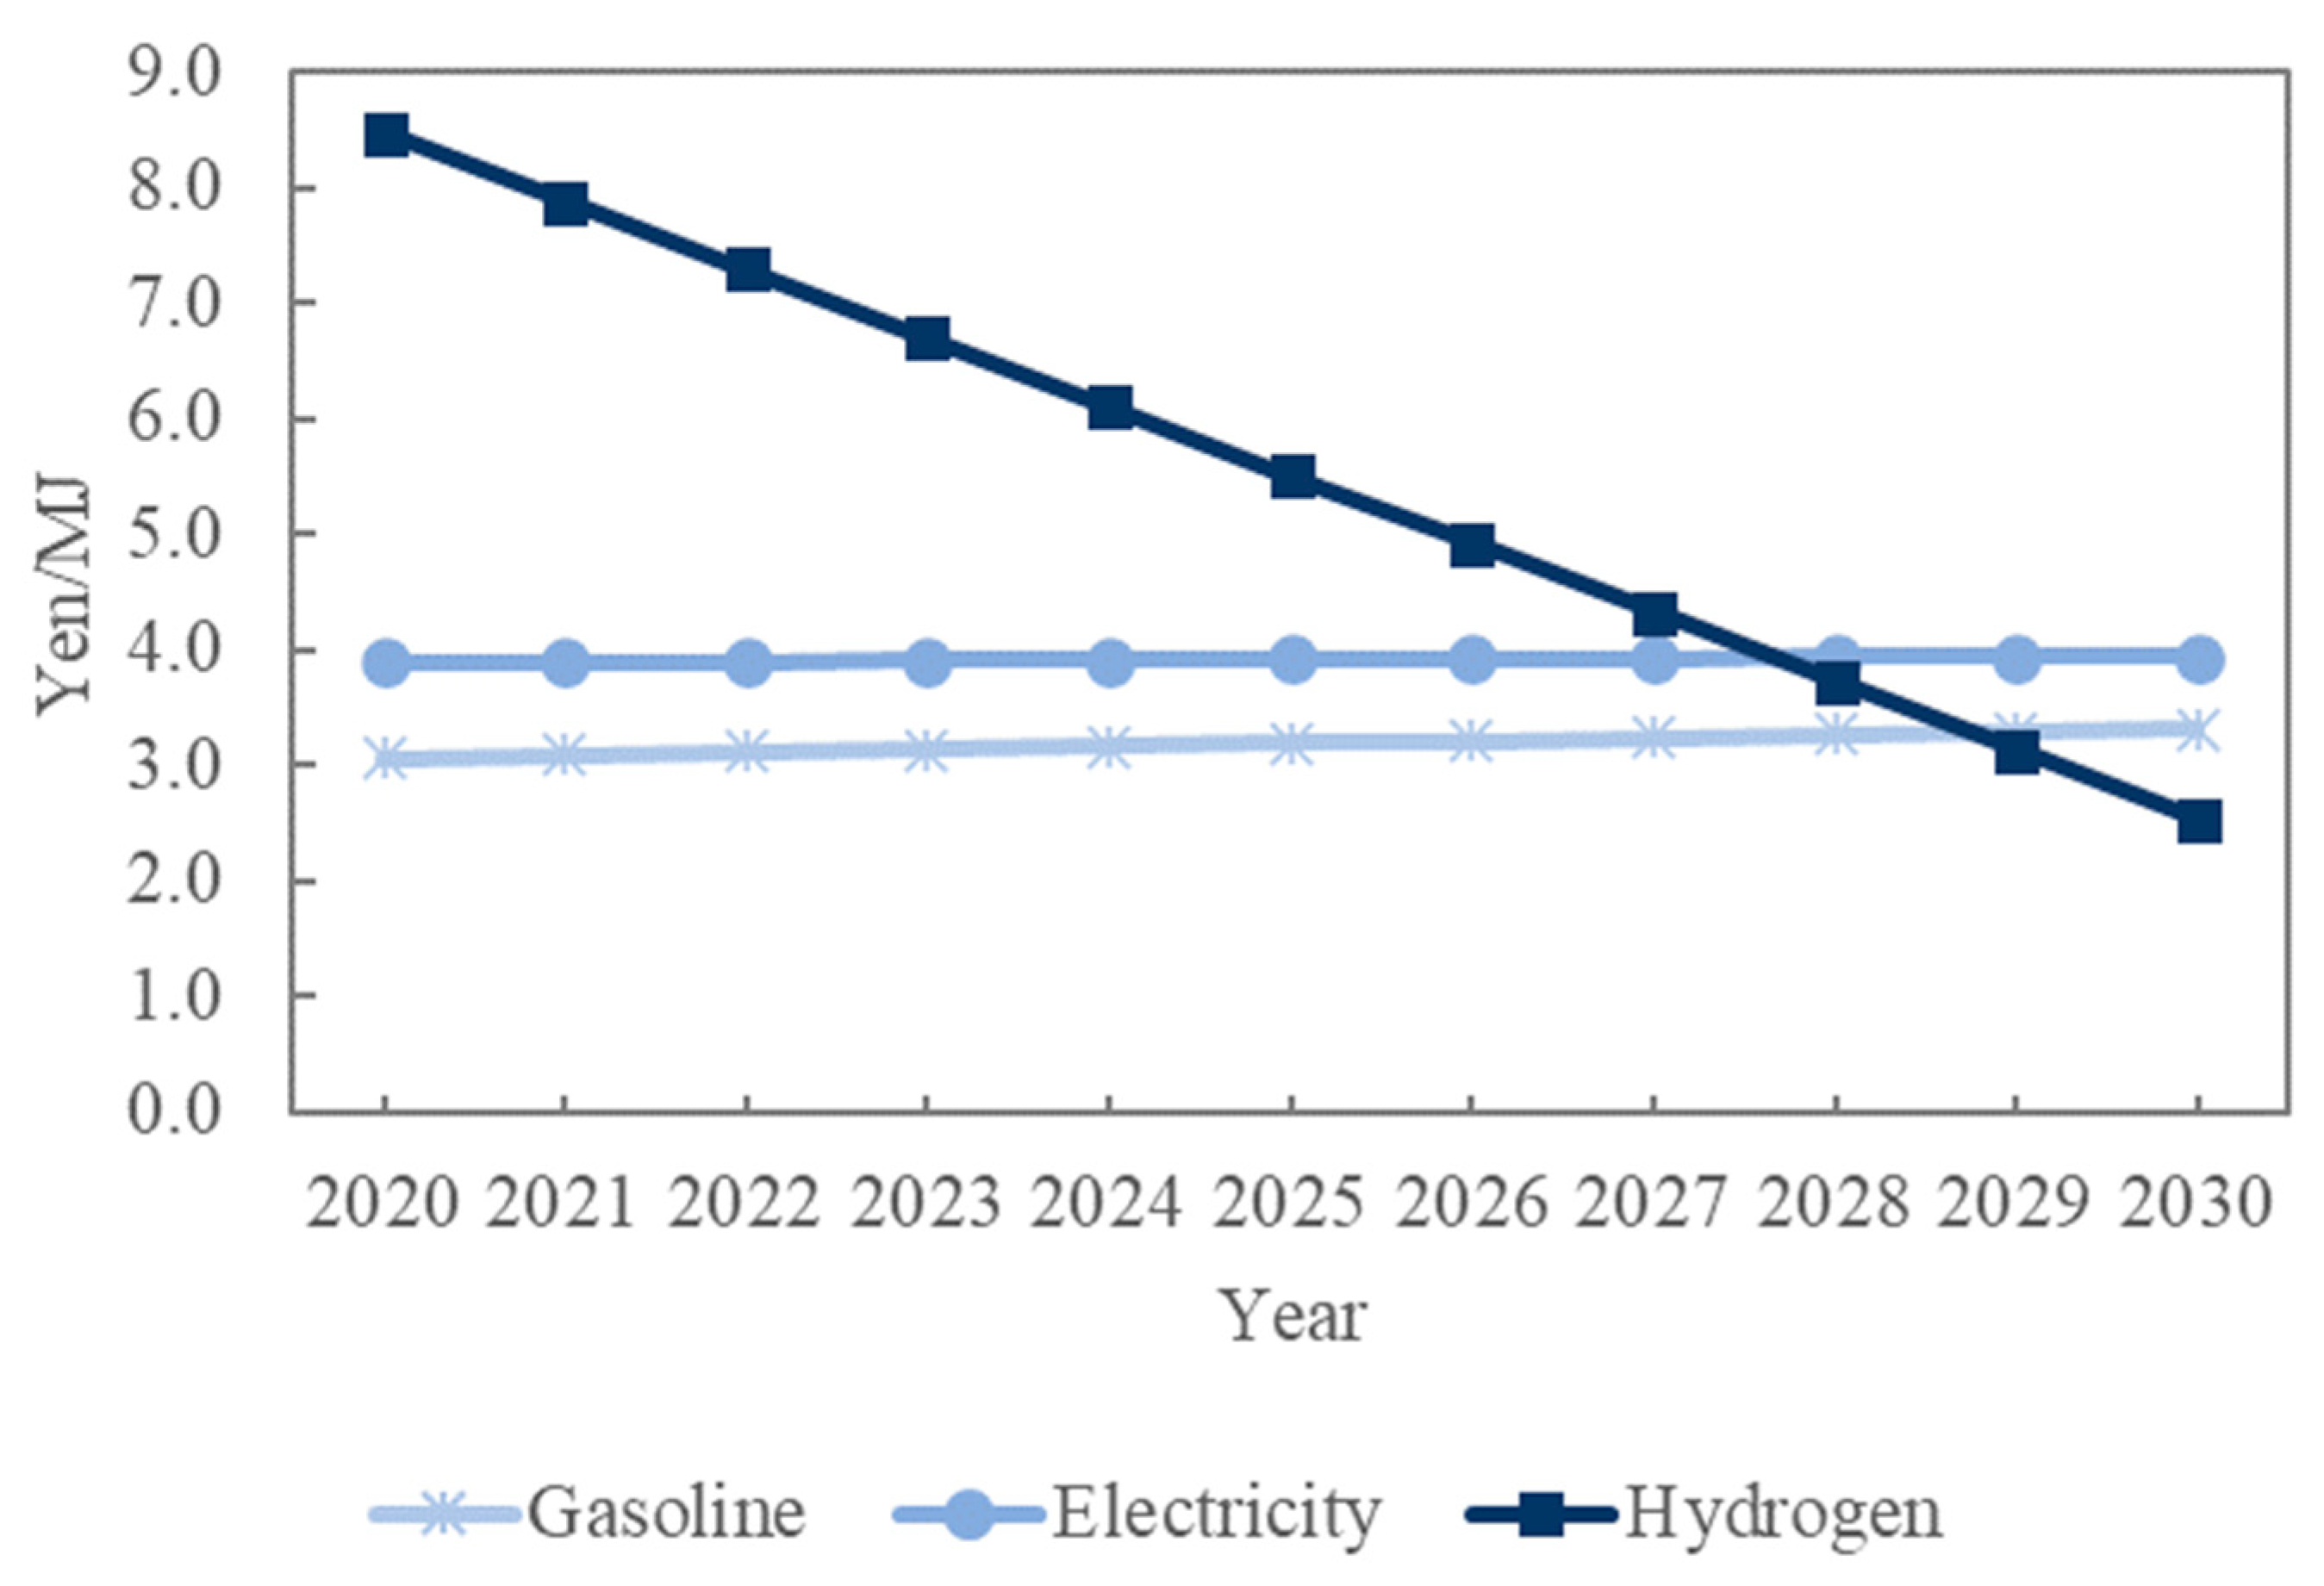
The energy sources were gasoline for the GVs, HEVs, and PHEVs; electricity for the BEVs and PHEVs; hydrogen for the FCVs.
According to previous reports [5,29], the price of gasoline was calculated by adding petroleum, coal, and volatile oil taxes and refining and distribution margins to the crude oil price. Crude oil price was set according to the case reported in the Sustainable Development of the IEA’s World Energy Outlook [30]. The electricity prices were set according to the Central Research Institute of Electric Power Industry [31]. The hydrogen supply price was set in accordance with the Agency for Natural Resources and Energy [32].
Figure 4 shows the price changes for each energy source. Energy prices between 2021 and 2029 were estimated based on the assumption that they will change by the average amount of change per year between 2020 and 2030.
3.4. CO2 Emission Intensity
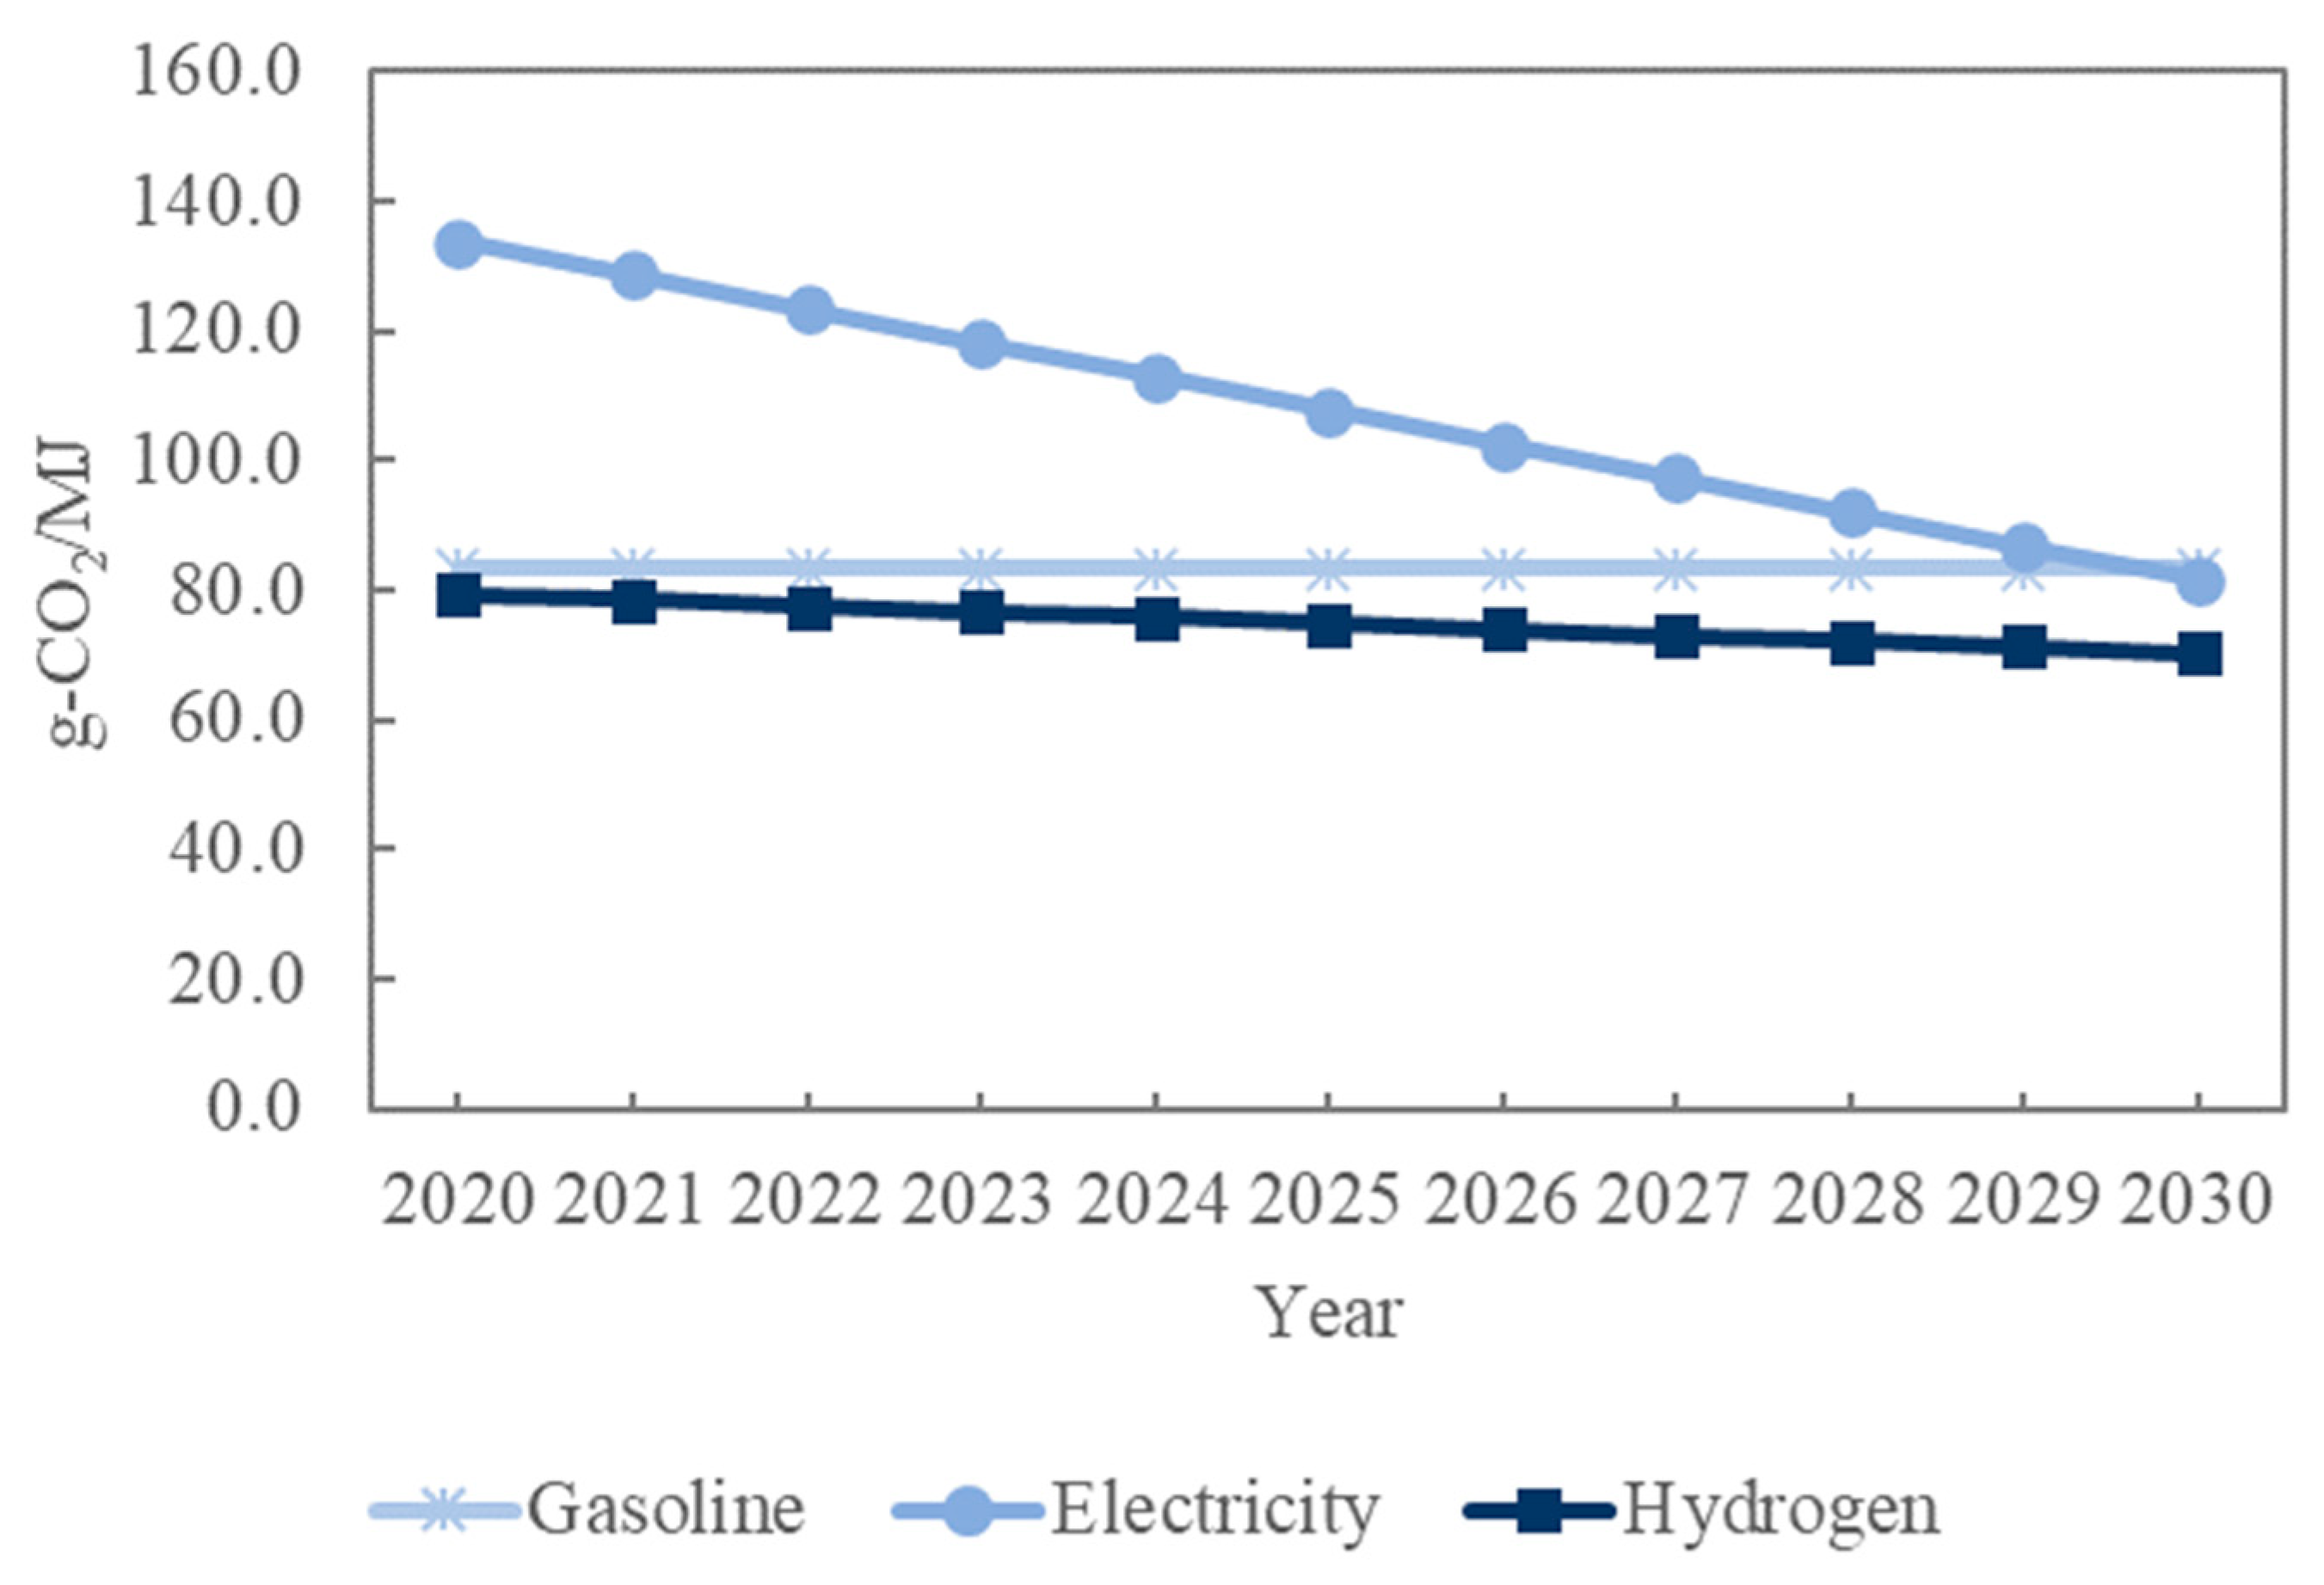
This study considers CO2 emissions during both the automobile driving and energy source production stages. The CO2 emission intensity at the vehicle driving stage (tank-to-wheel) was obtained from a previous study [33]. According to the PHEV, electricity is used when the vehicle is operated in BEV mode, while gasoline is used when the vehicle is operated in HEV mode. Furthermore, CO2 emission intensity at the energy production stage (well-to-tank) was estimated as previously described [17,28,34,35,36,37]. The CO2 emission intensity at the well-to-wheel was estimated from the sum of well-to-tank and tank-to-wheel CO2 emission intensities (Figure 5).
3.5. Other Preconditions
The construction cost per charging station for PHEVs and BEVs was set based on previous studies [5]. For PHEVs and BEVs, it was assumed that one regular charger must be installed per vehicle, in addition to a fast charger shared with other vehicles. The prices of the fast and regular chargers were assumed to remain the same from year to year. The construction cost per hydrogen station for FCVs was set based on previous research [38]. The infrastructure number required per vehicle was set assuming that supply facilities were sufficient to accommodate the number of GVs. The infrastructure required per vehicle was determined by dividing the number of gas stations in 2020 [39] by the number of GVs owned [40]. Here, it was assumed that new infrastructure will be constructed in response to additional BEV, PHEV, and FCV sales, owing to the insufficient charging and hydrogen stations at this time.
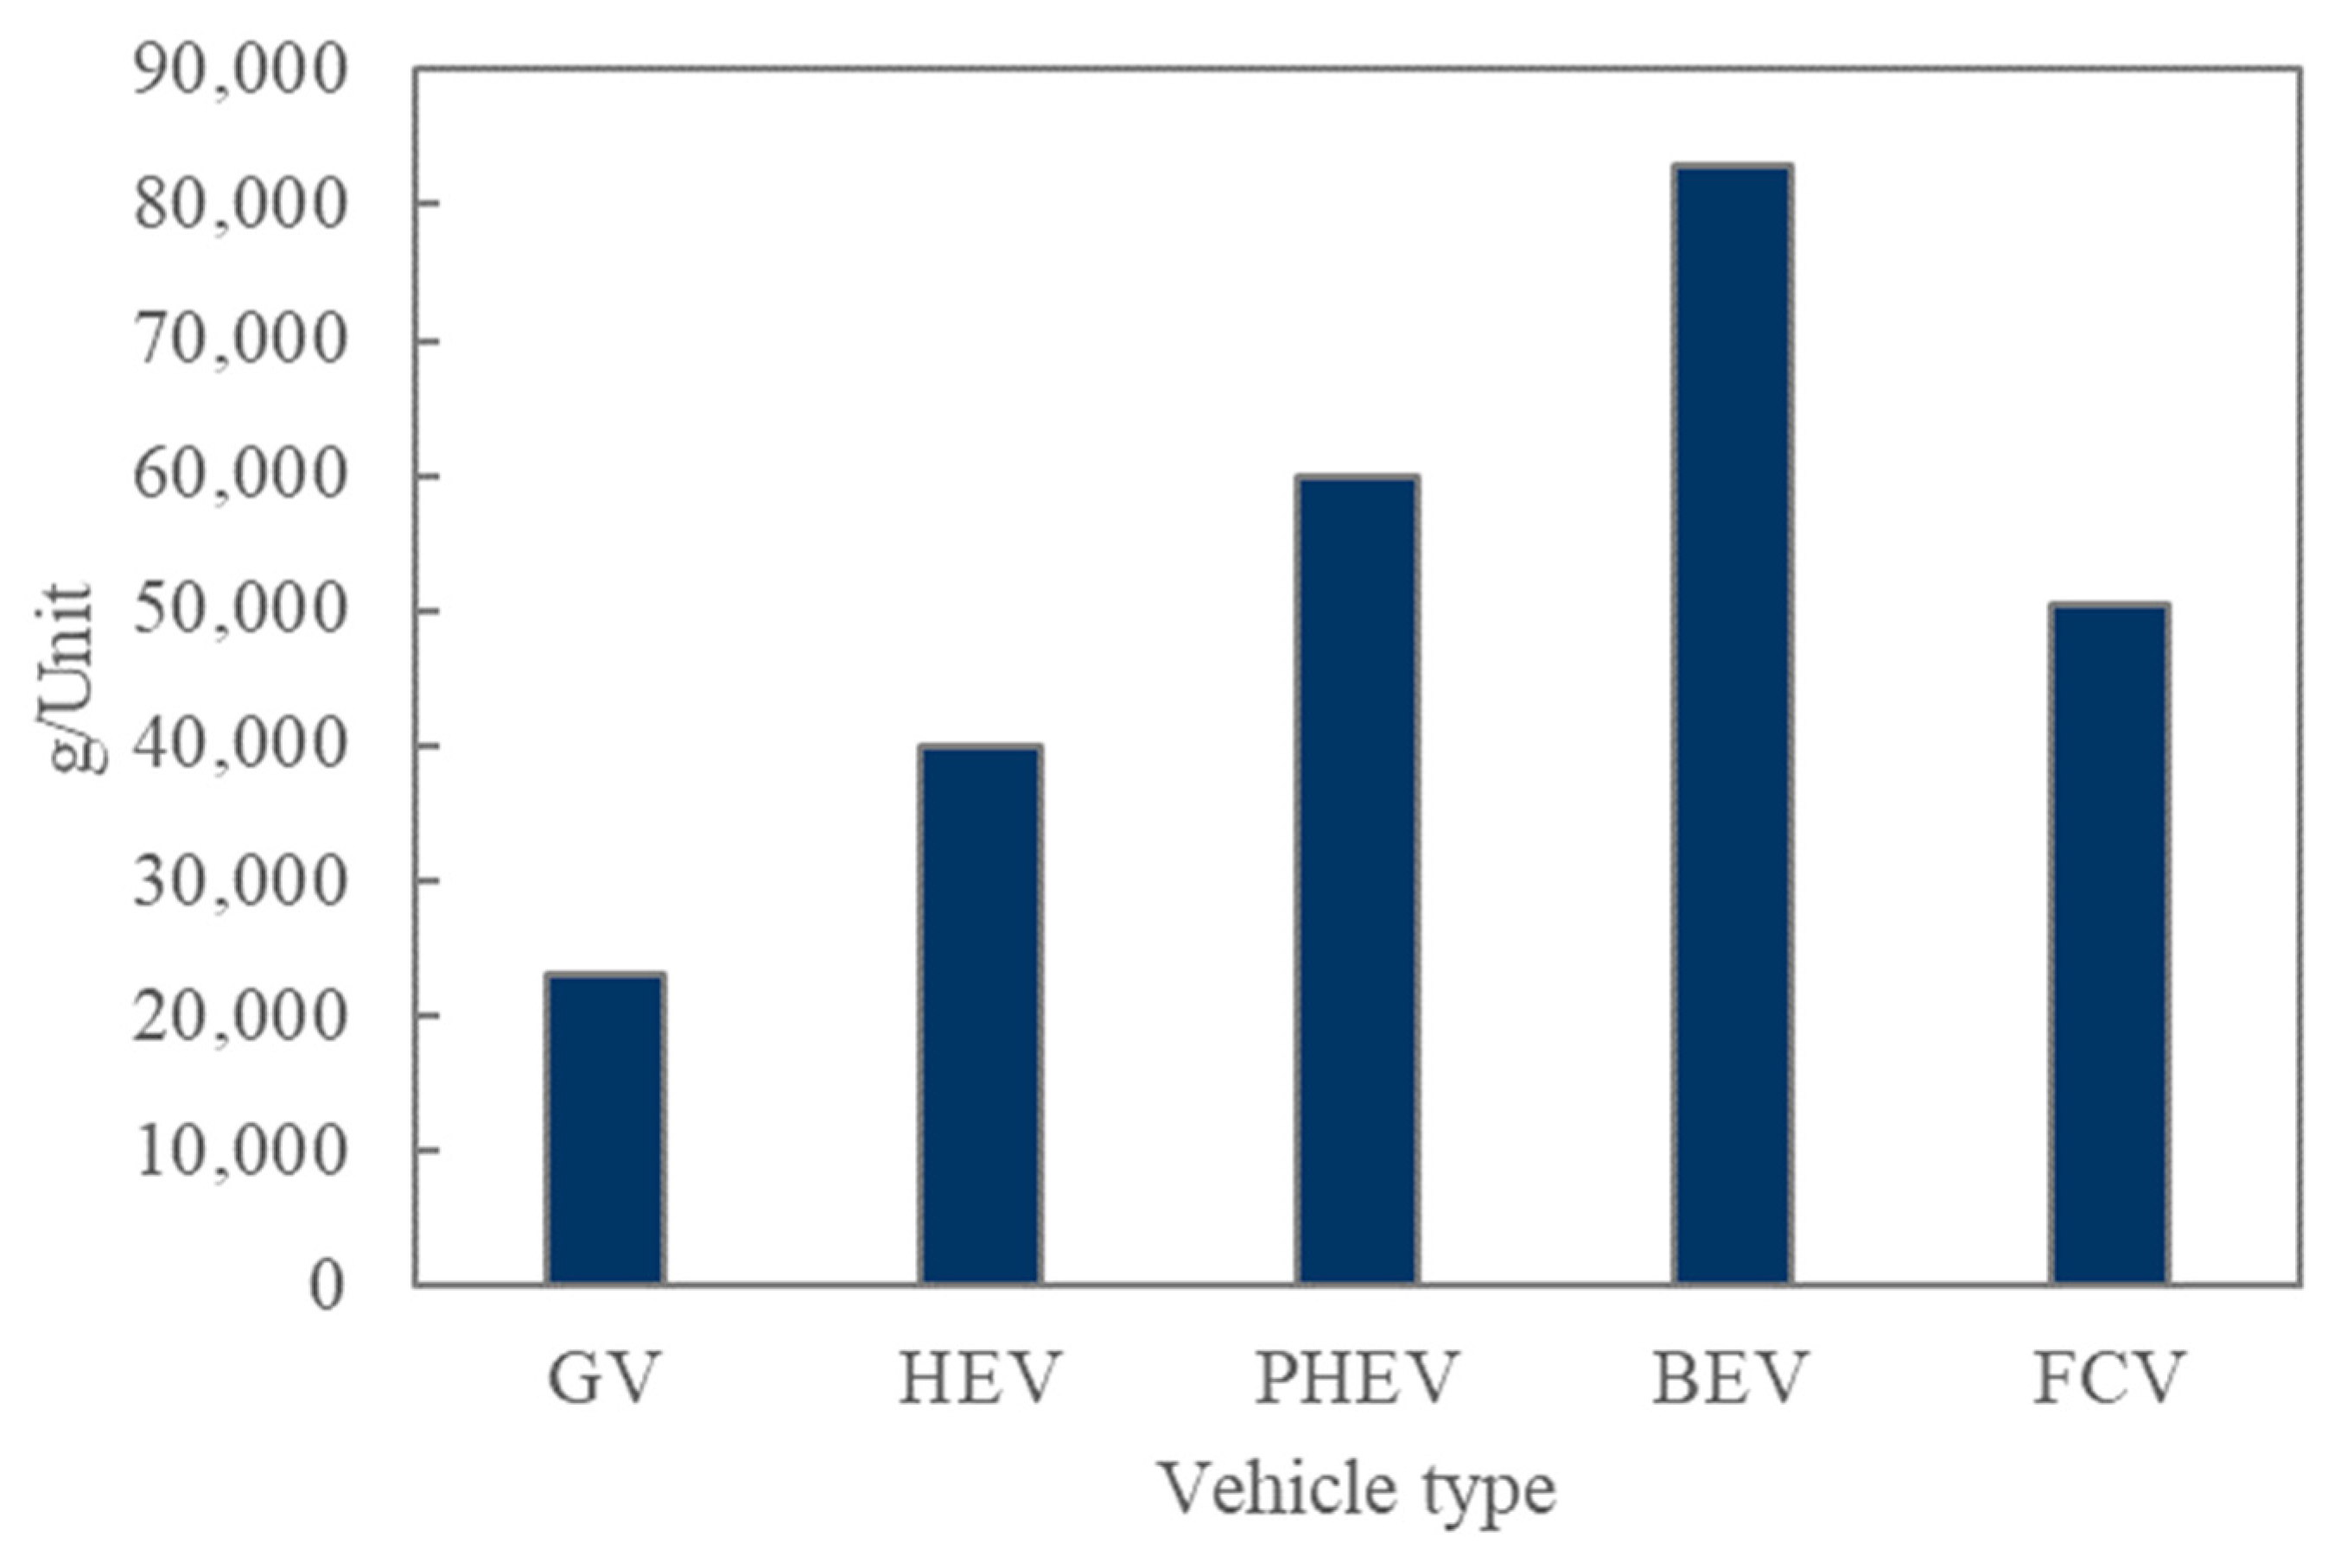
The amount of copper used per vehicle was estimated based on previous findings [41,42], as shown in Figure 6. Copper consumption is expected to increase in electric power and other industries. Therefore, it is unlikely that the passenger vehicle sector share of total primary supply will significantly increase. Primary copper supply to the passenger vehicle sector after 2021 was assumed to be equal to the demand for passenger vehicle sales in 2019.
The average annual mileage was estimated at 9601 km based on data from the Ministry of Land, Infrastructure, Transport, and Tourism [43]. The ratios of the driving modes to the PHEV mileage were set to 50% for BEV driving and 50% for HEV driving in accordance with the Central Research Institute of Electric Power Industry [44].
Not all ELVs are delivered to domestic recyclers, some are exported. Therefore, the average recovery rate from 2011 to 2020 was estimated at approximately 71% based on previous data [45].
In the Sixth Strategic Energy Plan of the Government of Japan [17], Japan’s policy aims for 46% or 50% reduction of GHG emissions by FY2030 compared with the FY2013 level. Although this target is not specific to the transportation sector, the CO2 emission reduction target for 2030 was set to 50% below the 2013 CO2 emissions in this study. The CO2 emission reduction target between 2021 and 2029 was estimated assuming a change equal to the average change per year between 2020 and 2030.
4. Simulation Results
4.1. Scenarios for Copper Recycling and Usage
In the future, copper recycling and reduced copper usage will become important issues owing to the tight supply and demand of copper. Therefore, in this study, cases were set up from two perspectives, namely the recycling rate of copper contained in ELVs and the reduction rate of copper use in newly sold vehicles (Table 1). The recycling rate at present is set at 50% based on a previous study [46]. The next section presents the results of the portfolio calculations for each case and their comparison.
4.2. Optimal Portfolio Calculation
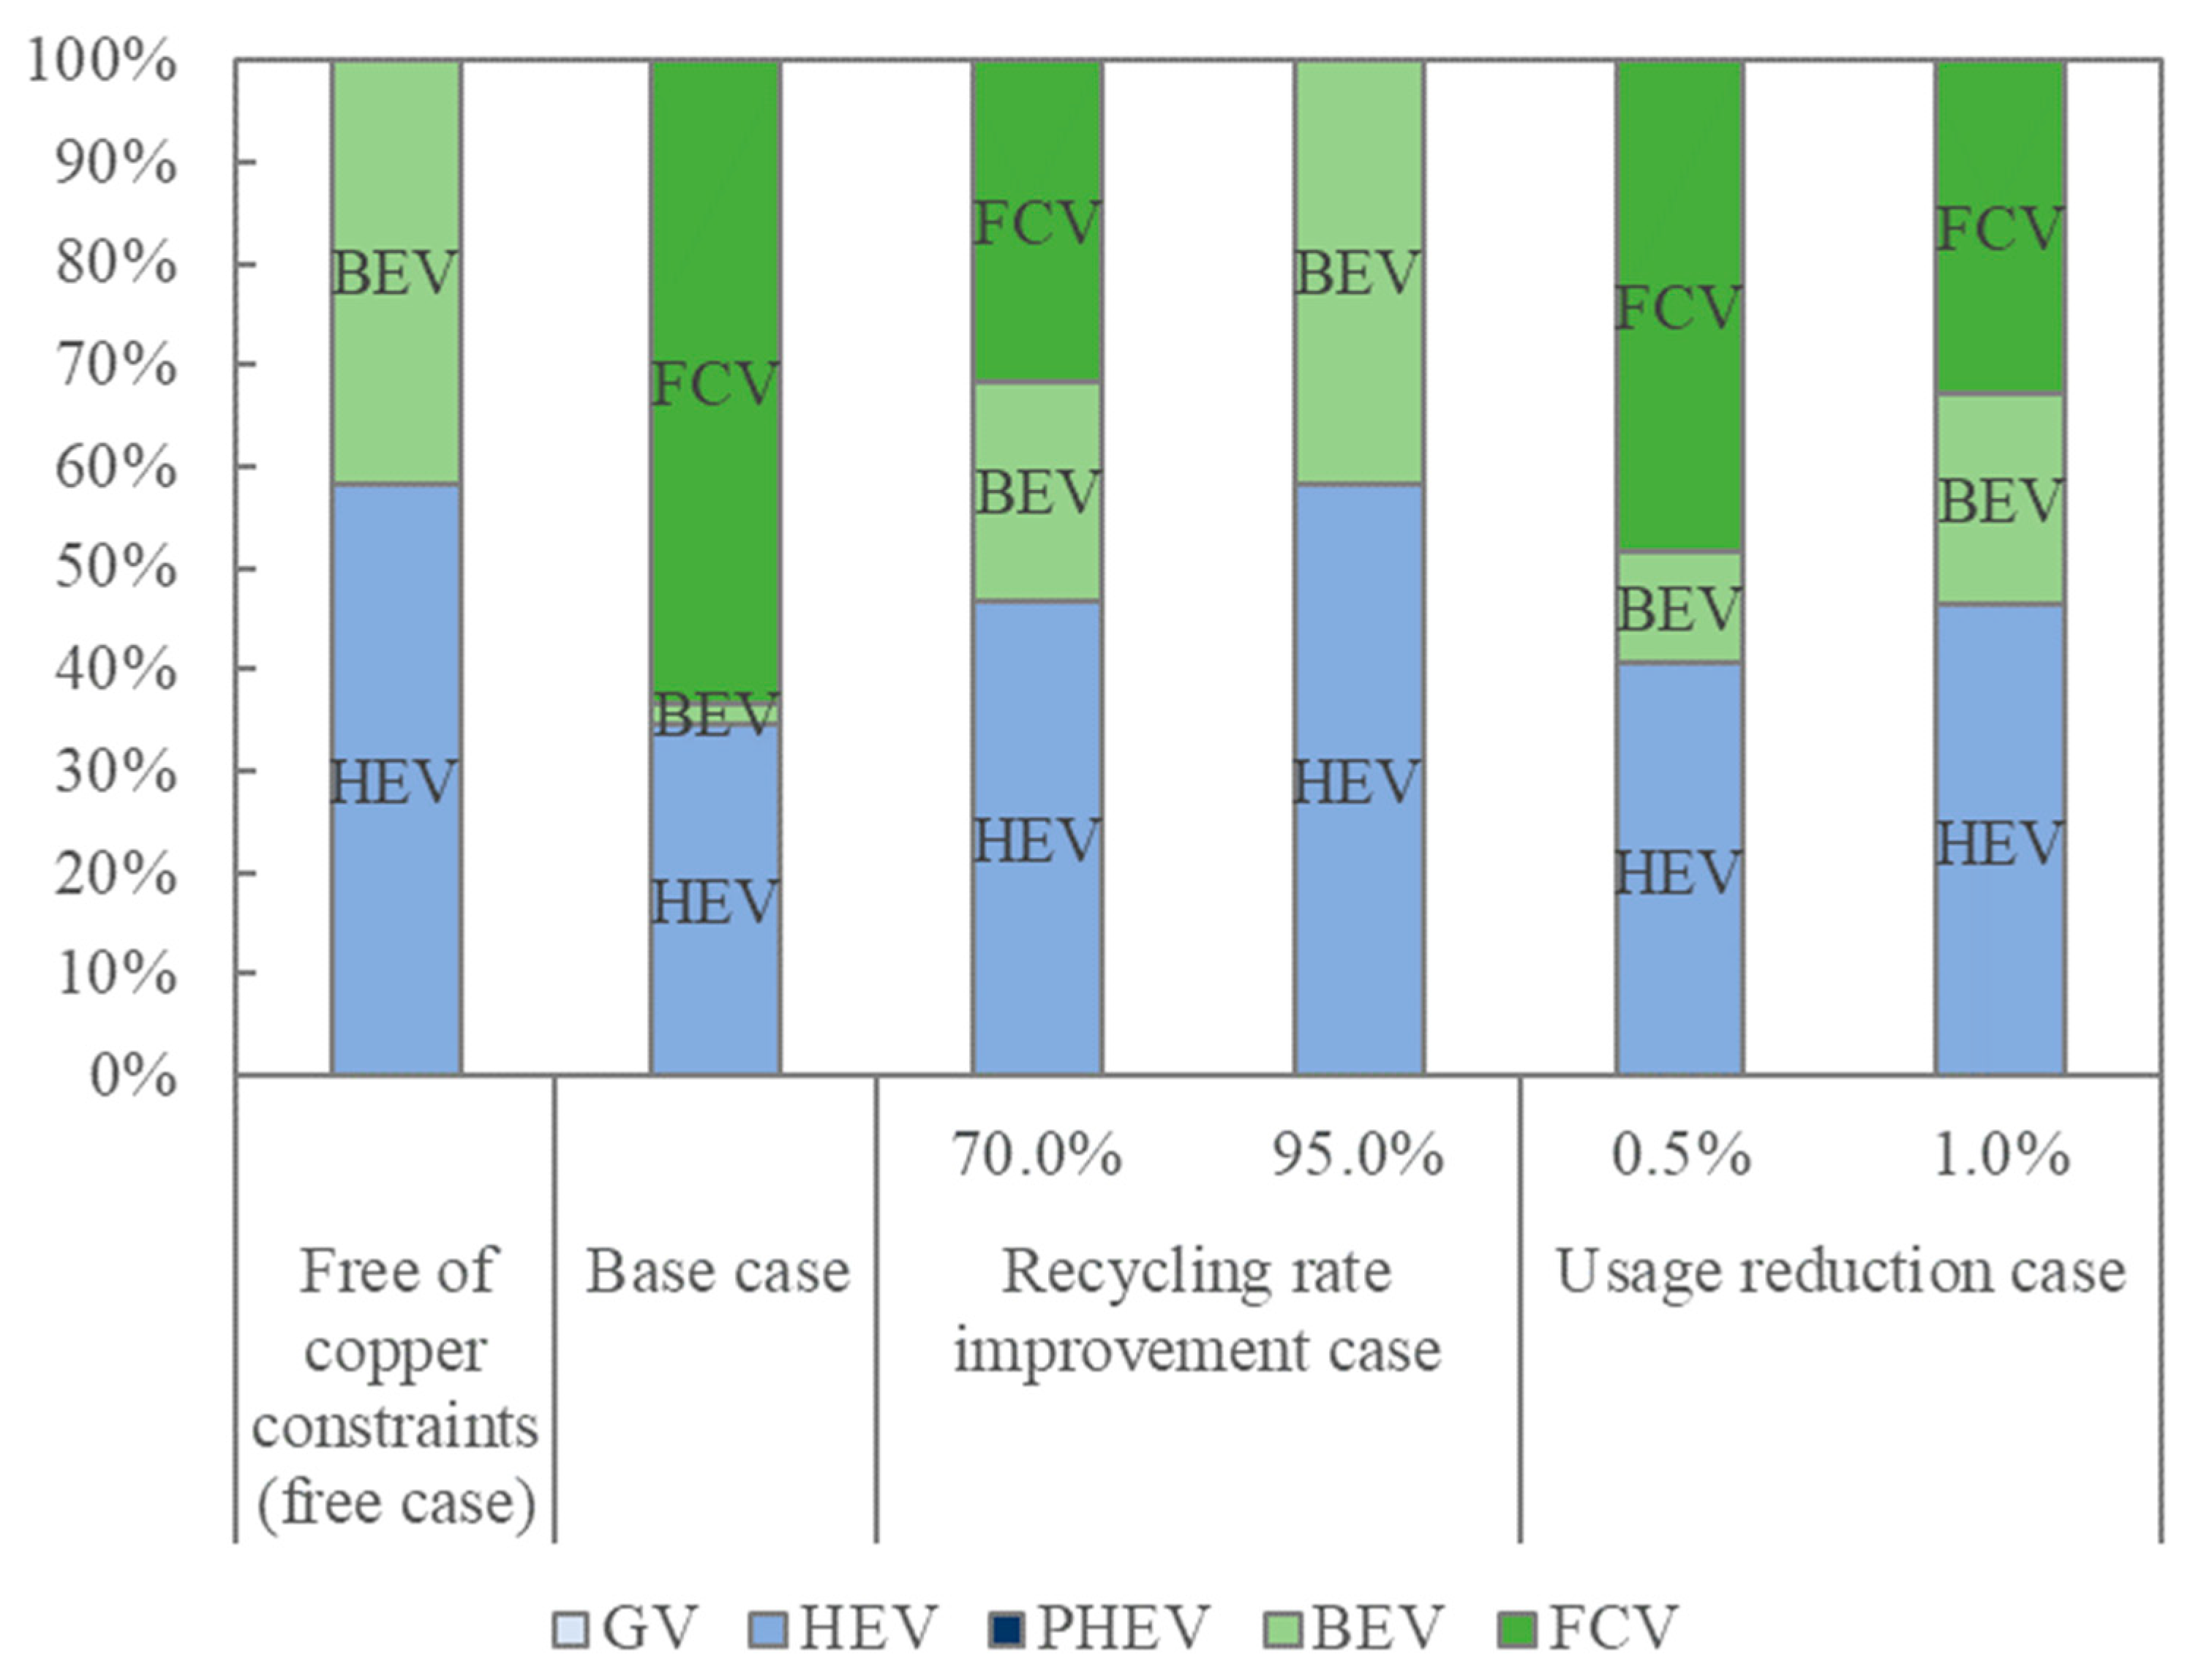
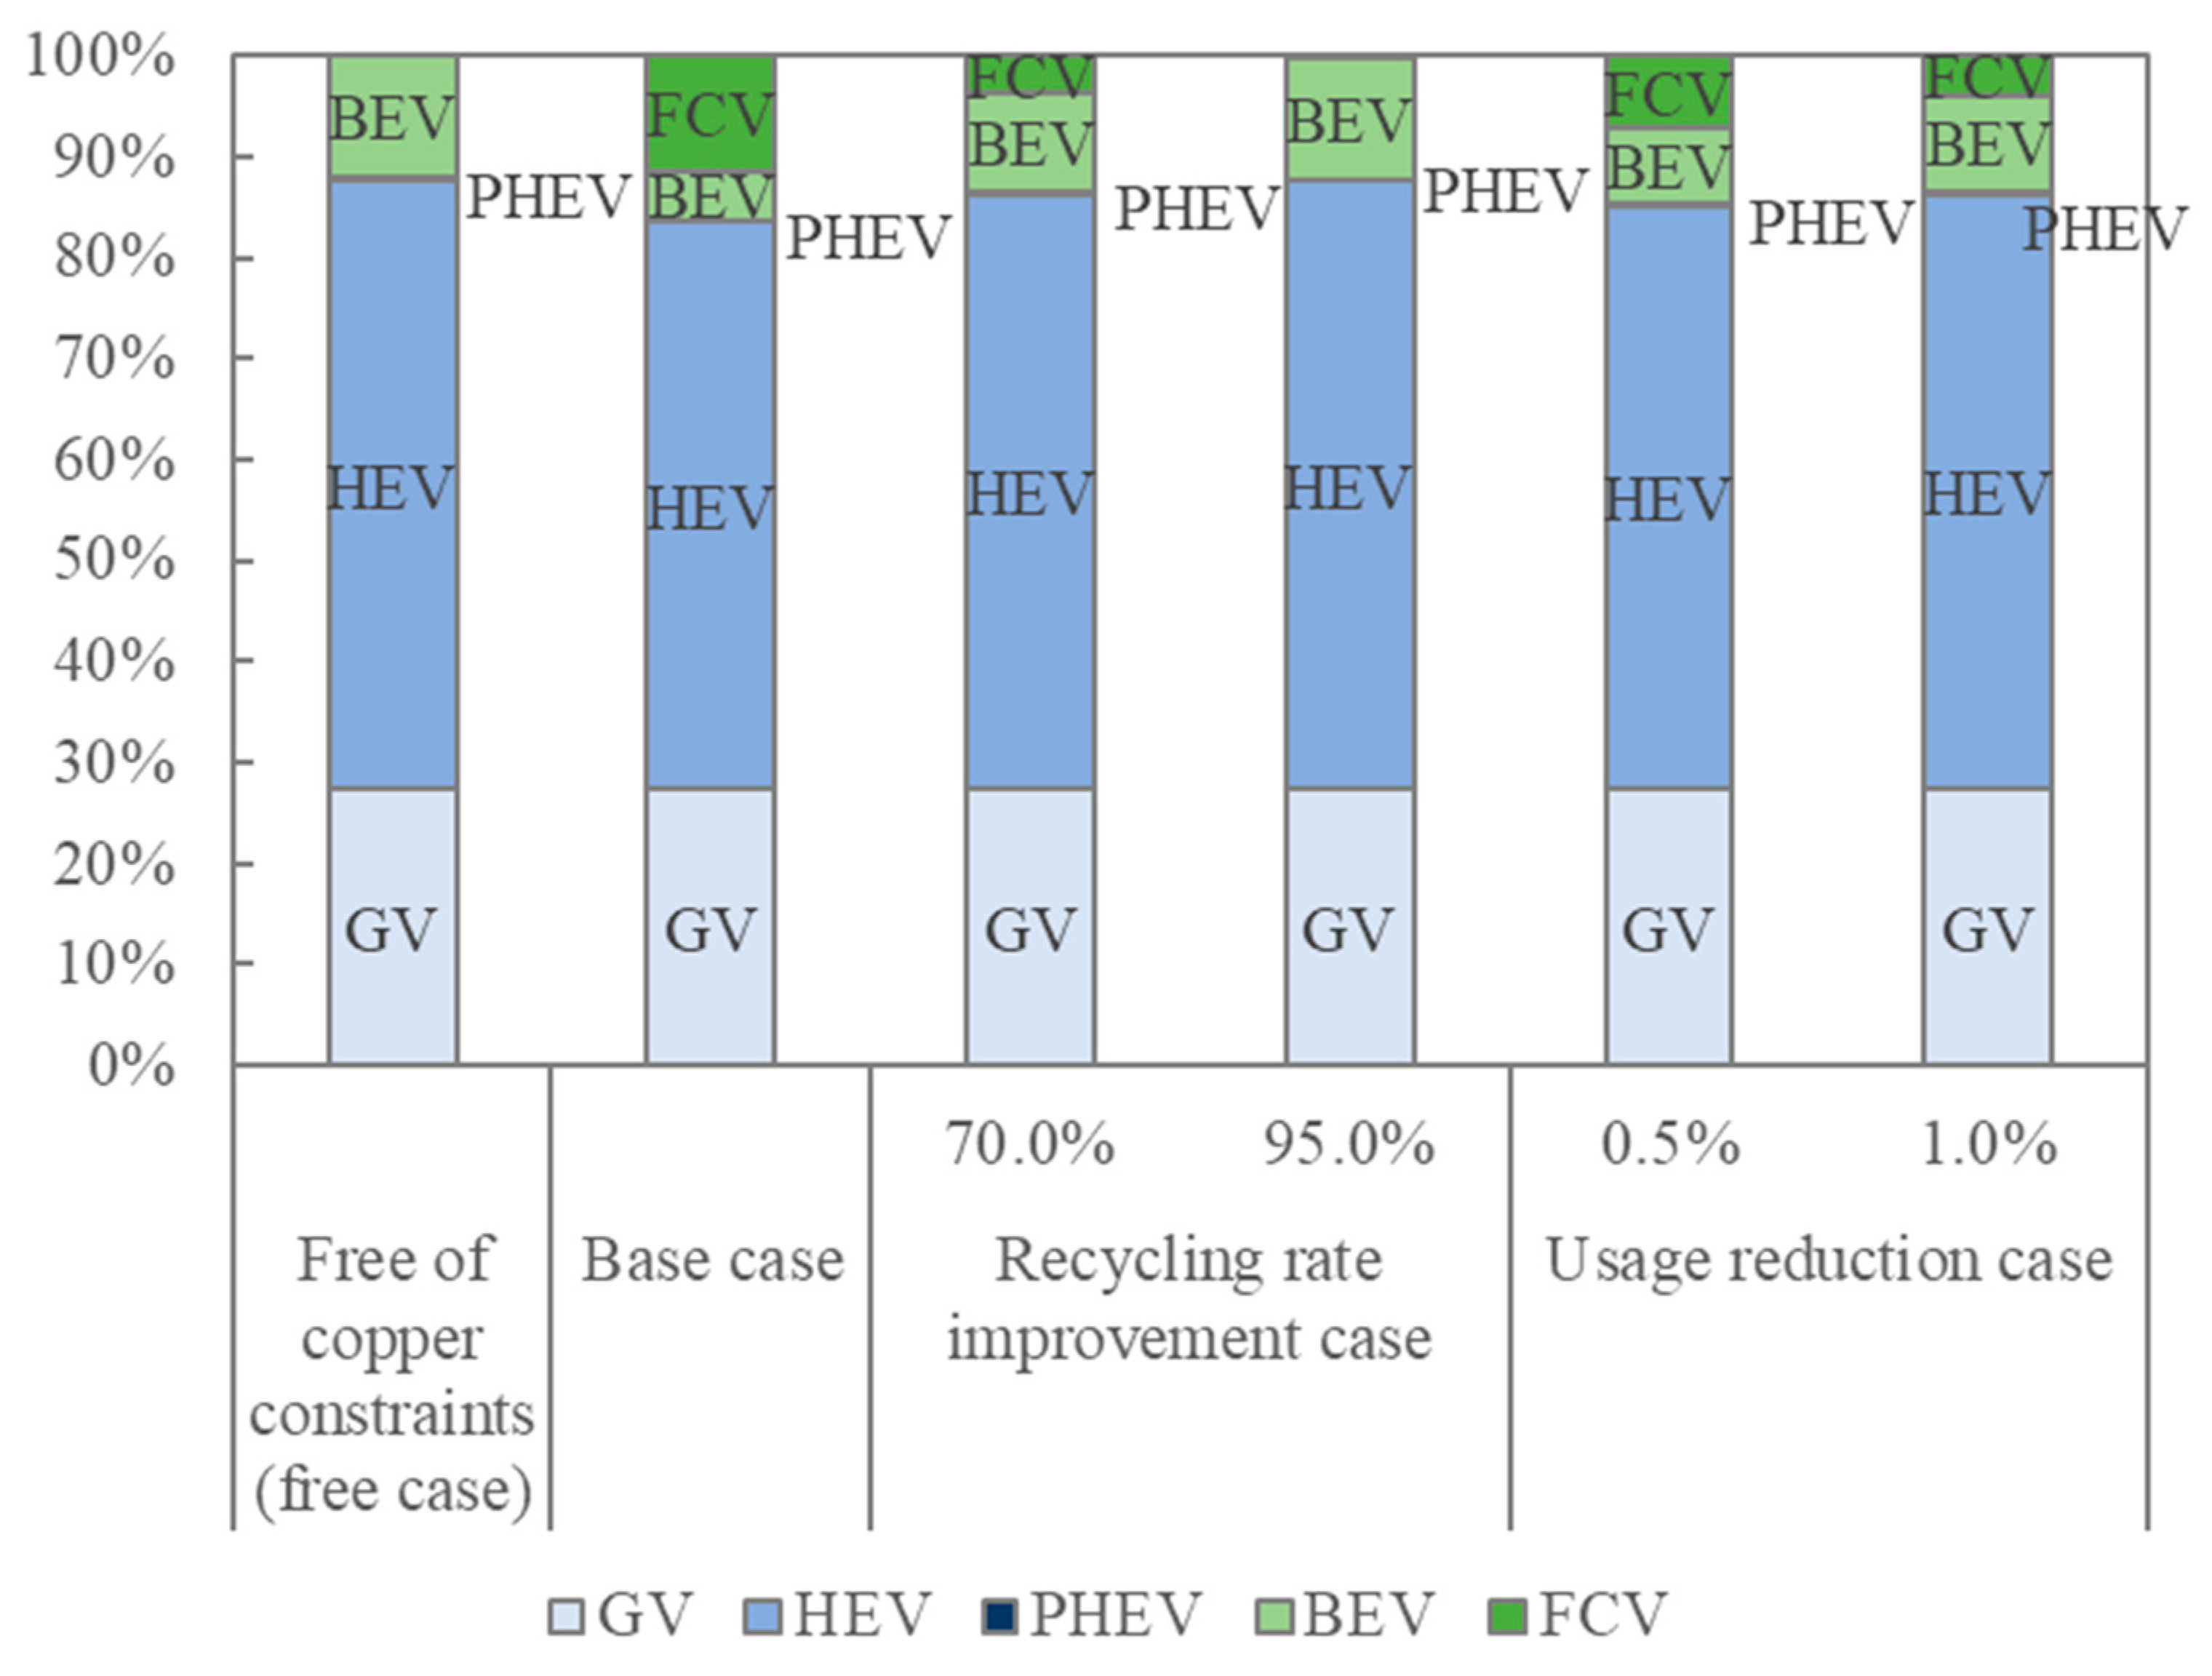
Figure 7 shows the sales volume composition ratio of each vehicle type in 2030 for each case.
First, without considering copper resource constraints (free case), HEVs and BEVs accounted for approximately 58% and 42%, respectively, whereas if the current copper recycling rate continues (base case), HEVs, BEVs, and FCVs accounted for approximately 35%, 2%, and 64%, respectively. Compared with the free case, the base case showed greater diffusion for FCVs than for BEVs. This result can be attributed to the fact that copper constraints made it difficult to promote BEVs that use more copper. It was also assumed that FCVs were selected to achieve the CO2 emission constraint, since they are the next most environmentally friendly vehicle type after BEVs.
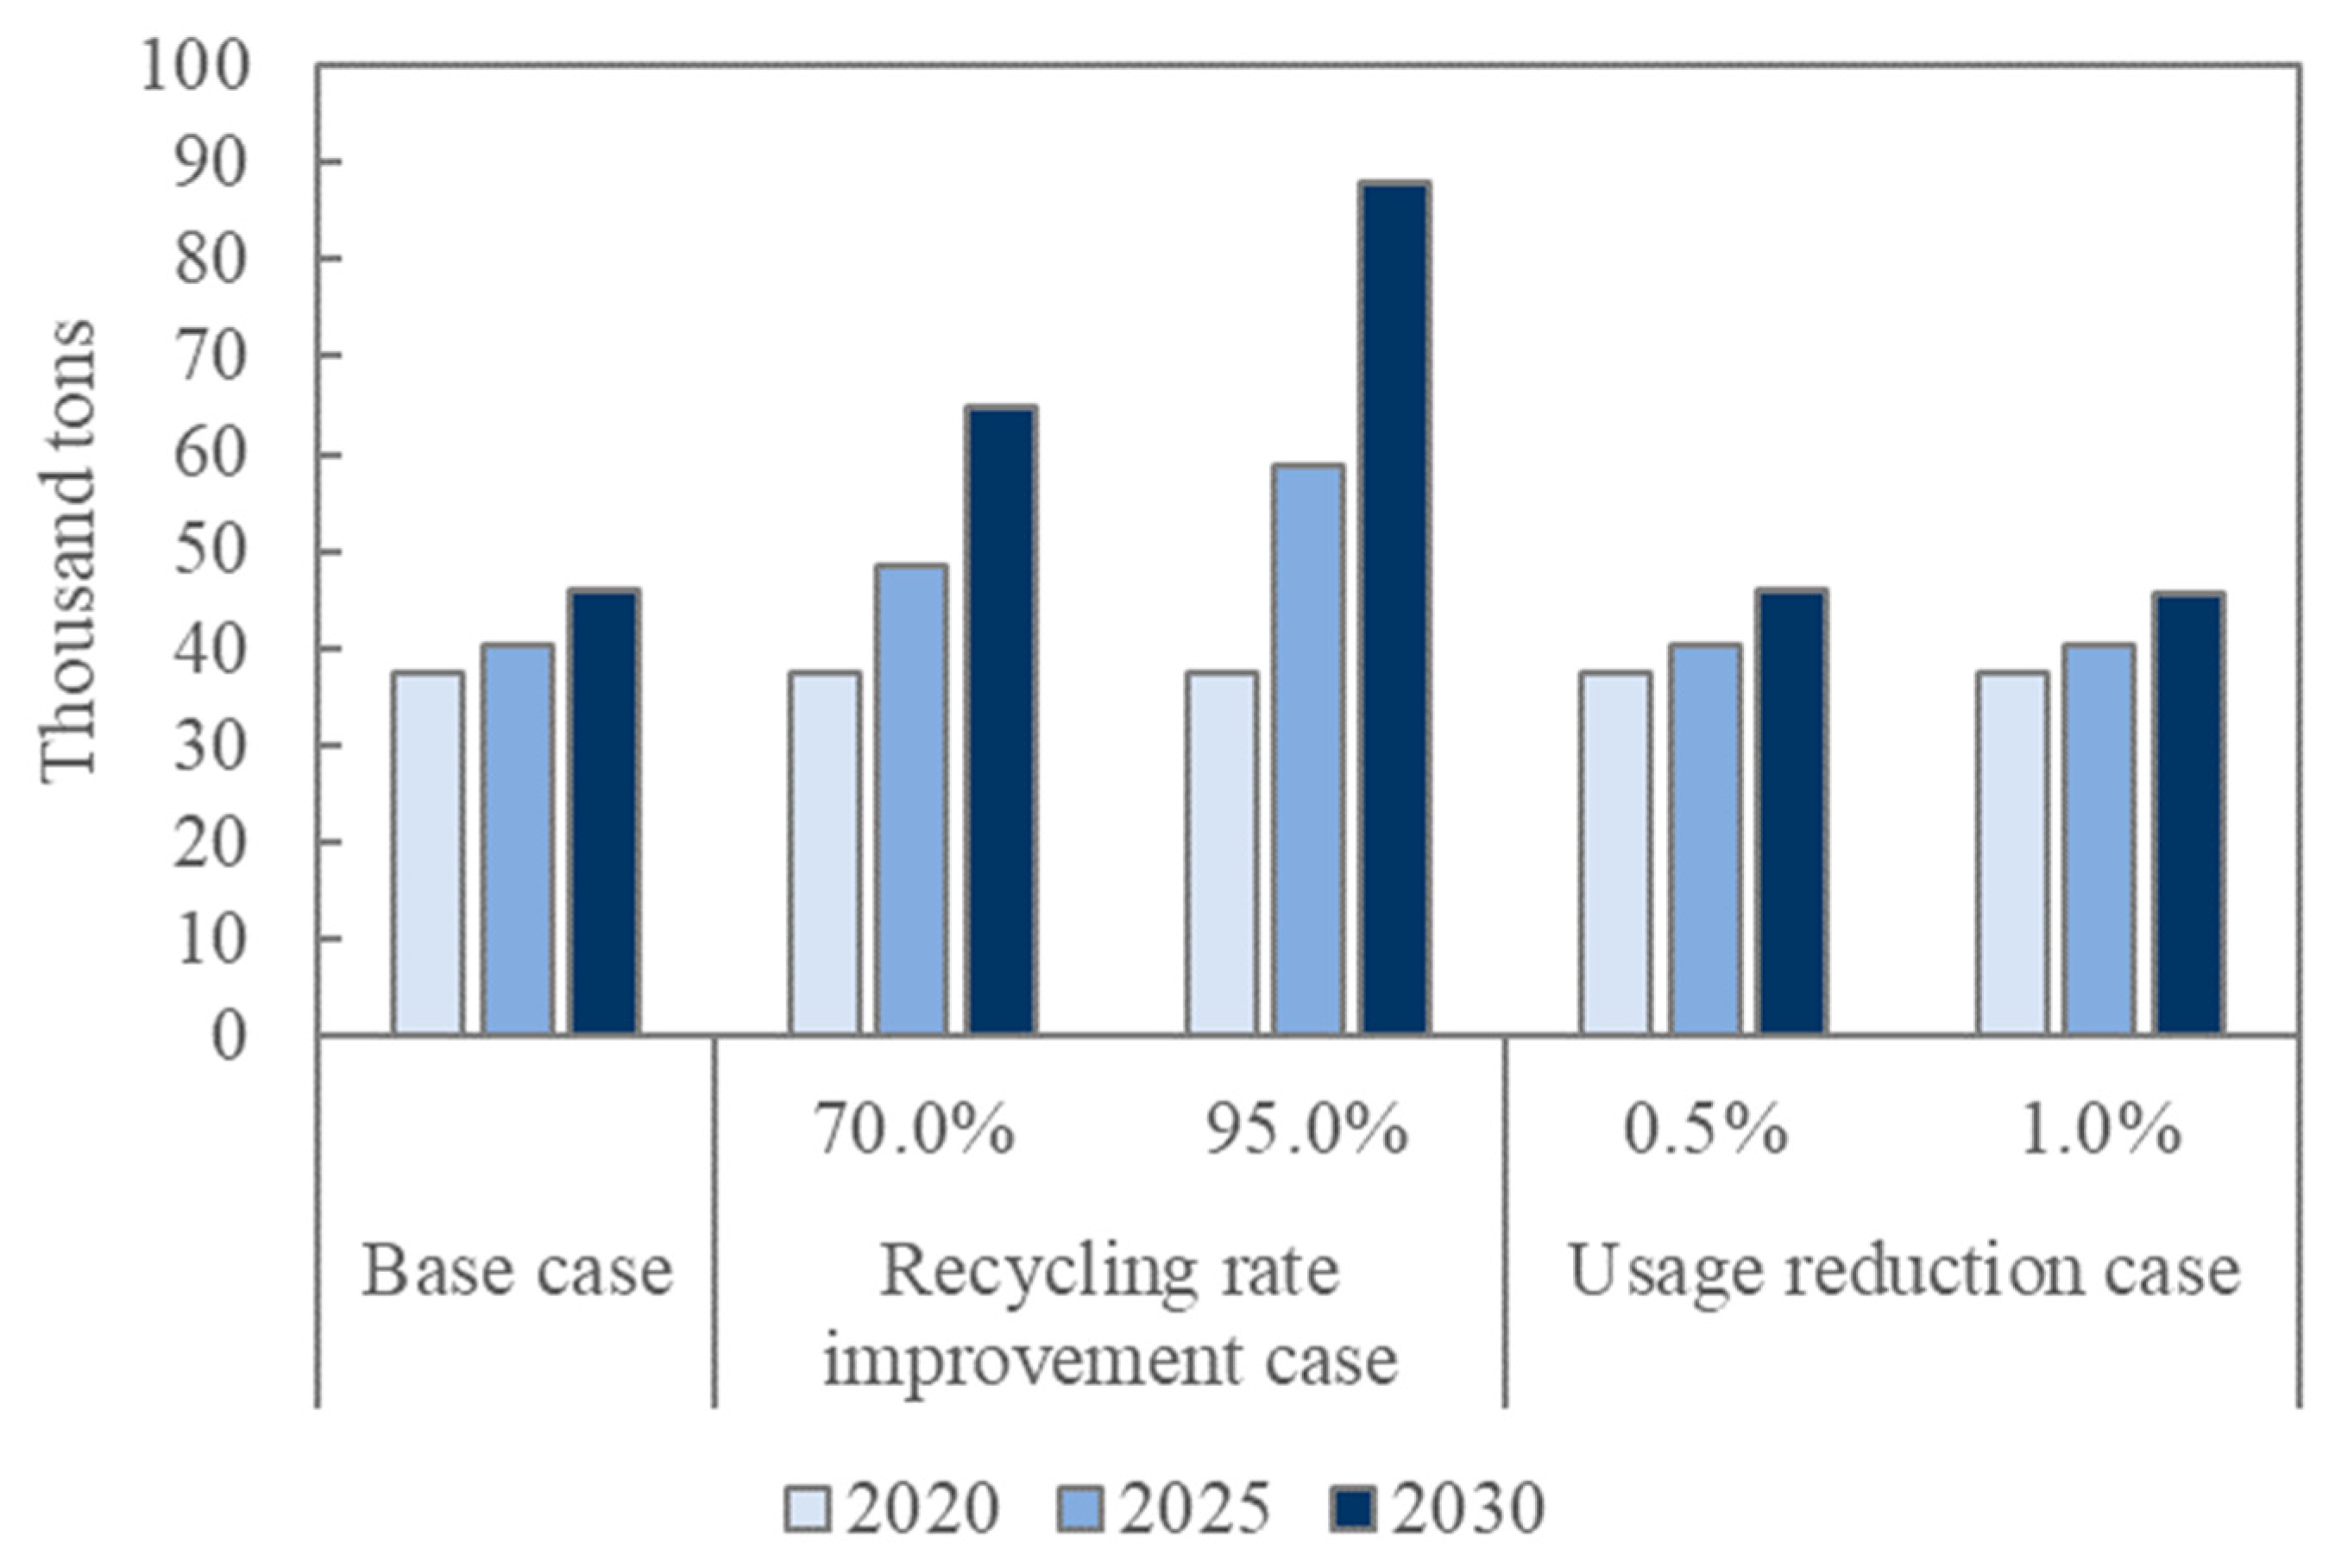
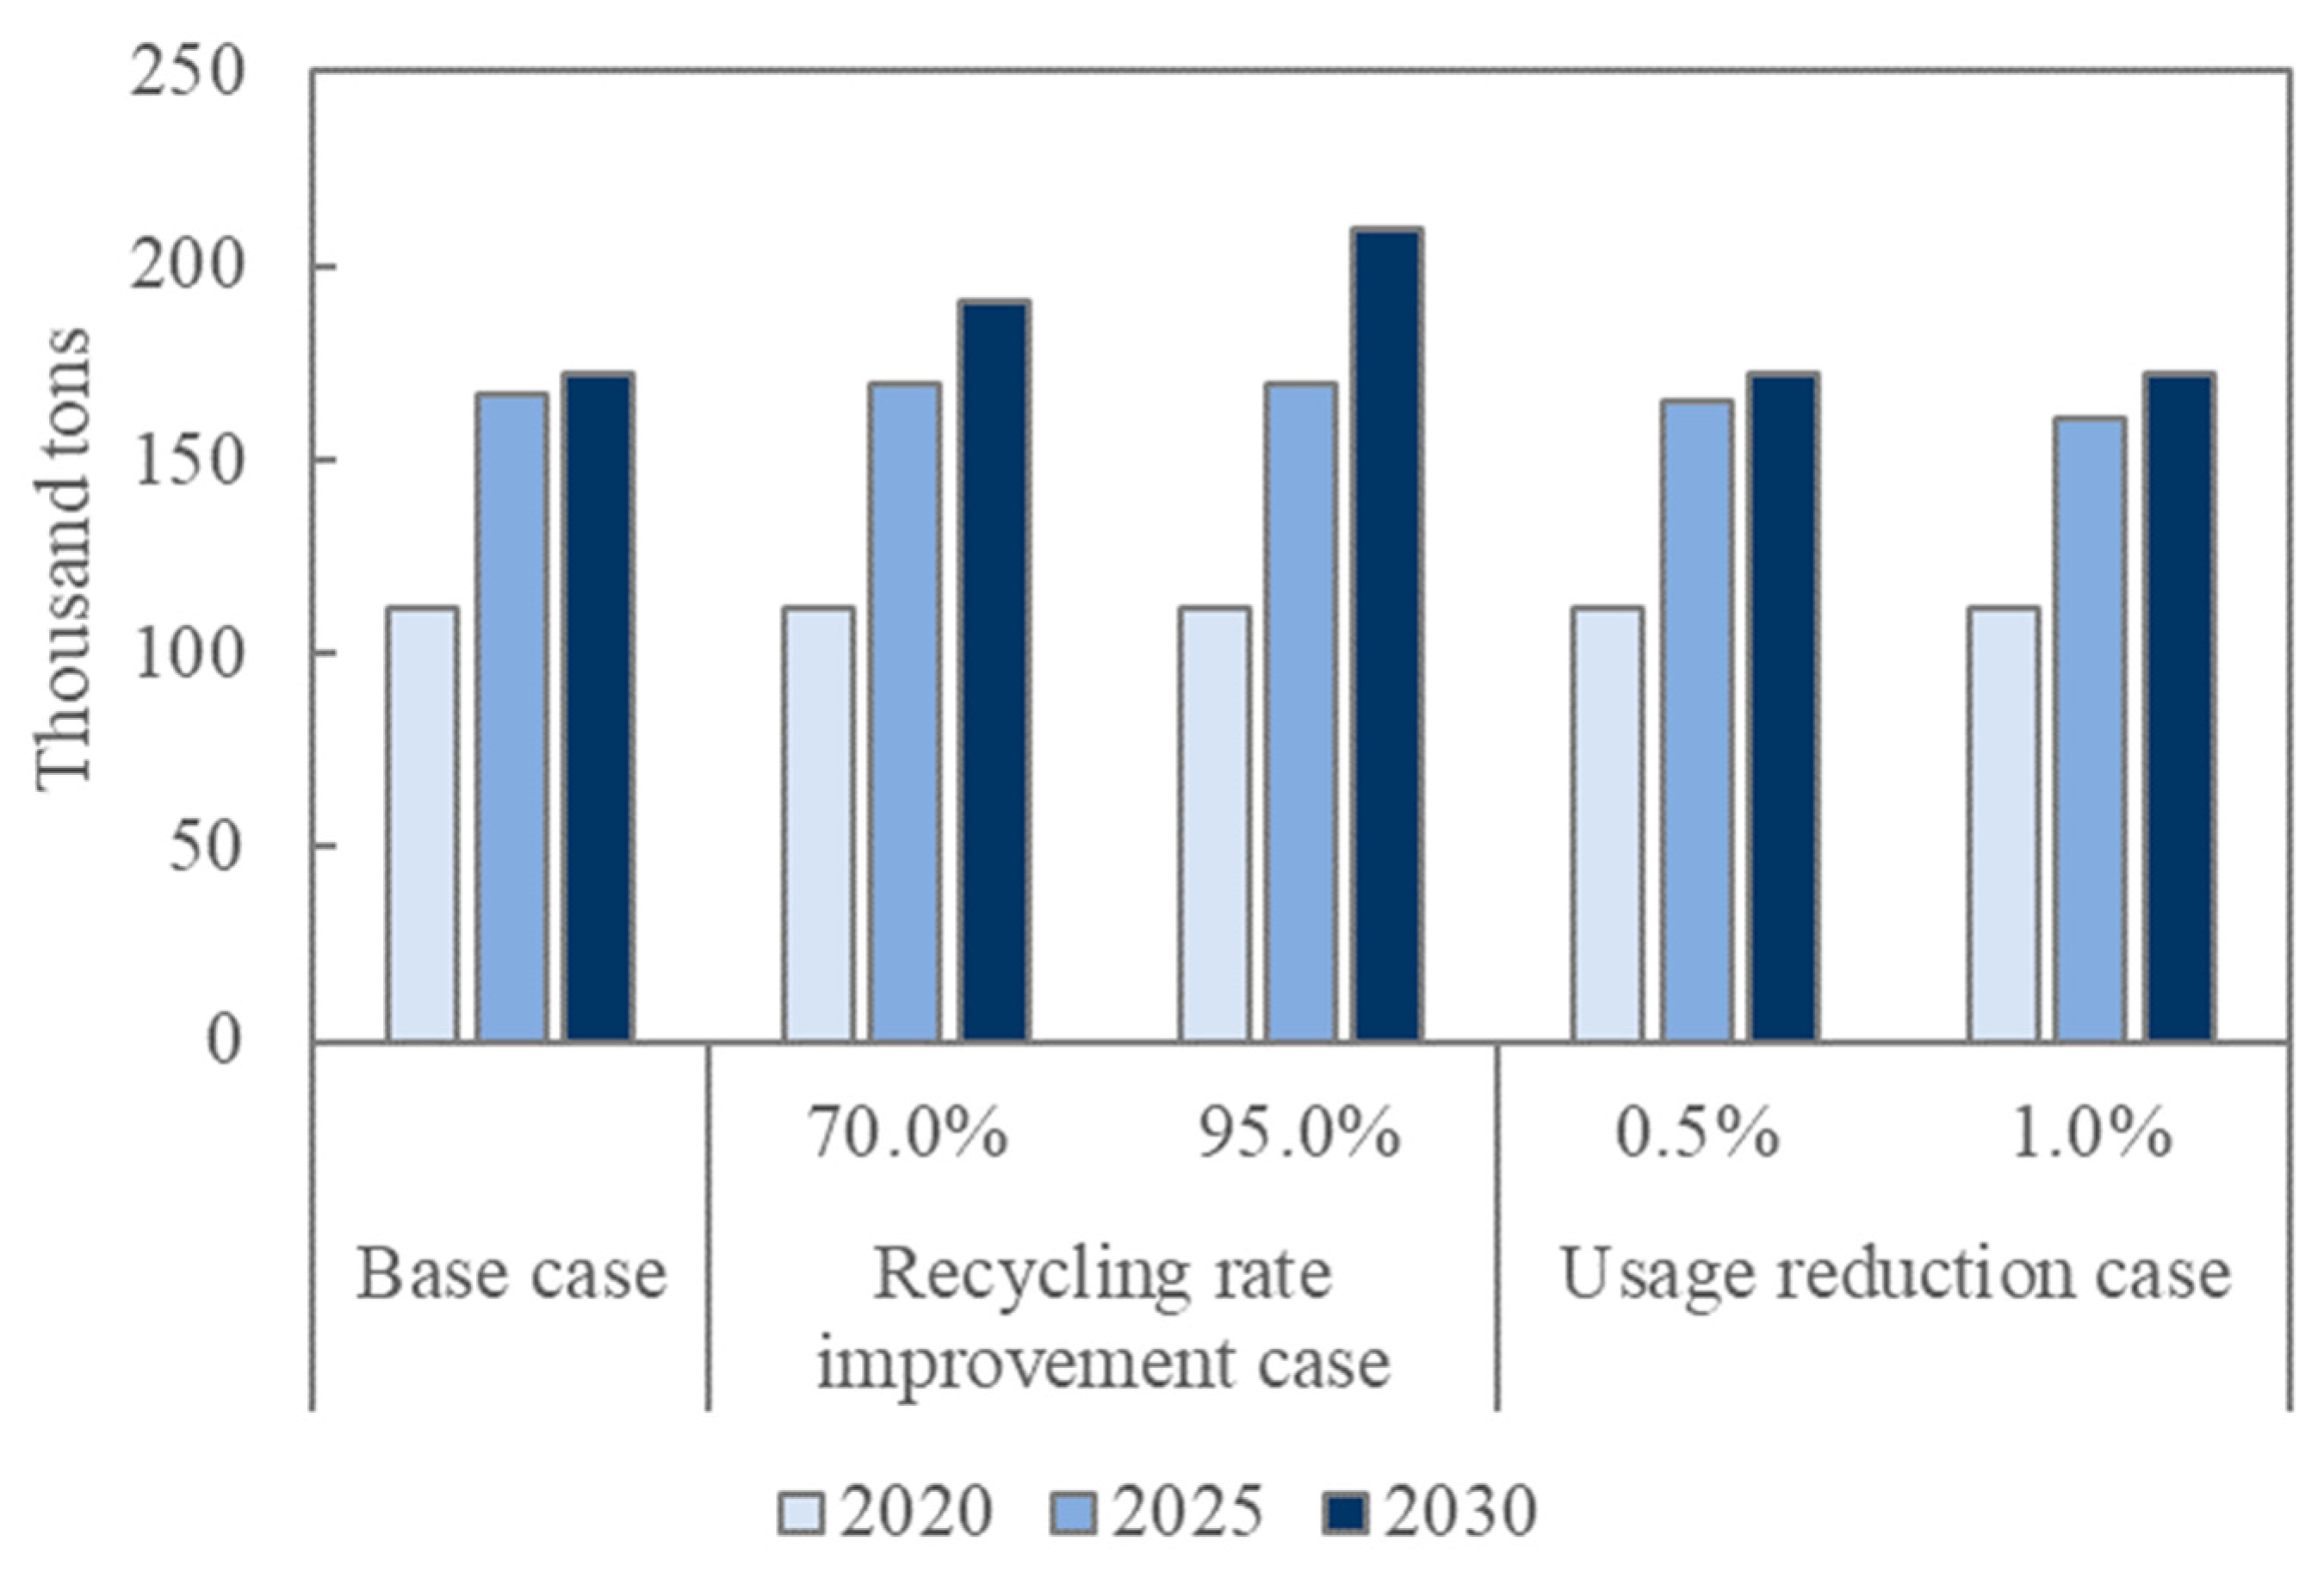
Next, comparing the base case with cases where the recycling rate improves to 70% and 95% showed that the major vehicle type shifts from FCVs to BEVs and HEVs as the recycling rate improves. This result is attributed to an increase in the amount of recycled copper and total supply of copper available for use in passenger vehicles. As shown in Figure 8, the amount of copper recycled per year is expected to increase from 2020 to 2030. Even in the base case, recycling volumes are expected to increase owing to an increase in the number of scrapped CEVs with high copper content. Comparing the improvement case of the recycling rate with the base case, the amount of recycled copper is expected to expand more significantly. In cases where recycling rates improve to 70% and 95%, the amount of copper recycled in 2030 is, respectively, more than 1.5 and 2 times as much as that in 2020 (Figure 8). As a result, the potential for widespread BEV use, which requires more copper, will expand. It is also assumed that HEVs were selected for their good balance of environmental performance, copper resource consumption, and sales price.
Comparing the usage reduction case and base case showed a shift in major vehicle types from FCVs to BEVs and HEVs, as the copper use reduction rate increases. Reduced copper usage per CEV has led to the deployment of more BEVs, with almost the same amount of total copper consumption as in the base case (Figure 9). Furthermore, comparing portfolio changes with the usage reduction case and recycling rate improvement case showed similar results, although the HEV, BEV, and FCV compositions were different. In addition, reducing copper use by 1% per year had almost the same effect as increasing the recycling rate from 50% to 70%.
Then, as shown in Figure 10, HEVs accounted for a large share of the total number of vehicles owned in all cases. In the 2020s, a price gap remained between HEVs, BEVs, and FCVs, and, as a result, HEVs played an important role. Comparing the cases where the recycling rate improves to 70% and 95% with the base case showed that as recycling rate improves, BEVs, rather than FCVs, accounted for a larger share of the total. In the base case, BEVs and FCVs accounted for approximately 5% and 12%, respectively, of the total number of vehicles owned by 2030. However, the BEV share increased to approximately 10% and 12% when the recycling rate improved to 70% and 95%, respectively. In addition, the usage reduction case showed similar results to the recycling rate improvement case.
For these results, as copper recycling rate improves, or copper use decreases, HEVs and BEVs are expected to play a greater role by 2030. Conversely, if these improvements are not implemented, the spread of FCVs must be accelerated. Furthermore, in all cases, PHEVs did not exhibit significant diffusion, presumably since HEVs are preferred when social system costs are considered, while BEVs are preferred when CO2 emissions are considered, resulting in a lesser selection of PHEVs.
Compared with previous studies [5,7], the number of FCVs sold increased due to copper supply constraints. On the other hand, BEVs accounted for a large share, as in the previous study, when the copper supply-demand situation was mitigated by increasing the copper recycling rate and decreasing the amount of copper used per vehicle. However, except for the case where the recycling rate improves to 95%, the diffusion of FCVs as well as BEVs was important. Metal resource management during the vehicle’s life cycle is essential. In addition, the ratio of HEVs increased compared with previous studies. These results were attributed to reducing social system costs while meeting the constraints of copper supply and CO2 emission reduction targets. However, it should be noted that there are differences in the prerequisite data, such as CO2 emission reduction targets, between the previous study and this study.
4.3. Evaluating the Impact of Copper Resource Constraints on Social System Costs
This section examines how changes in copper recycling rate and use per vehicle affect social system costs.
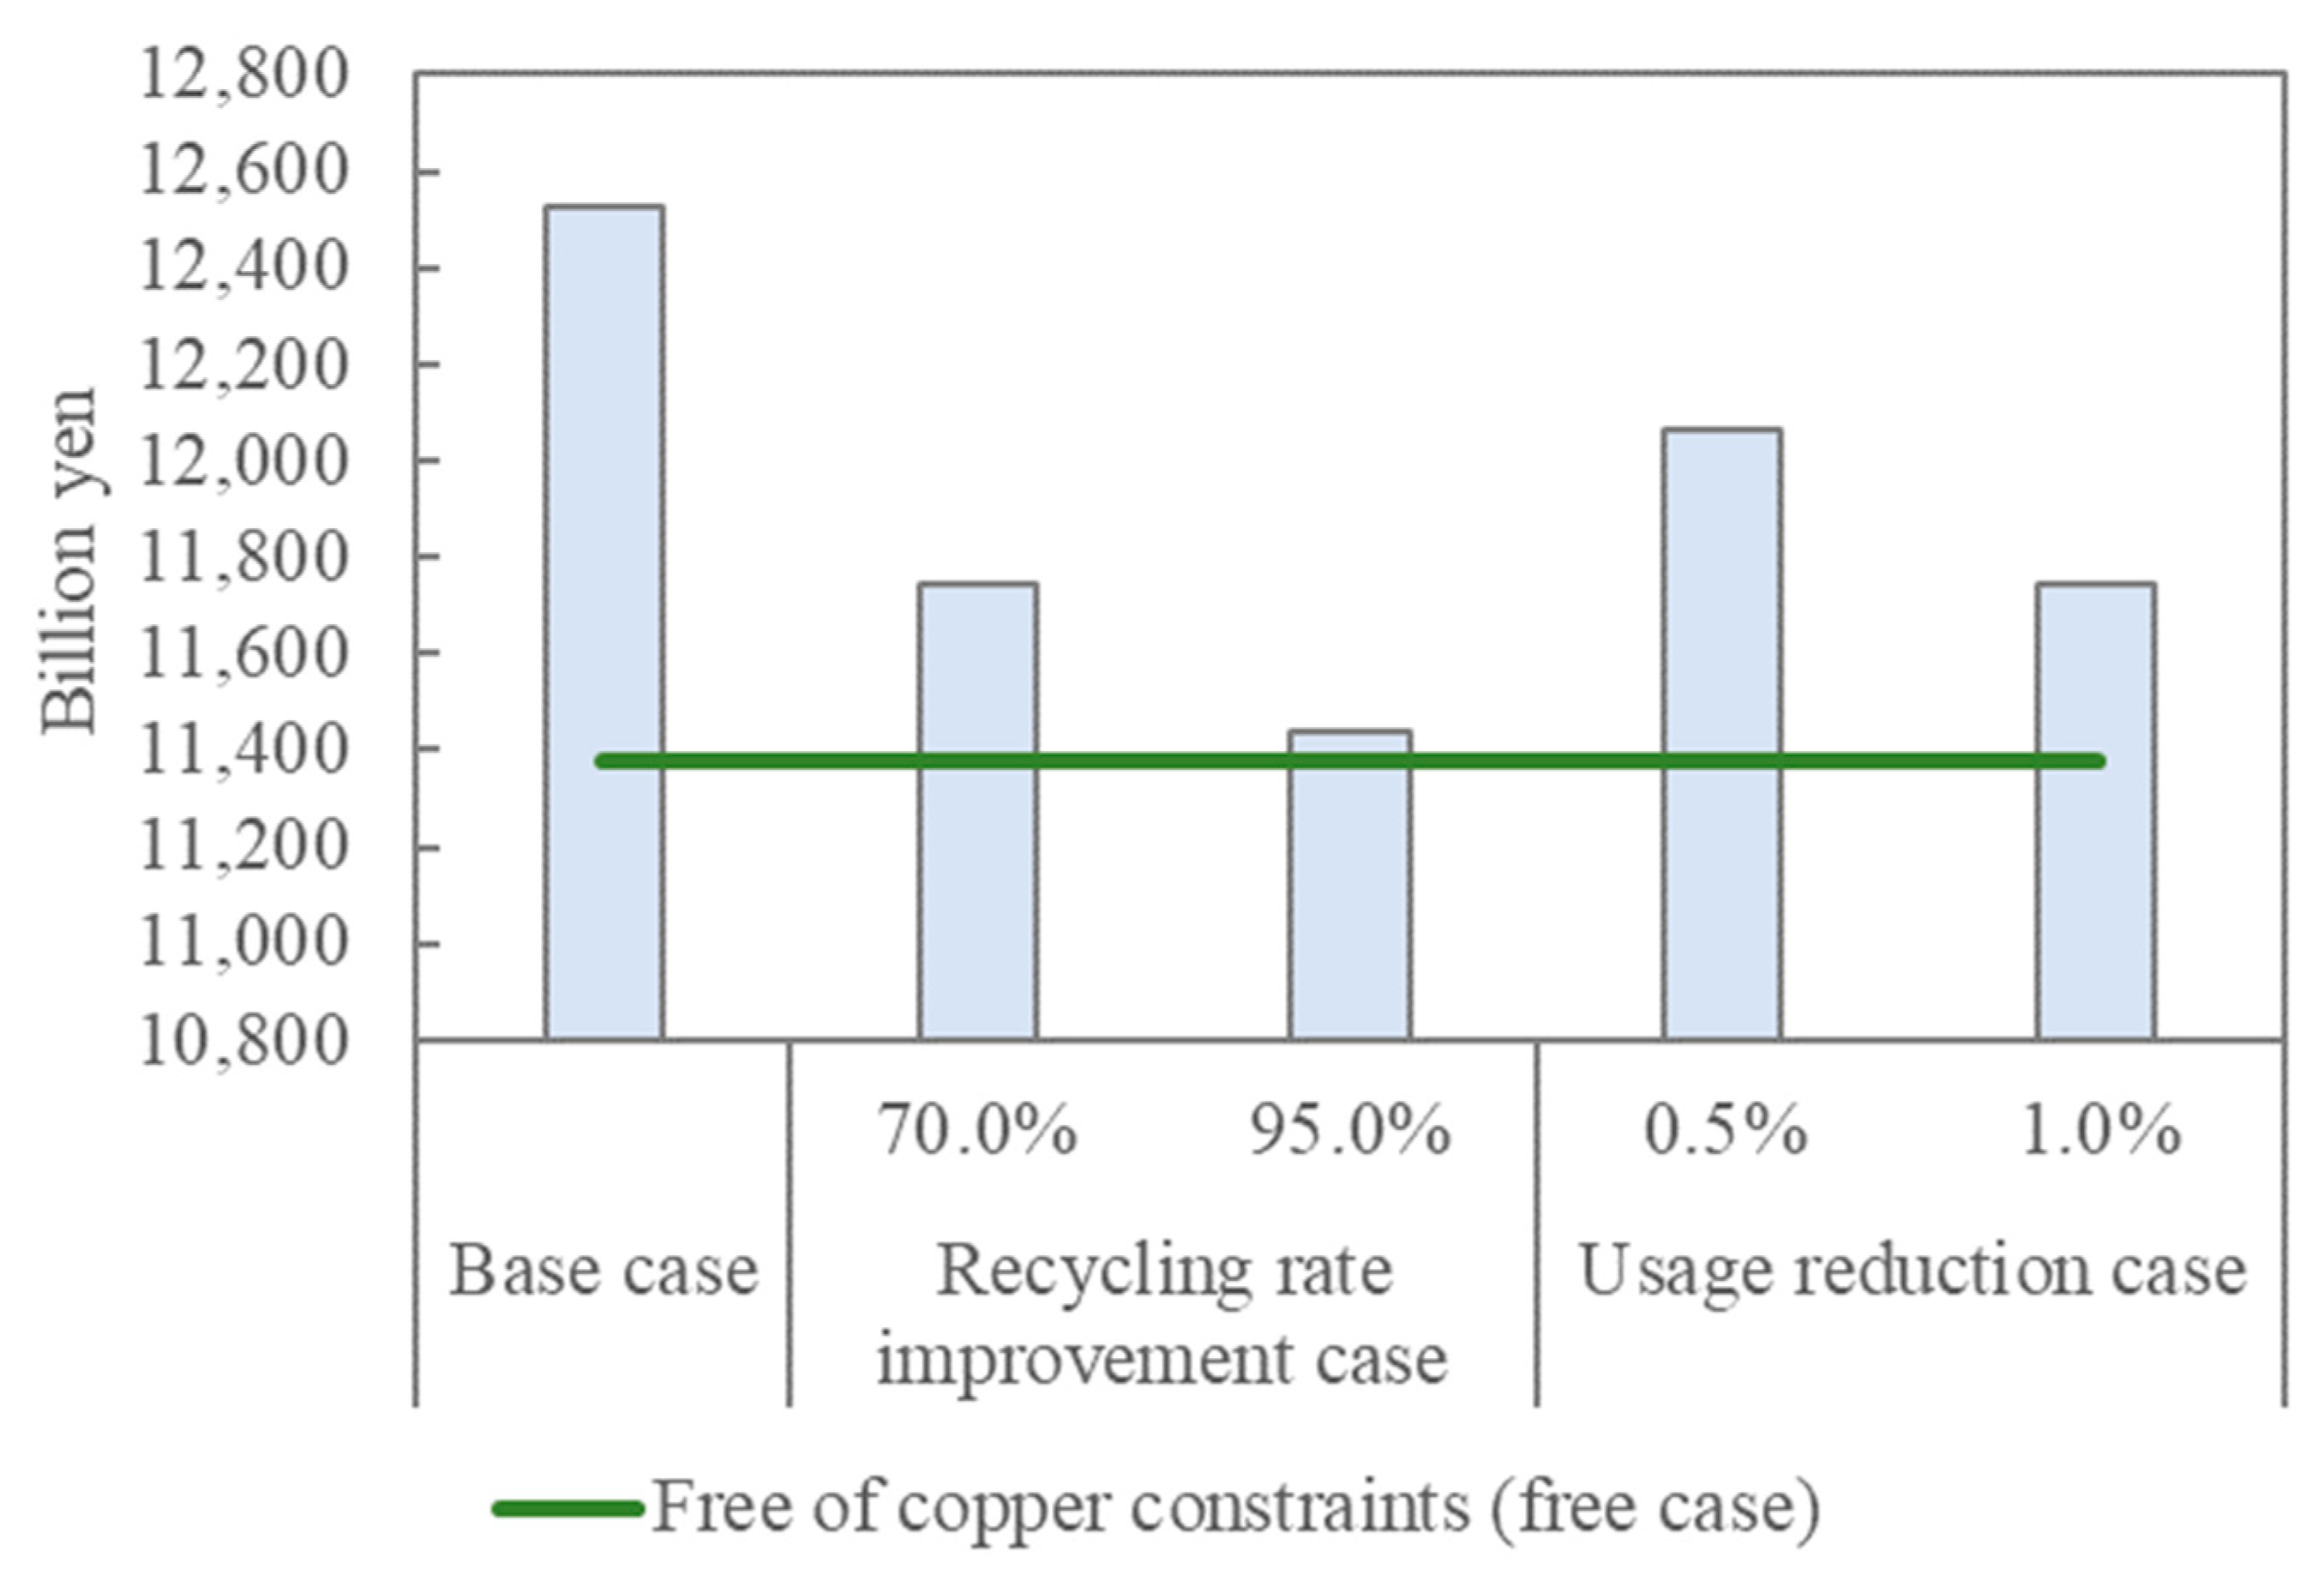
Figure 11 shows the average annual social system cost for each case from 2021 to 2030. The green line represents the social system cost for the free case, where copper resource constraints are not considered, while the blue bars represent the remaining five cases, where copper resource constraints are considered.
The social system cost in the free case was approximately 11 trillion yen. On the other hand, the base case showed that additional costs of approximately 1.2 trillion yen would be required. Compared with the base case, improving the recycling rate from 50% to 70% or reducing the amount used by 1% would reduce social system costs by approximately 800 billion yen, and improving the recycling rate to 95% would reduce social system costs by approximately 1.1 trillion yen.
Even reducing copper use by 0.5% would reduce the social system cost by approximately 450 billion yen, compared with the base case, since the price of FCVs and their infrastructure construction costs remain high in the 2020s. Therefore, improving recycling rate and reducing material use can have a significant effect on society.
Currently, the Japanese government provides subsidies to consumers purchasing CEVs, construction of infrastructure, such as charging stations, development of next-generation batteries and motors, and development of hydrogen supply chain technologies. For example, the Green Innovation Fund has allocated up to approximately 150 billion yen to the research and development of new batteries for higher performance, resource conservation, promotion of recycling, and reduction of GHG emissions during manufacturing [47]. Given the impact on society, it is important to further promote the development of vehicle recycling systems and alternative technologies.
5. Conclusions
The introduction of CEVs in the transportation sector is being promoted to achieve carbon neutrality. Each CEV has different characteristics. It is necessary to consider an optimal portfolio based on multiple perspectives to introduce CEVs effectively. Similar previous studies have not adequately factored in the copper recycling and supply constraints. Hence, in this study, a novel portfolio optimization model was developed to consider copper demand and supply, including copper recycling, social system costs and CO2 emissions. The study also aimed to analyze the optimal portfolio for domestic passenger vehicles and the assumed effects of copper recycling and usage reduction.
The present model was used to calculate the most economically rational passenger vehicle portfolio to achieve CO2 emission and copper supply constraints in Japan. In addition, a scenario analysis was conducted by varying copper recycling and usage reduction rates. The following conclusions were drawn:
- When copper resource constraints were not considered, HEVs and BEVs accounted for a large share of the total sales. On the other hand, when the current recycling rate of copper resources continues (base case), a greater diffusion of FCVs was observed compared with BEVs;
- Comparing the cases where the recycling rate improves to 70% and 95% with the base case, the major vehicle types shift from FCVs to BEVs as the recycling rate improves. This result was attributed to the increase in the amount of recycled copper and total supply of copper available for use in passenger vehicles. Furthermore, when copper usage was reduced by 0.5% or 1% per year, similar results were observed as in the case of recycling rate improvement. Thus, changes in copper recycling and usage reduction rates will change the types of vehicles with widespread use;
- Increased recycling rates and reduced usage could reduce social system costs by approximately 450–1100 billion yen, compared with the base case. Improving the recycling rate and reducing the amount of material are beneficial to society. Therefore, it is important to invest in vehicle recycling systems and develop alternative technologies to reduce the amount of copper used. Furthermore, to better promote recycling, it is necessary to strengthen the cooperation between the arterial and venous side of the automotive industry.
Furthermore, compared with previous studies, the results showed that the share of FCVs increased due to copper supply constraints and that significant improvements in the recycling rate or the amount of copper used per vehicle were necessary to promote BEVs. The comparison results indicated the importance of metal resource management during the vehicle’s life cycle. These conclusions are the results of an optimization model that focuses on supply, including recycling, and the demand for copper resources in response to increasing CEV production and use.
The optimization model used in this study provides valuable insights for analyzing the conditions for the introduction of CEVs to achieve CO2 emission reduction targets. However, it should be noted that there are uncertainties in the prerequisite data such as fuel, infrastructure, and vehicle costs.
Future work should extend the present model to analyze how portfolios are affected by changes in copper prices, energy prices, and CO2 emission intensity. Future research should also consider metal resources other than copper and areas outside of Japan. In addition, since this study did not consider specific recycling methods or alternative technologies, future studies should endeavor to design three “R” (reuse, reduce, and recycle) scenarios based on these latest developments.
Funding
This research received no external funding.
Data Availability Statement
The data presented in this study are available on reasonable request from the corresponding author.
Conflicts of Interest
There are no conflicts of interest to declare.
Abbreviations and Symbols
| Abbreviation/Symbol | Definition |
| BEVs | battery electric vehicles |
| CEVs | clean energy vehicles |
| ELVs | end-of-life vehicles |
| FCVs | fuel cell vehicles |
| GHG | greenhouse gas |
| GVs | gasoline vehicles |
| HEVs | hybrid electric vehicles |
| PHEVs | plug-in hybrid electric vehicles |
| i | vehicle type [GV, HEV, PHEV, BEV, FCV] |
| j | energy source [gasoline, electricity, hydrogen] |
| k | vehicle age |
| m | shape parameter of the Weibull distribution (m > 0) |
| η | scale parameter of the Weibull distribution (η > 0) |
| t | target year [2021–2030] |
| t0 | base year [2013] |
| AM | annual average mileage [km] |
| BC | copper consumption per vehicle [g/Unit] |
| BR | recycle rate of copper [%] |
| CU | CO2 emission intensity of vehicle [g-CO2/MJ] |
| EG | CO2 emission reduction rate target in year t [%] |
| ELV | number of ELVs [Units] |
| EP | price of energy [Yen/MJ] |
| FC | average fuel consumption of a vehicle [MJ/km] |
| IC | additional infrastructure construction cost [Yen/Unit] |
| P | sales price of a vehicle [Yen] |
| PS | primary supply of copper [kg] |
| S | number of vehicles owned [Units] |
| SC | social system cost [Yen] |
| TC | CO2 emissions [t-CO2] |
| TR | total amount of copper recycled [kg] |
| VR | recovery rate of ELVs [%] |
| W | cumulative retirement probability of vehicle [%] |
| X | new vehicle sales [Units] |
References
- Ministry of Land, Infrastructure, Transport and Tourism. CO2 Emissions in the Transport Sector. Available online: https://www.mlit.go.jp/sogoseisaku/environment/sosei_environment_tk_000007.html (accessed on 5 July 2022). (In Japanese).
- Ichinohe, M.; Endo, E. Analysis of the vehicle mix in the passenger-car sector in Japan for CO2 emissions reduction by a MARKAL model. Appl. Energy 2006, 83, 1047–1061. [Google Scholar] [CrossRef]
- Yeh, S.; Farrell, A.; Plevin, R.; Sanstad, A.; Weyant, J. Optimizing U.S. Mitigation Strategies for the Light-Duty Transportation Sector: What We Learn from a Bottom-Up Model. Environ. Sci. Technol. 2008, 42, 8202–8210. [Google Scholar] [CrossRef] [PubMed] [Green Version]
- Yamada, S.; Hondo, H. Optimal Product-Replacement Model considering Lifetime Distribution: Analysis of Introduction of Green Cars for Carbon Dioxide Emission Reduction. Energy Resour. 2009, 30, 9–15. (In Japanese) [Google Scholar] [CrossRef]
- Arimori, Y.; Nakano, M. Portfolio Optimization for Clean Energy Vehicles in Japan. Trans. JSME Ser. C 2012, 78, 2571–2582. (In Japanese) [Google Scholar] [CrossRef] [Green Version]
- Romejko, K.; Nakano, M. Portfolio analysis of alternative fuel vehicles considering technological advancement, energy security and policy. J. Cleaner Prod. 2017, 142, 39–49. [Google Scholar] [CrossRef]
- Kato, K.; Nonaka, T.; Nakano, M. Optimization Model for Global Portfolio of Clean Energy Vehicles Considering Metal Resource. Trans. JSME Ser. C 2013, 79, 77–89. (In Japanese) [Google Scholar] [CrossRef] [Green Version]
- Habib, K.; Hansdóttir, S.T.; Habib, H. Critical metals for electromobility: Global demand scenarios for passenger vehicles, 2015–2050. Resour. Conserv. Recycl. 2020, 154, 104603. [Google Scholar] [CrossRef]
- Li, X.; Ge, J.; Chen, W.; Wang, P. Scenarios of rare earth elements demand driven by automotive electrification in China: 2018–2030. Resour. Conserv. Recycl. 2019, 145, 322–331. [Google Scholar] [CrossRef]
- Shi, Q. Cobalt demand for automotive electrification in China: Scenario analysis based on the Bass model. Front. Energy Res. 2022, 10, 699. [Google Scholar] [CrossRef]
- Yano, J.; Muroi, T.; Sakai, S.I. Rare earth element recovery potentials from end-of-life hybrid electric vehicle components in 2010–2030. J. Mater. Cycles Waste Manag. 2016, 18, 655–664. [Google Scholar] [CrossRef]
- Li, Y.; Fujikawa, K.; Wang, J.; Li, X.; Ju, Y.; Chen, C. The Potential and Trend of End-Of-Life Passenger Vehicles Recycling in China. Sustainability 2020, 12, 1455. [Google Scholar] [CrossRef] [Green Version]
- Li, Y.; Huang, S.; Liu, Y.; Ju, Y. Recycling Potential of Plastic Resources from End-of-Life Passenger Vehicles in China. Int. J. Environ. Res. Public Health 2021, 18, 10285. [Google Scholar] [CrossRef] [PubMed]
- Japan Oil, Gas and Metals National Corporation. Mineral Resources Material Flow 2020. 2021. Available online: https://mric.jogmec.go.jp/wp-content/uploads/2021/06/material_flow2020.pdf (accessed on 13 May 2022). (In Japanese).
- Osawa, J. Evaluation of the recycling potential of rare metals in the passenger vehicle sector in Japan. In Proceedings of the 2023 13th International Conference on Future Environment and Energy (ICFEE 2023), Tokyo, Japan, 13–15 January 2023. [Google Scholar]
- Automobile Inspection & Registration Information Association. Table of Average Vehicle Age by Vehicle Type. 2020. Available online: https://www.airia.or.jp/publish/file/r5c6pv000000u7a6-att/02_syarei02.pdf (accessed on 30 May 2022). (In Japanese).
- Agency for Natural Resources and Energy. 6th Strategic Energy Plan. 2021. Available online: https://www.enecho.meti.go.jp/en/category/others/basic_plan/pdf/6th_outline.pdf (accessed on 12 May 2022).
- Karai, T.; Nakano, M.; Kimura, F. Estimation on Sustainability for Copper Domestic Supply by Considering Recycling Flow: A Case Study of Automobile, Electric Appliances and Construction Industries. Trans. JSME Ser. C 2010, 76, 3744–3751. (In Japanese) [Google Scholar] [CrossRef] [Green Version]
- Japan Automobile Manufacturers Association. The Motor Industry of Japan 2021. 2021. Available online: https://www.jama.or.jp/english/publications/MIoJ2021_e.pdf (accessed on 12 May 2022).
- National Institute of Population and Social Security Research. Future Estimated Population of Japan (Estimated in 2017). 2017. Available online: https://www.ipss.go.jp/pp-zenkoku/j/zenkoku2017/pp_zenkoku2017.asp (accessed on 12 May 2022).
- Kimura, S. Impact Analysis on Next-generation Vehicles to Chubu Economy, by using Chubu-region Multi-regional Input Output Table. Input-Output Anal. 2019, 26, 80–98. (In Japanese) [Google Scholar] [CrossRef] [Green Version]
- Fuji Keizai. Future Outlook for Energy and Large-Scale Rechargeable Batteries and Materials 2020: Electric Vehicle and Automotive Battery Sector Edition; Fuji Keizai: Tokyo, Japan, 2020. (In Japanese) [Google Scholar]
- Fuji Keizai. In-Depth Analysis and Research on HEV and EV Related Markets for 2020; Fuji Keizai: Tokyo, Japan, 2020. (In Japanese) [Google Scholar]
- Ministry of Land, Infrastructure, Transport and Tourism. Input-Output Table Focusing on the Transportation Sector for 2011. 2015. Available online: https://www.mlit.go.jp/k-toukei/unyubumonwotyuushintoshitasangyourenkanhyou_h23Excel.html (accessed on 10 June 2022). (In Japanese).
- Fuji Keizai. Future Prospects for Fuel Cell Related Technologies and Markets for 2020; Fuji Keizai: Tokyo, Japan, 2021. (In Japanese) [Google Scholar]
- Ministry of Land, Infrastructure, Transport and Tourism. List of Automobile Fuel Consumption. 2022. Available online: https://www.mlit.go.jp/jidosha/jidosha_fr10_000051.html (accessed on 12 May 2022). (In Japanese).
- Automobile Fuel Economy Standards Subcommittee. Summary Material. 2019. Available online: https://www.mlit.go.jp/common/001294895.pdf (accessed on 12 May 2022). (In Japanese).
- The Japan Automobile Research Institute. Analysis Report of the Overall Efficiency and GHG Emissions. 2011. Available online: https://pdf4pro.com/amp/cdn/ghg-jari-or-jp-1f227e.pdf (accessed on 13 May 2022). (In Japanese).
- Yanagisawa, A. Structure of Passing on the Price of Crude Oil to the Price of Gasoline in Japan. 2011. Available online: https://eneken.ieej.or.jp/data/4158.pdf (accessed on 13 May 2022). (In Japanese).
- International Energy Agency. World Energy Outlook 2021. 2021. Available online: https://iea.blob.core.windows.net/assets/88dec0c7-3a11-4d3b-99dc-8323ebfb388b/WorldEnergyOutlook2021.pdf (accessed on 13 May 2022).
- Central Research Institute of Electric Power Industry. Study of the Economy, Industry, and Energy Supply-Demand Structure in Japan through FY2030. 2021. Available online: https://criepi.denken.or.jp/jp/serc/source/pdf/Y20506.pdf (accessed on 5 July 2022). (In Japanese).
- Agency for Natural Resources and Energy. Promotion of Investment in the Hydrogen/Ammonia Supply Chain and Measures to Expand Its Demand. 2022. Available online: https://www.meti.go.jp/shingikai/enecho/shoene_shinene/suiso_seisaku/pdf/002_01_00.pdf (accessed on 13 May 2022). (In Japanese)
- Ministry of the Environment. Calculation Method and Emission Factor List. 2020. Available online: https://ghg-santeikohyo.env.go.jp/files/calc/itiran_2020_rev.pdf (accessed on 13 May 2022). (In Japanese)
- Agency for Natural Resources and Energy. Greenhouse Gas Emissions in the Life Cycle of Biomass Power Generation. 2020. Available online: https://www.meti.go.jp/shingikai/enecho/shoene_shinene/shin_energy/biomass_sus_wg/pdf/008_03_00.pdf (accessed on 13 May 2022). (In Japanese)
- Agency for Natural Resources and Energy. About Future Renewable Energy Policy. 2021. Available online: https://www.meti.go.jp/shingikai/enecho/denryoku_gas/saisei_kano/pdf/025_01_00.pdf (accessed on 13 May 2022). (In Japanese)
- Central Research Institute of Electric Power Industry. Comprehensive Assessment of Life Cycle CO2 Emissions from Power Generation Technologies in Japan. 2016. Available online: https://criepi.denken.or.jp/hokokusho/pb/reportDownload?reportNoUkCode=Y06&tenpuTypeCode=30&seqNo=1&reportId=8713 (accessed on 13 May 2022). (In Japanese).
- Mizuho Research & Technologies. Evaluation of Greenhouse Gas Emissions of Hydrogen in the Life Cycle. 2017. Available online: https://www.mizuho-ir.co.jp/seminar/info/2017/pdf/bif0131_02mizuho.pdf (accessed on 13 May 2022). (In Japanese).
- Agency for Natural Resources and Energy. Current Status of FCV and Hydrogen Station Business. 2021. Available online: https://www.meti.go.jp/shingikai/energy_environment/suiso_nenryo/pdf/024_01_00.pdf (accessed on 29 June 2022). (In Japanese)
- Agency for Natural Resources and Energy. Changes in the Number of Gasoline Dealers and Gas Stations. 2021. Available online: https://www.enecho.meti.go.jp/category/resources_and_fuel/distribution/hinnkakuhou/data/2021_07_30_01.pdf (accessed on 13 May 2022). (In Japanese)
- Ministry of Land, Infrastructure, Transport and Tourism. Number of Vehicles Owned by Vehicle Type. 2021. Available online: https://www.mlit.go.jp/common/001405880.pdf (accessed on 13 May 2022). (In Japanese).
- International Copper Association. The Electric Vehicle Market and Copper Demand. 2017. Available online: https://copperalliance.org/wp-content/uploads/2017/06/2017.06-E-Mobility-Factsheet-1.pdf (accessed on 16 June 2022).
- Toyota Motor Corporation. The MIRAI Life Cycle Assessment for Communication. 2015. Available online: https://global.toyota/pages/global_toyota/sustainability/esg/challenge2050/challenge2/life_cycle_assessment_report_en.pdf (accessed on 13 May 2022).
- Ministry of Land, Infrastructure, Transport and Tourism. Annual Report of Automobile Transportation Statistics. 2021. Available online: https://www.e-stat.go.jp/stat-search/files?page=1&layout=datalist&toukei=00600330&tstat=000001078083&cycle=8&year=20201&month=0&result_back=1&tclass1val=0 (accessed on 13 May 2022). (In Japanese).
- Central Research Institute of Electric Power Industry. Evaluation of GHG Emissions from the Manufacture and Operation of Electric Vehicles and Internal Combustion Engine Vehicles—Comparative Analysis according to the Ratio of Thermal Power Generation for Business Use. 2021. Available online: https://criepi.denken.or.jp/jp/serc/source/pdf/Y21503.pdf (accessed on 15 July 2022). (In Japanese).
- Japan Automobile Recycling Promotion Center. Automotive Recycling Data Book 2020. 2021. Available online: https://www.jarc.or.jp/data/databook/ (accessed on 30 May 2022). (In Japanese).
- Yoshimura, A.; Matsuno, Y. Dynamic Material Flow Analysis of Copper and Copper Alloy in Global Scale—Forecast of In-Use Stock and Inputs and the Estimation of Scrap Recovery Potential. J. Jpn. Inst. Metals 2018, 82, 8–17. (In Japanese) [Google Scholar] [CrossRef] [Green Version]
- Ministry of Economy, Trade and Industry. Plans for Research and Development and Social Implementation Related to the “Development of Next Generation Storage Batteries and Next Generation Motors” Project. 2021. Available online: https://www.meti.go.jp/policy/energy_environment/global_warming/gifund/pdf/gif_12_randd.pdf (accessed on 29 June 2022). (In Japanese)
Figure 1.
Overview of the CEV portfolio optimization model.

Figure 2.
Trends in sale prices for each type of vehicle. GV: gasoline vehicles; HEV: hybrid electric vehicles; PHEV: plug-in hybrid electric vehicles; BEV: battery electric vehicles; FCV: fuel cell vehicles.
Figure 2.
Trends in sale prices for each type of vehicle. GV: gasoline vehicles; HEV: hybrid electric vehicles; PHEV: plug-in hybrid electric vehicles; BEV: battery electric vehicles; FCV: fuel cell vehicles.

Figure 3.
Trends in fuel consumption. GV: gasoline vehicles; HEV: hybrid electric vehicles; PHEV: plug-in hybrid electric vehicles; BEV: battery electric vehicles; FCV: fuel cell vehicles.
Figure 3.
Trends in fuel consumption. GV: gasoline vehicles; HEV: hybrid electric vehicles; PHEV: plug-in hybrid electric vehicles; BEV: battery electric vehicles; FCV: fuel cell vehicles.

Figure 4.
Trends in energy prices.

Figure 5.
Trends in CO2 emission intensity.

Figure 6.
Copper consumption for each vehicle type. GV: gasoline vehicles; HEV: hybrid electric vehicles; PHEV: plug-in hybrid electric vehicles; BEV: battery electric vehicles; FCV: fuel cell vehicles.
Figure 6.
Copper consumption for each vehicle type. GV: gasoline vehicles; HEV: hybrid electric vehicles; PHEV: plug-in hybrid electric vehicles; BEV: battery electric vehicles; FCV: fuel cell vehicles.

Figure 7.
Sales share of each vehicle type in 2030. GV: gasoline vehicles; HEV: hybrid electric vehicles; PHEV: plug-in hybrid electric vehicles; BEV: battery electric vehicles; FCV: fuel cell vehicles.
Figure 7.
Sales share of each vehicle type in 2030. GV: gasoline vehicles; HEV: hybrid electric vehicles; PHEV: plug-in hybrid electric vehicles; BEV: battery electric vehicles; FCV: fuel cell vehicles.

Figure 8.
Amount of copper recycled from end-of-life vehicles.

Figure 9.
Total copper consumption from new vehicle sales.

Figure 10.
Share of vehicles owned for each vehicle type in 2030. GV: gasoline vehicles; HEV: hybrid electric vehicles; PHEV: plug-in hybrid electric vehicles; BEV: battery electric vehicles; FCV: fuel cell vehicles.
Figure 10.
Share of vehicles owned for each vehicle type in 2030. GV: gasoline vehicles; HEV: hybrid electric vehicles; PHEV: plug-in hybrid electric vehicles; BEV: battery electric vehicles; FCV: fuel cell vehicles.

Figure 11.
Average annual social system costs in each case.


Table 1.
Copper recycling rate and usage reduction rate in each case.
| Scenario | Recycling Rate in 2030 | Usage Reduction Rate for Each Year by 2030 | |
|---|---|---|---|
| Free of copper constraints (free case) | - | - | |
| Base case | 50.0% | 0.0% | |
| Recycling rate improvement case | Low | 70.0% | 0.0% |
| High | 95.0% | 0.0% | |
| Usage reduction case | Low | 50.0% | 0.5% |
| High | 50.0% | 1.0% |
Disclaimer/Publisher’s Note: The statements, opinions and data contained in all publications are solely those of the individual author(s) and contributor(s) and not of MDPI and/or the editor(s). MDPI and/or the editor(s) disclaim responsibility for any injury to people or property resulting from any ideas, methods, instructions or products referred to in the content. |
© 2023 by the author. Licensee MDPI, Basel, Switzerland. This article is an open access article distributed under the terms and conditions of the Creative Commons Attribution (CC BY) license (https://creativecommons.org/licenses/by/4.0/).
Share and Cite
MDPI and ACS Style
Osawa, J. Portfolio Analysis of Clean Energy Vehicles in Japan Considering Copper Recycling. Sustainability 2023, 15, 2113. https://doi.org/10.3390/su15032113
AMA Style
Osawa J. Portfolio Analysis of Clean Energy Vehicles in Japan Considering Copper Recycling. Sustainability. 2023; 15(3):2113. https://doi.org/10.3390/su15032113
Chicago/Turabian StyleOsawa, Jun. 2023. "Portfolio Analysis of Clean Energy Vehicles in Japan Considering Copper Recycling" Sustainability 15, no. 3: 2113. https://doi.org/10.3390/su15032113
Note that from the first issue of 2016, this journal uses article numbers instead of page numbers. See further details here.