1. Introduction
In a new round of water conservancy and hydropower development, a large number of high dams and large reservoirs have been planned and constructed in the high earthquake intensity areas in Western China. CRFD occupies an important position because of the construction speed and accessible materials. The proposed and under-construction high CRFDs in China include Gushui (240 m), Monkey Rock (223.5 m), Dashixia (247 m), etc.
The massive earthquake in Wenchuan in 2008 had a significant impact on hydropower projects in the quake zone due to the uncertainty of the earthquake; for example, Zipingpu Power Station experienced an earthquake well above set intensity in this quake. Damage to important hydropower buildings, if caused, would have triggered major secondary disasters. Therefore, the safety of high dams under seismic action must be considered in engineering [
1]. In the existing research on seismic safety of high earth-rock dams, Liu [
2] studied the permanent deformation of the dam foundation and dam body by simulating stochastic ground motions generated by stationary Gaussian filtered white noise; Shao et al. [
3] studied the slope stability of the dam by generating stable stochastic ground motions. With the help of performance-based seismic safety evaluation, Pang [
4] analyzed the deformation and stability law of CFRD comprehensively. In recent years, Liu et al. [
5] proposed a new spectral representation-random function method for the simulation of fully non-stationary ground shaking processes based on random functions, and the validity of the method was verified by comparing the generated mean response spectra with the canonical response spectra. Liang [
6,
7] derived the time-varying power spectrum of non-stationary ground motion processes directly from Priestley’s asymptotic spectral theory. Although many scholars conducted the special characteristics of ground motion, there is relatively little systematic research on the residual deformation of practical high earth-rock dam projects considering the non-stationary stochastic process.
In this paper, we generate 144 ground motions by using the spectral expression-random function method. After the amplitude modulation processing, three-dimensional dynamic calculations are carried out for four practical projects: Gushui, Lava, Dashixia, and Ciha Gorge. Based on deformation performance indicators such as horizontal displacement and vertical settlement, the probability distributions of deformation of each project under different PGA are obtained by GPDEM.
2. Method and Theory
The most critical ground motion response analyses are random ground motion generation and reliability analysis, and these two key steps have many methods to choose from. This paper uses spectral expression-random function to generate ground motion, and the reliability analysis adopts the GPDEM.
2.1. Stochastic Ground Motions
When simulating, there are stationary and non-stationary ground motion methods. The latter method is used when simulating stochastic ground motion during an earthquake. In the actual simulation, one should simulate the stationary ground motion process first, and then use the intensity envelope function to non-stationary [
8]. In this paper, we generate non-stationary ground motion time history curves by a spectral expression-random function model [
9], represented by the formula as:
where
ω =
kΔ
ω, frequency interval Δ
ω should be as small as possible [
3]. In this paper,
N is taken as 1500, Δ
ω is taken as 0.15 rad/s [
4],
is a bilateral power spectral density function, and
and
(
k = 1, 2, …,
n) are sets of standard orthogonal random vectors.
According to random function theory, any two groups of standard orthogonal random variables
and
(
n = 1, 2, …,
n) can be taken as the function of two mutually independent random variables
,
, namely random function:
where
is orthogonal basis function in the interval [0, 2π], and
and
obey uniform distribution, obtained by number theory.
2.2. GPDEM
The most widely used method for structural reliability analysis is Monte Carlo simulation, but this method is computationally intensive and time-consuming, and GPDEM reduces the calculation amount compared with the MCS method and is a more effective calculation method. GPDEM is a research system proposed for probability analysis and reliability calculation of engineering structures by Li and Chen [
10], which is widely used in high-rise frames [
10,
11,
12], aqueducts [
13], and slopes [
14]. At present, the reliability and effectiveness of this method in the seismic field of enormous and complicated geotechnical engineering has been preliminarily proved [
15,
16].
According to the principle of probability conservation, combined with the constitutive and deformation coordination relationship between physical quantities, the equation of GPDEM can be obtained [
17]:
where
refers to the joint probability density function (PDF) of
, in which the source random factors are completely described by
, and
Z refers to the studied physical quantities. The augmented system composed of
is a conservative probability system, which follows the law of probability conservation.
It is worth pointing out that the number of physical quantities studied is equal to the dimension m of this equation. When only a certain response physical quantity is considered, the equation can further degenerate into a one-dimensional partial differential equation:
Equation (4) only has partial differential about
z and
t, while
is a parametric equation that takes a series of deterministic values, that is,
.
can be obtained by solving the physical equation. Meanwhile, the time derivative (velocity)
of the studied physical quantity can also be obtained; that is, when the random parameters are determined by point selection technique, the differential equation is transformed into a set of deterministic dynamic equations, and the engineering structure can be solved by various numerical simulation methods such as finite element method and finite difference method, and Equation (4) is changed into the following series of equations:
The initial conditions of the equation must be known:
The boundary conditions are:
Substitute the initial and boundary conditions into the Equation (5) to obtain the discrete numerical solutions
. Accumulate
to obtain the numerical solutions of
:
3. Finite Element Model and Constitutive Model
3.1. Finite Element Model
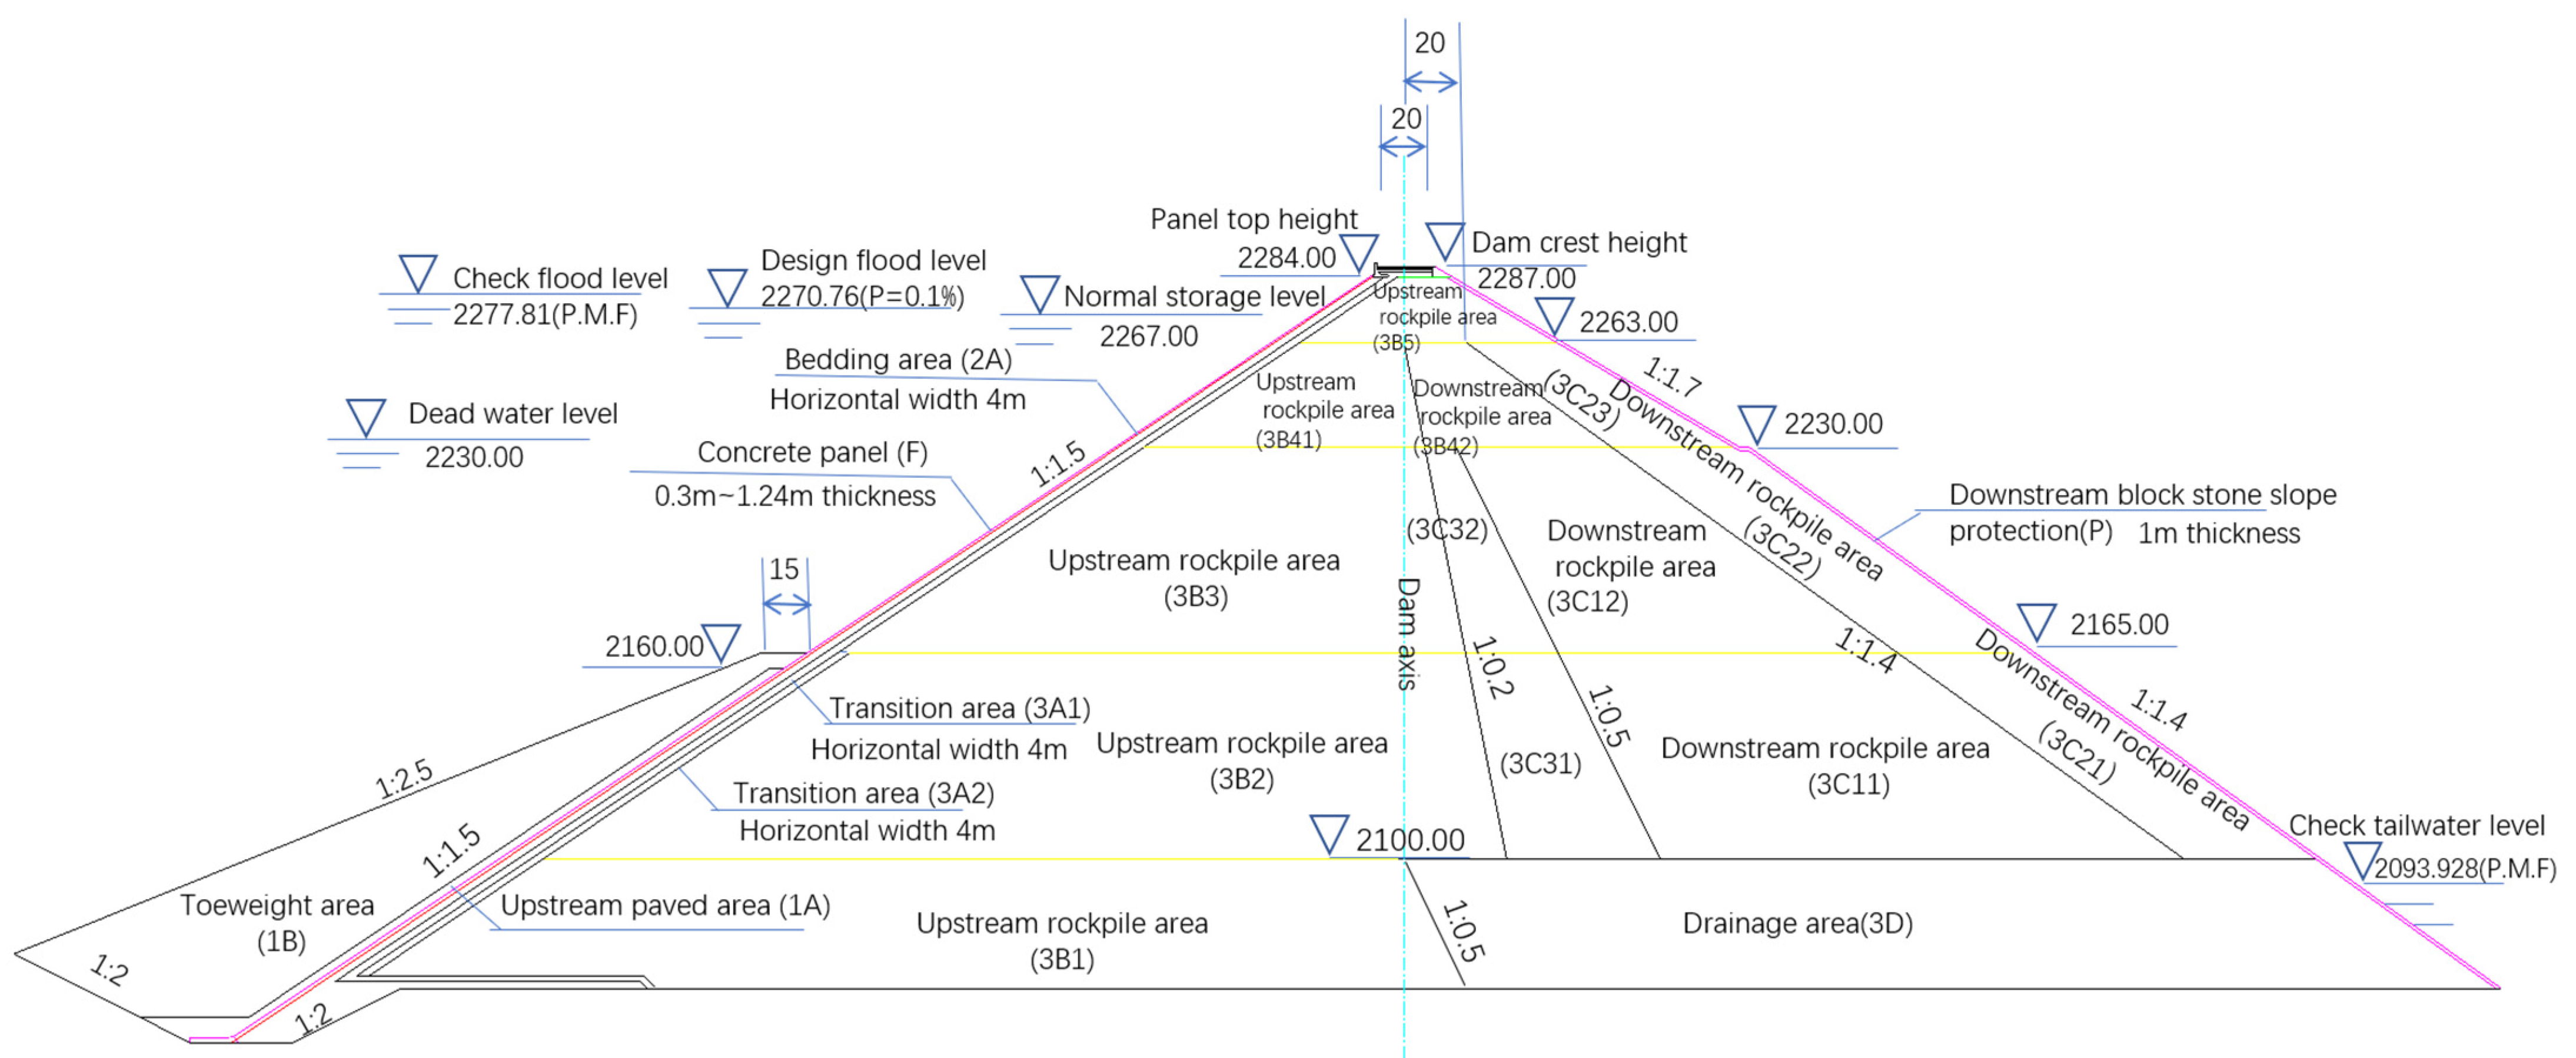
Gushui (240 m), Lava (244 m), Dashixia (247 m), and Ciha Gorge (254 m), four practical CFRD projects, were chosen as the research objects. Taking Gushui as an example and introducing engineering overview, the concrete panel rockfill dam has a crest height of 2287 m, a maximum dam height of 240 m, a crest length of 437 m and a crest width of 20 m, 1:1.5 slope ratio upstream, 1:1.7 (lower) and 1:1.4 (upper) slope downstream. The top elevation of the concrete panel is 2284.00, 0.4~1.24 m in thickness, with a bedding material of 4 m horizontal width and two layers of 4 m horizontal width transition material downstream of the panel. A typical cross-section of the dam for the concrete panel dam design scheme is shown in
Figure 1.
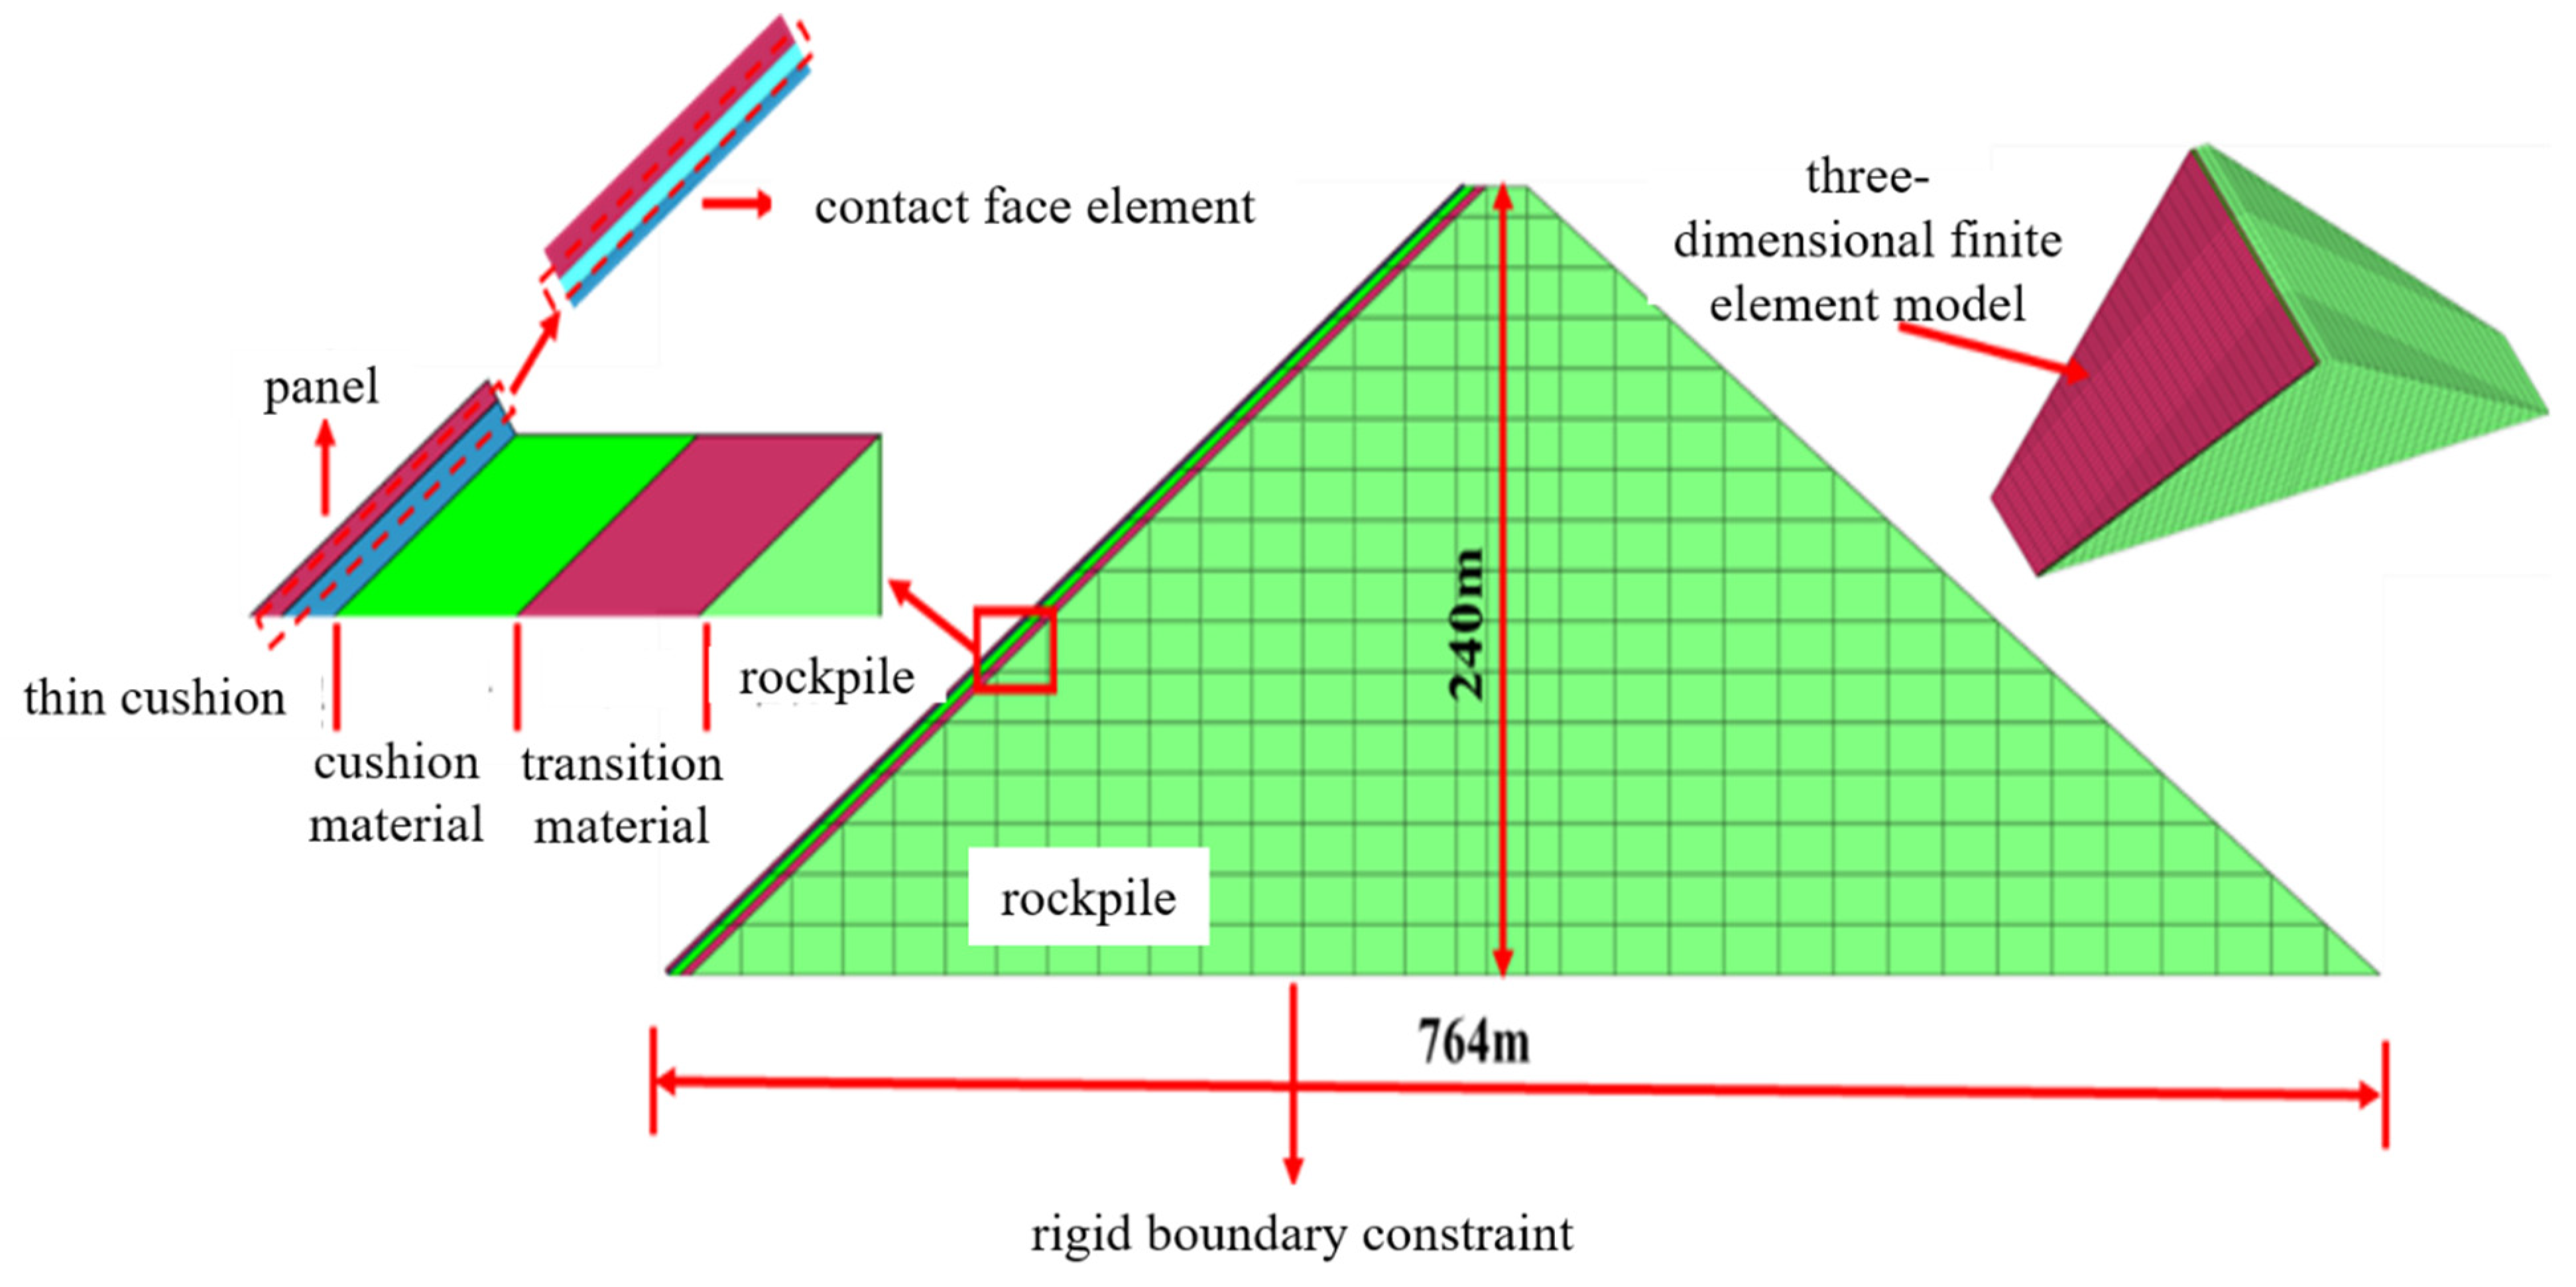
The 3D finite element model is established by referring to the main geometric parameters of the practical project and appropriately simplifying, ignoring the interplay between the foundation and the dam body, and assuming a rigid boundary. The dam elements are simulated by hexahedral isoparametric elements and a small number of degraded tetrahedral elements, and a thickness-free Goodman contact surface element is set between the panel and the cushion, as shown in
Figure 2.
Table 1 shows the finite element mesh model information. The grid size is about 8~10 m in the direction of dam height, which meets the requirements of calculation accuracy according to relevant literature [
18].
3.2. Constitutive Model
The generalized plastic model (GPM) is used to simulate the rockfill, which was improved by Kong et al. [
19]. The model considers the pressure correlation of the dam material, which can analyze the static and dynamic process of the dam body with only one set of parameters. In this study, the rockpile material, cushion material, and transition material are uniformly simulated by the GPM. The contact surface adopts the generalized plastic contact surface model [
20]. The panel adopts linear elastic model. The bedrock is simulated by linear elastic model. The dynamic water pressure on the panel is simulated by the additional mass method.
Table 2,
Table 3 and
Table 4 show the material parameters. The specific meaning of the parameters in the table and the acquisition refer to the article by Kong and Liu et al. [
21,
22].
Significantly, the focus of this paper is the randomness of ground motion and the constitutive parameters of materials. The four models use a set of parameters in static and dynamic calculations.
4. Stochastic Ground Motion Generation and Calculation Conditions
The key step of stochastic dynamic analysis is to generate stochastic ground motion. The method in
Section 2.1 is used in this paper. Combined with the latest hydraulic seismic code spectrum [
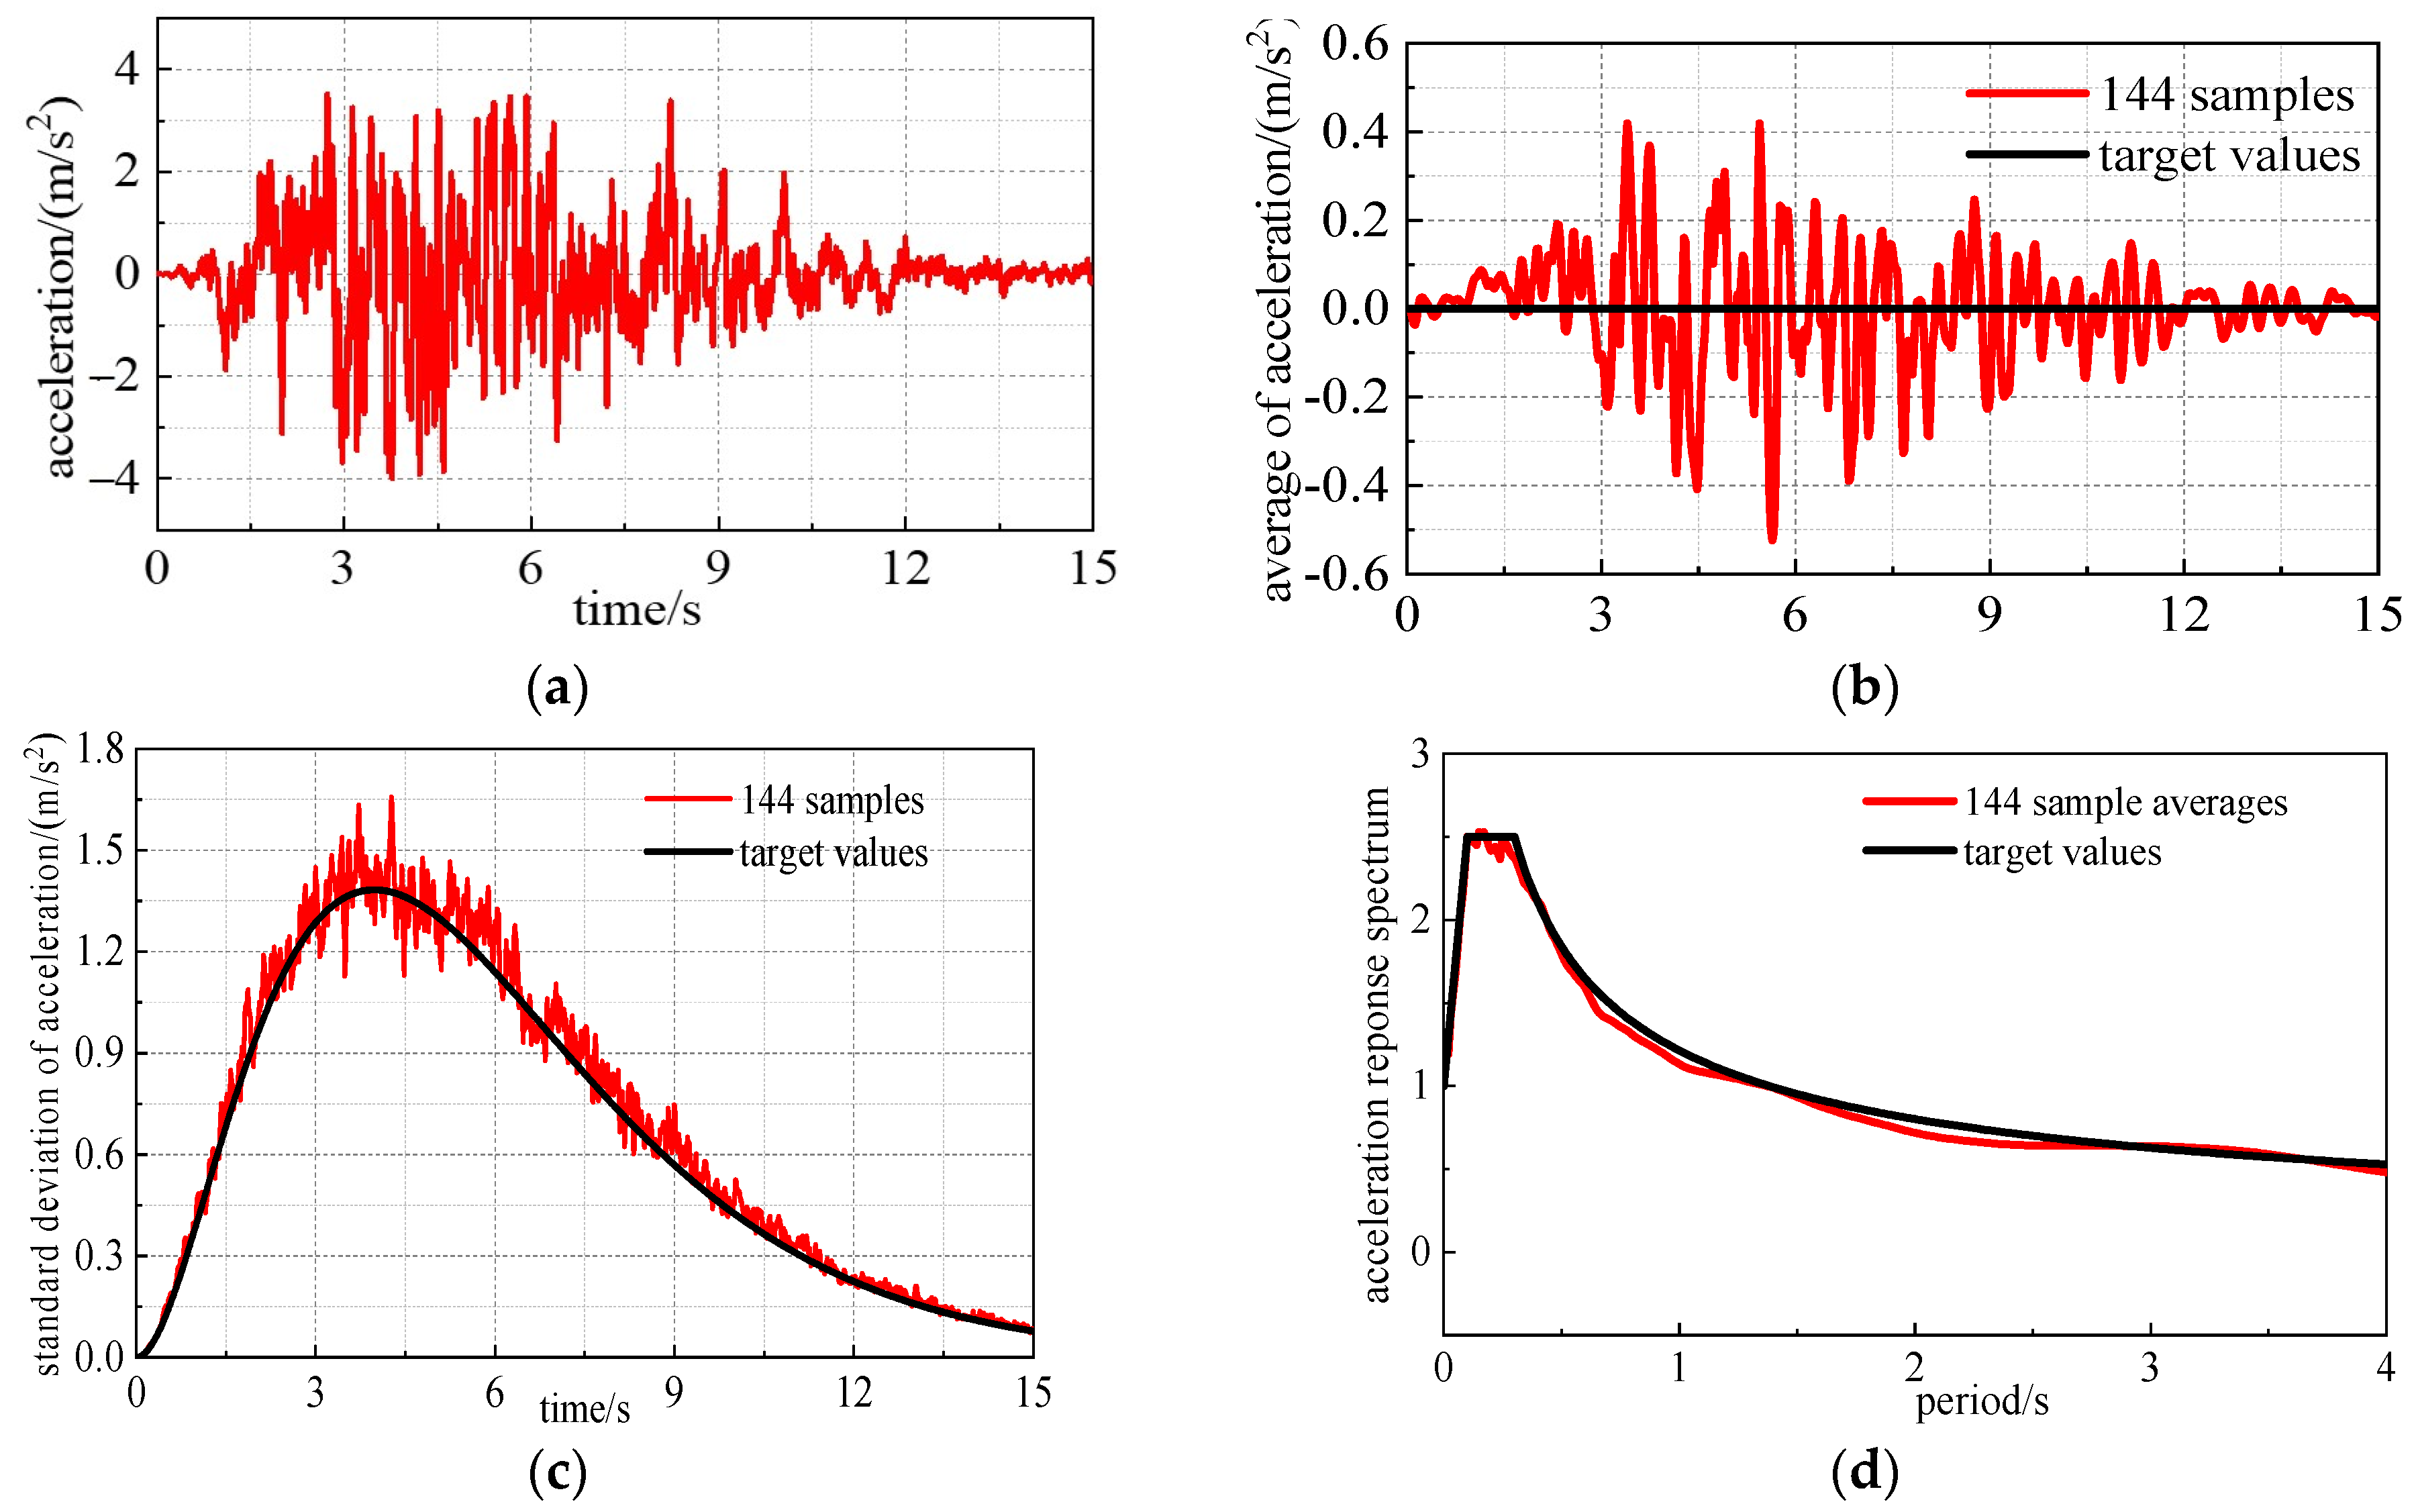
23], 144 stochastic ground motion sample time histories are generated. The maximum acceleration PGA of each group of ground motion time histories is 0.1~1.0 g, and the amplitude modulation interval is 0.1 g. Dynamic calculations are carried out for four projects with a total of 5760 calculation conditions in this paper. Taking PAG = 0.4 g as an example, the characteristic values of 144 random ground motion samples are shown in
Figure 3.
Figure 3 shows that there is little difference between the generated ground motion samples and target value.
Significantly, the consistent input method is adopted in this study, and the ground motion is input in three directions, in which the vertical seismic acceleration is considered as 2/3 of the horizontal direction.
5. Calculation Results and Analysis
Through systematic stochastic dynamic calculation, the results of four projects are obtained. Considering that there are many projects and working conditions used in this paper, which cannot be analyzed one by one, and the dam heights of the four projects are similar, this section takes the results of the Gushui project as a representative to analyze.
5.1. Acceleration Analysis
Studies of dam damage have shown that an important cause of dam damage is the seismic inertia forces generated by acceleration and that the acceleration response of dams and their distribution laws are one of the basic bases for evaluating the seismic response characteristics of earth and rock dams [
24].
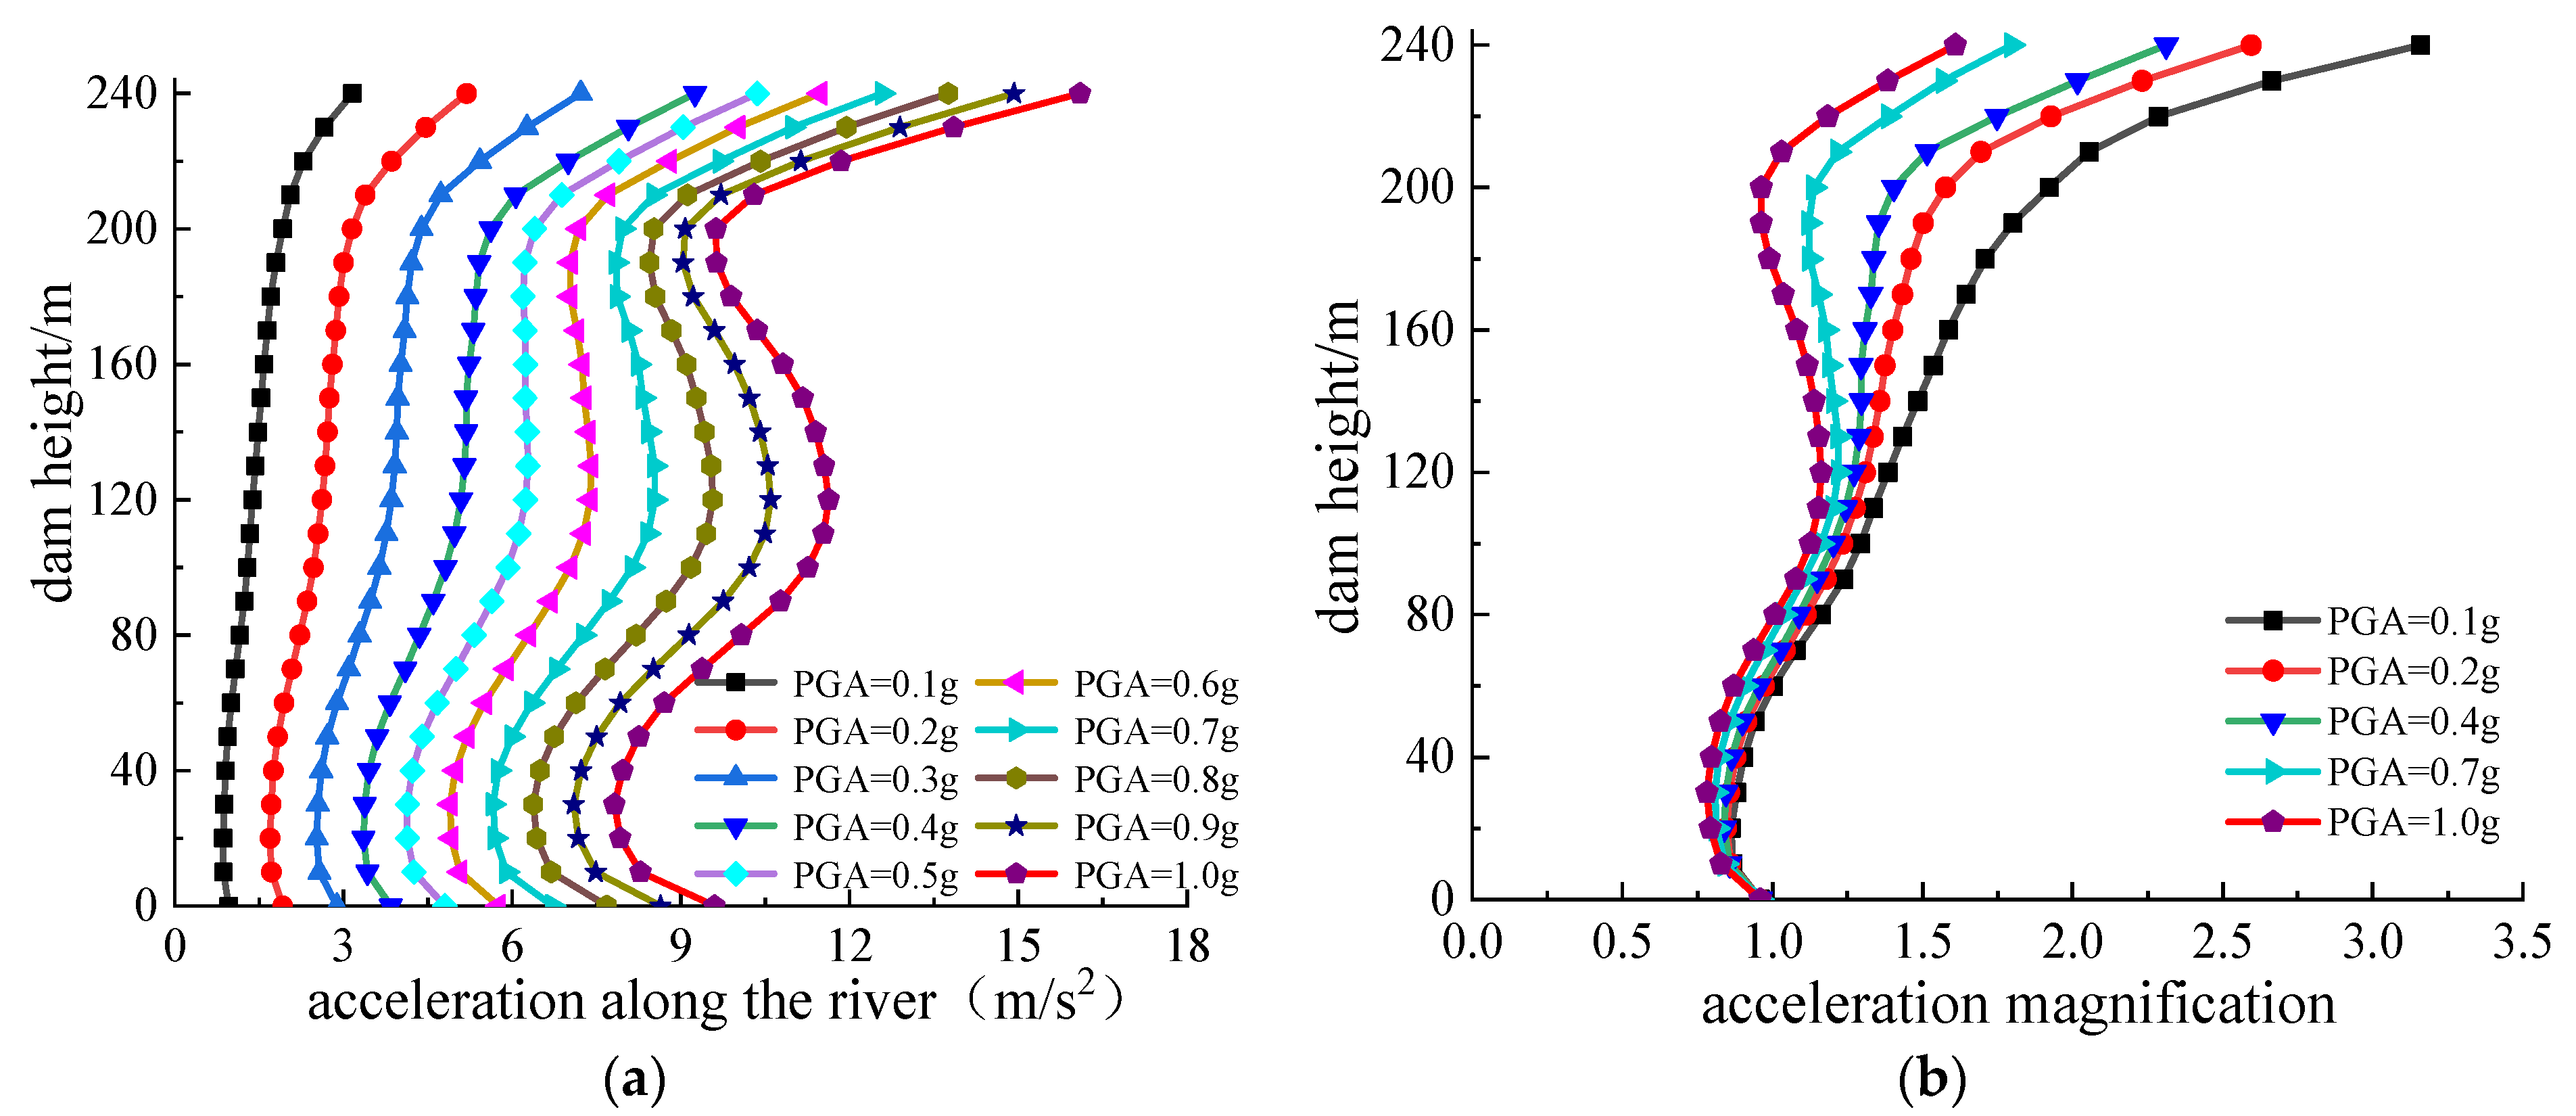
The distribution of the acceleration average value along the river and the amplification of the acceleration along the dam height under different earthquake intensities are shown in
Figure 4. The figure shows that the acceleration law of the dam body is similar under different earthquake intensities, showing obvious whip effect, and as the earthquake intensity increases, the acceleration amplification decreases gradually.
5.2. Analysis of Deformation Results
Many experiments have shown that the acceleration response in the upper part of a dam is often greater due to the amplification effect of the dam structure on seismic waves. Under seismic action, dam damage often starts at the top of the dam first [
25]. The permanent deformation of earth and rock dams under seismic loading can directly determine the seismic safety of the dam, so the displacement of the dam crest is an important basis for assessing the seismic safety of earth and rock dams [
26].
Figure 5a,b shows the distribution of the horizontal and vertical residual displacement of the dam body along the dam height under the action of 144 stochastic ground motions with PGA = 0.4 g, in which the red line is the deformation average value of multiple ground motions. As can be seen, there are great differences in the distribution of the horizontal and vertical residual displacement caused by different ground motions, but the trend of the law is similar. As the dam height increases, and the residual displacement increases gradually, reaching the maximum at the dam crest, which is consistent with the point distribution as below.
Figure 5c,d presents the distribution of the average horizontal and vertical residual displacement of the dam along the dam height under different ground motion intensities. The figure shows that with the increase of PGA, the vertical displacement also increases gradually, but the growth rate levels off.
Figure 6 shows the probability density curve, probability density evolution surface, and probability density evolution isoline of the dam crest deformation response at a typical time under 0.4 g. The results show that the probability distribution of deformation is neither normal nor lognormal, as usually assumed, but an irregular probability curve. The probability density surface shows the characteristics of mountain-like peaks and valleys, and the isolines flow like “water waves”. This is the result of the irregular flow of probability in space. The probability evolution of deformation reveals the transmission process of probability information, which shows that it is reasonable to apply stochastic dynamic analysis method to study the deformation response of high CFRD under ground motion.
Figure 7 shows the exceedance probability curve of horizontal and vertical residual displacement of dam crest under various strengths obtained from the evolution of the probability density of the Gushui project under the condition of equivalent extreme value. According to the results in the figure, the exceedance probability of horizontal residual displacement or vertical residual deformation can be obtained.
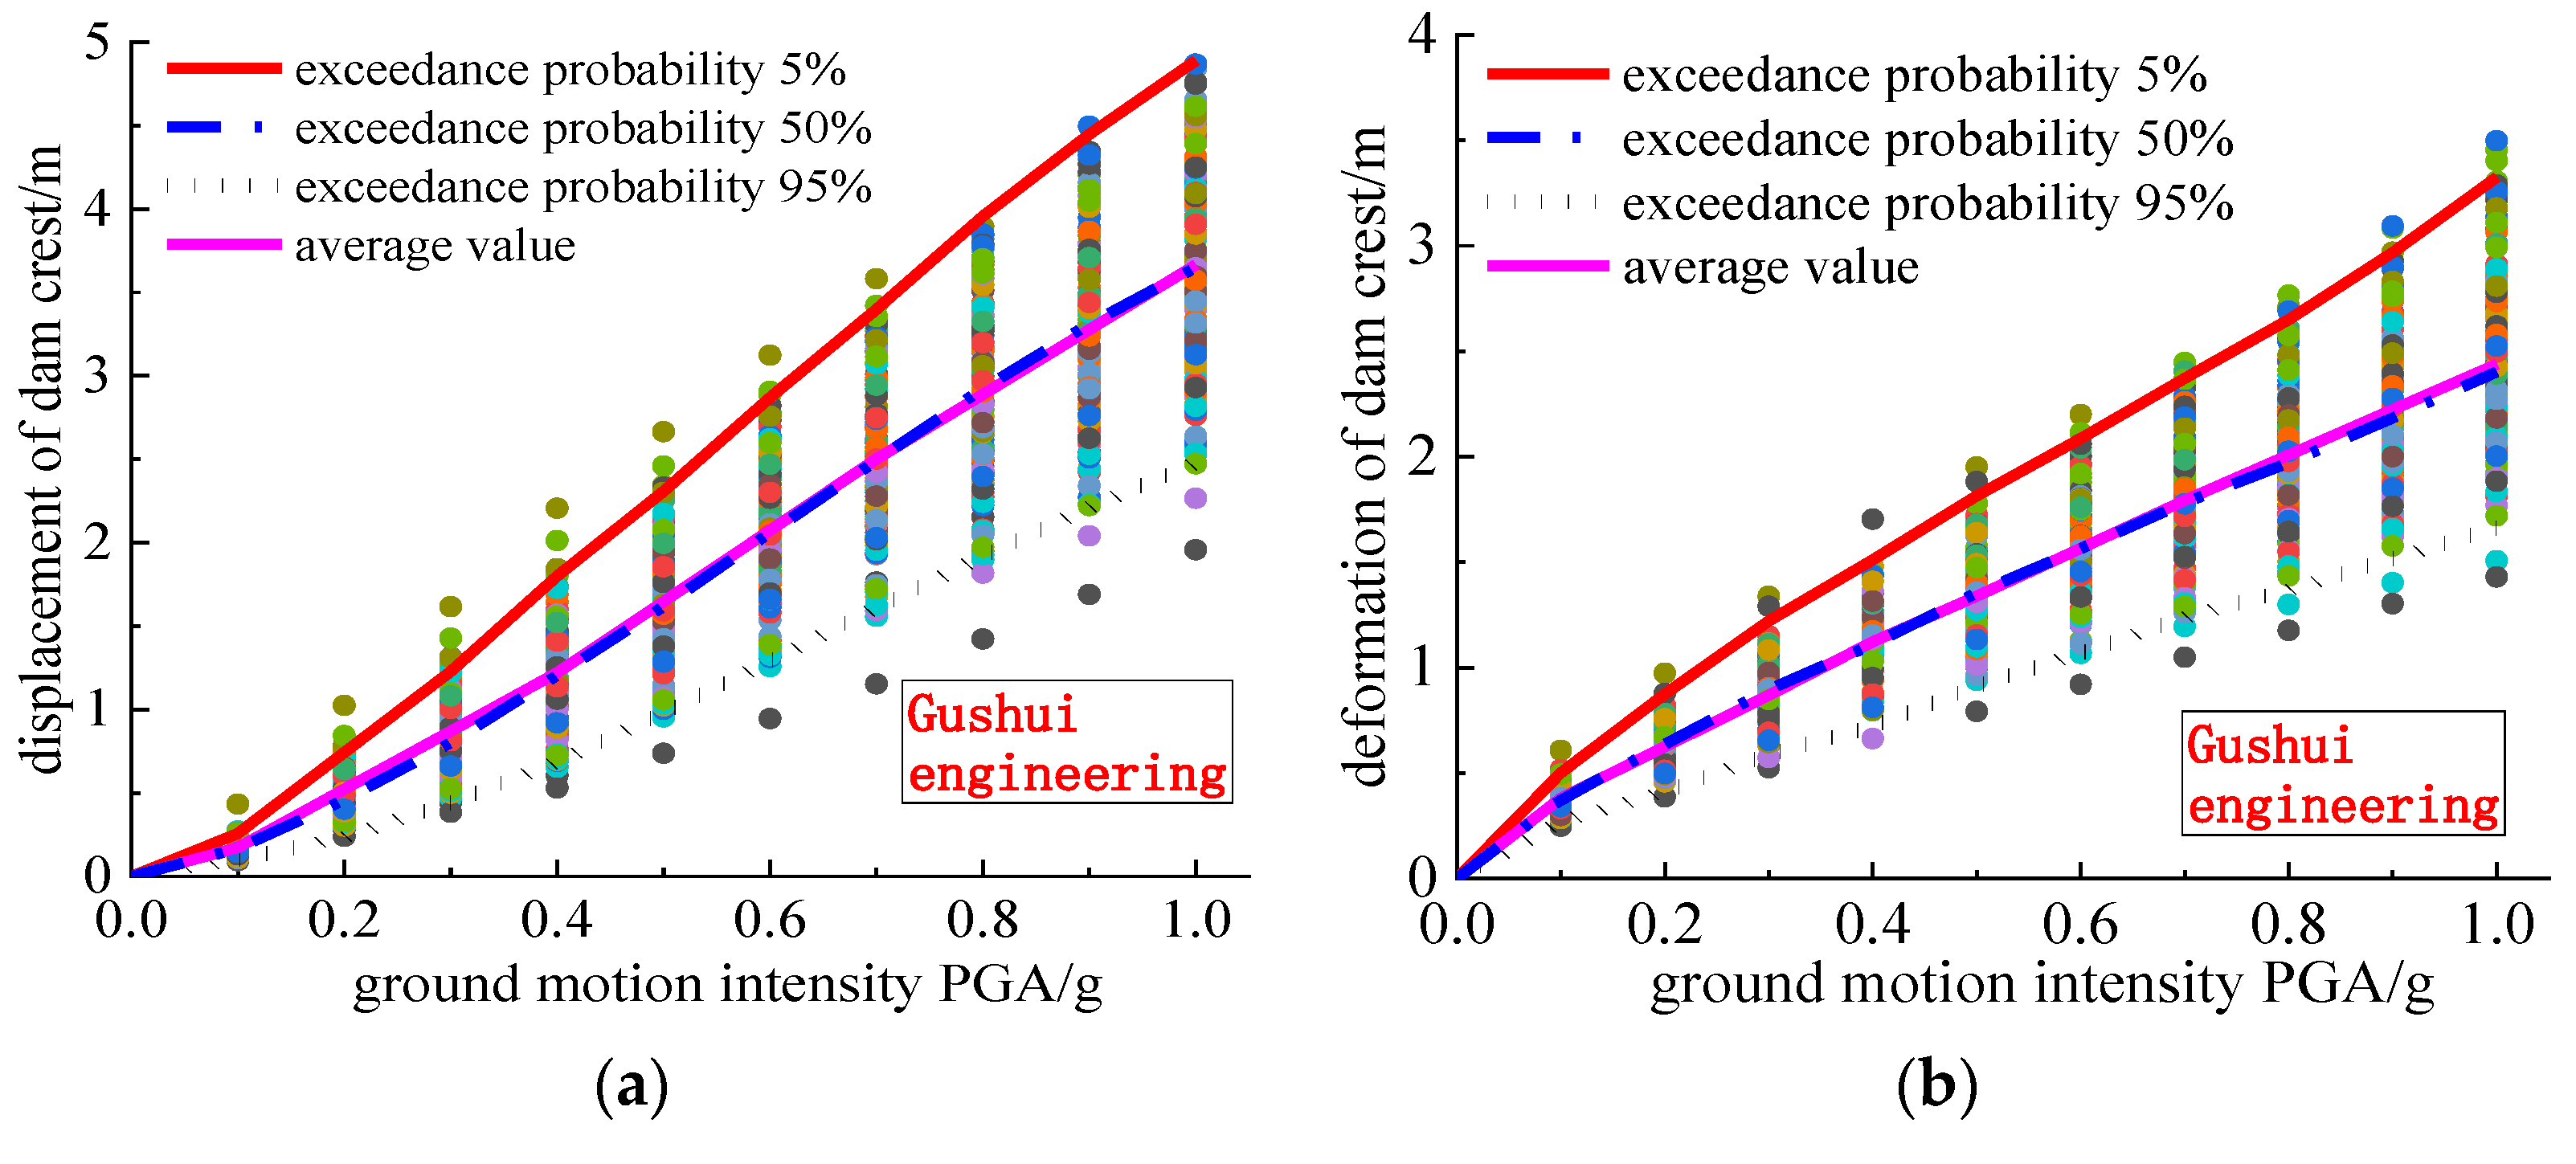
Figure 8 is the scatter diagram of residual deformation under different PGAs and the trend line of deformation value under a specific probability. As can be seen from the figure, both horizontal and vertical residual deformation show great discreteness, and the maximum value of vertical residual deformation is about 2~3.5 times of the minimum value. In addition, the curve composed of the corresponding values of 5% and 95% exceedance probability under different PGA envelops most of the scatter results; furthermore, the average value distribution is consistent with the variation law of the 50% exceedance probability curve, indicating that the stochastic ground motion follows a good statistical law.
Based on the exceedance probability curve, with the exceedance probability of 95% and 5% as the control range, the variation range of residual deformation of the Gushui project can be obtained, as shown in
Table 5 below. The data in the table can provide a reference for the deformation value of Gushui engineering.
Similarly, the calculation results and probability density distribution laws of three projects, including Lava, Dashixia, and Ciha Gorge, can be obtained respectively and will not be analyzed one by one here. From the results of the above four projects, the overall law of the exceedance probability of the dam body residual deformation is similar, and the results are not much different. Furthermore, the maximum residual displacement values of most of the calculation results are within the corresponding value range of the exceedance probability of 95% and 5%. Taking the exceedance probability of 95% and 5% as the limit value, the horizontal and vertical residual deformation ranges of the dam crest of the four models under different ground motion intensities can be obtained, as shown in
Table 5,
Table 6,
Table 7 and
Table 8.
5.3. Deformation of 250 m Concrete Face Rockfill Dam
Based on the above analysis, taking the exceedance probability of 95% and 5% as the control standard, the variation ranges of horizontal and vertical residual displacements of Gushui, Lava, Dashixia, and Ciha Gorge can be obtained, respectively, which can provide specific references for each project. Comparing the calculation results of different projects, it is found that the numerical results of the four projects and the laws are similar under different intensity earthquakes, in which the average value of horizontal residual displacement and vertical residual displacement is basically consistent with the corresponding value of 50% exceedance probability.
Considering that the dam heights of the four projects are similar, which are all about 250 m, the average values of the results of the four dams are taken as the recommended deformation values of the 250 m grade concrete face rockfill dam, as shown in
Table 9. The results are as follows: when the PGA is 0.1~1.0 g (with an interval of 0.1 g), the horizontal residual displacement ranges of the dam crest are 0.10~0.26 m, 0.24~0.73 m, 0.44~1.22 m, 0.67~1.80 m, 0.97~2.33 m, 1.29~2.90 m, 1.64~3.42 m, 1.93~3.98 m, 2.25~4.48 m, and 2.54~4.92 m, respectively; the vertical residual displacement ranges of the dam crests are 0.26~0.49 m, 0.42~0.86 m, 0.58~1.21 m, 0.73~1.53 m, 0.90~1.85 m, 1.08~2.15 m, 1.28~2.48 m, 1.43~2.79 m, 1.59~3.13 m, and 1.74~3.49 m. The deformation of the rockfill dam is an important aspect affecting the safety of a high face rockfill dam [
27,
28]. Considering that many scholars [
29,
30,
31,
32,
33,
34] taking the seismic settlement rate of 1.0~1.1% as the ultimate seismic standard, the corresponding vertical deformation of 250 m dam is about 2.5 m. If considering the randomness of ground motion and taking the exceedance probability of 95% as the seismic capacity standard, it can be seen from the above results that the standard value of vertical settlement under the strength of 0.7 g is 2.48 m, the standard value of vertical settlement under the seismic intensity of 0.8 g is 2.79 m, and the seismic settlement rate is 1.11%. Therefore, within the range of material parameters used in this paper, the ultimate seismic capacity of the 250 m-level CFRD is PGA = 0.7~0.8 g.
6. Conclusions
Considering the non-stationarity and randomness of ground motion in this paper, ground motions are generated by spectral expression-random function method. The rockfill material adopts GPM to calculate the stochastic dynamics of four 3D models, including Gushui, Lava, Dashixia, and Ciha Gorge, respectively. The PDEM and extreme value distribution theory are adopted, and the acceleration and deformation laws of four projects are analyzed. Three conclusions can be drawn:
- (1)
The distribution law of acceleration and residual deformation of the Gushui concrete face rockfill dam is studied. The acceleration magnification of the crest of the 250 m high concrete face rockfill dam is close to 2.5 times, and the acceleration magnification gradually decreases with the increase of earthquake intensity.
- (2)
Through the stochastic dynamic analysis of four 250 m level three-dimensional models of Gushui, Lava, Dashixia, and Ciha Gorge, the horizontal and vertical residual deformation values for the four high CFRDs are obtained for each exceedance probability under seismic action. The reference values can be selected from the summary table according to actual needs in the project. The recommended range for the horizontal and vertical residual deformation of 250 m high CFRDs 0.1~1.0 g ground motion is 2.48~2.79 m.
- (3)
Taking the seismic subsidence rate of 1.0~1.1% as the ultimate seismic standard corresponding to the vertical deformation of the 250 m dam of about 2.5 m and taking the probability of exceeding 95% as the seismic capacity standard, the seismic capacity of the 250 m panel rockfill dam is PGA = 0.7~0.8 g.
Author Contributions
Methodology, Y.Y.; Data curation, R.P. and Z.R.; Visualization, R.P. and Z.R. All authors have read and agreed to the published version of the manuscript.
Funding
This work was supported by National Key R&D Program of China (2021YFB2601102), China National Natural Science Foundation (Grant Nos. 52009017, 51979026, 51890915), Fundamental Research Funds for the Central Universities (DUT21TD106, DUT21RC(3)107), Liaoning Province Science Foundation (2020-BS-06), and Hebei Key Laboratory of Earthquake Disaster Prevention and Risk Assessment (Grant NO. FZ213201). These financial supports are gratefully acknowledged.
Data Availability Statement
All data, models or code generated or used during the study are available from the corresponding author by request.
Conflicts of Interest
The authors declare no conflict of interest.
References
- Chen, S.; Fu, Z.; Wei, K.; Han, H. Seismic responses of high concrete face rockfill dams: A case study. Water Sci. Eng. 2016, 9, 195–204. [Google Scholar] [CrossRef] [Green Version]
- Liu, H. Analysis of permanent deformation of foundation and earth rock dam under random earthquake. J. Geotech. Eng. 1996, 18, 19–27. [Google Scholar]
- Shao, L.; Tang, H.; Kong, X. Stability analysis of earth rock dam slope under random earthquake. J. Water Conserv. 1999, 30, 66–71. [Google Scholar] [CrossRef]
- Pang, R.; Xu, B.; Zou, D. Stochastic seismic performance assessment of high CFRDs based on generalized probability density evolution method. Comput. Geotech. 2018, 97, 233–245. [Google Scholar] [CrossRef]
- Xu, J.; Li, Y.; Mao, J.; Yu, Z.; Tan, S. Dynamic response and reliability analyses of non-linear structures driven by non-stationary non-Gaussian stochastic ground motions. Eng. Struct. 2022, 268, 114689. [Google Scholar] [CrossRef]
- Chen, Z.; Zheng, S.; Zhang, J.; Dang, C.; Wei, K.; Li, X. Efficient seismic reliability analysis of non-linear structures under non-stationary ground motions. Soil Dyn. Earthq. Eng. 2020, 139, 106385. [Google Scholar] [CrossRef]
- Liu, Z.; Ruan, X.; Liu, Z.; Lu, H. Probability density evolution analysis of stochastic nonlinear structure under non-stationary ground motions. Struct. Infrastruct. Eng. 2019, 15, 1049–1059. [Google Scholar] [CrossRef]
- Liu, Z.; Liu, W.; Peng, Y. Random function based spectral representation of stationary and non-stationary stochastic processes. Probabilistic Eng. Mech. 2016, 45, 115–126. [Google Scholar] [CrossRef]
- Li, J.; Chen, J.; Fan, W. The equivalent extreme-value event and evaluation of the structural system reliability. Struct. Saf. 2007, 29, 112–131. [Google Scholar] [CrossRef]
- Chen, J.; Li, J. The extreme value distribution and dynamic reliability analysis of nonlinear structures with uncertain parameters. Struct. Saf. 2006, 29, 77–93. [Google Scholar] [CrossRef]
- Xian, J.; Su, C.; Guo, H. Seismic reliability analysis of energy-dissipation structures by combining probability density evolution method and explicit time-domain method. Struct. Saf. 2021, 88, 102010. [Google Scholar] [CrossRef]
- Liu, Z.; Li, J. Seismic reliability analysis of structures based on probability density evolution theory. Vib. Shock. 2009, 28, 1–4. [Google Scholar] [CrossRef]
- Zhang, C.; Xu, J.; Qian, Y.; Zhang, J.; Wang, R.; Wang, B. Seismic reliability analysis of random parameter aqueduct structure under random earthquake. Soil Dyn. Earthq. Eng. 2022, 153, 107083. [Google Scholar] [CrossRef]
- Pang, R.; Xu, B.; Zhou, Y.; Song, L. Seismic time-history response and system reliability analysis of slopes considering uncertainty of multi-parameters and earthquake excitations. Comput. Geotech. 2021, 136, 104245. [Google Scholar] [CrossRef]
- Pang, R.; Zhou, Y.; Chen, G.; Jing, M.; Yang, D. Stochastic mainshock-aftershock simulation and its applications in dynamic reliability of structural systems via DPIM. J. Eng. Mech. 2021, 136, 104245. [Google Scholar] [CrossRef]
- Li, Y.; Pang, R.; Xu, B.; Wang, X.; Fan, Q.; Jiang, F. GPDEM-based stochastic seismic response analysis of high concrete-faced rockfill dam with spatial variability of rockfill properties based on plastic deformation. Comput. Geotech. 2021, 139, 104416. [Google Scholar] [CrossRef]
- Xu, J.; Feng, D. Stochastic dynamic response analysis and reliability assessment of non-linear structures under fully non-stationary ground motions. Struct. Saf. 2019, 79, 94–106. [Google Scholar] [CrossRef]
- Mao, W. Three Dimensional Dynamic Response Analysis of High Earth Rock Dam in Strong Earthquake Area. Master’s Thesis, Dalian University of Technology, Dalian, China, 2008. [Google Scholar]
- Zou, D.; Xu, B.; Kong, X.; Liu, J.; Zhou, Y. Static and Dynamic Analysis of High Concrete Face Rockfill Dam Based on Generalized Plastic Model; Professional Committee of Earthquake Resistance and Disaster Prevention of China Hydropower Engineering Society; China Hydropower Engineering Society: Dalian, China, 2011; Volume 7. [Google Scholar]
- Liu, J.; Zou, D.; Kong, X. A three-dimensional state-dependent model of soil–structure interface for monotonic and cyclic loadings. Comput. Geotech. 2014, 61, 166–177. [Google Scholar] [CrossRef]
- Kong, X.; Zou, D.; Xu, B.; Zhou, Y.; Liu, J. Three-dimensional finite element elastoplastic analysis of Zipingpu panel rockfill dam. J. Hydropower 2013, 32, 213–222. [Google Scholar]
- Liu, H.; Ling, H. Constitutive description of interface behavior including cyclic loading and particle breakage within the framework of critical state soil mechanics. Int. J. Numer. Anal. Methods Geomech. 2008, 32, 1495–1514. [Google Scholar] [CrossRef]
- GB51247-2018; Seismic Design Standards for Hydraulic Buildings. Ministry of Housing and Urban-Rural Development of China: Beijing, China, 2018. (In Chinese)
- Liu, X.; Wang, Z.; Wang, X. Shaking Table Model Test and Dynamic Analysis of Concrete Face Dam; China Water & Power Press: Beijing, China, 2005. [Google Scholar]
- Kong, X.; Zou, D.; Deng, X.; Liu, Y. Comprehensive earthquake resistant measure of high earth-rockfill dams and effectiveness verification. J. Hydraul. Eng. 2006, 37, 1489–1495. [Google Scholar] [CrossRef]
- Singh, R.; Roy, D. Estimation of earthquake-induced crest settlements of embankments. Am. J. Eng. Appl. Sci. 2009, 2, 515–525. [Google Scholar] [CrossRef]
- Pang, R.; Xu, B.; Zhou, Y.; Zhang, X.; Wang, X. Fragility analysis of high CFRDs subjected to mainshock-aftershock sequences based on plastic failure. Eng. Struct. 2020, 206, 110152. [Google Scholar] [CrossRef]
- Zhou, Y. Seismic Damage Analysis and Seismic Countermeasures of Zipingpu Concrete Faced Rockfill Dam in Wenchuan Earthquake. Ph.D. Thesis, Dalian University of Technology, Dalian, China, 2012. [Google Scholar]
- Swaisgood, J.R. Embankment dam deformations caused by earthquakes. In Proceedings of the 2003 Pacific Conference on Earthquake Engineering, Christchurch, New Zealand, 13–15 February 2003. [Google Scholar]
- Liu, J.; Liu, B.; Kong, X. Estimation of earthquake-induced crest settlements of earth and rock-fill dams. J. Hydropower 2012, 31, 183–191. [Google Scholar]
- Kong, X.; Pang, R.; Zou, D.; Xu, B.; Zhou, Y. Seismic performance evaluation of high CFRDs based on incremental dynamic analysis. J. Geotech. Eng. 2018, 40, 978–984. [Google Scholar] [CrossRef]
- Wang, D.; Liu, H.; Yu, T. Seismic risk analysis of earth rock dam based on deformation. Mech. Rock Soil 2012, 33, 1479–1484. Available online: http://ytlx.whrsm.ac.cn/EN/abstract/abstract11146.shtml (accessed on 1 June 2022).
- Chen, S.; Li, G.; Fu, Z. Study on seismic safety control standard and ultimate seismic capacity of high earth rock dam. J. Geotech. Eng. 2013, 30, 59–65. [Google Scholar]
- Wang, D.; Liu, H.; Tao, Y. Seismic vulnerability analysis of earth rock dam based on deformation. J. Geotech. Eng. 2013, 35, 814–819. [Google Scholar] [CrossRef]
Figure 1.
Cross section of Gushui.
Figure 1.
Cross section of Gushui.
Figure 2.
3D finite element model of Gushui CFRD.
Figure 2.
3D finite element model of Gushui CFRD.
Figure 3.
Comparison of time history, average value, standard deviation, and response spectrum of representative samples with target values. (a) Single sample time history (b) Average value of acceleration of single sample time history, (c) Standard deviation (d) Acceleration response spectrum.
Figure 3.
Comparison of time history, average value, standard deviation, and response spectrum of representative samples with target values. (a) Single sample time history (b) Average value of acceleration of single sample time history, (c) Standard deviation (d) Acceleration response spectrum.
Figure 4.
The average value of the maximum acceleration along the river at the dam crest and distribution of acceleration magnification along the dam height under different seismic intensities. (a) Acceleration (b) Acceleration magnification.
Figure 4.
The average value of the maximum acceleration along the river at the dam crest and distribution of acceleration magnification along the dam height under different seismic intensities. (a) Acceleration (b) Acceleration magnification.
Figure 5.
Distribution of horizontal residual displacement and vertical residual displacement along dam height under different earthquake intensities. (a) Horizontal residual displacement along dam height with PGA = 0.4 g (b) Vertical residual displacement along dam height with PGA = 0.4 g (c) Horizontal residual displacement along dam height under different earthquake intensities (d) Vertical residual displacement along dam height under different earthquake intensities.
Figure 6.
Probability evolution information of horizontal displacement and vertical displacement of dam crest. (a) Probability density curve of horizontal displacement at typical time (b) Probability density evolution surface of horizontal displacement (c) Probability density evolution isoline of horizontal displacement (d) Probability density curve of vertical displacement at typical time (e) Probability density evolution surface of vertical displacement (f) Probability density evolution isoline of vertical displacement.
Figure 7.
Exceedance probability of horizontal and vertical residual deformation of dam crest. (a) Exceedance probability curve of horizontal residual displacement (b) Exceedance probability curve of vertical residual displacement.
Figure 7.
Exceedance probability of horizontal and vertical residual deformation of dam crest. (a) Exceedance probability curve of horizontal residual displacement (b) Exceedance probability curve of vertical residual displacement.
Figure 8.
Maximum scattered point distribution of dam crest under different PGAs and the trend line of deformation. (a) Maximum scattered point distribution of horizontal residual deformation (b) Maximum scattered point distribution of horizontal and vertical residual deformation.
Figure 8.
Maximum scattered point distribution of dam crest under different PGAs and the trend line of deformation. (a) Maximum scattered point distribution of horizontal residual deformation (b) Maximum scattered point distribution of horizontal and vertical residual deformation.
Table 1.
Finite element computational model.
Table 2.
Parameters of GPM of rockfill.
Table 2.
Parameters of GPM of rockfill.
| G0 | K0 | Mg | Mf | αf | αg | H0 | HU0 | ms | mv | ml | mu | rd | γDM | γu | β0 | β1 |
|---|
| 1000 | 1400 | 1.8 | 1.38 | 0.45 | 0.40 | 1800 | 3000 | 0.5 | 0.5 | 0.2 | 0.2 | 180 | 50 | 4 | 35 | 0.022 |
Table 3.
Parameters of generalized plastic contact surface model.
Table 3.
Parameters of generalized plastic contact surface model.
| Ds0/kPa | Dn0/kPa | Mc | er | λ | a/kPa0.5 | b | c |
|---|
| 1000 | 1500 | 0.88 | 0.4 | 0.091 | 5000 | 1.38 | 0.1 |
| a | rd | km | Mf | k | H0/kPa | fh | t/m |
| 0.65 | 0.2 | 0.6 | 0.65 | 0.5 | 8500 | 2 | 0.1 |
Table 4.
Panel linear elastic parameters.
Table 4.
Panel linear elastic parameters.
| ρ/(kg/m3) (kg/m3) | E/Pa | μ |
|---|
| 2400 | 3.1 × 10^10 | 0.167 |
Table 5.
Horizontal and vertical residual deformation of dam crest corresponding to each exceedance probability under different ground motions of Gushui project.
Table 5.
Horizontal and vertical residual deformation of dam crest corresponding to each exceedance probability under different ground motions of Gushui project.
| Exceedance Probability | Ground Motion Intensity PGA |
|---|
| 0.1 g | 0.2 g | 0.3 g | 0.4 g | 0.5 g | 0.6 g | 0.7 g | 0.8 g | 0.9 g | 1.0 g |
|---|
| Horizontal displacement/m | Average value | 0.173 | 0.522 | 0.871 | 1.221 | 1.648 | 2.075 | 2.502 | 2.889 | 3.277 | 3.665 |
| 5% | 0.258 | 0.744 | 1.229 | 1.800 | 2.308 | 2.870 | 3.400 | 3.957 | 4.449 | 4.890 |
| 50% | 0.167 | 0.459 | 0.802 | 1.206 | 1.619 | 2.060 | 2.494 | 2.924 | 3.312 | 3.650 |
| 95% | 0.100 | 0.235 | 0.442 | 0.685 | 0.982 | 1.289 | 1.611 | 1.917 | 2.213 | 2.478 |
| Verticaldisplacement/m | Average value | 0.381 | 0.625 | 0.869 | 1.123 | 1.339 | 1.566 | 1.793 | 2.008 | 2.224 | 2.439 |
| 5% | 0.502 | 0.875 | 1.222 | 1.512 | 1.815 | 2.087 | 2.372 | 2.651 | 2.968 | 3.325 |
| 50% | 0.377 | 0.636 | 0.897 | 1.111 | 1.356 | 1.564 | 1.782 | 1.973 | 2.184 | 2.402 |
| 95% | 0.271 | 0.412 | 0.588 | 0.721 | 0.915 | 1.069 | 1.239 | 1.368 | 1.517 | 1.663 |
Table 6.
Horizontal and vertical residual deformation of dam crest corresponding to each exceedance probability of Lava model under different ground motions.
Table 6.
Horizontal and vertical residual deformation of dam crest corresponding to each exceedance probability of Lava model under different ground motions.
| Exceedance Probability | Ground Motion Intensity PGA |
|---|
| 0.1 g | 0.2 g | 0.3 g | 0.4 g | 0.5 g | 0.6 g | 0.7 g | 0.8 g | 0.9 g | 1.0 g |
|---|
| Horizontal displacement/m | Average value | 0.170 | 0.563 | 0.956 | 1.348 | 1.795 | 2.242 | 2.689 | 3.070 | 3.450 | 3.831 |
| 5% | 0.260 | 0.794 | 1.310 | 1.922 | 2.438 | 3.010 | 3.527 | 4.070 | 4.519 | 4.895 |
| 50% | 0.166 | 0.503 | 0.882 | 1.335 | 1.774 | 2.246 | 2.695 | 3.139 | 3.518 | 3.828 |
| 95% | 0.094 | 0.269 | 0.511 | 0.803 | 1.130 | 1.477 | 1.828 | 2.167 | 2.479 | 2.748 |
| Vertical displacement/m | Average value | 0.349 | 0.609 | 0.869 | 1.129 | 1.384 | 1.640 | 1.895 | 2.136 | 2.377 | 2.617 |
| 5% | 0.470 | 0.816 | 1.180 | 1.554 | 1.892 | 2.228 | 2.564 | 2.915 | 3.264 | 3.614 |
| 50% | 0.345 | 0.586 | 0.844 | 1.113 | 1.365 | 1.620 | 1.874 | 2.115 | 2.345 | 2.574 |
| 95% | 0.234 | 0.396 | 0.564 | 0.739 | 0.910 | 1.091 | 1.270 | 1.428 | 1.582 | 1.732 |
Table 7.
Horizontal and vertical residual deformation of dam crest corresponding to each exceedance probability of Dashixia model under different ground motions.
Table 7.
Horizontal and vertical residual deformation of dam crest corresponding to each exceedance probability of Dashixia model under different ground motions.
| Exceedance Probability | Ground Motion Intensity PGA |
|---|
| 0.1 g | 0.2 g | 0.3 g | 0.4 g | 0.5 g | 0.6 g | 0.7 g | 0.8 g | 0.9 g | 1.0 g |
|---|
| Horizontal displacement/m | Average value | 0.180 | 0.523 | 0.866 | 1.209 | 1.635 | 2.062 | 2.489 | 2.888 | 3.287 | 3.687 |
| 5% | 0.260 | 0.725 | 1.198 | 1.752 | 2.259 | 2.818 | 3.356 | 3.923 | 4.439 | 4.916 |
| 50% | 0.174 | 0.457 | 0.795 | 1.191 | 1.605 | 2.045 | 2.483 | 2.915 | 3.313 | 3.665 |
| 95% | 0.112 | 0.227 | 0.433 | 0.667 | 0.979 | 1.291 | 1.625 | 1.930 | 2.229 | 2.493 |
| Vertical displacement/m | Average value | 0.365 | 0.618 | 0.870 | 1.123 | 1.384 | 1.645 | 1.906 | 2.153 | 2.400 | 2.647 |
| 5% | 0.498 | 0.855 | 1.217 | 1.526 | 1.876 | 2.192 | 2.526 | 2.840 | 3.190 | 3.567 |
| 50% | 0.384 | 0.621 | 0.890 | 1.108 | 1.390 | 1.630 | 1.890 | 2.110 | 2.358 | 2.612 |
| 95% | 0.242 | 0.393 | 0.578 | 0.736 | 0.946 | 1.127 | 1.321 | 1.482 | 1.655 | 1.821 |
Table 8.
Horizontal and vertical residual deformation of dam crest corresponding to each exceedance probability of Ciha Gorge Model under different ground motions.
Table 8.
Horizontal and vertical residual deformation of dam crest corresponding to each exceedance probability of Ciha Gorge Model under different ground motions.
| Exceedance Probability | Ground Motion Intensity PGA |
|---|
| 0.1 g | 0.2 g | 0.3 g | 0.4 g | 0.5 g | 0.6 g | 0.7 g | 0.8 g | 0.9 g | 1.0 g |
|---|
| Horizontal displacement/m | Average value | 0.172 | 0.497 | 0.822 | 1.147 | 1.581 | 2.015 | 2.449 | 2.862 | 3.280 | 3.690 |
| 5% | 0.253 | 0.652 | 1.155 | 1.723 | 2.315 | 2.891 | 3.409 | 3.982 | 4.499 | 4.960 |
| 50% | 0.167 | 0.430 | 0.768 | 1.159 | 1.582 | 2.016 | 2.439 | 2.879 | 3.291 | 3.668 |
| 95% | 0.101 | 0.214 | 0.353 | 0.534 | 0.772 | 1.083 | 1.481 | 1.715 | 2.087 | 2.436 |
| Vertical displacement/m | Average value | 0.383 | 0.624 | 0.866 | 1.108 | 1.360 | 1.611 | 1.862 | 2.097 | 2.332 | 2.566 |
| 5% | 0.503 | 0.903 | 1.233 | 1.522 | 1.803 | 2.106 | 2.464 | 2.759 | 3.091 | 3.452 |
| 50% | 0.378 | 0.671 | 0.908 | 1.116 | 1.324 | 1.560 | 1.852 | 2.063 | 2.298 | 2.541 |
| 95% | 0.271 | 0.458 | 0.595 | 0.712 | 0.843 | 1.020 | 1.276 | 1.421 | 1.590 | 1.756 |
Table 9.
Recommended values of horizontal and vertical residual displacements of dam crest of 250 m concrete face rockfill dam under different ground motions.
Table 9.
Recommended values of horizontal and vertical residual displacements of dam crest of 250 m concrete face rockfill dam under different ground motions.
| Exceedance Probability | Ground Motion Intensity PGA |
|---|
| 0.1 g | 0.2 g | 0.3 g | 0.4 g | 0.5 g | 0.6 g | 0.7 g | 0.8 g | 0.9 g | 1.0 g |
|---|
| Horizontal displacement/m | Average value | 0.174 | 0.526 | 0.879 | 1.231 | 1.665 | 2.099 | 2.532 | 2.927 | 3.324 | 3.718 |
| 5% | 0.258 | 0.729 | 1.223 | 1.799 | 2.330 | 2.897 | 3.423 | 3.983 | 4.477 | 4.915 |
| 50% | 0.169 | 0.483 | 0.812 | 1.223 | 1.645 | 2.092 | 2.528 | 2.964 | 3.359 | 3.703 |
| 95% | 0.102 | 0.236 | 0.435 | 0.672 | 0.966 | 1.285 | 1.636 | 1.932 | 2.252 | 2.539 |
| Vertical displacement/m | Average value | 0.370 | 0.619 | 0.869 | 1.121 | 1.367 | 1.616 | 1.864 | 2.099 | 2.333 | 2.567 |
| 5% | 0.493 | 0.862 | 1.213 | 1.529 | 1.847 | 2.153 | 2.482 | 2.791 | 3.128 | 3.490 |
| 50% | 0.371 | 0.629 | 0.885 | 1.112 | 1.359 | 1.594 | 1.850 | 2.065 | 2.296 | 2.532 |
| 95% | 0.255 | 0.415 | 0.581 | 0.727 | 0.904 | 1.076 | 1.277 | 1.425 | 1.586 | 1.743 |
| Disclaimer/Publisher’s Note: The statements, opinions and data contained in all publications are solely those of the individual author(s) and contributor(s) and not of MDPI and/or the editor(s). MDPI and/or the editor(s) disclaim responsibility for any injury to people or property resulting from any ideas, methods, instructions or products referred to in the content. |
© 2023 by the authors. Licensee MDPI, Basel, Switzerland. This article is an open access article distributed under the terms and conditions of the Creative Commons Attribution (CC BY) license (https://creativecommons.org/licenses/by/4.0/).


