Article

Geographic Exploration of the Driving Forces of the NDVI Spatial Differentiation in the Upper Yellow River Basin from 2000 to 2020

1
China Institute of Water Resources and Hydropower Research, Beijing 100038, China
2
Yellow River Institute of Hydraulic Research, Zhengzhou 450003, China
3
Henan Key Laboratory of YB Ecological Protection and Restoration, Zhengzhou 450003, China
*
Author to whom correspondence should be addressed.
Sustainability 2023, 15(3), 1922; https://doi.org/10.3390/su15031922
Submission received: 14 October 2022 / Revised: 13 January 2023 / Accepted: 16 January 2023 / Published: 19 January 2023

Abstract

:
Meteorological factors and human activities are important factors affecting vegetation change. The change in the Upper Yellow River Basin’s (UYRB’s) ecological environment greatly impacts the ecological environment in the middle and lower reaches of the Yellow River. The purpose of this study was to evaluate remotely sensed imageries and vegetation indices as tools for accurately quantifying the driving forces of vegetation distribution. To accomplish this, we utilized the normalized difference vegetation index (NDVI) to examine the temporal and spatial variability of the vegetation distribution in the UYRB between 2000 and 2020. Based on the geographic detector method, the spatial differentiation, driving force, interaction, and suitability of the NDVI were detected. From 2000 to 2020, the estimated annual NDVI value of the UYRB was 0.515, with notable geographic variation in the distribution. The NDVI showed an obvious upward trend with a rate of 0.038 per 10 years. The vegetation coverage significantly improved. However, the vegetation coverage at the source area of the Yellow River marginally deteriorated. The primary driving factors affecting the spatial distribution of the NDVI were yearly precipitation, elevation, soil type, vegetation type, and annual average temperature, with a predictive power of 47%, 46%, 44%, 41%, and 40%, respectively. The interplay of the components had a stronger impact on the NDVI, and the interaction between the yearly precipitation and the soil type had the highest predictive power, reaching 61%. Natural factors and human activities influence NDVI change, with natural factors playing a significant role. Therefore, we should continue to implement the project of returning farmland to forest (grass), increase the efficiency of vegetation precipitation use, and promote the growth of vegetation so that ecological restoration continues to be effectively improved.

1. Introduction

Vegetation can be seen as a feedback system regulating the balance of water, carbon, and energy between land and atmosphere [1,2]. It is an important part of the terrestrial ecosystem and an indicator reflecting regional ecological environment changes [3]. To understand the regional ecological changes and develop ecological protection strategies, it is important to systematically monitor the changes and driving factors of the spatiotemporal dynamics of vegetation. Remote sensing is an important technology for the dynamic monitoring of large-scale vegetation coverage [4,5]. Vegetation indices derived from satellites, such as the normalized vegetation difference index (NDVI) [3], enhanced vegetation index (EVI) [6], leaf area index (LAI) [7], and MERIS terrestrial chlorophyll index (MTCI) [8], have been used to monitor the dynamic changes in vegetation. Among these indicators, the NDVI can eliminate the impact of the solar altitude angle, atmosphere, etc., on remote sensing images, and it is considered an effective monitoring indicator of large-scale vegetation coverage and is the most widely used [9,10,11]. The AVHRR NDVI has a long time scale and is suitable for the study of vegetation coverage in long time series, but its resolution is low. The MODIS NDVI monitoring started late, but it has higher spatial resolution than the AVHRR NDVI, and its time series has been updated so far. It has been widely used in the study of land vegetation coverage change at different spatial and temporal scales [12,13,14]. With increased global warming, the start of the growing season of vegetation phenology has advanced, while the end of growing season has delayed, and the length of growing season (LOS) has extended. The extended LOS will affect the carbon cycle, hydrological cycle, and energy balance of global terrestrial ecosystems and promote the growth of vegetation productivity. Vegetation phenological parameters are important for describing the changes in vegetation dynamics and are usually extracted from remote sensing indicators, such as NDVI [15].
The Yellow River Basin (YRB) is not only an important ecological corridor but also plays a vital role in economic and social development, as well as ecological security, in China. Recently, the vegetation coverage of the YRB has changed significantly, and the ecological environment has gradually improved [16]. As part of the YRB, the upstream is the main water-producing area, and its ecological changes have a great impact on the ecological environment security of the middle and lower reaches. Over the past 20 years, the ecosystem in the Upper Yellow River Basin (UYRB) has been significantly improved and restored, especially in the gully areas of the Loess Plateau and the eastern Hetao Plain [17]. The improvement in the vegetation in the UYRB will further lead to changes in evapotranspiration and runoff [18,19]. Therefore, it is essential to study the driving factors of the vegetation in the UYRB. Generally, the spatial distribution of vegetation is considered to be affected by natural and human factors. These factors do not act on the vegetation independently but interact with each other [20]. The traditional correlation analysis method can only detect the linear relationship, while the geographical detector proposed by Wang [21] has a clear physical quantity significance. This method effectively detects the consistency in spatial distribution patterns using dependent and independent variables by analyzing the spatial heterogeneity. The higher the consistency, the greater the impact, and the stronger the causal response. In addition, the geographical detector can detect the real interaction between factors without following a linear assumption, which makes it superior to other traditional methods. It has been successfully applied to the study of driving factors, such as vegetation change [22,23], spatial distribution of PM2.5 [24], landslide [25], soil erosion [26], and urban landscape pattern expansion [27]. Existing studies on the UYRB have mainly detected natural factors dominated by climate factors [28,29], and there are still limitations and a lack of quantitative research in evaluating the driving force of human activities on the spatial distribution of the NDVI. Additionally, there has been a lack of research on the NDVI for nearly 20 years [30], which cannot accurately reflect the status quo of vegetation.
Therefore, the objective of this study was to evaluate remotely sensed imagery and vegetation indices as tools for accurately quantifying the driving forces of vegetation distribution. To achieve this goal we used MODIS NDVI data with 250 m spatial resolution and the trend analysis approach to investigate the temporal and spatial variation characteristics. Then, the Pearson correlation method was used to analyze the correlation between the NDVI interannual change and temperature and precipitation. Finally, based on 12 types of natural factors and 6 types of human activity factors, the geographical detectors were used to detect the spatial differentiation and driving forces of vegetation. The results will be helpful for vegetation restoration and ecological protection in the UYRB.

2. Data and Methods

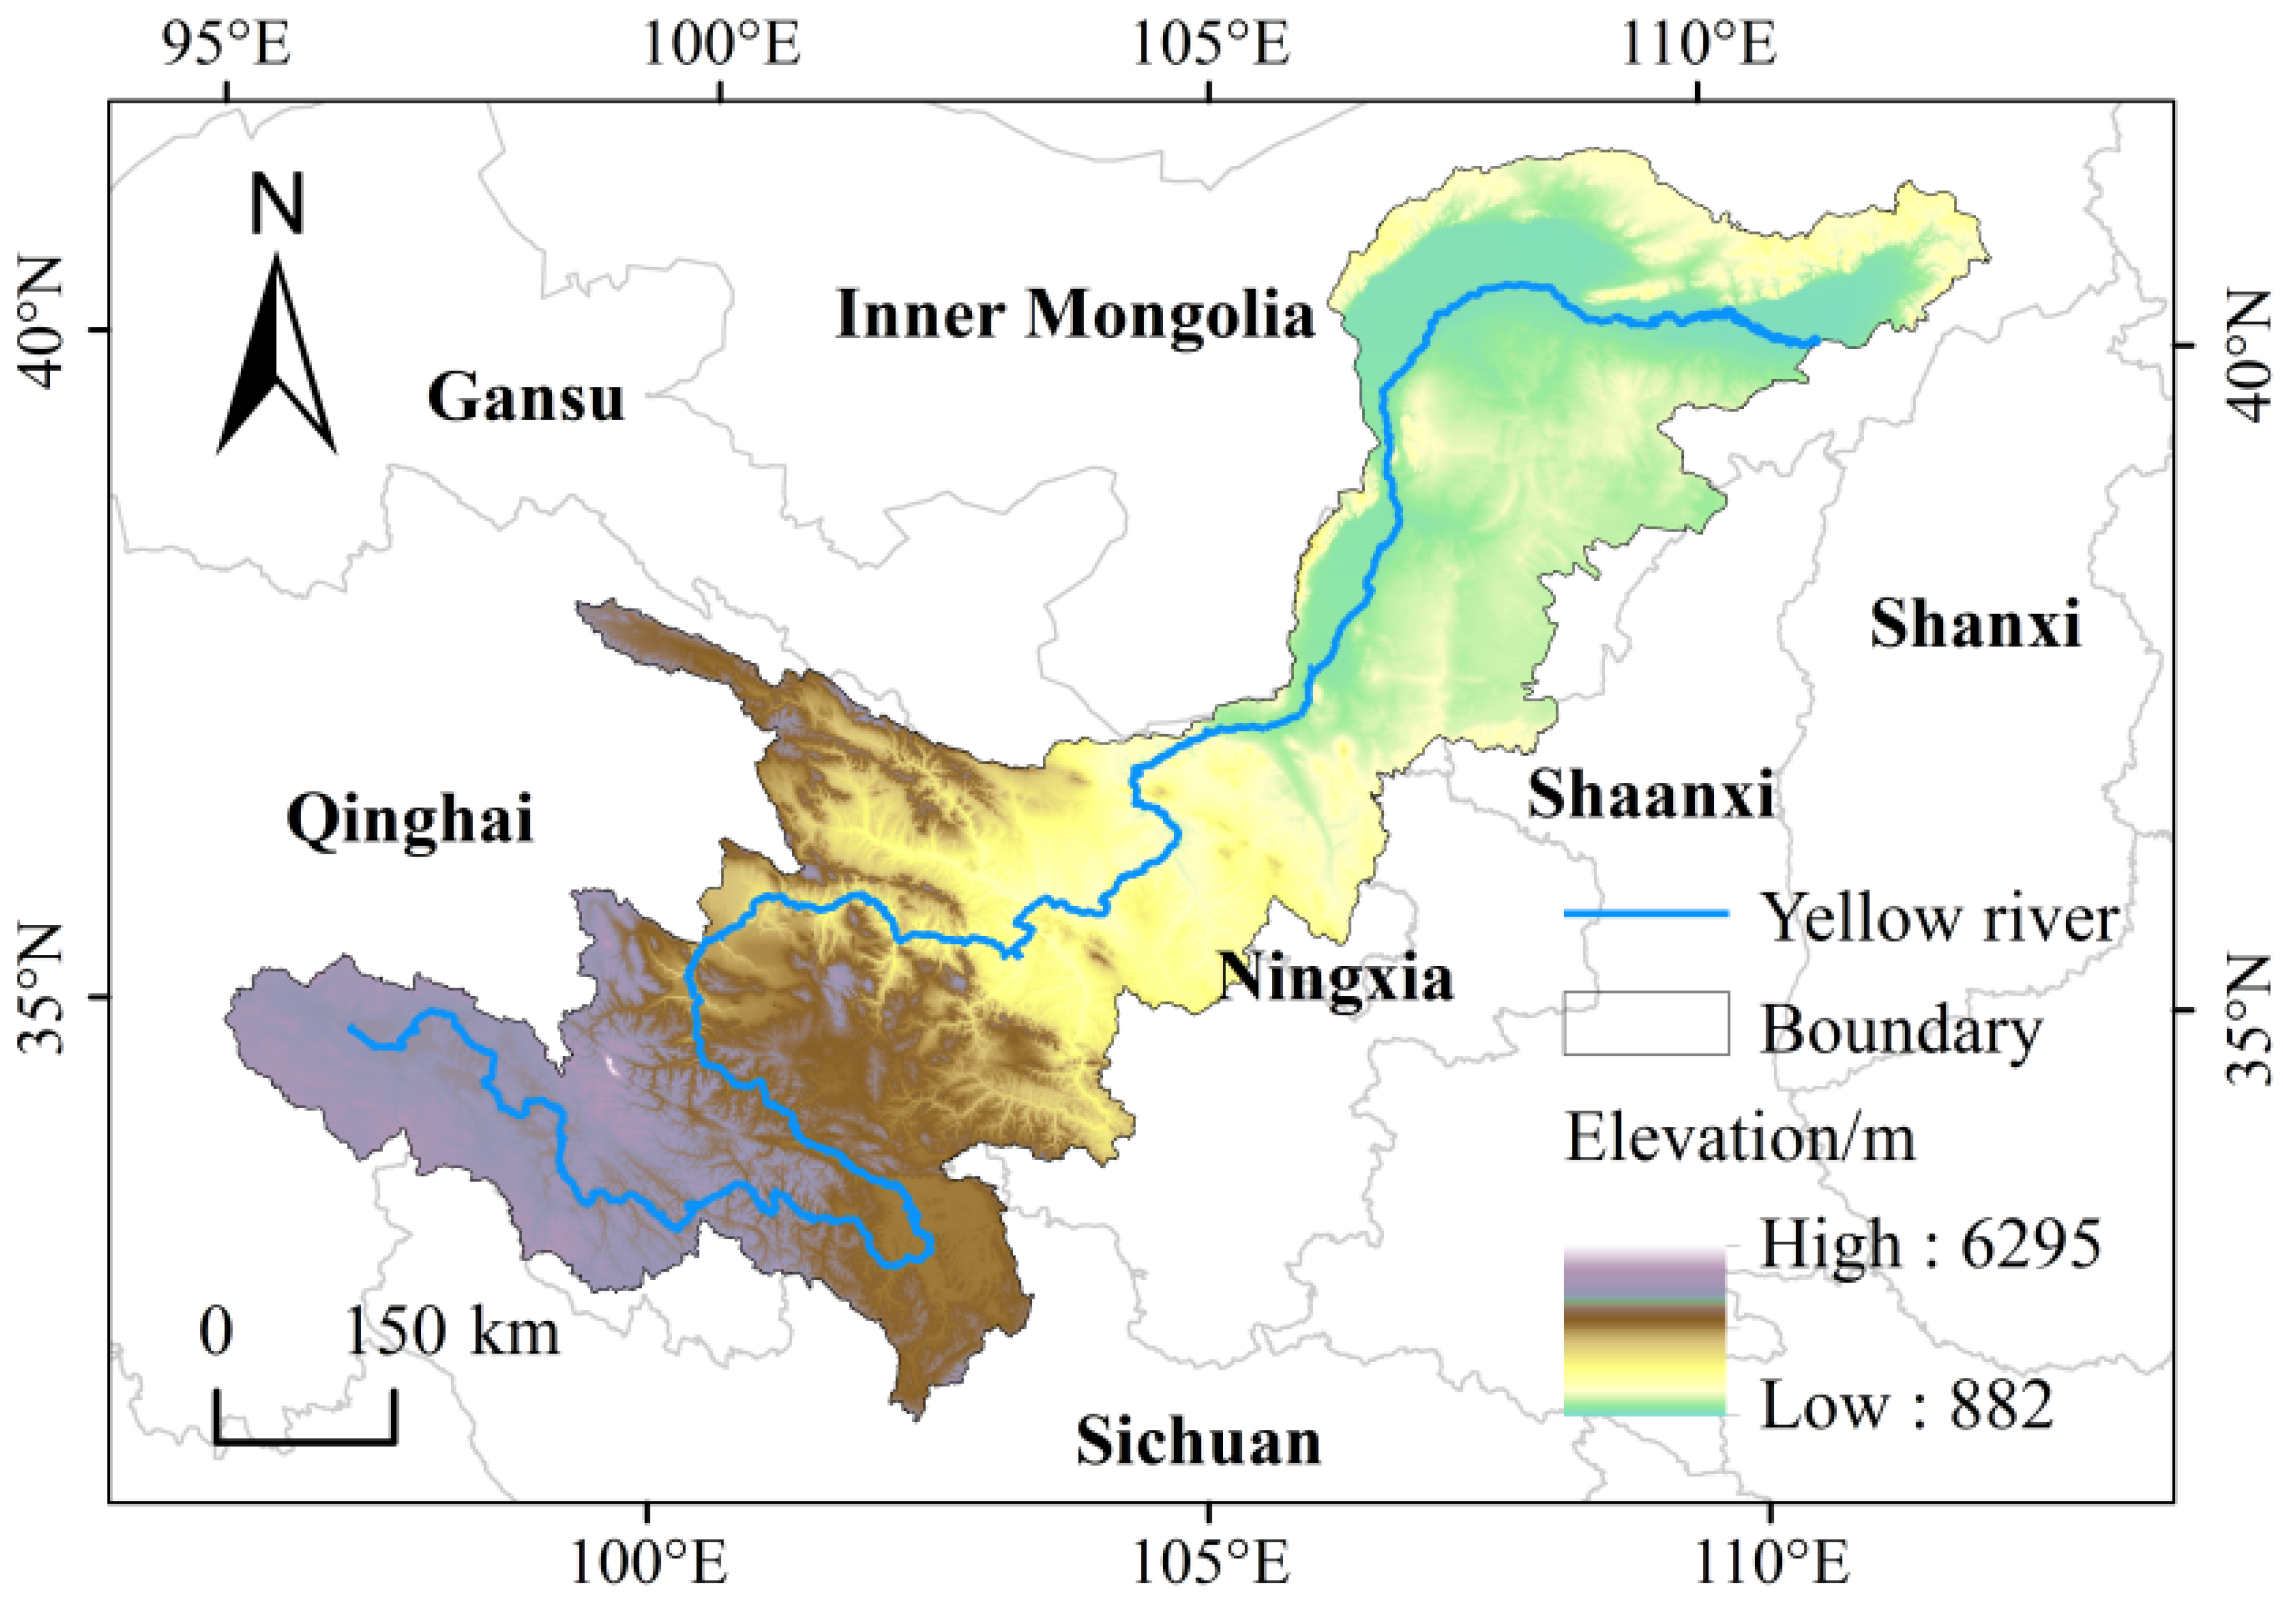
2.1. Overview of the Study Area

The UYRB is the part of the Yellow River that reaches above Hekou Town, Tuoketuo County, Inner Mongolia (32°09′–41°50′ N, 95°53′–112°50′ E) (Figure 1), which flows through Qinghai, Sichuan, Gansu, Ningxia, and Inner Mongolia provinces. This region is located in the cross areas of the Tibetan Plateau, Inner Mongolia Plateau, and Loess Plateau. The climate is diverse and dynamic, gradually transitioning from humid alpine areas to desert arid plains. The main vegetation types are alpine steppe and meadow, primarily comprising Picea crassifolia, Betula platyphylla, Betula albo-sinensis, and Populus davidiana. The main types of soils are chernozem, brown cinnamon soil, and meadow soil. The upper reaches of the Yellow River’s length is 3472 km, and the basin area is 4.24 × 10⁵ km2, accounting for 53.3% of the total area of the YRB. The regional average altitude between the Heyuan and the Tangnaihai hydrological stations in the upper reaches is above 4000 m, the annual average temperature is −2.60 °C, and the annual average precipitation is 537.9 mm, which is the source area of the Yellow River (SAYR). The regional average altitude between the Tangnaihai and Xiaheyan hydrological stations in the middle reaches is above 2500 m, and the annual average temperature is 3.08 °C. The average annual precipitation is 449.3 mm, and the region is rich in hydropower resources. The main catchment region includes Longyangxia, Liujiaxia, and other large water conservative projects. The regional average altitude between the Xiaheyan and Tou Daoguai hydrological station is below 1400 m, the annual average temperature is 7.00 °C, and the annual average precipitation is 271.7 mm, indicating a heavily irrigated agricultural area [31].

2.2. Research Data Acquisition and Processing

2.2.1. MODIS NDVI

This study used the MOD13Q1 NDVI data (https://ladsweb.nascom.Nasa.gov/, accessed on 20 January 2022) with a spatial resolution of 250 m and a temporal resolution of 16 days. The greatest value synthesis approach produced the NDVI data from 2000 to 2020 [32]. Based on the data from five periods in 2000, 2005, 2010, 2015, and 2020, the NDVI values were equally categorized into five vegetation coverage grades: low (≤0.2), medium–low (0.2–0.4), medium (0.4–0.6), medium–high (0.6–0.8), and high (>0.8) [23], which has helped to understand the temporal and spatial distribution characteristics of the NDVI.

2.2.2. Driving Factors

Vegetation change is affected by various natural and human factors [33,34,35]. In this article, 18 representative factors that are easy to quantify and obtain were taken as independent variables (Table 1), including the slope, aspect, elevation, soil type, vegetation type, landform type, annual average temperature, annual precipitation, minimum temperature, maximum temperature, sunshine hours, distance from rivers, GDP, population density, land use type, distance from roads, distance from residential areas, and night light index. The elevation, slope, and aspect were estimated and obtained using DEM data from geospatial Data of the Chinese Academy of Sciences (http://www.gscloud.cn/, accessed on 20 January 2022) with a spatial resolution of 30 m. The climate data were based on the measured daily meteorological data from 73 meteorological stations in the UYRB from 2000 to 2020, obtained from the China Meteorological data network (http://data.cma.cn, accessed on 20 January 2022) via inverse distance weight interpolation.
Data on the soil, vegetation, geomorphic types, and land use type data were gathered from the Data Center for Resources and Environmental Sciences, Chinese Academy of Sciences (http://www.resdc.cn/, accessed on 20 January 2022). The data including roads, settlements, and rivers were from OpenStreetMap (https://download.geofabrik.de/asia/china.html, accessed on 20 January 2022), which were estimated using ArcGIS Euclidean distance. The GDP and population density data were interpolated according to the statistical yearbook of cities in the UYRB from 2000 to 2020. The night light data were from the NPP–VIIRS-like night light data provided by the Harvard dataverse platform (https://doi.org/10.7910/DVN/YGIVCD accessed on 20 January 2022). The independent variables in the geographic detector model should be discrete quantities; thus, we needed to classify the driving factors (Table 1).
The data presented above were extracted using the UYRB vector boundary, and after resampling, they were consistent with a pixel size of 250 m of the NDVI data. The ArcGIS fishing net tool was used to create 5 × 5 km2 grids in the UYRB, and a total of 16,590 generated sampling points were used to extract the spatial attribute values in the entire region.

2.3. Research Methods

2.3.1. Unitary Linear Regression Analysis

The unitary linear regression analysis method was used to analyze the changing trend of each pixel in the image. This study examined the changing trend of the NDVI in the UYRB from 2000 to 2020, using the following formula [36]:
l o p e = n × i = 1 n ( i × x i ) ( i = 1 n i ) ( i = 1 n x i ) n × i = 1 n i 2 ( i = 1 n i ) 2
In the formula, n is the cumulative years of the study (in this study, n = 21); the variable i runs from 1 to n; x i is the value of NDVI or climatic elements in year i ; S l o p e is the trend line slope: if S l o p e > 0, the variable shows an increasing trend. If S l o p e < 0, the variable presents a downward trend; if Slope = 0, the variable has no significant change.

2.3.2. Geographic Detector

The geographic detector is a tool to detect the spatial differentiation of geographical phenomena [21]. It can quantitatively analyze the main factors driving spatial differentiation and detect the influence of the interaction between two factors on the dependent variable. This paper used geographic detectors to analyze the vegetation’s spatial heterogeneity driving factors in the UYRB.
(1)
Factor detection
Factor detection can quantify the explanatory power of factors on the geographical distribution of the NDVI, which is expressed as q. The value of q indicates that factor X fully describes q × 100% of the NDVI’s geographical distribution. Its range is [0, 1]. The larger the value, the greater the predictive power of factor X to NDVI, and the smaller the vice versa. q can be calculated using the following formula [37]:
q = 1 1 N σ 2 h = 1 L N h σ h 2
In the formula, q is the predictive power of the driving factor; N is the number of samples in the whole region; The sample number of region h is N h ; σ 2 is the variance of the NDVI in whole region; and σ h 2 is the variance of the NDVI in region h; h = 1,…, L is the partition of Y or X.
(2)
Interactive detection
There are interactions between geographical phenomena. The interaction detector can identify the interaction between the different driving factors on the influence of the dependent variables. Table 2 shows the interaction.
(3)
Risk detection
Risk detection was used to judge areas with high vegetation coverage. The subarea with the largest NDVI value has the best vegetation coverage, and the t–statistic was used to test [38]:
t = Y ¯ h = 1 Y ¯ h = 2 [ V a r ( Y ¯ h = 1 ) N h = 1 + V a r ( Y ¯ h = 2 ) N h = 2 ] 1 / 2
In the formula, Y ¯ h represents the mean value of the NDVI in subarea h, and the number of samples in subarea h is N h , and the variance is denoted by Var.
(4)
Ecological exploration
Ecological exploration can employ the F test to determine whether there is a significant difference of the impact of two factors on the spatial distribution of the NDVI [38]:
F = N X 1 ( N X 2 1 ) S S W X 1 N X 2 ( N X 1 1 ) S S W X 2
In the formula, N X 1 and N X 2 represent the sample number of two factors, X1 and X2, respectively; S S W X 1 and S S W X 2 represent the sum of the intralayer variances formed by X1 and X2, respectively; and L1 and L2 represent the layers of variables X1 and X2, respectively.

2.3.3. Pearson Correlation Analysis

Pearson correlation analysis was used to study the correlation between temperature and precipitation and the NDVI dynamic changes, and the formula is [39]:
R = i = 1 n ( N D V I i N D V I ¯ ) ( X i X ¯ ) i = 1 n ( N D V I i N D V I ¯ ) 2 i = 1 n ( X i X ¯ ) 2
where R is the Pearson correlation coefficient; N D V I i is the NDVI value in the ith year; N D V I ¯ is the mean value of the NDVI from 2000 to 2020; X i is the temperature and precipitation value in the ith year; X ¯ is the mean value of the temperature and precipitation from 2000 to 2020.

3. Result Analysis

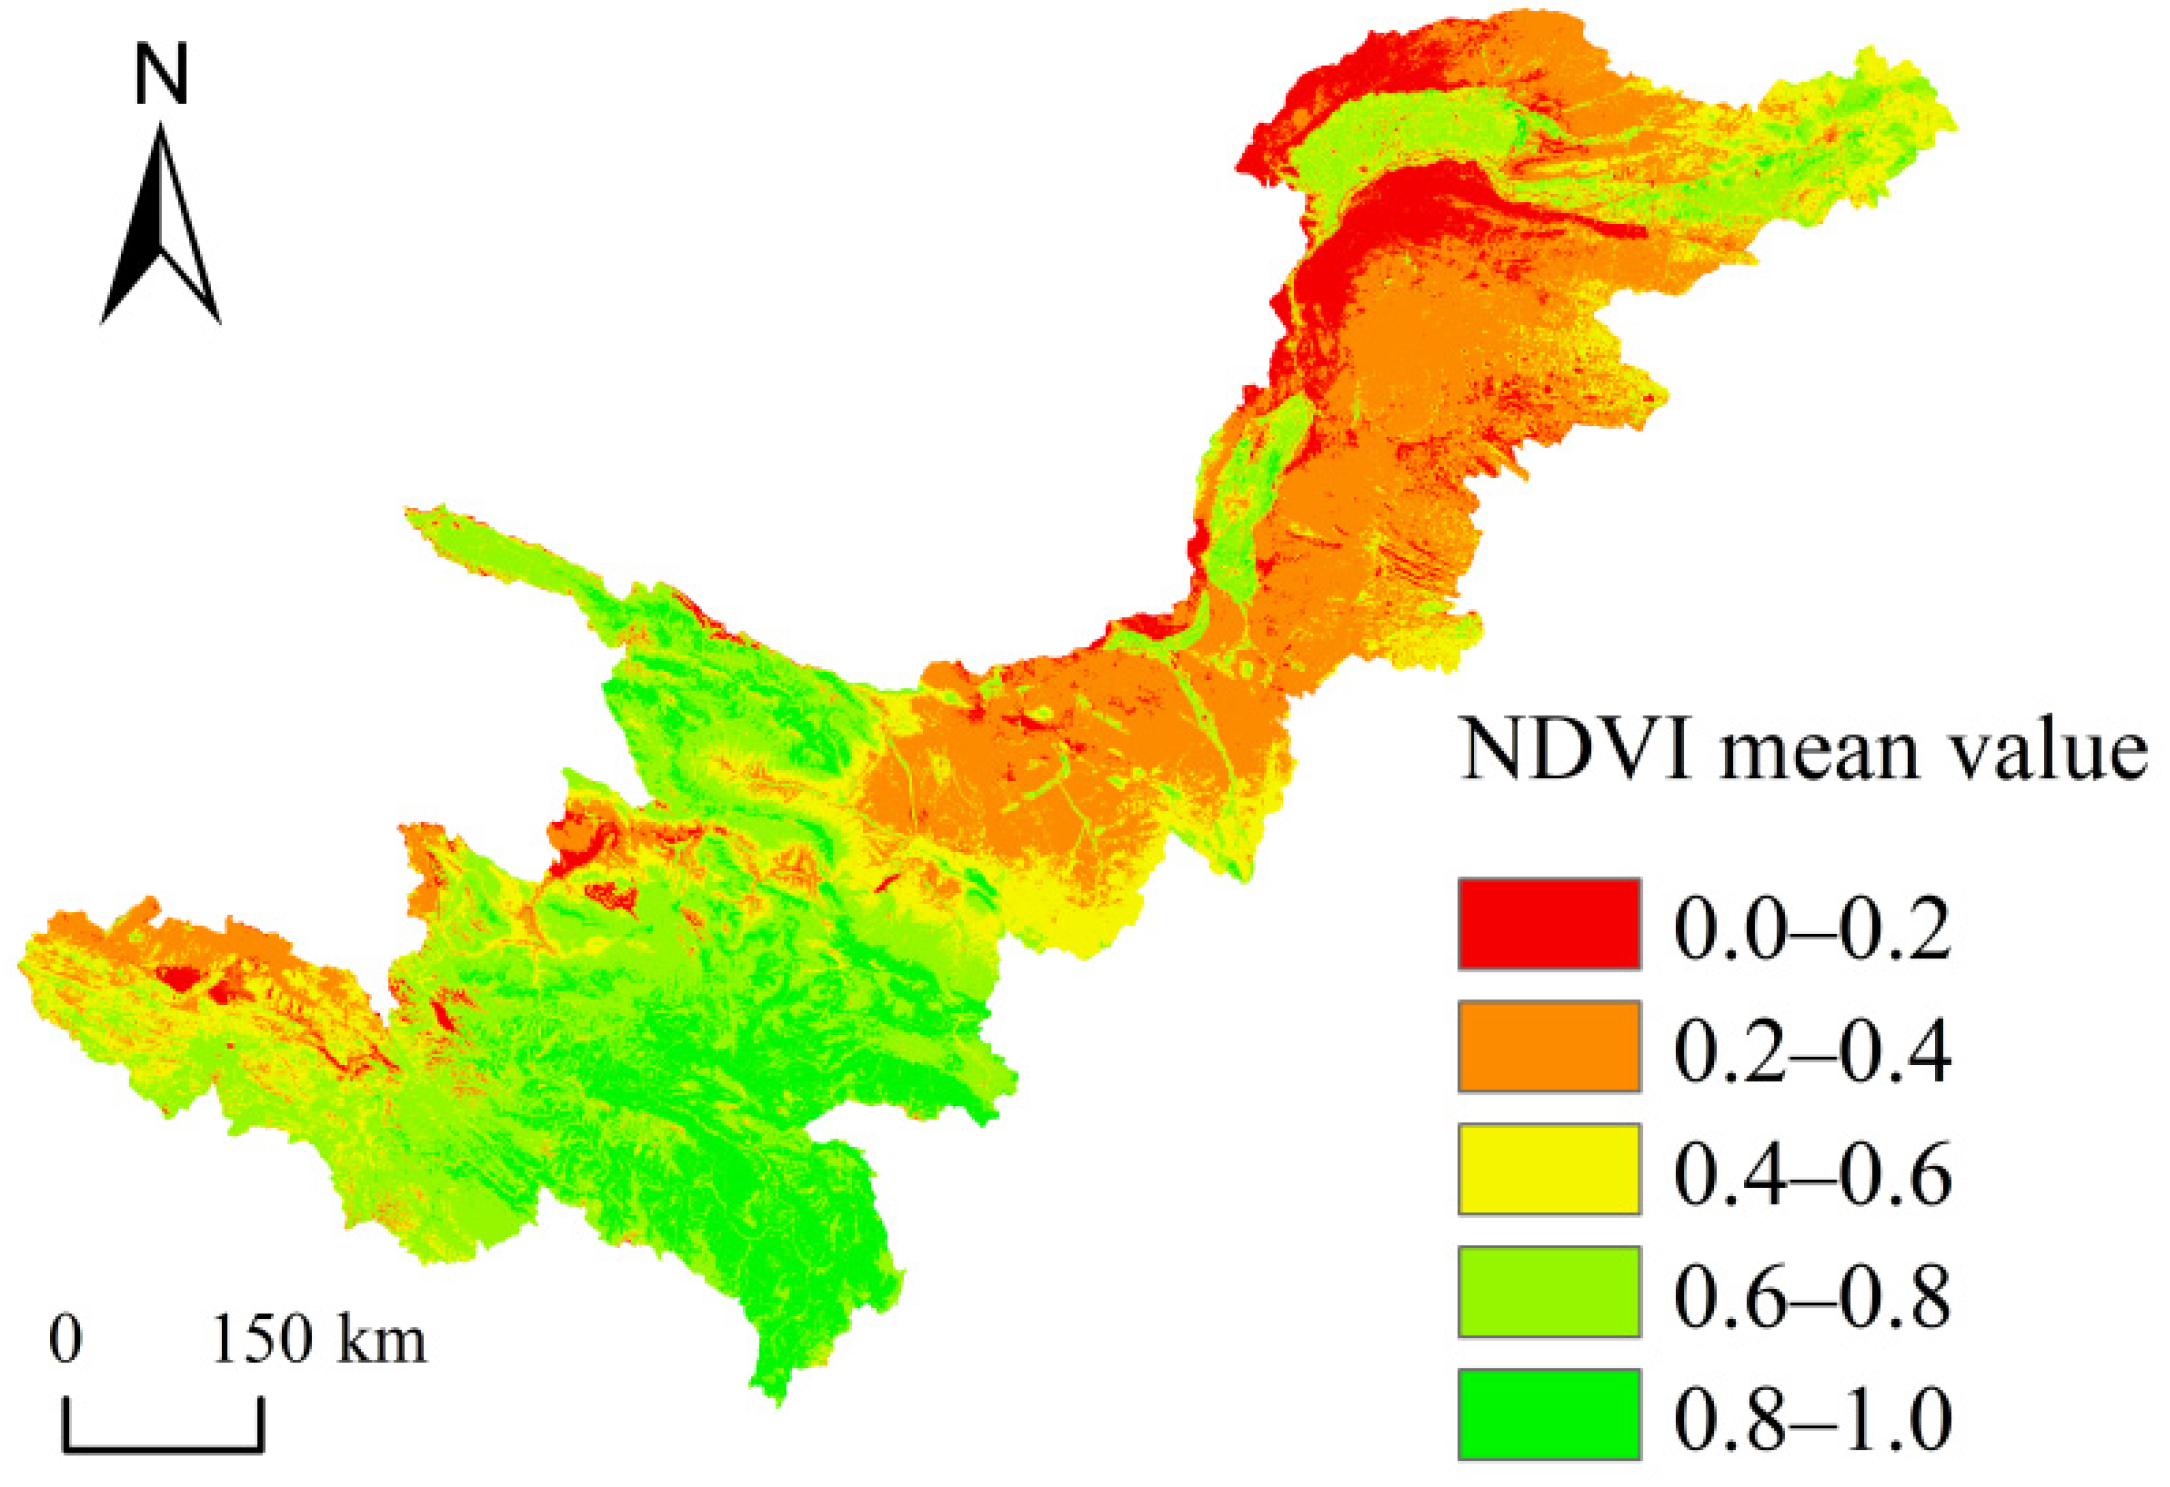
3.1. Spatial Variation Characteristics of the NDVI

The average annual NDVI of the UYRB from 2000 to 2020 was 0.515. The spatial distribution of the NDVI was high in the southwest and low in the northeast. The high-value area was mainly concentrated in the southeast of SAYR, the west of Huangshui River basin, and the northern Hetao Plain. The low-value area was mainly distributed in the north of Inner Mongolia Province, Gansu Province, central Ningxia Province, and the inner flow area of Ordos Plateau (Figure 2).
According to the natural discontinuity method, the NDVI variation trend was divided into seven categories: significant decrease, moderate decrease, slight decrease, basically unchanged, slight increase, moderate increase, and significant increase (Table 3). Approximately 36% of the upper reaches of the Yellow River had increased vegetation coverage, primarily in the middle and northeast of the basin. Approximately 32% of the upper Yellow River had decreased vegetation coverage, mainly in the SAYR. Among these areas with decreased vegetation cover, 88% was slightly decreased. The vegetation coverage in most other areas remained unchanged (Figure 3).
In 2020, compared with 2000, the total area of the high and medium–high vegetation coverage (NDVI > 0.6) of the UYRB increased from 35% to 49%. The area of high vegetation coverage increased the most, and the proportion of low and medium–low vegetation coverage (NDVI < 0.4) decreased from 49% to 30% (Figure 4).

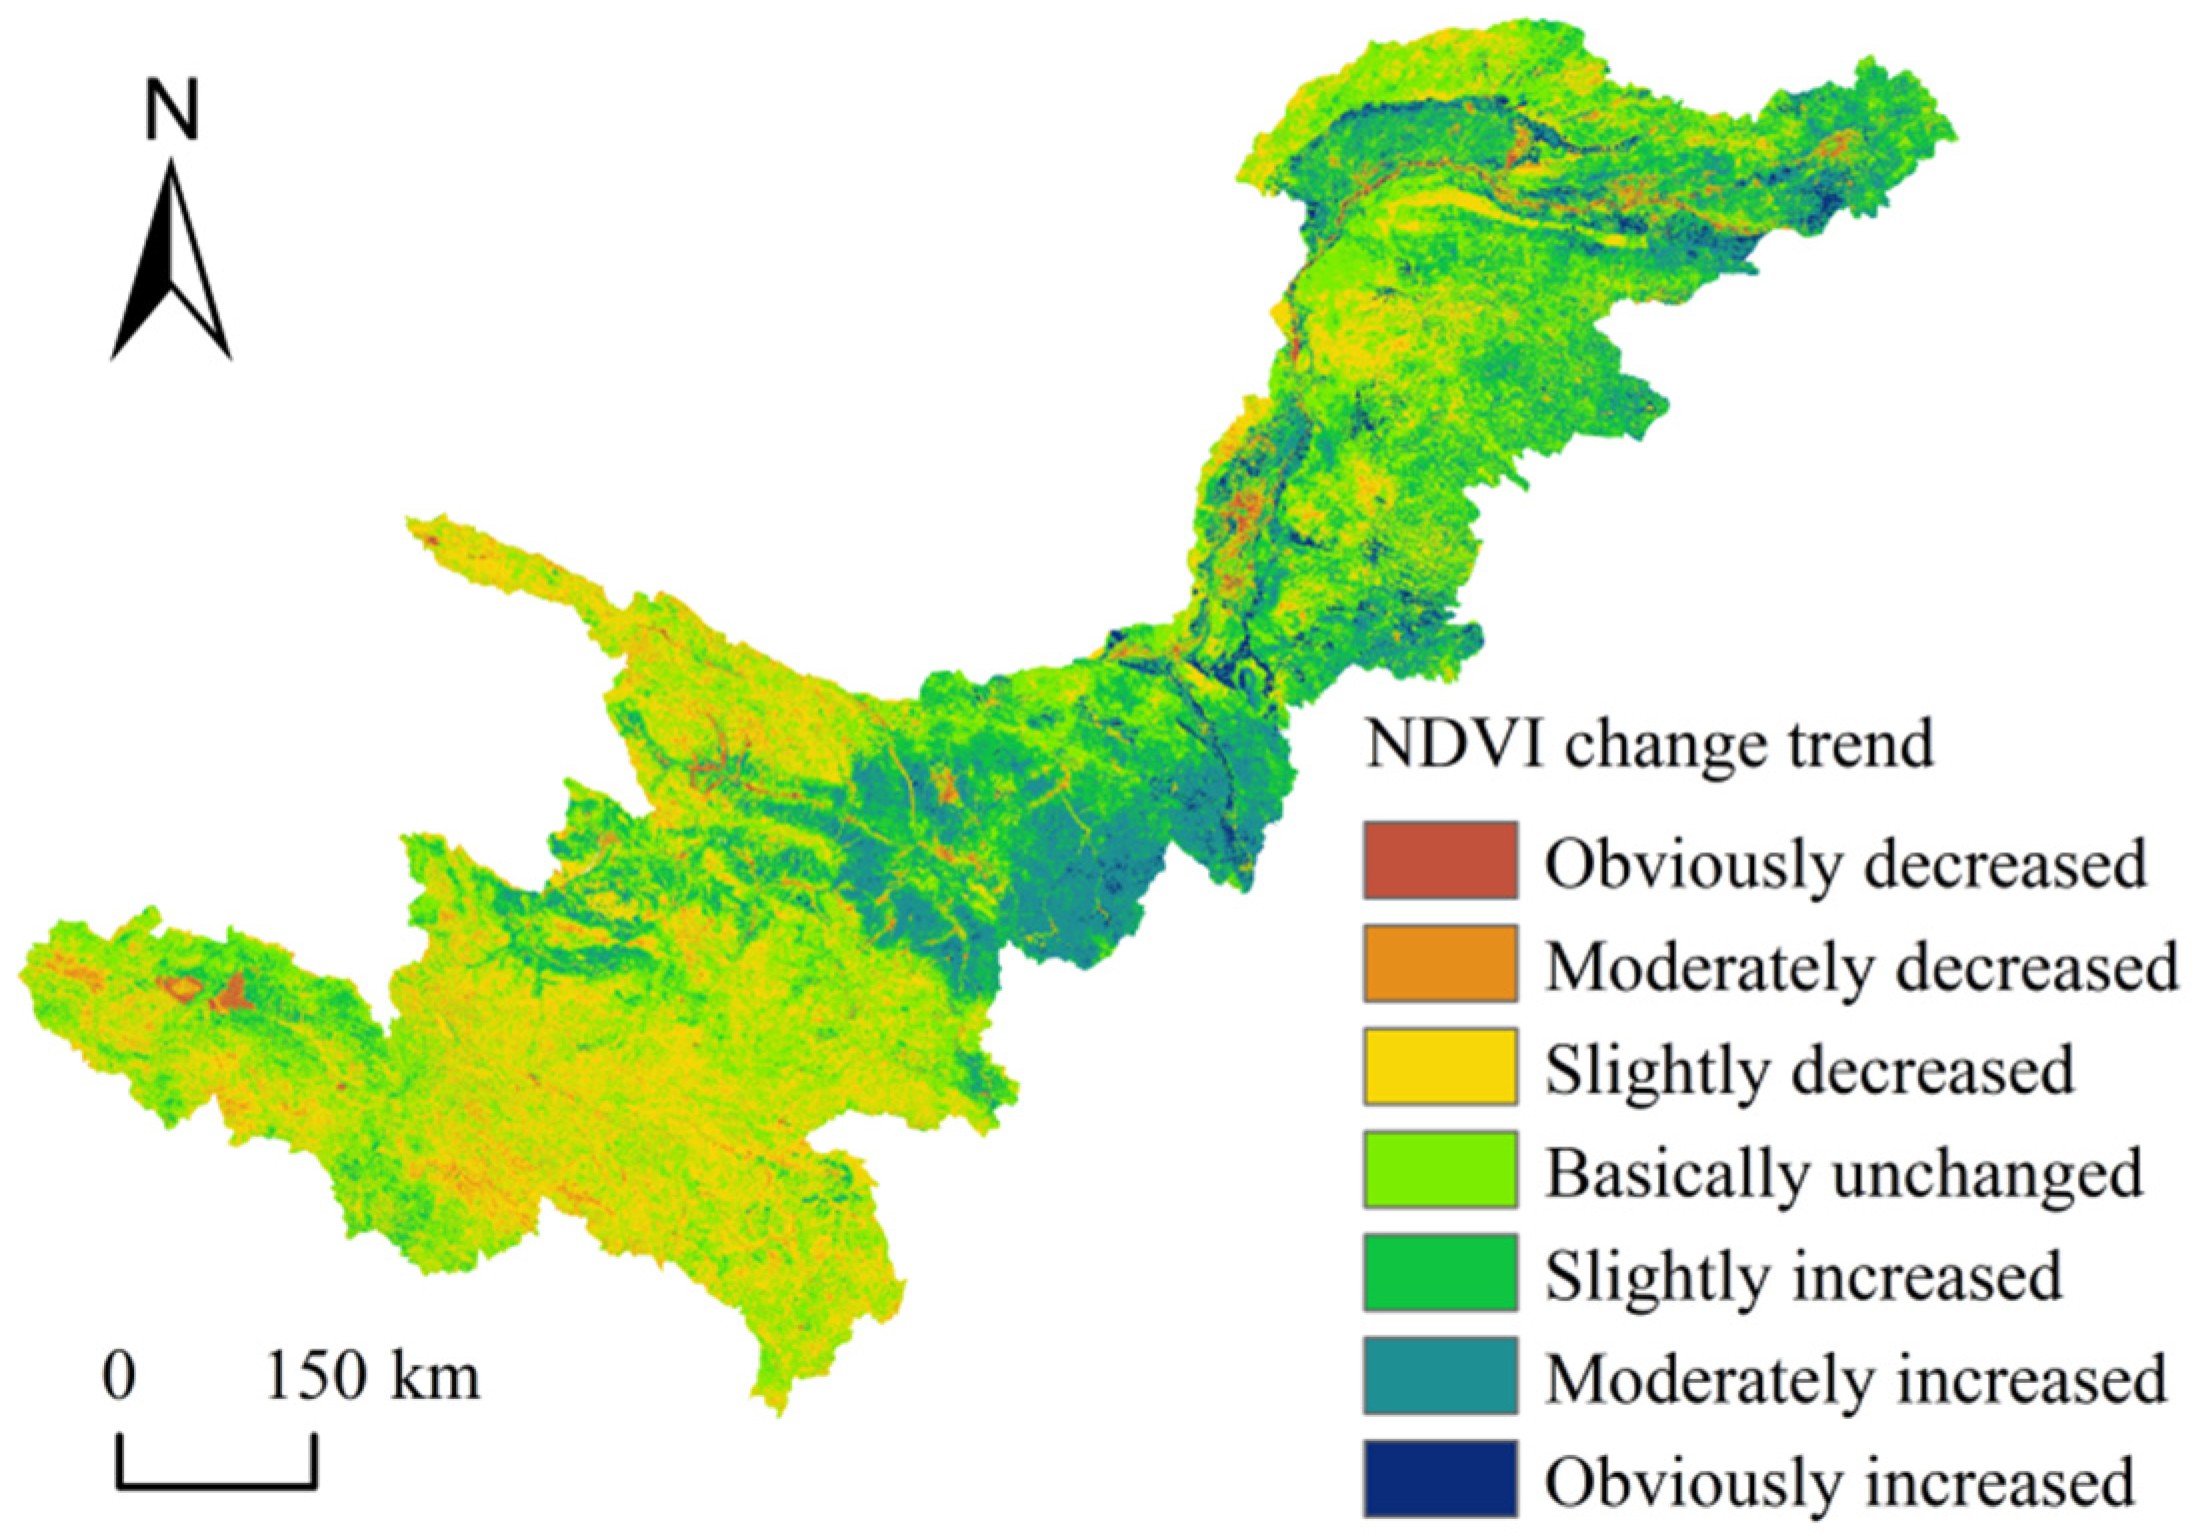
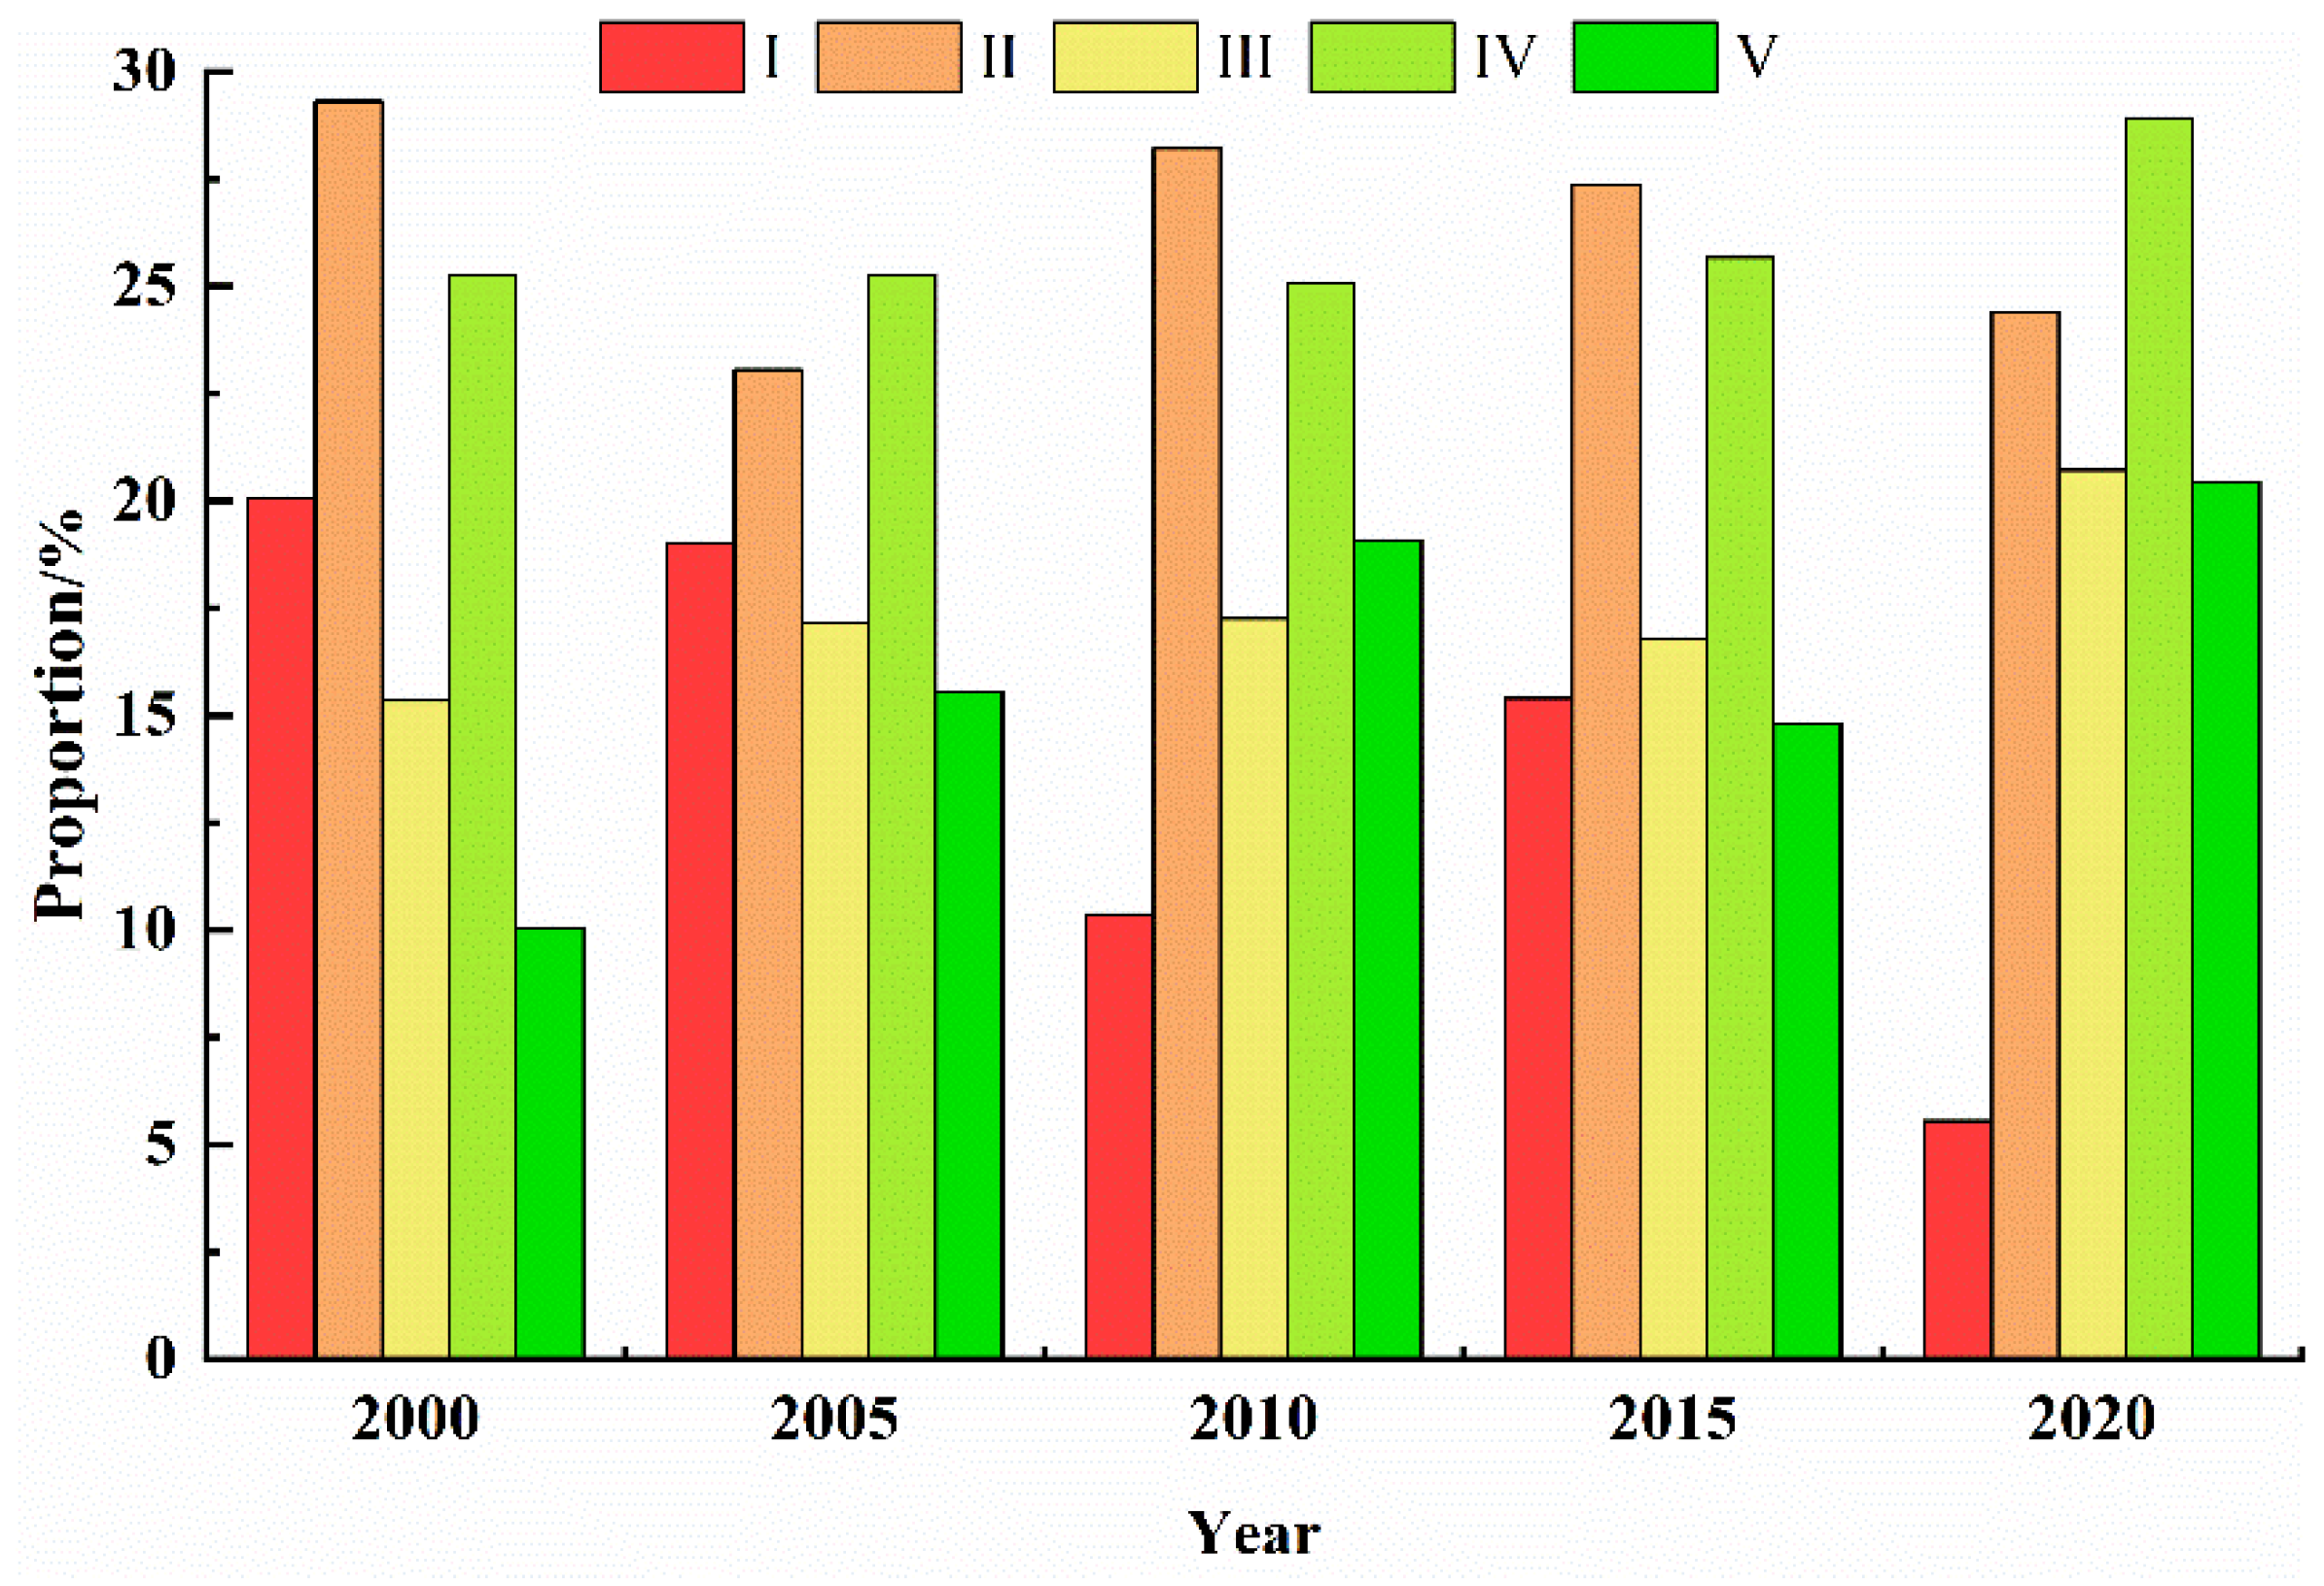
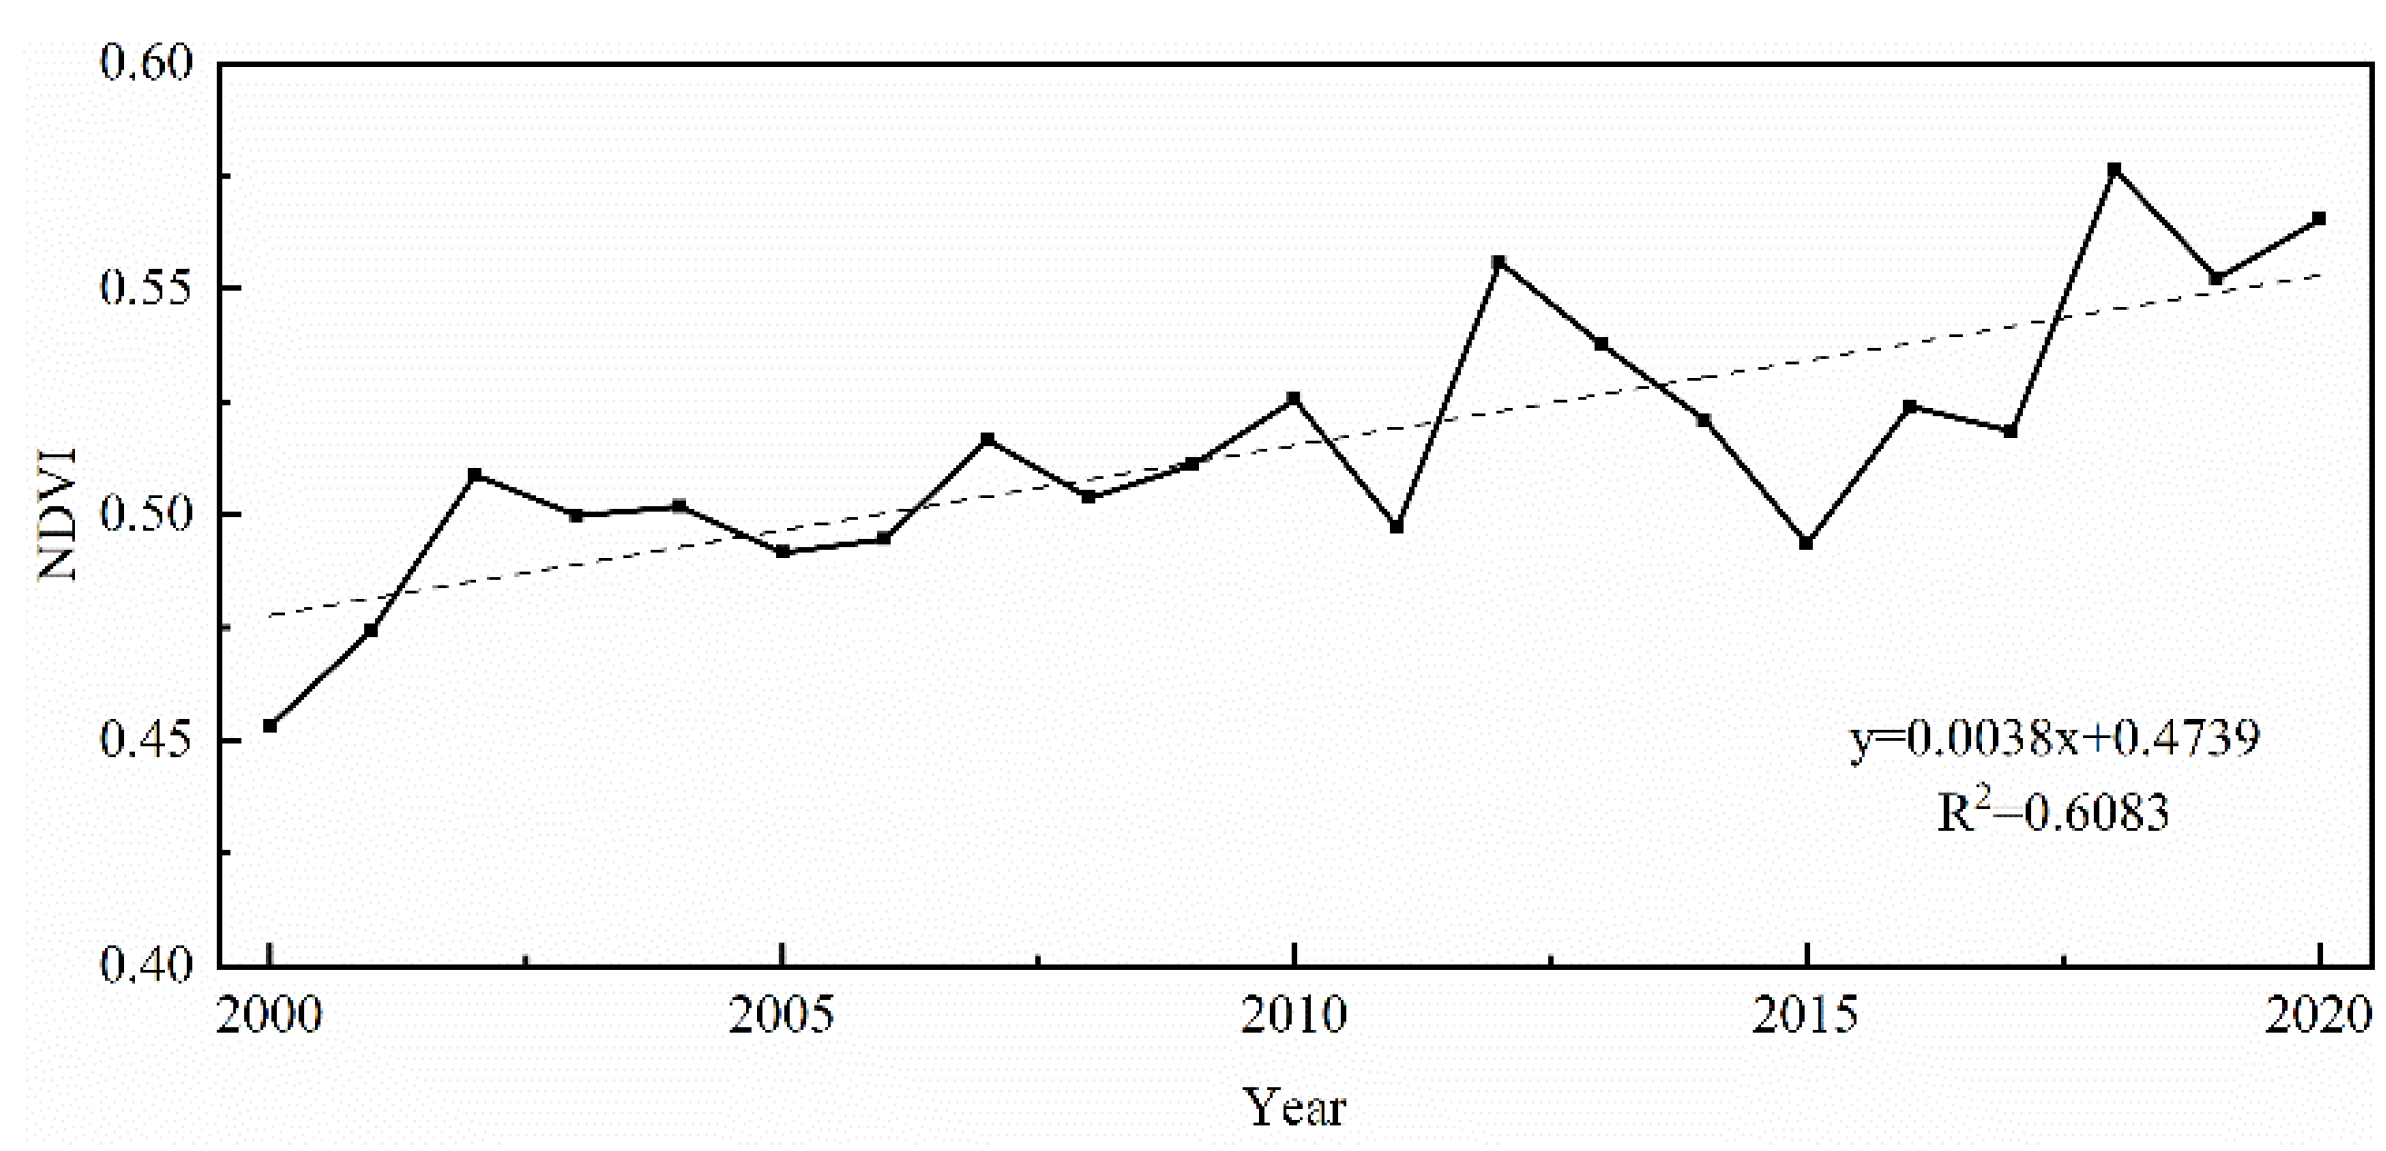
3.2. Temporal Variation Characteristics of the NDVI

The NDVI showed an upward trend from 2000 to 2020. The annual average of the NDVI increased from 0.453 in 2000 to 0.565 in 2020 at a rate of 0.038 per 10 years. Figure 5 shows that the maximum and minimum values appeared in 2018 (0.576) and 2000, respectively. The significance test shows that the annual NDVI’s change trend was significant, indicating that the vegetation coverage in the UYRB significantly improved from 2000 to 2020 (the significance level was 0.05, and results yielding p-values < 0.05 were considered to be the borderline of statistical significance).

3.3. NDVI Spatial Anisotropy and Driving Force Analysis

3.3.1. Factor Detection

According to the factor detector, the influence of each factor on the spatial distribution of the NDVI in the UYRB was obtained (Table 4), and the influence of each driving factor on the NDVI was significant (p < 0.01). By comparing the value of the factor q, we can see that annual precipitation and elevation were the key driving factors determining the spatial distribution of the NDVI, with the predictive power reaching 47% and 46%, respectively. The following was soil type, vegetation type, and annual average temperature, with a predictive power of 44%, 41%, and 40%, respectively. Human influences had a smaller impact than natural factors. With a value of 22%, GDP had a relatively large influence in the human factors.

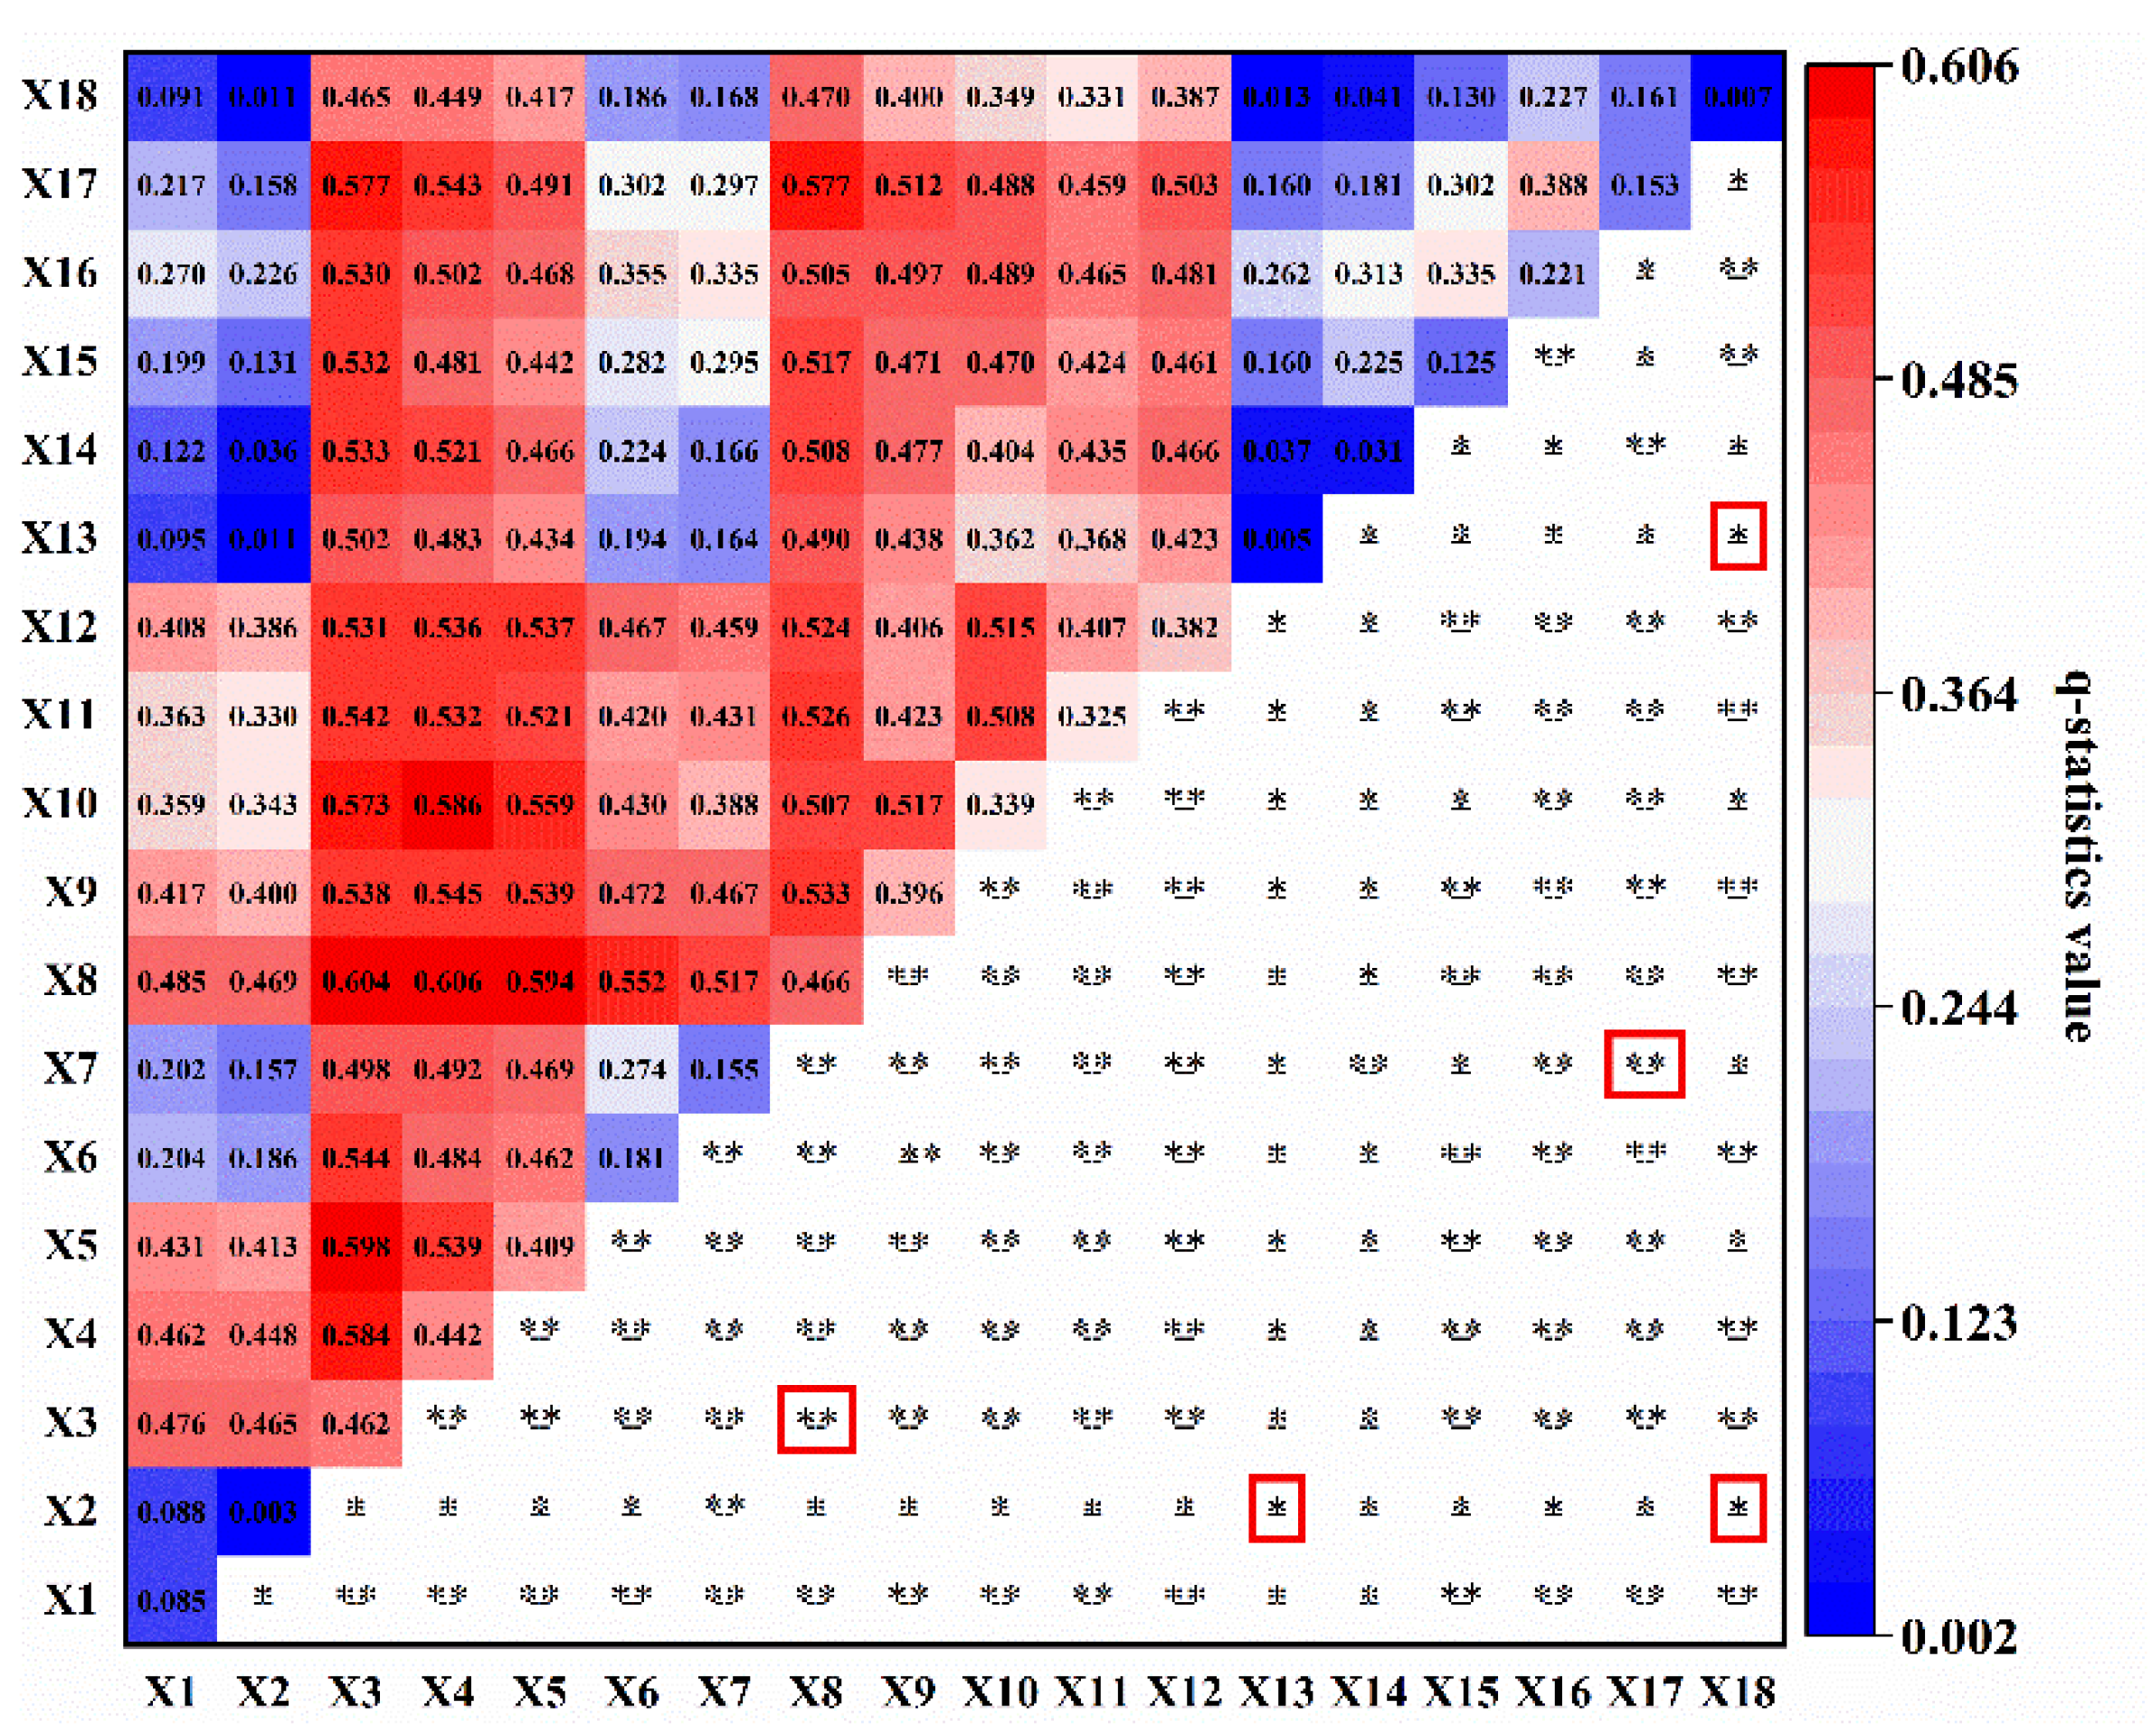
3.3.2. Ecological and Interaction Detection

The ecological detection showed significant differences, except for the slope aspect and distance from the road, night light, elevation, annual precipitation, river, land use type, and distance from road and night light (Figure 6).
The interaction results showed that the interaction of the factors was enhanced (Figure 6). The interaction influence of annual precipitation, elevation, soil type, vegetation type, and other factors exceeded 40%, indicating that these factors were the leading factors driving the spatial distribution of the NDVI. The q-value between annual precipitation and soil type was the highest, reaching 61%. Some single factors had little effect on NDVI, and after interacting with other factors, they greatly increased the predictive power of NDVI. This showed that some factors with little influence may also affect vegetation growth under the interaction.

3.3.3. Risk Area Detection

The range or types of detection factors with better vegetation coverage are shown in Table 5. The average annual NDVI increased with the increase in the slope and reached the maximum at a slope of 35–45°. However, slopes of 25–35° and >45° had no significant effect on the spatial distribution of the NDVI. Therefore, the vegetation grew better on a slope > 25°. The NDVI varied with the slope aspect and reached a maximum on the eastern slope in the UYRB. With an increasing elevation, the NDVI increased and subsequently declined. It reached the maximum at an elevation range of 3586–4011 m and then decreased with the elevation increasing. The NDVI varied with different soils, vegetation, and geomorphic types. The highest NDVI was found in alfisols, marsh vegetation, and great or intermediate undulating mountain areas. The NDVI value of the alfisols and marsh vegetation was above 0.8, indicating that the vegetation coverage was quite good. The closer the distance to the river, the greater the NDVI, and the NDVI reached maximum within the nearest distance to the river. The greater the annual precipitation, the higher the NDVI; the NDVI was 0.829 in the region with the greatest precipitation (886.77–1048.01 mm). The NDVI firstly increased and then decreased with the annual average temperature and reached the maximum at 1.81–3.50 °C. The longer the sunshine duration, the smaller the NDVI, and the NDVI reached the highest in 1727.40–2081.48 h. The variation trend of the NDVI with the minimum and maximum temperatures was consistent with the average annual temperature, which increased first and then decreased. The NDVI firstly decreased and then increased with the distance from roads and residential areas. When the population density was 44.81–73.96 people/km2 and the GDP was 6.65–241.85 ten thousand CNY/km2, the NDVI reached a maximum, and the variation trend was consistent. With the change in land use type, the NDVI value changed, and the forest vegetation coverage was the best. The lower the light intensity at night, the higher the NDVI value of the vegetation.

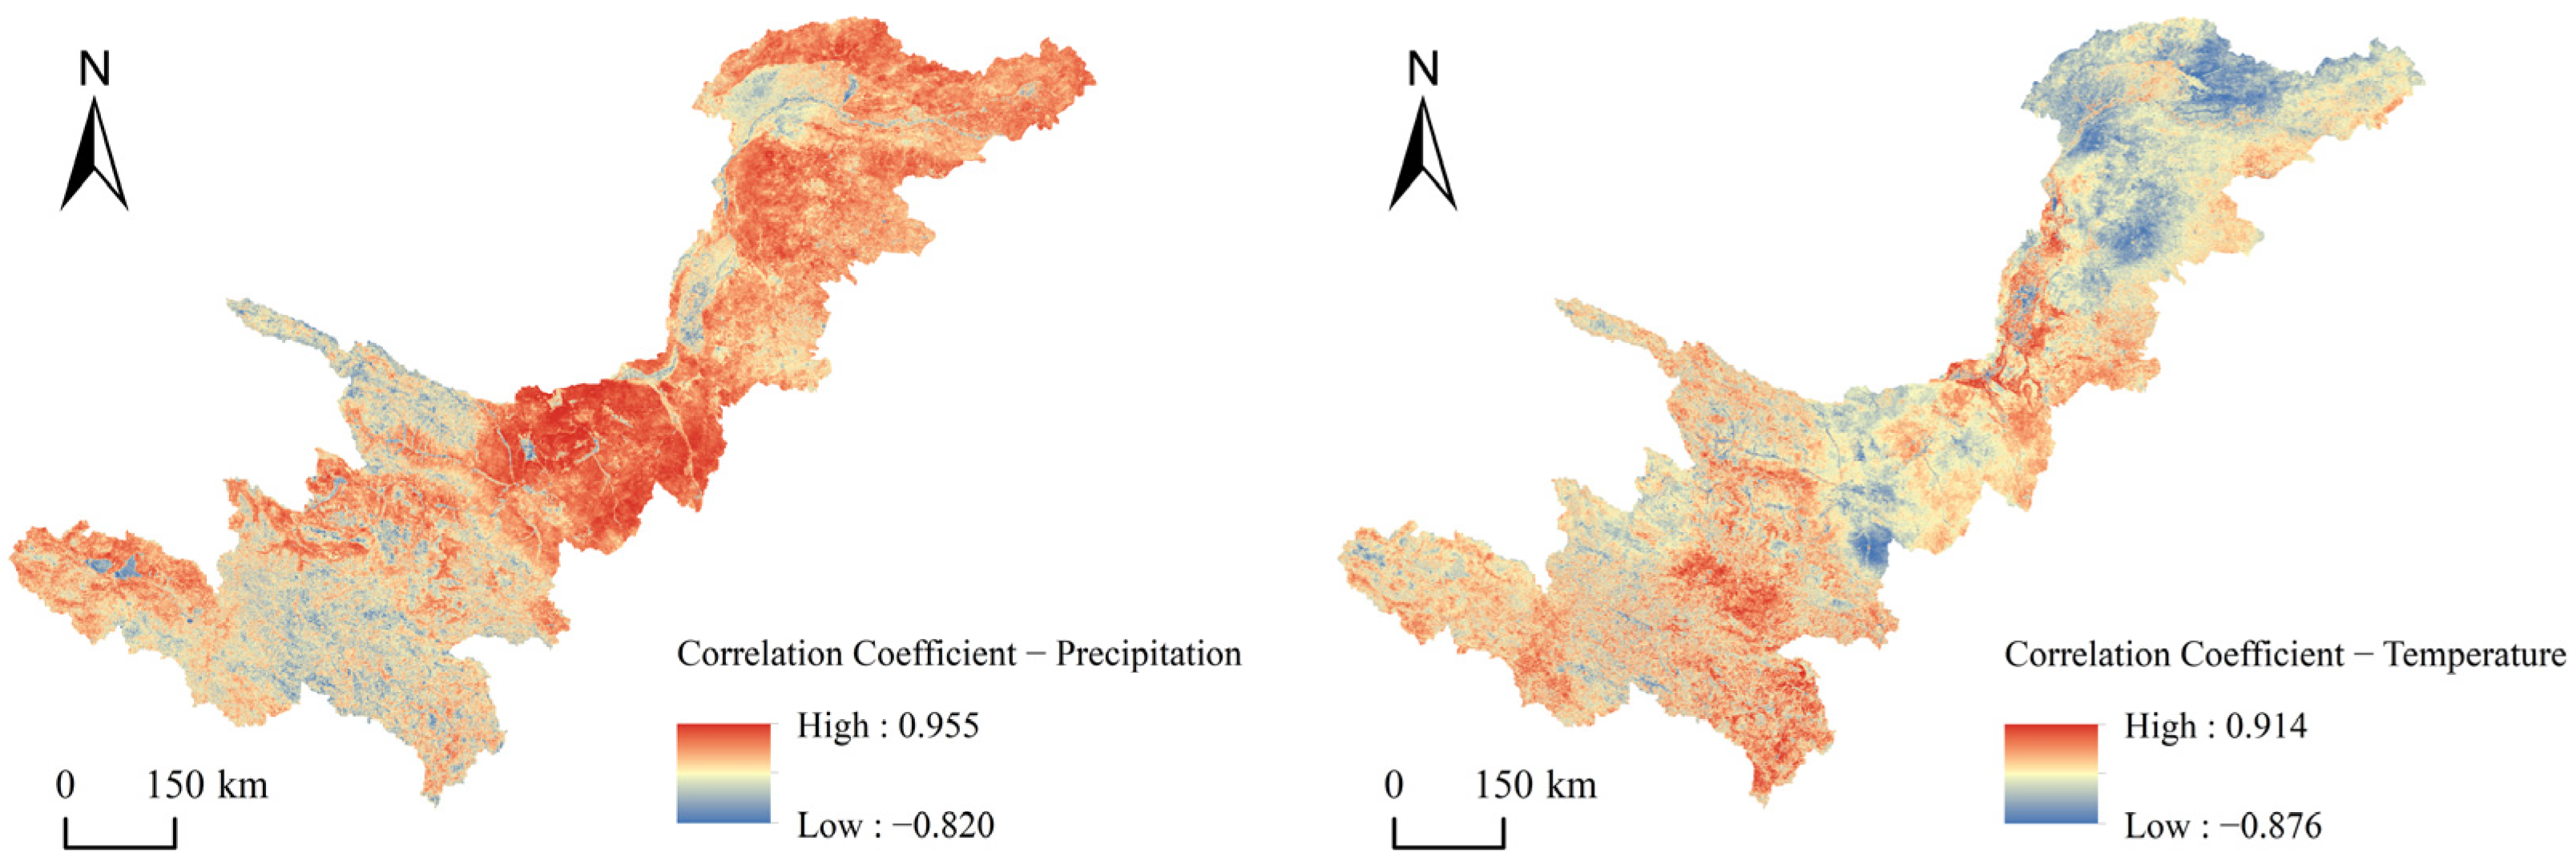
3.4. Correlation between the NDVI Change and Temperature and Precipitation

Figure 7 shows that the area of the positive correlation between the NDVI and annual precipitation accounted for 90% of the total area, while the area occupied by the changes was positively correlated with the annual average temperature, occupying 60%. Only in some areas of the SAYR was the NDVI positively correlated with the annual average temperature, but it was positively correlated with the annual precipitation in most other areas. The NDVI in the UYRB was mainly affected by the annual precipitation.

4. Discussion

4.1. Spatial and Temporal Variation Characteristics of the NDVI and Its Response to Climate Factors

The NDVI in the UYRB showed an overall rising trend from 2000 to 2020, which is the result of the joint action of climate change and human activities, consistent with the existing research results [29]. Precipitation was the most important natural element influencing NDVI; however, ecological restoration projects played a significant driving role. This is roughly the same as the research results of Cao [40]. However, Hao [28] considers minimum temperature as the main influence rather than precipitation, which may be related to the time frame of the study. Through the natural restoration, increased precipitation, and the implementation of major ecological protection and restoration projects, the trend of the ecological degradation in the UYRB was curbed, and the ecosystem was generally stable. The UYRB tended to be warmer and wetter, and the precipitation increased significantly since 2000 [40]. The vegetation index of the basin showed an increasing trend, and precipitation had an obvious improvement effect on the vegetation in the UYRB, especially in the arid and semiarid regions in the northern and central parts. The increasing vegetation coverage in the Hetao Plain was related to the large-scale project of returning farmland to grassland. The inner flow area of the Ordos Plateau had little annual precipitation, an arid climate, widespread deserts, lack of surface water, and no complete water system. The overexploitation and grazing worsened the shortage of water resources in the region. With the emphasis on ecological and environmental conservation, the governance of the Maowusu Sandy Land and Kubuqi Desert also strengthened. The ecological environment is gradually improving, and the vegetation coverage is increasing. However, there are still some problems in some areas, such as the source of the Yellow River and the Huangshui River basin; overgrazing leads to slight land degradation and a slight decrease in vegetation coverage [41,42]. Currently, the UYRB is managed according to administrative divisions, ignoring the basin’s integrity and systematicity [43]. The UYRB ecological protection needs to adjust measures to local conditions, shift from regional management to watershed management, coordinate the relationship between economic, social development and ecological environment in the watershed, and promote the sustainable development of the watershed.

4.2. NDVI Spatial Heterogeneity Drivers

The NDVI in the UYRB decreased from the southwest to the northeast, generally due to the lack of precipitation in the northeast, the relatively high elevation in the southwest, and the large amount of precipitation. Desert and grassland were mainly distributed in the northeast, with high temperature and little precipitation, which was not conducive to the growth of vegetation, and the NDVI is low. In the southwest of the SAYR, the water and heat conditions were relatively good. The vegetation type was mainly alpine meadow with high vegetation coverage. Precipitation and elevation had the greatest influence on the geographical distribution of the vegetation in the UYRB. The influence of natural factors was greater than that of human factors, which is consistent with the existing research results [44,45]. Except for the SAYR belonging to semi-humid areas, most of the other areas in the UYRB were arid or semiarid. The NDVI was greatly affected by rainfall in these areas [46].
The altitude was related to moisture, heat, and soil fertility, affecting vegetation types and coverage distribution in the region. Altitude was the main driving factor affecting the distribution of the NDVI in the UYRB. There was a large difference in the elevation between the east and west of the UYRB, which decreased from southwest to northeast. Altitude had the great influence on temperature and moisture. The elevation range of 3586–4011 m, with the largest NDVI value, is mainly distributed in the upper levels of the Huangshui River and the northeast of the source of the Yellow River, growing bush fallows and meadows. Although the water and temperature in the low-elevation area are suitable for vegetation growth, human activities are relatively frequent. With the increase in the elevation, human activities are relatively few. Heat and water are still suitable for vegetation growth within a certain range, and the vegetation coverage rises. When the elevation was greater than 4011 m, the temperature decreased with the elevation, which was not conducive to vegetation growth. At the same time, the vegetation coverage decreased.
The areas with a gentle slope are densely populated and developed in industry and agriculture, leading to lower vegetation cover. However, the area with a steep slope has fewer human activities, better vegetation growth, and higher coverage, so the NDVI value of the area with a slope > 25° in the UYRB was higher. The slope aspect changes the amount of solar radiation received, thereby affecting the spatial distribution of the vegetation. The vegetation type on the eastern slope of the UYRB is mainly grassland meadow; but the slope direction has little influence on the geographical distribution of the NDVI. The alfisols have sufficient water and high soil fertility. The marsh vegetation is mainly distributed In the Ruoergai area of northern Sichuan Province, southeast of the SAYR. The water and temperature are sufficient, and the herbaceous marsh vegetation grows well in this area. With an increase in the altitude, the soil temperature decreases, humidity increases, the decomposition rate of organic matter slows down, leaching and podzolization are strengthened, and fertility is higher. Therefore, vegetation growth is better in medium and large undulated mountains with higher altitudes. Rivers can provide water for vegetation growth, so the closer the distance to the river, the greater the NDVI. Proper light time and temperature can promote the photosynthesis of vegetation, while excessive solar radiation and temperature reduce soil moisture and NDVI. Vegetation is not sensitive to heat conditions, but the increase in temperature will increase evapotranspiration and cause water loss, which will harm vegetation growth. Therefore, the NDVI was low for too low or too high temperature and long sunshine time. The NDVI reached a maximum value far from road and settlements, indicating that road construction greatly impacts vegetation. The area farthest from roads is less disturbed by human activities, and the NDVI value was higher. The impacts of population density and GDP on the NDVI distribution shows that human activities will not cause great interference with vegetation within a certain range. However, excessive production activities will damage the growth of vegetation. The change in the NDVI with the night light index also shows the same truth. The land use types in the UYRB are mainly medium- and low-cover grassland, accounting for 25.9% and 21.6%, respectively. The area of medium grassland coverage with an NDVI > 0.6 accounted for 49.5%, and low grassland coverage with an NDVI > 0.6 accounted for 37.3%. Forest land accounted for only 8.5% of the total area of the UYRB. However, the area of medium–high and high vegetation coverage (NDVI > 0.6) accounted for 81.4% of the forest land area. The vegetation types of forest land are mainly shrubs and meadows.
The increase in the vegetation was primarily related to the large number of ecological conservation programs started in 2000, which promoted carbon sequestration and reduced soil consumption, but the corresponding impact of the ecological conservation on the soil moisture consumption should not be ignored [47]. Unscientific implementation of ecological projects in the upper reaches of the semi-arid Yellow River may lead to increased land degradation through soil moisture consumption; therefore, agricultural land reforestation (grass) projects should be implemented scientifically to improve the efficiency of vegetation precipitation use and promote vegetation growth so that ecological restoration continues to be effectively improved.

4.3. Impacts and Limitations

This research is the first time to use a geographical detector that can effectively detect the spatial differentiation of vegetation to study the driving force of the spatial distribution of the NDVI in the UYRB. The MOD13Q1 data with a spatial resolution of 250 m were used in our investigation, since it has a better spatial resolution. Compared with previous studies, the data used in this study are more accurate, but the time series is limited. We only looked at changes in NDVI from 2000 until the present. There is no comparison to the NDVI before implementing ecological engineering in 2000. Quantifiable human activity indicators are difficult to obtain, and the quantitative study of human factors affecting NDVI changes can continue indefinitely. The classification methods and standards of independent variables range from person to person, resulting in variations in research outcomes. In the future, it is necessary to study the sustainability of vegetation change further to provide more effective suggestions for vegetation restoration and sustainable development in the UYRB.

5. Conclusions

This study used MODIS NDVI data with a 250 m spatial resolution to analyze the temporal and spatial variation characteristics of the NDVI in UYRB from 2000 to 2020 by the trend analysis method. Geographical detectors were used to detect the spatial variability, driving force, interaction, and suitability of the NDVI. The Pearson correlation method was used to analyze the correlation between the NDVI change and temperature and precipitation, and the following main conclusions were reached:
(1)
The average annual NDVI of the UYRB from 2000 to 2020 was 0.515. The spatial distribution of the NDVI showed obvious spatial heterogeneity. The geographical distribution of the NDVI was high in the southwest and low in the northeast.
(2)
The NDVI showed a significant upward trend at a rate of 0.038/10a. The spatial vegetation coverage was significantly improved, and it was slightly degraded in the SAYR.
(3)
Annual precipitation and elevation were the main driving factors affecting the spatial distribution of the NDVI in the UYRB, with the predictive power reaching 47% and 46%, respectively. The second factors were soil type, vegetation type, and annual mean temperature, with an explanatory power of 44%, 41%, and 40%, respectively. The influence of natural factors were greater than that of human factors, but the interaction of natural and human factors had a greater impact on NDVI, showing nonlinear enhancement and double factor enhancement. The q-value of interaction between the annual precipitation and soil type was the highest, reaching 61%.
(4)
The change in the NDVI in the UYRB was caused by climate factors and human activities. The increase in the precipitation was the main natural factor that led to the overall increase of the NDVI. The artificial ecological restoration project also effectively restored the vegetation coverage.

Author Contributions

Conceptualization, J.H. and J.W.; methodology, J.H. and X.Z.; software, X.Z. and J.Z.; validation, J.H. and X.Z.; formal analysis, J.W.; investigation, J.H.; resources, X.Z. and J.Z.; data curation, X.Z.; writing—original draft preparation, J.H.; writing—review and editing, X.Z.; visualization, J.H. and J.Z.; supervision, J.W.; project administration, J.H. and X.Z. All authors have read and agreed to the published version of the manuscript.

Funding

This research was funded by the National Natural Science Foundation of China (Nos. 51979284 and 42041007-03).

Institutional Review Board Statement

Not applicable.

Informed Consent Statement

Not applicable.

Data Availability Statement

The data presented in this research are available upon request from the corresponding author.

Acknowledgments

The authors would like to thank the anonymous reviewers for their comments and suggestions, which contributed to the further improvement of this paper.

Conflicts of Interest

The authors declare no conflict of interest.

References

  1. Meng, Z.Q.; Liu, M.; Gao, C.C.; Zhang, Y.; She, Q.N.; Long, L.B.; Tu, Y.; Yang, Y.X. Greening and browning of the coastal areas in mainland China: Spatial heterogeneity, seasonal variation and its influential factors. Ecol. Indic. 2020, 110, 105888. [Google Scholar] [CrossRef]
  2. Zhou, Z.; Ding, Y.; Shi, H.; Cai, H.; Fu, Q.; Liu, S.; Li, T. Analysis and prediction of vegetation dynamic changes in China: Past, present and future. Ecol. Indic. 2020, 117, 106642. [Google Scholar] [CrossRef]
  3. Liu, Y.; Lei, H. Responses of Natural Vegetation Dynamics to Climate Drivers in China from 1982 to 2011. Remote Sens. 2015, 7, 10243–10268. [Google Scholar] [CrossRef] [Green Version]
  4. Kattenborn, T.; Leitloff, J.; Schiefer, F.; Hinz, S. Review on Convolutional Neural Networks (CNN) in vegetation remote sensing. ISPRS J. Photogramm. Remote Sens. 2021, 173, 24–49. [Google Scholar] [CrossRef]
  5. Zhang, Y.; Migliavacca, M.; Penuelas, J.; Ju, W. Advances in hyperspectral remote sensing of vegetation traits and functions. Remote Sens. Environ. 2020, 252, 112121. [Google Scholar] [CrossRef]
  6. Qu, S.; Wang, L.; Lin, A.; Yu, D.; Yuan, M.; Li, C. Distinguishing the impacts of climate change and anthropogenic factors on vegetation dynamics in the Yangtze River Basin, China. Ecol. Indic. 2019, 108, 105724. [Google Scholar] [CrossRef]
  7. Zhang, W.; Jin, H.; Shao, H.; Li, A.; Li, S.; Fan, W. Temporal and Spatial Variations in the Leaf Area Index and Its Response to Topography in the Three-River Source Region, China from 2000 to 2017. ISPRS Int. J. Geo-Inf. 2021, 10, 33. [Google Scholar] [CrossRef]
  8. Soares, C.; Silva, J.M.N.; Boavida-Portugal, J.; Cerasoli, S. Spectral-based monitoring of climate effects on the inter-annual variability of different plant functional types in Mediterranean cork oak woodlands. Remote Sens. 2022, 14, 711. [Google Scholar] [CrossRef]
  9. Chang, J.; Gong, L.; Zeng, F.; Xue, J.; Mao, D.; Cao, Y.; Mu, G.; Wang, S. Using hydro-climate elasticity estimator and geographical detector method to quantify the individual and interactive impacts on NDVI in oasis-desert ecotone. Stoch. Environ. Res. Risk Assess. 2022, 36, 3131–3148. [Google Scholar] [CrossRef]
  10. Chen, S.; Zhu, Z.; Liu, X.; Yang, L. Variation in Vegetation and Its Driving Force in the Pearl River Delta Region of China. Int. J. Environ. Res. Public Health 2022, 19, 10343. [Google Scholar] [CrossRef]
  11. Hao, H.; Chen, Y.; Xu, J.; Li, Z.; Li, Y.; Kayumba, P.M. Water Deficit May Cause Vegetation Browning in Central Asia. Remote Sens. 2022, 14, 2574. [Google Scholar] [CrossRef]
  12. Wei, Y.; Sun, S.; Liang, D.; Jia, Z. Spatial–temporal variations of NDVI and its response to climate in China from 2001 to 2020. Int. J. Digit. Earth 2022, 15, 1463–1484. [Google Scholar] [CrossRef]
  13. Li, H.; Li, K.; Zhao, X.; Zhao, J. Changes in Vegetation Greenness and Their Influencing Factors in Southern China. Remote Sens. 2022, 14, 3291. [Google Scholar] [CrossRef]
  14. Li, Y.; Gong, J.; Zhang, Y.; Gao, B. NDVI-Based Greening of Alpine Steppe and Its Relationships with Climatic Change and Grazing Intensity in the Southwestern Tibetan Plateau. Land 2022, 11, 975. [Google Scholar] [CrossRef]
  15. Ji, Z.; Pan, Y.; Zhu, X.; Wang, J.; Li, Q. Prediction of crop yield using phenological information extracted from remote sensing veg-etation index. Sensors 2021, 21, 1406. [Google Scholar] [CrossRef]
  16. Zhan, C.; Liang, C.; Zhao, L.; Jiang, S.; Niu, K.; Zhang, Y.; Cheng, L. Vegetation Dynamics and its Response to Climate Change in the Yellow River Basin, China. Front. Environ. Sci. 2022, 10, 892747. [Google Scholar] [CrossRef]
  17. Liu, S.; Shao, Q.; Ning, J.; Niu, L.; Zhang, X.; Liu, G.; Huang, H. Remote-Sensing-Based Assessment of the Ecological Restoration Degree and Restoration Potential of Ecosystems in the Upper Yellow River over the Past 20 Years. Remote Sens. 2022, 14, 3550. [Google Scholar] [CrossRef]
  18. Wang, D.; Feng, H.; Zhang, B.; Wei, Z.; Tian, Y. Quantifying the impacts of climate change and vegetation change on decreased runoff in china’s yellow river basin. Ecohydrol. Hydrobiol. 2021, 22, 310–322. [Google Scholar] [CrossRef]
  19. Zhao, F.; Ma, S.; Wu, Y.; Qiu, L.; Wang, W.; Lian, Y.; Chen, J.; Sivakumar, B. The role of climate change and vegetation greening on evapotranspiration variation in the Yellow River Basin, China. Agric. For. Meteorol. 2022, 316, 108842. [Google Scholar] [CrossRef]
  20. Wang, G.J.; Peng, W.F. Quantifying spatiotemporal dynamics of vegetation and its differentiation mechanism based on geo-graphical detector. Environ. Sci. Pollut. Res. Int. 2022, 29, 32016–32031. [Google Scholar] [CrossRef]
  21. Wang, J.; Geodetector, X.C. Principle and prospective. Acta Geogr. Sin. 2017, 72, 116–134. (In Chinese) [Google Scholar]
  22. Wang, Y.; Zhang, Z.; Chen, X. Quantifying influences of natural and anthropogenic factors on vegetation changes based on ge-odetector: A case study in the Poyang Lake Basin, China. Remote Sens. 2021, 13, 5081. [Google Scholar] [CrossRef]
  23. Gao, S.; Dong, G.; Jiang, X.; Nie, T.; Yin, H.; Guo, X. Quantification of Natural and Anthropogenic Driving Forces of Vegetation Changes in the Three-River Headwater Region during 1982–2015 Based on Geographical Detector Model. Remote Sens. 2021, 13, 4175. [Google Scholar] [CrossRef]
  24. Zhao, R.; Zhan, L.; Yao, M.; Yang, L. A geographically weighted regression model augmented by Geodetector analysis and principal component analysis for the spatial distribution of PM2.5. Sustain. Cities Soc. 2020, 56, 102106. [Google Scholar] [CrossRef]
  25. Zhou, X.; Wen, H.; Zhang, Y.; Xu, J.; Zhang, W. Landslide susceptibility mapping using hybrid random forest with GeoDetector and RFE for factor optimization. Geosci. Front. 2021, 12, 101211. [Google Scholar] [CrossRef]
  26. Matomela, N.; Li, T.; Ikhumhen, H.O.; Raimundo Lopes, N.D.; Meng, L. Soil erosion spatiotemporal exploration and Geodetection of driving factors using InVEST-Sediment Delivery Ratio and Geodetector models in Dongsheng, China. Geocarto Int. 2022, 1–16. [Google Scholar] [CrossRef]
  27. Liu, J.; Xu, Q.; Yi, J.; Huang, X. Analysis of the heterogeneity of urban expansion landscape patterns and driving factors based on a combined Multi-Order Adjacency Index and Geodetector model. Ecol. Indic. 2022, 136, 108655. [Google Scholar] [CrossRef]
  28. Hao, F.; Zhang, X.; Ouyang, W.; Skidmore, A.K.; Toxopeus, A.G. Vegetation NDVI Linked to Temperature and Precipitation in the Upper Catchments of Yellow River. Environ. Model. Assess. 2012, 17, 389–398. [Google Scholar] [CrossRef] [Green Version]
  29. Ye, L.; Qiang, Z.; Ying, W.; Lili, X.; Linjun, H.; Rong, L. Climate change in the upper Yellow River Basin and its impact on ecological vegetation and runoff from 1980 to 2018. Trans. Atmos. Sci. 2020, 43, 967–979. (In Chinese) [Google Scholar]
  30. Cao, R.; Jiang, W.; Yuan, L.; Wang, W.; Lv, Z.; Chen, Z. Inter-annual variations in vegetation and their response to climatic factors in the upper catchments of the Yellow River from 2000 to 2010. J. Geogr. Sci. 2014, 24, 963–979. [Google Scholar] [CrossRef] [Green Version]
  31. Cheng, Y.; Wu, L.; Liu, F.; Shen, Y. Variation characteristics of runoff and precipitation in the upper Reaches of the Yellow River in recent 60 years. Grid Land Geogr. 2022, 45, 1022–1031. (In Chinese) [Google Scholar]
  32. Holben, B.N. Characteristics of maximum-value composite images from temporal AVHRR data. Int. J. Remote Sens. 1986, 7, 1417–1434. [Google Scholar] [CrossRef]
  33. Liu, C.; Li, W.; Wang, W.; Zhou, H.; Liang, T.; Hou, F.; Xu, J.; Xue, P. Quantitative spatial analysis of vegetation dynamics and potential driving factors in a typical alpine region on the northeastern Tibetan Plateau using the Google Earth Engine. Catena 2021, 206, 105500. [Google Scholar] [CrossRef]
  34. Hao, J.; Xu, G.; Luo, L.; Zhang, Z.; Yang, H.; Li, H. Quantifying the relative contribution of natural and human factors to vegetation coverage variation in coastal wetlands in China. Catena 2019, 188, 104429. [Google Scholar] [CrossRef]
  35. Nie, T.; Dong, G.; Jiang, X.; Lei, Y. Spatio-Temporal Changes and Driving Forces of Vegetation Coverage on the Loess Plateau of Northern Shaanxi. Remote Sens. 2021, 13, 613. [Google Scholar] [CrossRef]
  36. Gu, Z.; Duan, X.; Shi, Y.; Li, Y.; Pan, X. Spatiotemporal variation in vegetation coverage and its response to climatic factors in the Red River Basin, China. Ecol. Indic. 2018, 93, 54–64. [Google Scholar] [CrossRef]
  37. Wang, J.-F.; Zhang, T.-L.; Fu, B.-J. A measure of spatial stratified heterogeneity. Ecol. Indic. 2016, 67, 250–256. [Google Scholar] [CrossRef]
  38. Wang, J.-F.; Li, X.-H.; Christakos, G.; Liao, Y.-L.; Zhang, T.; Gu, X.; Zheng, X.-Y. Geographical detectors-based health risk assessment and its application in the neural tube defects study of the Heshun region, China. Int. J. Geogr. Inf. Sci. 2010, 24, 107–127. [Google Scholar] [CrossRef]
  39. Kalisa, W.; Igbawua, T.; Henchiri, M.; Ali, S.; Zhang, S.; Bai, Y.; Zhang, J. Assessment of climate impact on vegetation dynamics over East Africa from 1982 to 2015. Sci. Rep. 2019, 9, 1–20. [Google Scholar] [CrossRef] [Green Version]
  40. Cao, Y.; Sun, Y.; Chen, Z.; Yan, H.; Qian, S. Dynamic changes of vegetation ecological quality in the Yellow River Basin and its response to extreme climate during 2000–2020. Acta Ecol. Sin. 2022, 42, 4524–4535. (In Chinese) [Google Scholar]
  41. Dai, P.; Zhang, B.; Wang, H.; Wang, Y.; Li, D.; Wang, X. Spatiotemporal variation of vegetation NDVI in the Qilian Mountains during the period from 1999 to 2007. Arid. Zone Res. 2010, 4, 585–591. (In Chinese) [Google Scholar]
  42. Junqi, W.; Guangjun, W.; Sihai, L. Extraction and spatiotemporal analysis of vegetation coverage from 1996 to 2015 in the source region of the Yellow River. J. Glaciol. Geocryol. 2021, 43, 662–674. (In Chinese) [Google Scholar]
  43. Yang, Y.; Zhang, X.; Mu, Y.; Zhang, W. The basic logic and core strategies of ecological protection and high-quality development in the upper reaches of the Yellow River. Econ. Geogr. 2020, 40, 9–20. (In Chinese) [Google Scholar]
  44. Lu, C.; Hou, M.; Liu, Z.; Li, H.; Lu, C. Variation Characteristic of NDVI and its Response to Climate Change in the Middle and Upper Reaches of Yellow River Basin, China. IEEE J. Sel. Top. Appl. Earth Obs. Remote Sens. 2021, 14, 8484–8496. [Google Scholar] [CrossRef]
  45. Pei, Z.L.; Yang, Q.K.; Wang, C.M.; Pang, G.W.; Yang, L.H. Spatial distribution of vegetation coverage and its affecting factors in the upper reaches of the Yellow River. Arid. Zone Res. 2019, 36, 546–555. (In Chinese) [Google Scholar]
  46. Sohoulande Djebou, D.C.S.; Singh, V.P.; Frauenfeld, O.W. Vegetation response to precipitation across the aridity gradient of the southwestern United States. J. Arid. Environ. 2015, 115, 35–43. [Google Scholar] [CrossRef]
  47. Yang, L.; Horion, S.; He, C.; Fensholt, R. Tracking Sustainable Restoration in Agro-Pastoral Ecotone of Northwest China. Remote Sens. 2021, 13, 5031. [Google Scholar] [CrossRef]
Figure 1. Schematic diagram of the UYRB.
Sustainability 15 01922 g001
Figure 2. Spatial distribution of the NDVI.
Sustainability 15 01922 g002
Figure 3. Spatial distribution of the NDVI variation trend.
Sustainability 15 01922 g003
Figure 4. NDVI area of different grades: (I) low vegetation coverage (<0.2); (II) medium–low vegetation coverage (0.2–0.4); (III) medium–high vegetation coverage (0.4–0.6); (IV) medium–high vegetation coverage (0.6–0.8); (V) high vegetation coverage (>0.8) (right).
Sustainability 15 01922 g004
Figure 5. Temporal variation trend of the NDVI from 2000 to 2020.
Sustainability 15 01922 g005
Figure 6. Interactive detection and ecological detection results. * and ** represent nonlinear enhancement and double factor enhancement, respectively. The red box shows no significant difference between the two factors.
Sustainability 15 01922 g006
Figure 7. Spatial distribution of the correlation coefficient between the NDVI and temperature and precipitation.
Sustainability 15 01922 g007
Table 1. The detection factors of the NDVI.
TypeDetection FactorIndexUnitClassesFoundation
TerrainX1Slope°7The technical regulations of land use investigation
X2Slope direction°9Slope direction
X3Elevationm9Tatural breakpoint method
SoilX4Soil type14The standard “soil occurrence classification” system
VegetationX5Vegetation type10The 1:1,000,000 Chinese vegetation map
LandformX6Landform type6The 1:1,000,000 Geomorphic Atlas of the People’s Republic of China
RiverX7Distance from riverskm8Natural breakpoint method
ClimateX8Annual precipitationmm8
X9Annual average temperature°C8
X10Sunshine hoursh8
X11Lowest temperature°C8
X12Highest temperature°C9
Human activitiesX13Distance from roadskm8
X14Distance from settlementskm9
X15Population densitypeople/km29
X16GDPten thousand CNY/km29
X17Land use type8The 1:1,000,000 Land Use China’s map
X18Night light intensity8Natural breakpoint method
Table 2. Types of interactions of detection factors.
BasisInteractionInterpretation
q (X1 ∩ X2) < Min [q (X1), q (X2)]Nonlinear weakeningThe interaction nonlinear attenuates the effect of a single variable
Min [q (X1), q (X2) < q (X1 ∩ X2) < Max (q (X1), q (X2)]Single factor weakeningThe interaction singly attenuates the effect of a single variable
q (X1 ∩ X2) > Max [q (X1), q (X2)]Two factor enhancementThe interaction doubly amplifies the effect of the individual variables
q (X1 ∩ X2) = q (X1) + q (X2)independentThe effects of the two factors are independent
q (X1 ∩ X2) > q (X1) + q (X2)Nonlinear enhancementThe interaction nonlinearly enhances the influence of individual variables
Table 3. NDVI variation trend.
Variation TrendSlopeProportion
Significant Decrease−0.0472–−0.01130.53%
Moderate Decrease−0.0113–−0.00233.29%
Slight Decrease−0.0023–0.001527.80%
Basically Unchanged0.0015–0.004532.82%
Slight Increase0.0045–0.008622.05%
Moderate Increase0.0086–0.016111.93%
Significant Increase0.0161–0.04861.58%
Table 4. q-Value of the detection factors.
Detection FactorX1X2X3X4X5X6X7X8X9X10X11X12X13X14X15X16X17X18
q0.0850.0030.4620.4420.4090.1810.1550.4660.3960.3390.3250.3820.0050.0310.1250.2210.1530.007
p0.0000.0000.0000.0000.0000.0000.0000.0000.0000.0000.0000.0000.0000.0000.0000.0000.0000.000
Table 5. Detection factor range or type.
FactorRange/TypeNDVI
Slope>25°0.684, 0.693, 0.681
Slope aspectEast0.589
Elevation3586–4011 m0.795
Soil typeLeachate soil0.845
Vegetation typeMarsh vegetation0.867
Geomorphic typesMedium, large undulating mountains0.711, 0.701
Distance from the river0–6.10 km0.617
Annual precipitation886.77–1048.01 mm0.829
Annual average temperature1.81–3.50 °C0.762
Sunshine hours1727.40–2081.48 h0.790
Lowest temperature−3.90–2.30 °C0.780
Maximum temperature9.32–10.87 °C0.753, 0.752
Distance from the road43.33–58.00 km0.647, 0.694
Distance from settlements56.70–67.48 km0.664
Population density44.81–73.96 people/km20.697
GDP6.65–241.85 ten thousand CNY/km20.709
Land use typeWoodland0.734
Light intensity at night0–3.530.571
Disclaimer/Publisher’s Note: The statements, opinions and data contained in all publications are solely those of the individual author(s) and contributor(s) and not of MDPI and/or the editor(s). MDPI and/or the editor(s) disclaim responsibility for any injury to people or property resulting from any ideas, methods, instructions or products referred to in the content.

