Article

“Digitalisation” and “Greening” as Components of Technology Upgrading and Sustainable Economic Performance †

by
Randolph Luca Bruno
1,2,3,4,
Monika Matusiak
5,*,
Kirill Osaulenko
1 and
Slavo Radosevic
1
1
School of Slavonic and East European Studies, University College London, 16 Taviton Street, London WC1H 0BW, UK
2
Rodolfo DeBenedetti Foundation, 20135 Milan, Italy
3
IZA Institute of Labor, 53113 Bonn, Germany
4
Department of Economic Policy, Catholic University of Milan, 20123 Milano, Italy
5
European Commission, Joint Research Centre, 41092 Seville, Spain
*
Author to whom correspondence should be addressed.
The views expressed are purely those of the authors and may not in any circumstances be regarded as stating an official position of the European Commission.
Sustainability 2023, 15(3), 1838; https://doi.org/10.3390/su15031838
Submission received: 16 October 2022 / Revised: 6 January 2023 / Accepted: 12 January 2023 / Published: 18 January 2023

Abstract

:
This paper explores the pace and direction of technological development by using a technology upgrade conceptual and measurement framework. This approach is applied to a sample of 164 economies worldwide between 2002 and 2019. Within the framework of technology upgrading, the paper focuses on digitalisation and “greening” as its two significant structural features. We explore their relationship with different components of technology upgrading and the relationship between technology upgrading components and different indicators of macroeconomic productivity. We have adopted a longitudinal fixed effects regression method with control for unobserved heterogeneity, clustered standard errors, and time dummies. Our results show that the growth of research and development (R&D) capabilities does not translate into aggregate productivity growth. There is a lack of unconditional relationship between aggregate productivity growth, digitalisation and greening. However, there are “latecomer advantages” to basic digitalisation for lower middle- and low-income economies and “latecomer liabilities” in the greening of the economy for upper-middle-income economies. In addition, levels of digitalisation and greening do not correlate, suggesting these two transformation processes are not yet integrated into ‘ICT-assisted greening’. When we control for income levels, the impact of components of technology upgrading on productivity is isolated to specific components and significant only for some income groups. The absence of a significant simultaneous effects of several components of technology upgrading on productivity points to large transformation failures. We conclude that the role of science and technology systems in spurring sustainable development would require a broad scope for science and technology (S&T) policies, their coordination, and integration with non-innovation policies.

1. Introduction

The paper applies the technology upgrading framework developed by Radosevic and Yoruk [1,2] to investigate the dynamics and morphology of technological upgrading in 164 economies with a particular focus on digitalisation and “greening”. The technology upgrading framework is located between aggregate and micro/mezzo theories of economic growth. Moreover, it exemplifies new metrics to measure the innovation potential appropriate for economies catching up to the technology frontier. The pathways to technology upgrading are displayed in a three-dimensional space: (A) the intensity and types of technology upgrading; (B) the breadth of technology upgrading (that incorporates the sub-components of digitalisation and “greening”); and (C) technology transfer/exchange/interaction with the global economy (see for example [3] on technology transfer in developing countries).
The three components of technology upgrading are relatively independent but mutually reliant, with different degrees of substitutability and complementarities. These properties allow tracking the routes to technology upgrading, understanding the trade-offs between various components, and exploring differences in the potential for long-term sustainable development. The dimensions of “digitalisation” and “greening” are vital to the overall process of technology upgrading and the quest for long-term sustainable growth. In fact, unlike most of the literature, which explores digitalisation and “greening” as separate issues, this paper explores them in the context of the overall technology upgrading process linked to other components of technology upgrading. Whether “greening” and digitalisation will contribute to upgrading depends on their complementarities (and, to a much lesser extent, substitutability) with other upgrading processes. Moreover, the relationship between “greening”, digitalisation and other components of technology upgrading may crucially vary at different income levels. The underlying idea is to explore: (a) the patterns of the three dimensions of technology upgrading; (b) the relationship between technology upgrading (depth, breadth, and knowledge exchange) and development (e.g., economic growth); (c) the connection between technology upgrading and conventional macro proxies for technology (labour productivity and total factor productivity); and (d) the relationship between “greening” and digitalisation as two “directional” components of structural upgrading. If growth is sustainable, it needs to be “green” and digitally driven. Based on these assumptions, the paper’s goal is to empirically test the role of various components of technology upgrading and how they relate to conventional macro-indicators of economic growth.
We find that changes in the index of technology upgrading contribute as components of changes in total factor productivity and two traditional measures of labour productivity and income per capita across countries. Technology upgrading gives us a much more nuanced understanding of the drivers behind such macro indicators.
The paper is organised as follows. Section 2 briefly locates our measurement approach in the context of the conventional literature on the measurement of technology development. Section 3 presents the conceptual framework, methodology, and research hypotheses. Section 4 reports results in several sub-sections. Section 4.1. describe the current levels of technology upgrading and the relationships between its three components. Section 4.2. looks at the dynamics of technology upgrading based on data from 2002 to 2019; it pinpoints the different routes to technology upgrading within the sample of 164 economies. Section 4.3 scrutinises the empirical relations between indexes and conventional macro indicators (total factor productivity, two proxies of labour productivity, and income per capita). The empirical analysis tests the robustness and significance of the framework by highlighting those components strongly correlated to conventional measures of countries’ performance. Moreover, it shows how such correlations differ depending on the level of development, highlighting possible non-linearities. Section 5 further discusses results. Section 6 concludes and hints at future research avenues.

2. Literature Review

The measurement of science and technology (S&T) development or, broadly, technology accumulation is challenging due to its multidimensional nature. Here we term this process technology upgrading, and its conceptualisation and measurement are non-trivial issues that isolated indicators cannot capture [1,2]. Technology upgrading is not only about the simple accumulation of a stock of capital or productivity improvements at the current technological level. On the contrary, it refers to the accumulation of a range of diverse capabilities (production, technology, research and development—R&D—, etc.), their structural transformation (e.g., digital transformation and “greening” [4,5], and the pairing of domestic technology efforts to technology transfer within and across countries [3,6]. As countries develop, they experience changes in the intensity of different S&T and production activities, restructuring their technology capabilities and supporting infrastructures (infrastructure upgrading) and modes and intensities of interaction with the global economy.
The conventional approach would be to reduce technology upgrading to a single efficiency measure, such as labour productivity or total factor productivity, or confine it to R&D and patents as the most used indicators [7]. Although such approaches would capture some aspects of technology upgrading, they remain pretty limited in their assumptions and insights. From our perspective, they hide more than reveal, especially regarding the direction of technological upgrading.
Alternative approaches involve using a wide range of indicators and composite indicators, which proxies the multidimensional nature of this process based on knowledge production function logic. These approaches are informative but too often are devoid of theoretical grounding and assume the same pattern of technology upgrading across economies of all levels of development [1,2]. By “digitalisation”, we denote the integration of digital technology into all areas of business, economic and social activities, which fundamentally changes how actors in these activities operate [8]. “Greening” of an economy is the increase in economic activities that lead to reduced carbon emissions and pollution, enhanced energy and resource efficiency, and prevention of the loss of biodiversity and ecosystem services [4]. Hence, our paper fills this clear research gap with specific research questions: can “digitalisation” and “greening” be considered components of technology upgrading and sustainable economic performance? Can we identify patterns of technology upgrading that are “hidden” behind traditional macroeconomic performance indicators? How can we decompose efficiency measures—such as total factor productivity or labour productivity—into more fine-grained “technology” facets?
The issue of twin transformation has been neglected both academically [9,10] and policy-wise [11]. Ultimately, our research goal is to contribute to the growing literature on digitalisation and greening from a quantitative and indicators-based perspective, complementing more descriptive or qualitative approaches.

3. Data and Methods: A Conceptualisation of the Measure of Technology Upgrading

Total factor productivity (TFP) is a widely used proxy of the technology component of growth, although technological change does not necessarily translate into TFP change. Additionally, TFP growth is not necessarily caused by technological change, and TFP may understate the eventual importance of productivity change in stimulating the growth of output [12,13,14]. Given these limitations, it may be realistic to consider TFP as the representation of the proximate source of growth.
Compared to TFP, labour productivity (e.g., defined as value added per person employed or per hour worked) is simple to calculate and interpret. However, higher value added per person employed might reflect higher capital intensity than more productive labour use [15]. Consequently, productivity tends to be higher in capital-intensive industries with monopoly power [16]. Despite their wide use, the value of individual but partial indicators, such as patents or R&D, is of limited relevance for economies whose technology activities are mainly behind the technology frontier [14].
Technology upgrading as a conceptual and measurement solution suggested in this paper is conceived as a multidimensional and multi-directional (i.e., direction and speed) construct. It is based on a broad understanding of innovation, including R&D and technology generation and production (manufacturing and service) capabilities [17]. Technology upgrading is also about structural change along five dimensions: broadly defined infrastructure, knowledge diversification, firms’ structure and their organisational capabilities [18,19], digitalisation, and “greening” [4,5]. Finally, technology upgrading would interact with the global economy via international trade, knowledge, and investment flows [20].
Technology upgrading refers to technological intensity (speed) and structure (direction) changes. The index of technology upgrading consists of index A (intensity/speed) and index B (breadth/direction) (Appendix A). This aggregation (A + B) leads to “the” index of technology upgrading [21]. These two dimensions are considered within the broader context of integration into global value chains [1,2]. We consider the index of technology exchange with the worldwide economy as a moderating variable which does not directly impact technology upgrading but can amplify or ease the effects of technology upgrading depending on the intensity and modes of the interaction with the global economy. For example, FDI alone does not represent technology accumulation but only its potential unless FDI impact is not reflected in local firms’ production, technology, or R&D capabilities. Given this rich structure of the indicator, we formulate the following three research hypotheses:
  • Does technology change (or its growth rate) “translate” into a change in total factor productivity, especially when accounting for unobserved heterogeneity, macroeconomic shocks, and lagged effect?
  • Does technology change (or its growth rate) “translate” into a change in labour productivity when accounting for unobserved heterogeneity, macro-economic shocks, and lagged effect?
  • Does technology change (or its growth rate) “translate” into a change in economic growth when accounting for unobserved heterogeneity, macro-economic shocks and lagged effect?
To answer such hypotheses, we have conducted a comprehensive data collection exercise. Annexe 4 presents each index’s sources, availability, weights, and indicators. All the indexes and sub-indexes standardise over a 0–100 scale. Table A5 introduces the elements of the technology-upgrading framework. The individual indicators (Index A technology intensity and Index B structural features) are composed of sub-indexes and consequently used to construct the latent variables for a composite Indicator of Technology Upgrading (ITU). The sub-index of the intensity of technology upgrading (A) incorporates “production capability,” “technology capability,” and “R&D and knowledge intensity,” which are three pillars, which, in turn, are composed of 15 indicators. The second sub-index of breadth denotes the structural dimensions of technology upgrading (Index B). This index consists of broadly defined “infrastructure,” “knowledge diversification,” “firms’ structure and their organisational capabilities”, “digitalisation”, and ““greening”. ”These five pillars, in turn, are composed of 27 sub-indicators. Finally, Index C—interaction with the global economy—is based on six sub-indicators that reflect different dimensions of knowledge interaction of the economy: net inflows of foreign direct investment (FDI), net outflows of foreign direct investment (FDI), receipts for technology, payments for technology, economic complexity, and share of exports in sophisticated products [22]. Although intensive inflows of capital and knowledge may facilitate sophisticated exports, they are unlikely to increase productivity or domestic technology upgrading per se [23,24,25]. Hence, this methodology considers exchanging knowledge and technology with the global economy as a standalone component of technology upgrading.

4. Results

4.1. A Bird-Eye View: How Countries Score in Their Capacity for Technology Upgrading

This section explores the diversity of technology upgrading paths on a well-representative sample of low- to lower-middle-income, upper-middle-, and high-income economies. We especially focus on “greening” and “digitalisation” within the broader technological and structural transformation or upgrading. These two are outcomes but also drivers of structural change towards sustainable development.
We use a relatively large number of indicators (49) for 164 economies. The sample is based on the information available from global data sources freely available, making the whole statistical (indexes) and empirical (regressions) analyses replicable. The analysis period is 2002–2019, the most extended period for which reliable and comparable data are available. The data are obtained from the World Bank Development Indicators; the World Economic Forum Global Competitiveness Index; World Intellectual Property data; the Scopus database; the International Organization for Standardization; United Nations Educational, Scientific and Cultural Organization; Barro-Lee; Forbes; and UN Comtrade databases (see Appendix C Table A5 for details).
First, we compare the relationship between the position of countries on the ITU (A + B) and their per capita income. Figure 1 shows a moderate correspondence between income and technology upgrading levels (R2 = 0.48). This suggests that income differences are also driven by non-technological factors, such as institutions, natural resources, past innovation rents, or industries, such as tourism, where technology and non-technological innovation are less important. Additionally, a country’s ITU position may be higher than reflected by its income level, suggesting that these countries have higher potential for technology-based growth. For example, among 164 economies, China, South Korea, and Israel seem to have a greater capacity for technology-driven growth than their current income levels suggest.
Figure 2 depicts a positive and highly correlated relationship between the intensity (A) and scope (B) of technology upgrading (R2= 0.7168), the two dimensions that merge into the “overall” ITU. A high correlation confirms that these are two interrelated dimensions of the upgrading process. However, the intensity of technology upgrading (scale) levels is two times more dispersed than the breadth of technology upgrading. This suggests that countries are much closer structurally, i.e., regarding the breadth of technology upgrading than the intensity of technology upgrading. Technology accumulation is a cumulative, path-dependent, long-term process where convergence seems much more difficult to achieve than structural convergence. Finally, the literature on structural change suggests that the primary influence on productivity comes from within-sector productivity changes rather than from structural, i.e., inter-sectoral, convergence [26].
Figure 3 plots ITU (A + B) against the technology and knowledge exchange (Index C). The relationship is moderate, suggesting that other factors significantly impact the relationship. Additionally, the distribution of economies along index C (technology exchange) is more concentrated than the ITU distribution. Countries with similar openness to foreign technology and knowledge show different levels of technology upgrading. On the other hand, conventional policy thinking is that the openness of the economy to knowledge exchange is essential for technology upgrading [27]. However, a moderate relationship would suggest that openness does not automatically lead to technology upgrading unless knowledge inflows are complemented by domestic technological accumulation [28]. Radosevic and Yoruk [2] show that increased exchanges of technology and knowledge with the global economy do not necessarily increase the potential for technology-based growth.
Within this broad picture, we are interested in how digitalisation and “greening”, as the two major contemporary transformation processes, relate to technology upgrading.

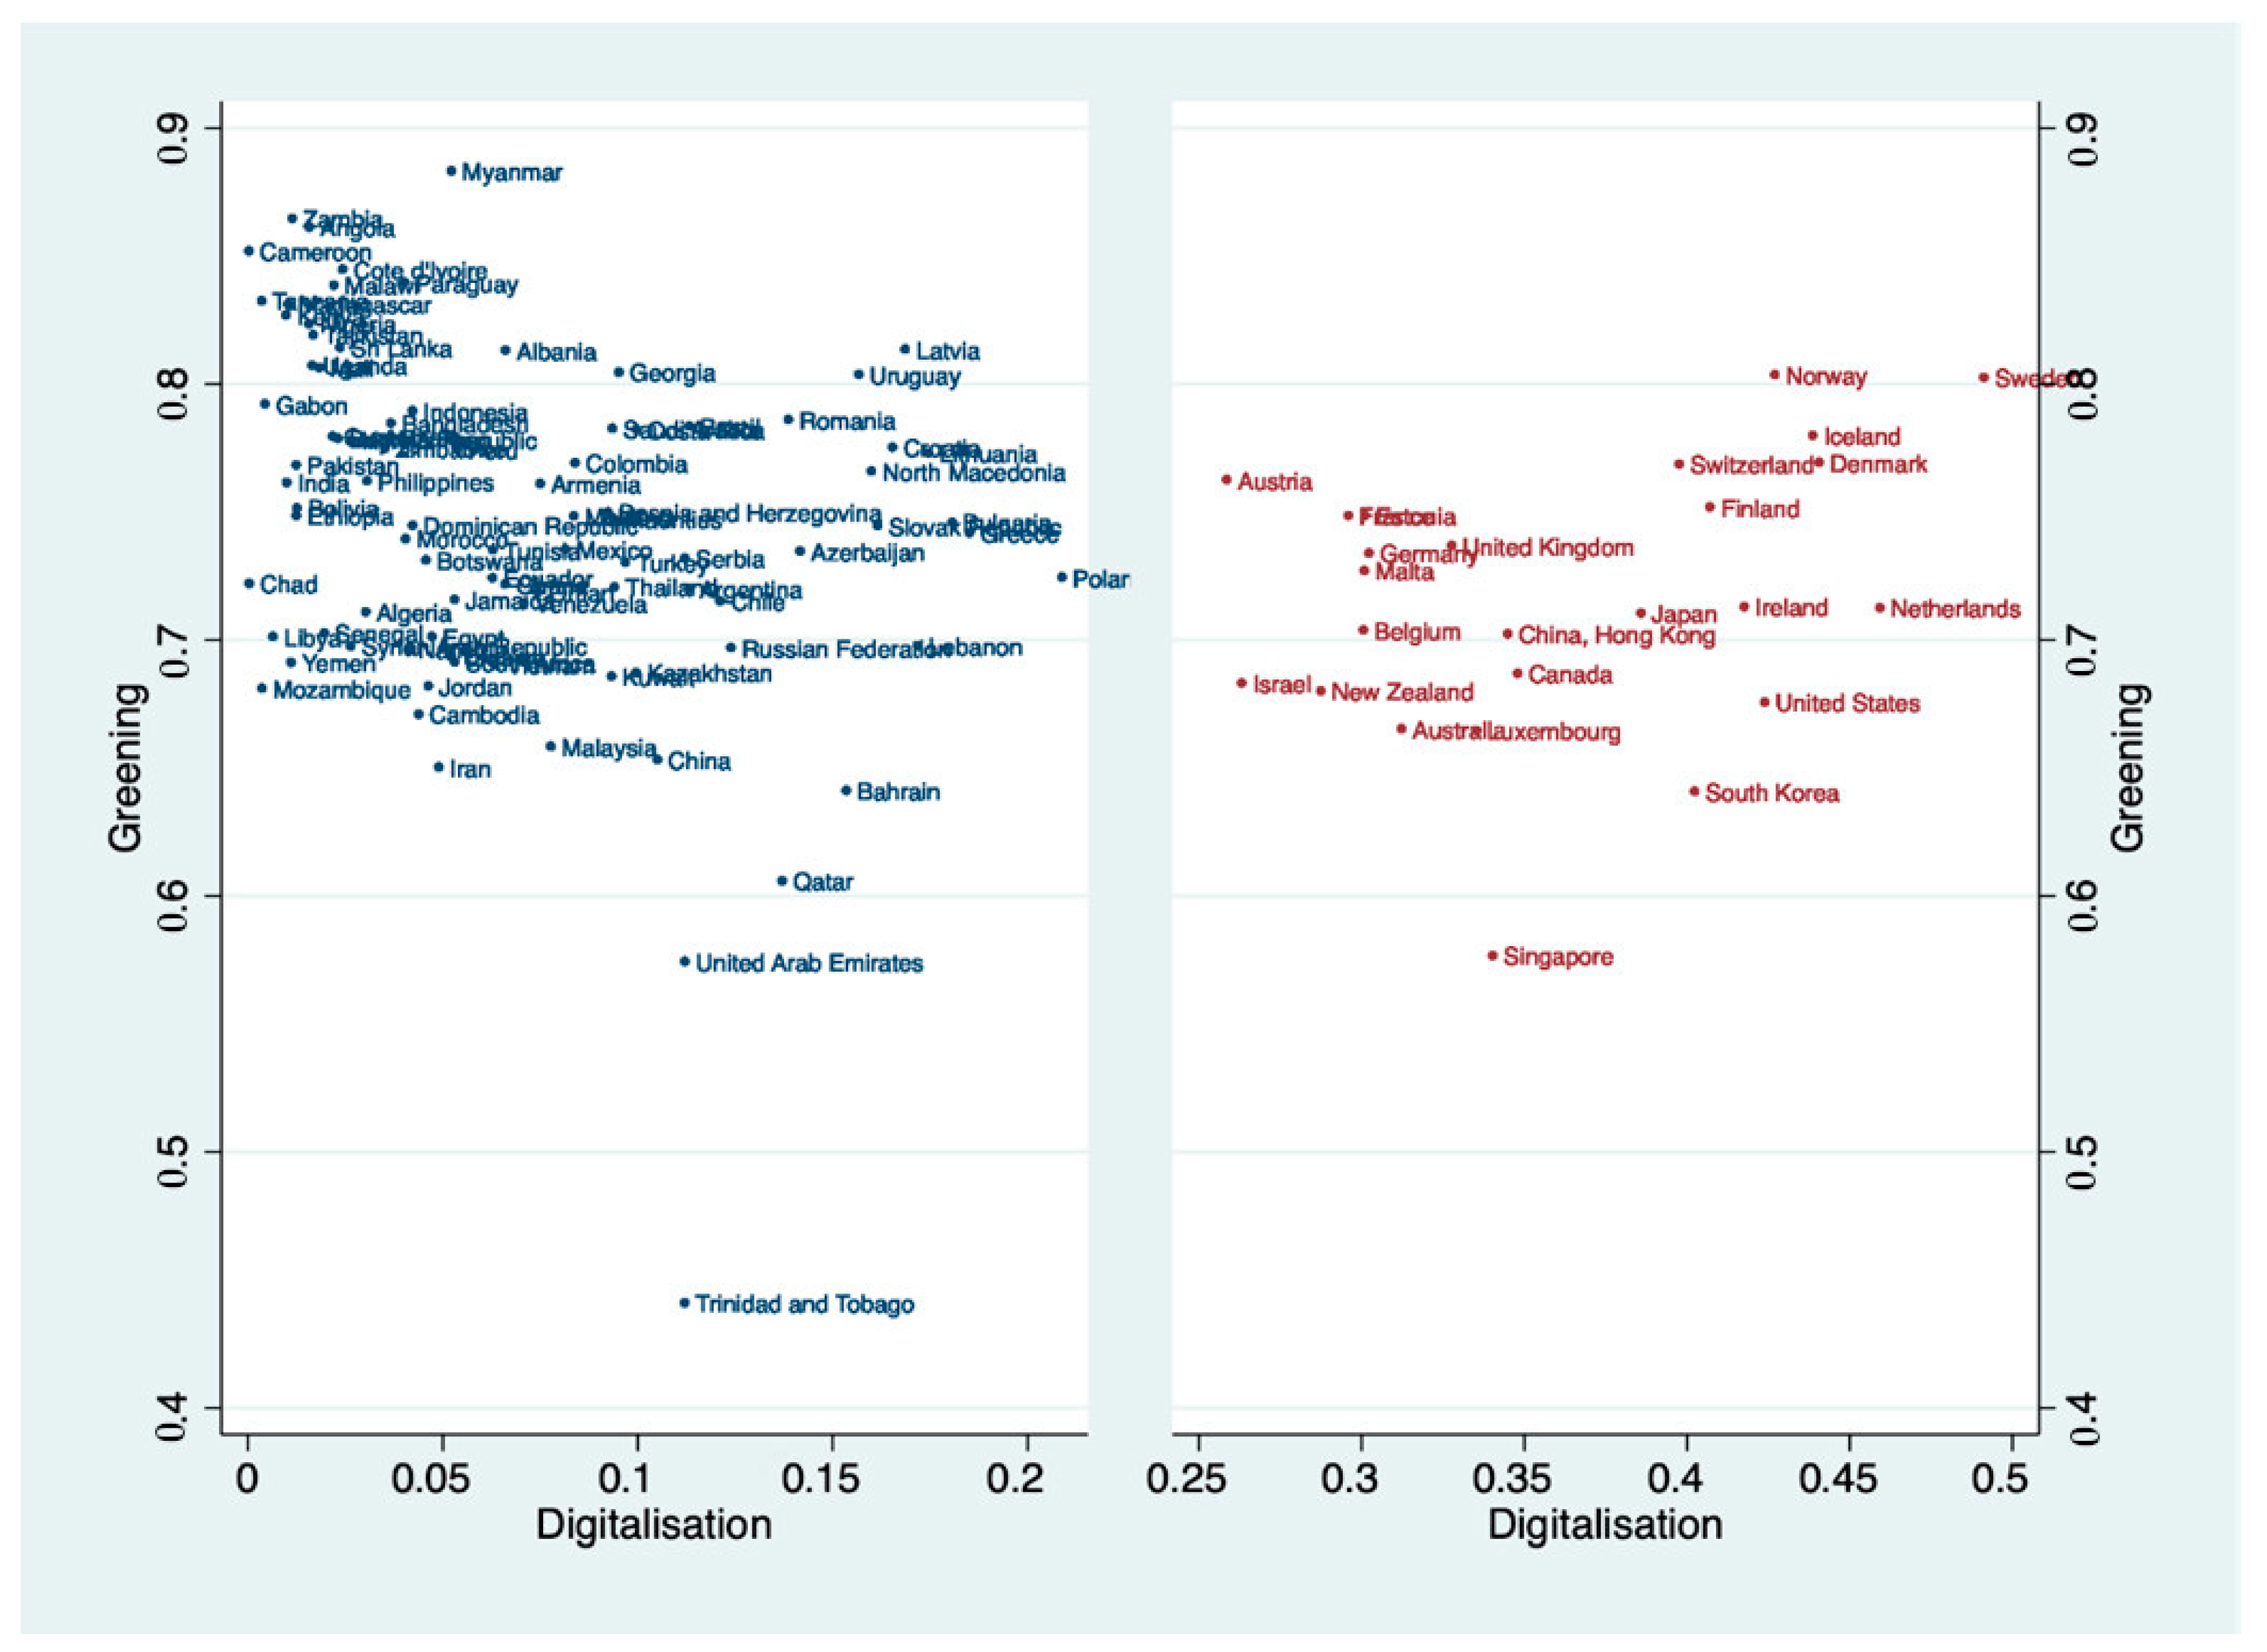
Digitalisation and “Greening”: Towards Sustainable Development

Though to different degrees, all economies are undergoing a major structural transformation towards “digitalisation” and “greening’ [29,30]. “Digitalisation” is about the increasing role of digital technologies, which have features of general-purpose technologies that are applied in all economic and societal activities [8]. “Greening” is about adopting physical products, processes, and services that use clean technologies and structural transformation towards an increasing share of industries and activities that use environmentally friendly technologies.
Figure 4 shows the U-shaped relationship between these two indicators for the sample. Two clusters of countries emerge, which broadly, but in every individual case, coincide with two income groups. The relationship is negative for mainly middle- and low-income economies, while for mainly higher-income economies, it is positive. Hence, we hypothesise that digitalisation and “greening” may complement each other only above a certain income level while the relationship is inverse at low and middle-income levels.
In addition, levels of digitalisation and greening do not correlate, suggesting these two transformation processes are not yet integrated into “ICT-assisted greening”. However, the impact of digitalisation and/or greening may be present not as a sole driver of productivity, but in interactions with individual components of the technology upgrading framework. To explore this, in Section 4.3, we test whether greening and digitalisation positively affect productivity in interaction with the other components in the upgrading framework.

4.2. The Dynamics of Technology Upgrading

This section explores the dynamics of three main indexes of technology upgrading. Figure 5 and Figure 6 show that unlike strong correlation in levels, there is no relationship between dynamics of intensity vs breadth of technology upgrading, or at least not in the relatively short period for which we have data. Each quadrant (top right, bottom right, bottom left and top left) includes countries with very different patterns of technology upgrading. Only countries in the top right have improved on both dimensions; countries in the bottom left have worsened in both, and mixed cases are in the bottom right and top left. It is equally significant that growth rates are higher for index A (scale/intensity) than index B (scope/breadth). Yet, Figure 2 shows that countries are much closer structurally than in terms of the intensity of technology upgrading. This may suggest that structural convergence among countries has slowed down recently. Additionally, this may be linked to the changing structure of economies where intangible capital and digitalisation play an increasing role.
Given the much weaker relationship between the aggregate technology upgrading index (A + B) and the technology and knowledge exchange index (C) (Figure 3), we may expect that their dynamics are also much less related. Figure 6 shows no simple association between the dynamics of openness to knowledge exchange and technology upgrading. These two processes do not seem to run in parallel, which would be expected only in exceptional successful technology catching-up cases. For most countries, the accumulation of domestic technology capabilities does not complement openness and inflows of foreign capital and technology.
Despite the level of the aggregate technology upgrading index (A + B) and the level of the technology and knowledge exchange index (C) are associated (Figure 3), there is no such association in their deltas (Figure 6). Put it differently, the changes in the dimensions of technology upgrading do not necessarily follow the changes in the knowledge exchange in the medium term, but possibly only in the very long-term. Technology upgrading is a multidimensional and non-linear process that exhibits thresholds and increasing and decreasing returns. Moreover, technology upgrading is challenging due to various “coordination failures”. This seems to be the more significant issue in the case of structural upgrading, which is a more failure-prone process compared to the intensification of existing technological activities, which seems more sustainable.

4.3. Testing the Relevance of Technology Upgrading: A Dual Approach

A technology upgrading framework provides richer and more policy-relevant insights than conventional approaches that use TFP and labour productivity to proxy for technology development. Moreover, its multidimensional nature enables integration into the analysis of digitalisation and “greening” as the major transformation processes linked to other technology variables.
However, as a new conceptual–measurement framework, it may be considered too “technology-specific” and unrelated to the conventional and widely accepted macro indicators of technology. To address this concern, we tested the relationship between different sub-indexes of technology upgrading, TFP and different labour productivity measures as conventional proxies of technology levels. Within that, we are especially focused on digitalisation and greening.

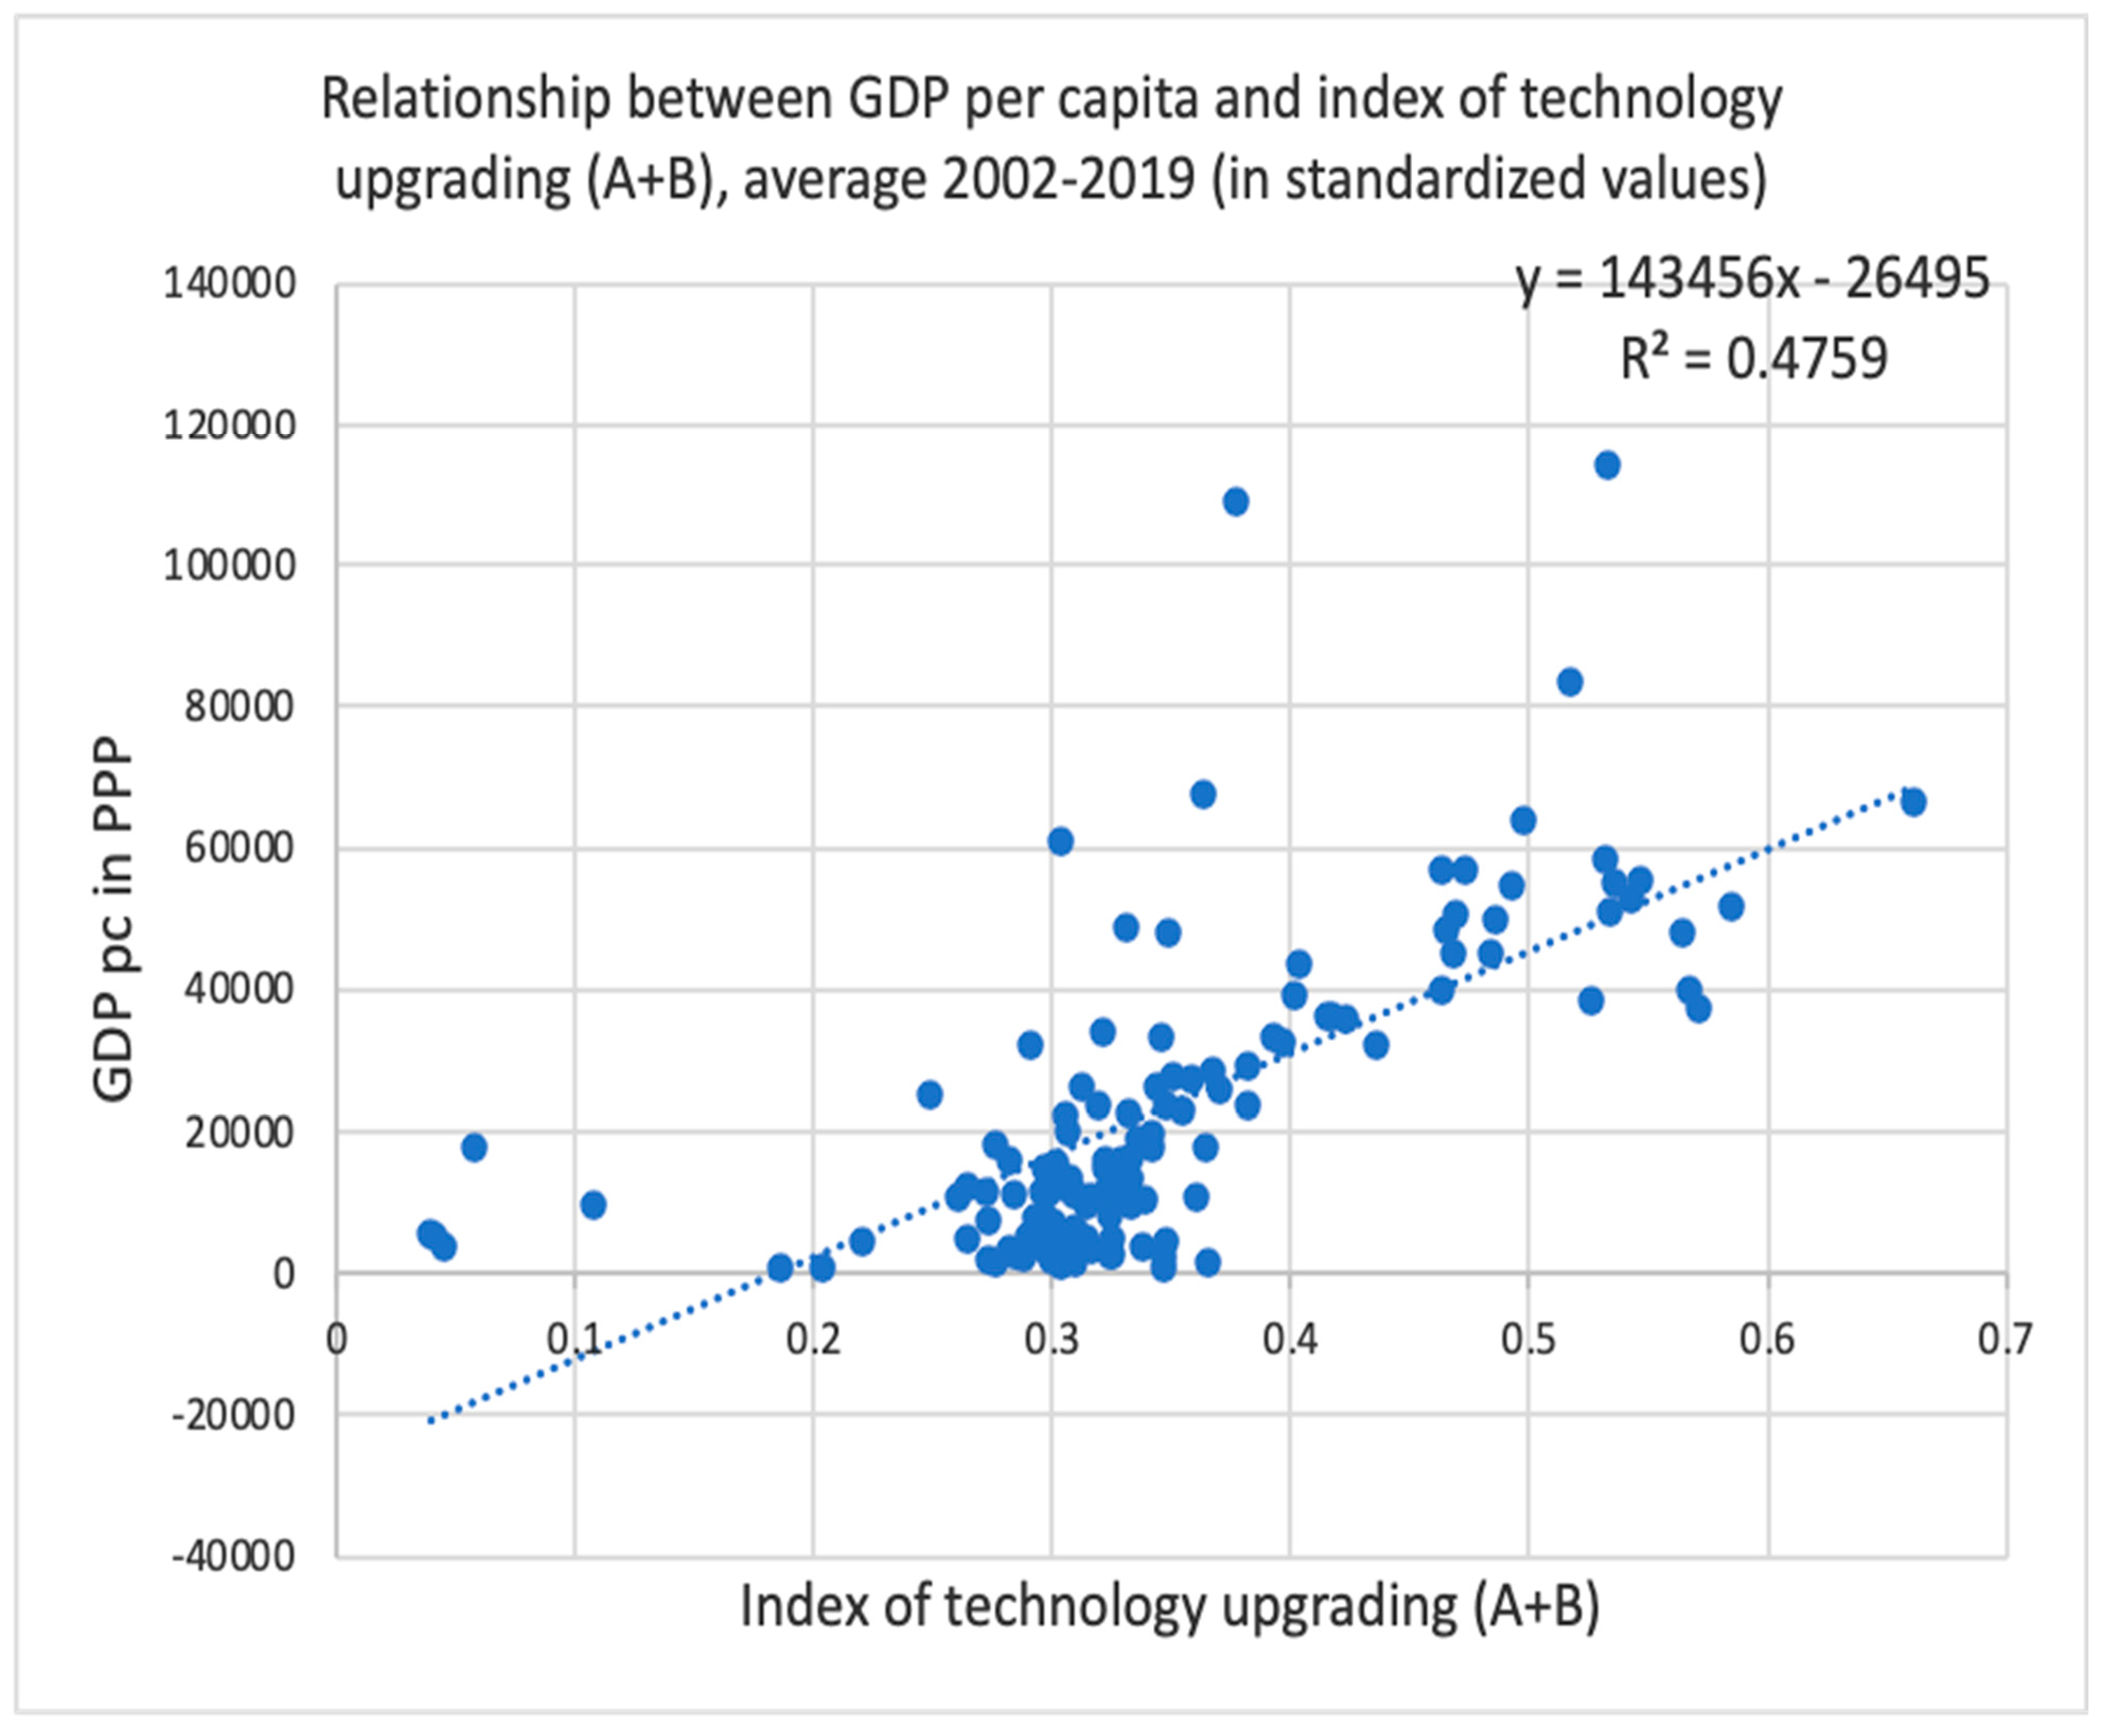
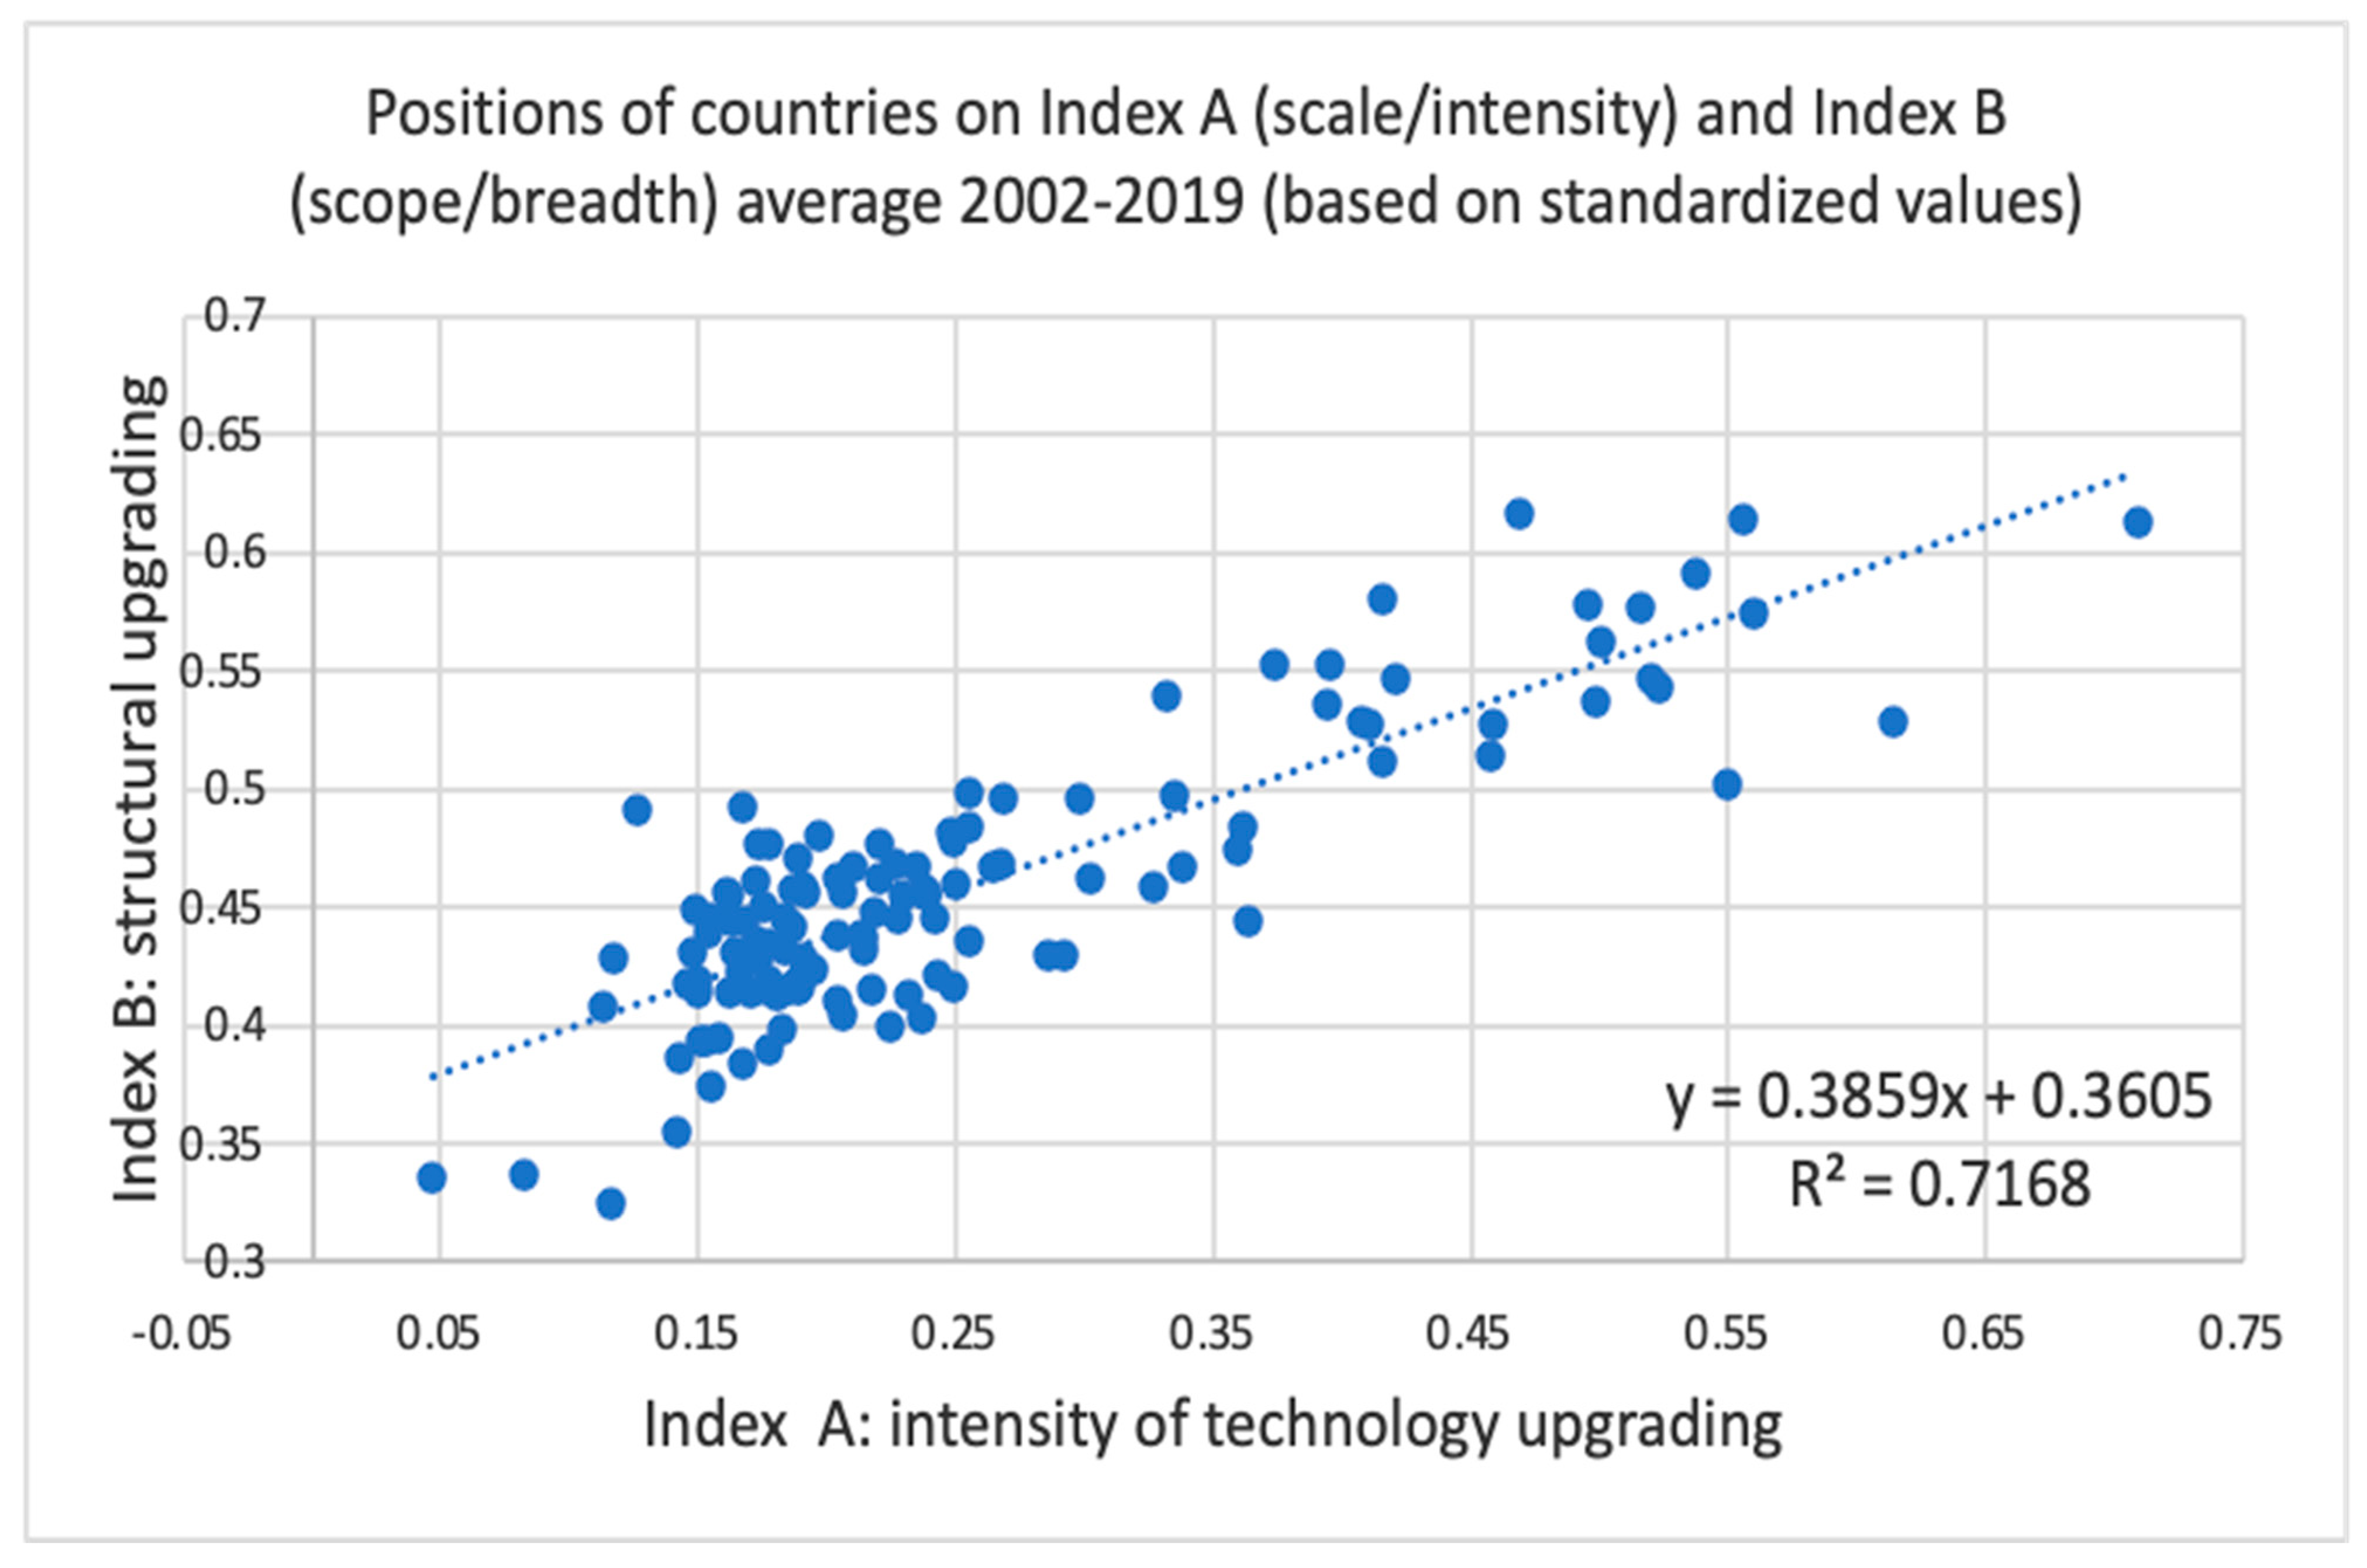
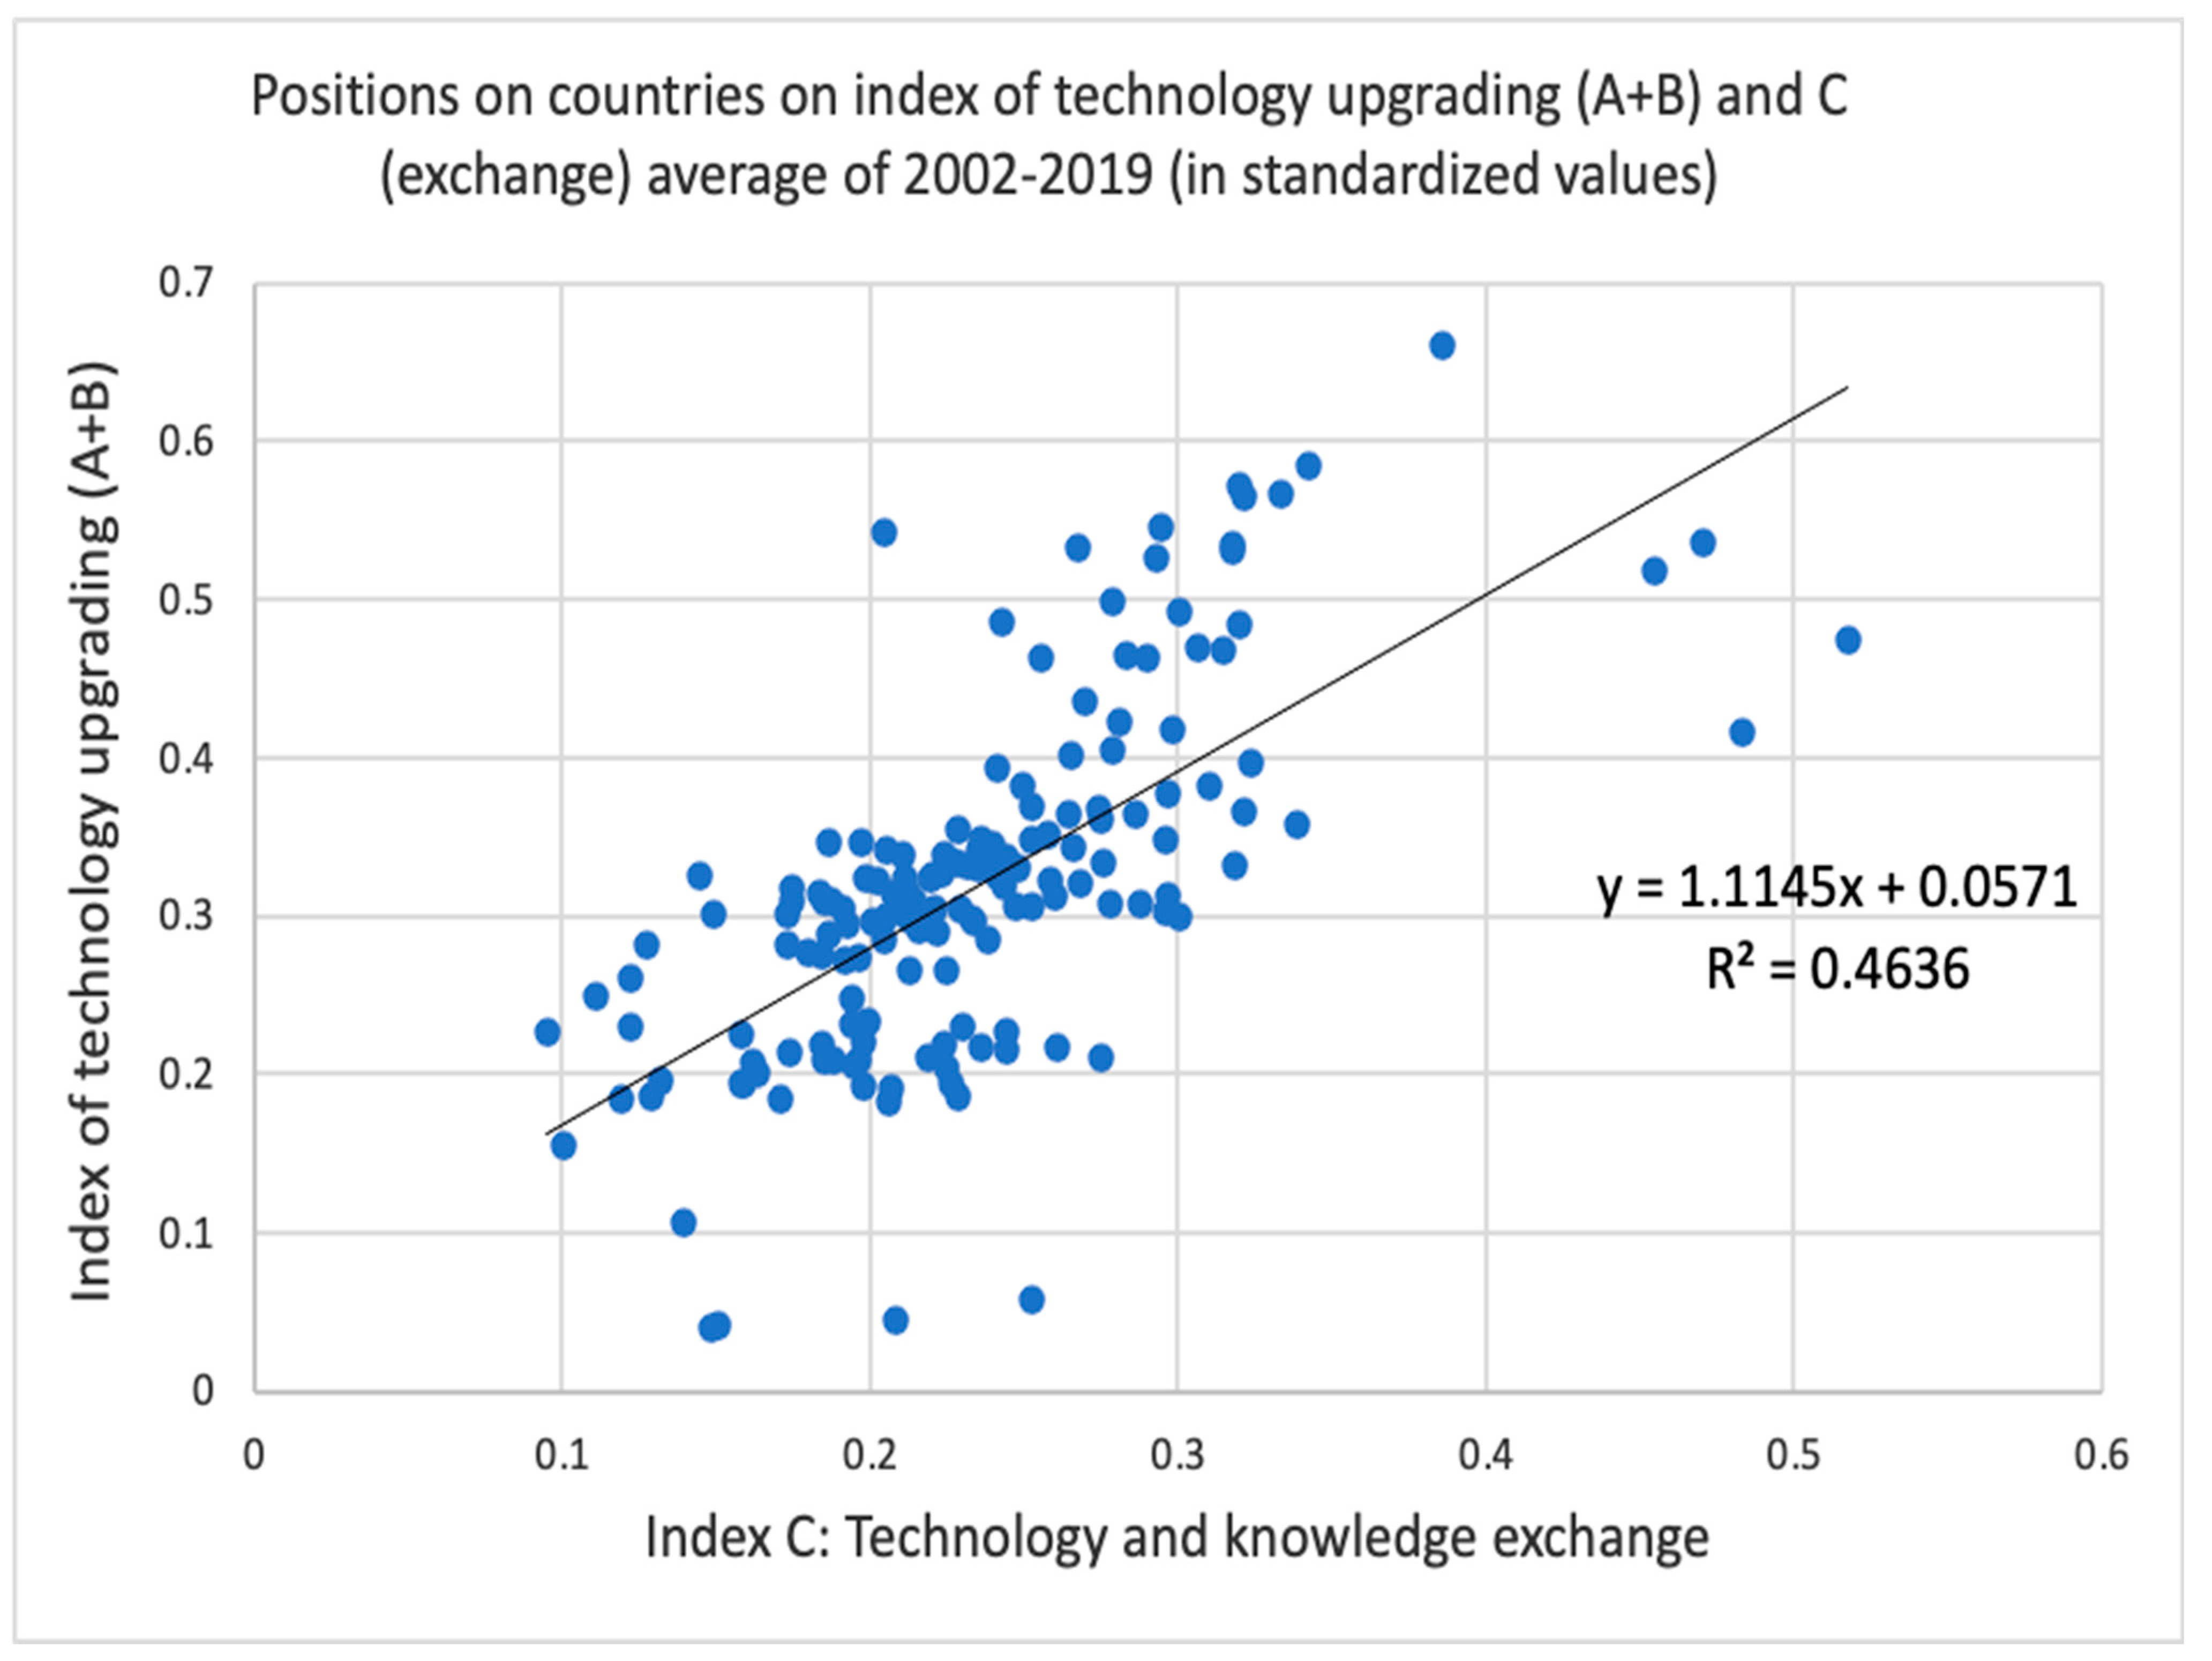
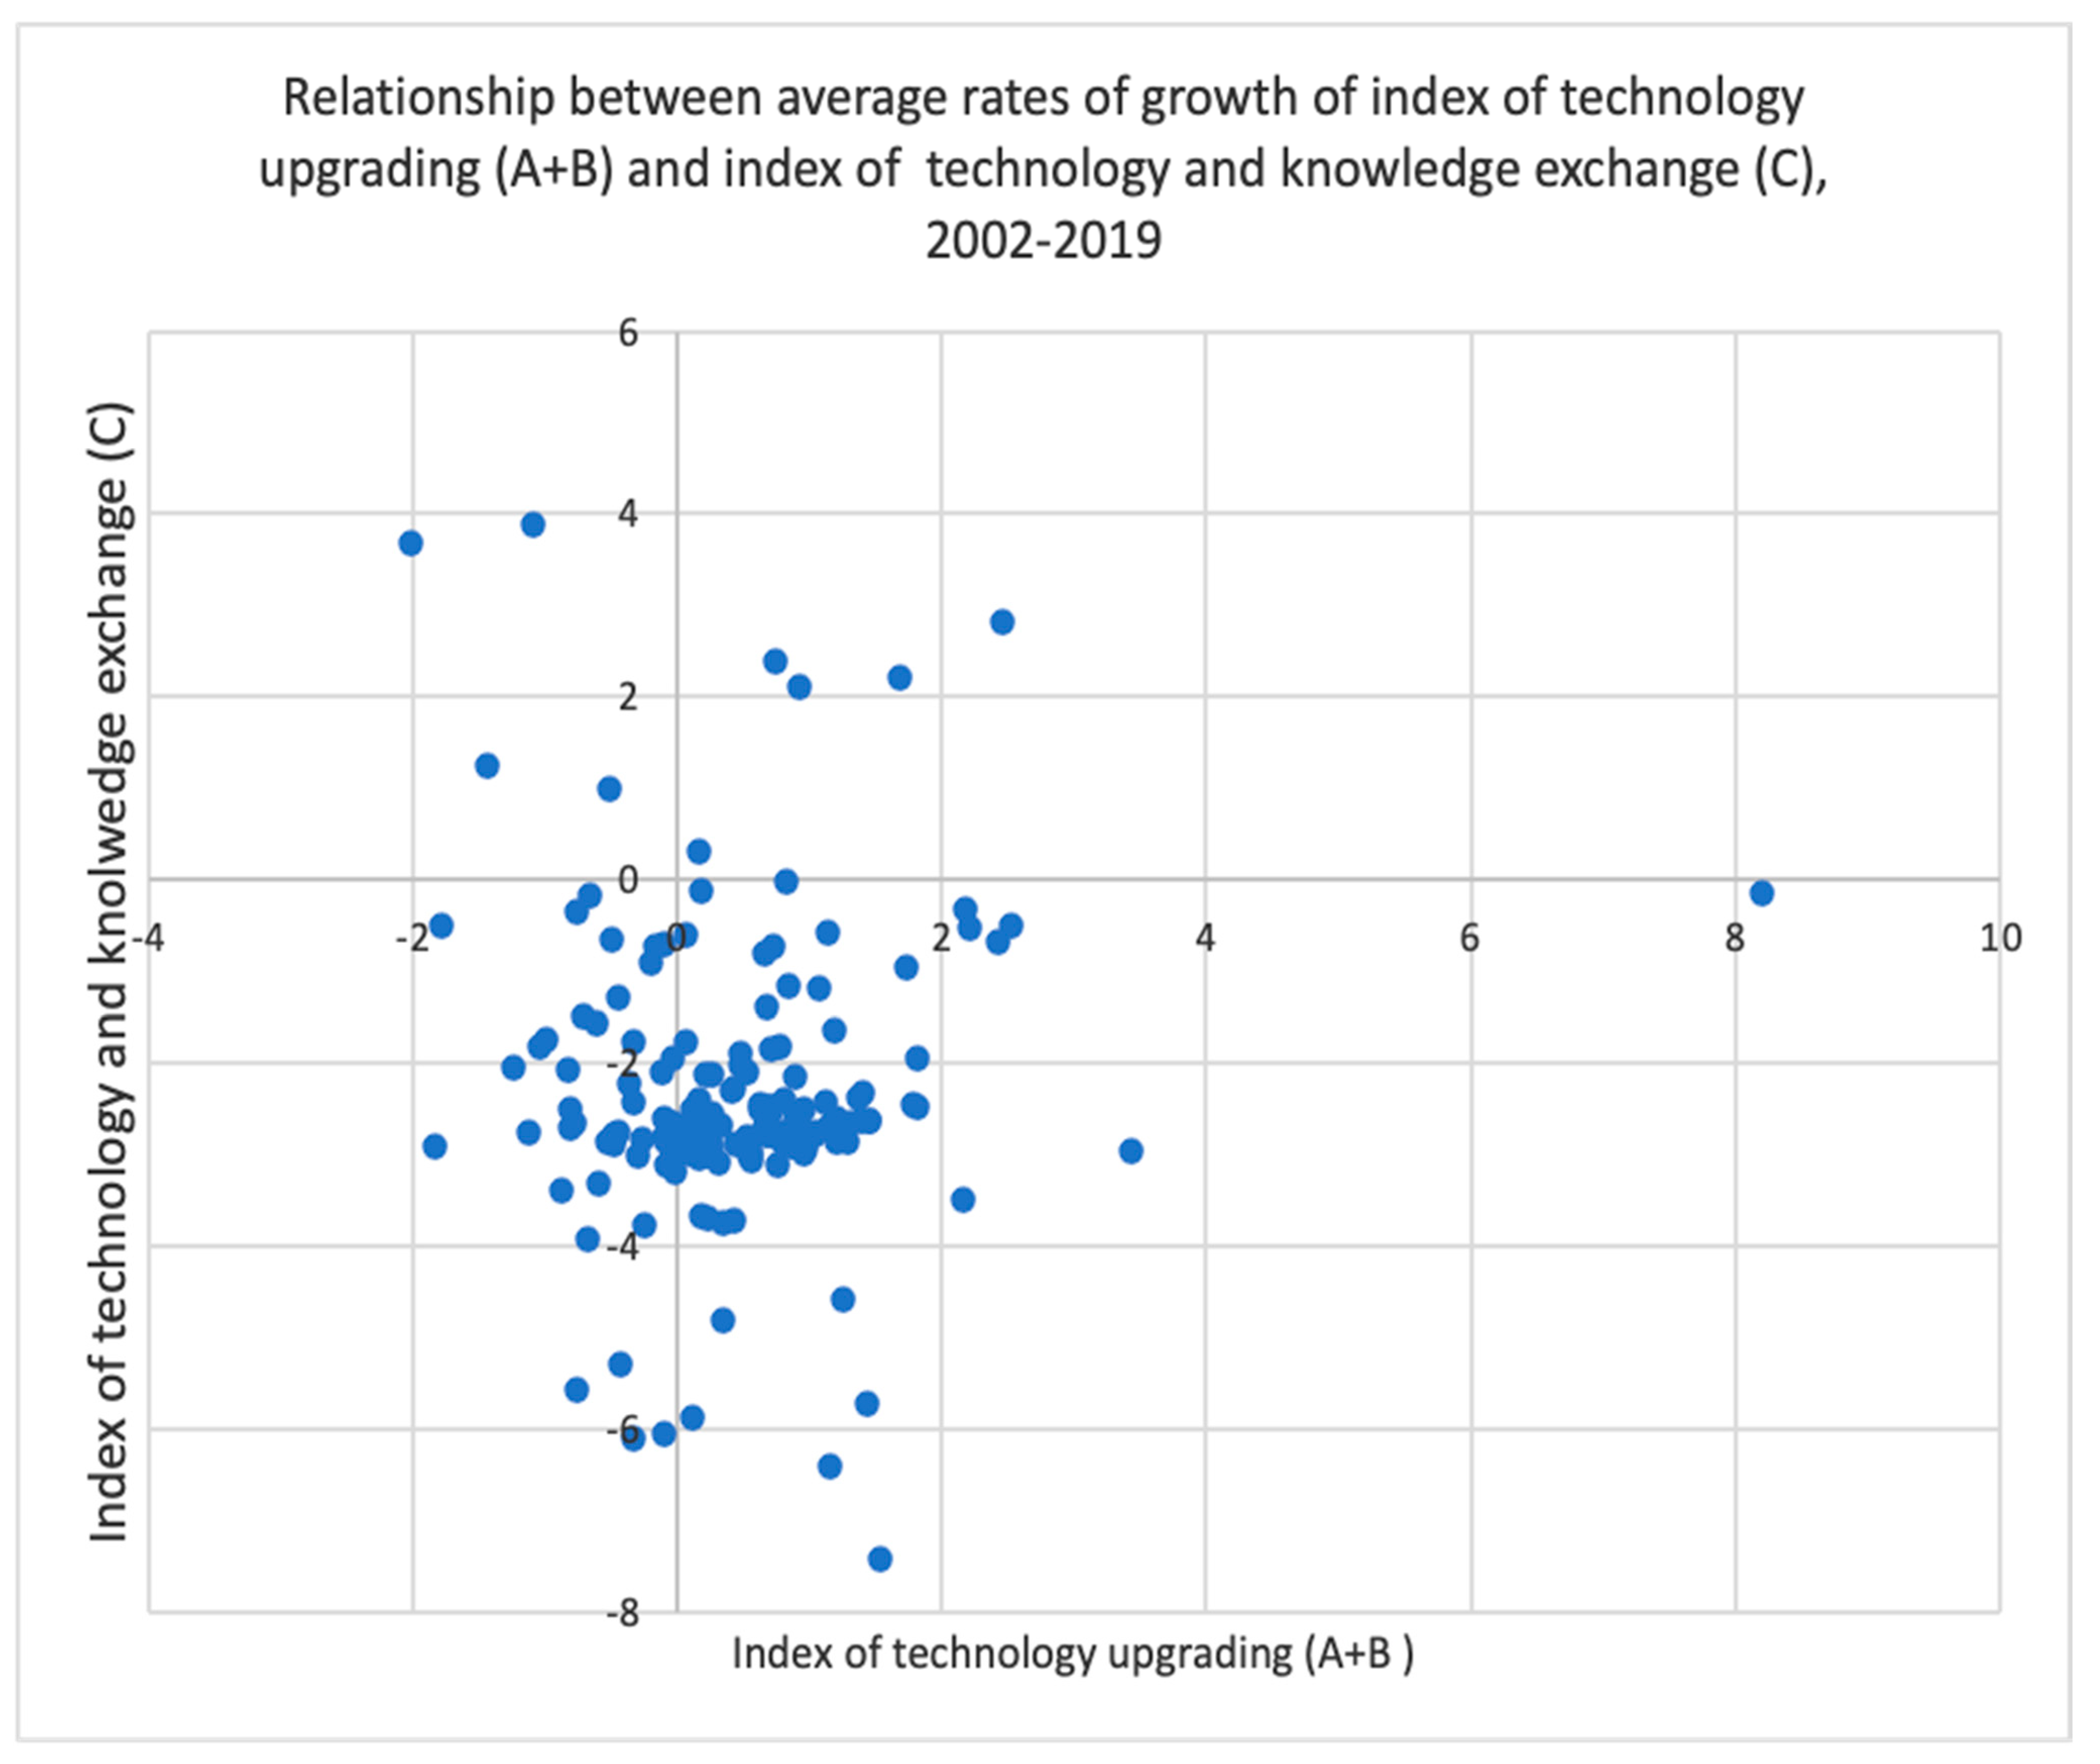
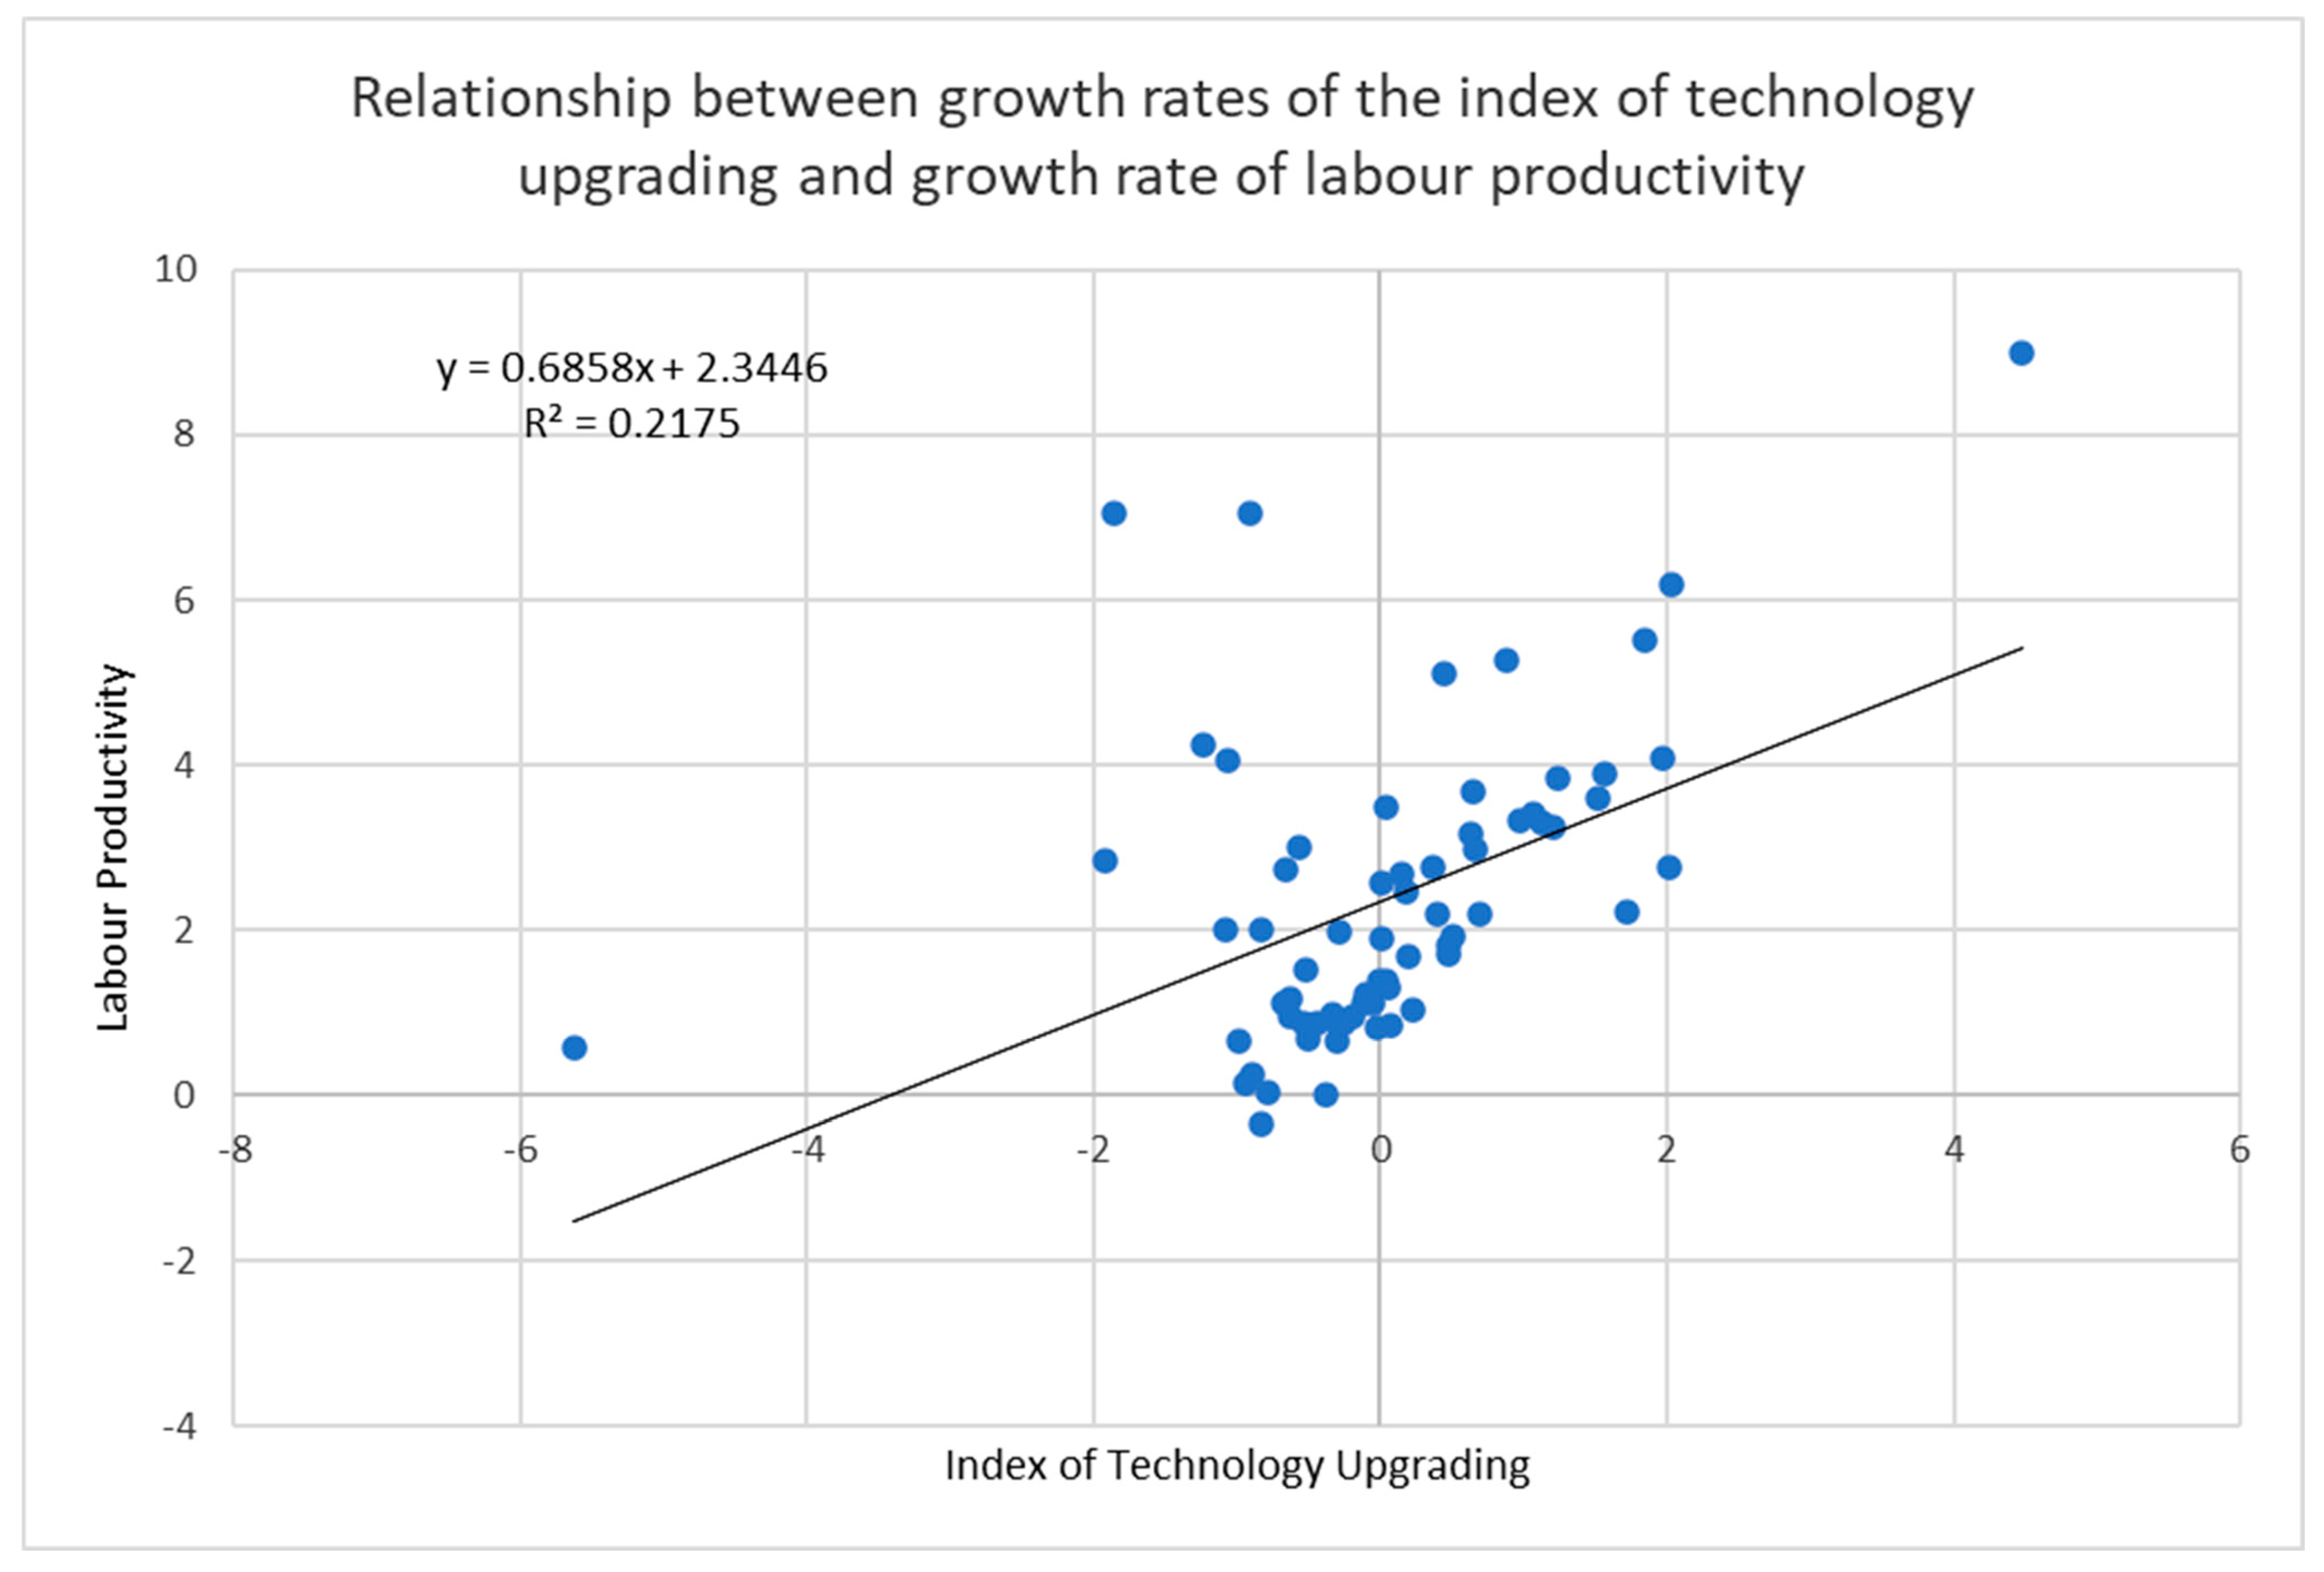
4.3.1. A Birds-Eye View

TFP and labour productivity are widely accepted as proximate indicators of levels and dynamics of technology accumulation. However, due to their aggregate nature, they cannot show the sources or drivers of accumulated technology levels. On the contrary, the multidimensional nature of the ITU enables a better understanding of the sources and drivers of technology accumulation. This, in turn, helps a better understanding of the role of the S&T system in improving technology upgrading.
As a first approximation, the analysis explores the relationship between changes in the aggregate index of technology upgrading (A + B) and TFP/labour productivity. Figure 7 shows that there is no clear relationship between changes in the index of technology upgrading (ITU A-B) and changes in labour productivity (measured as value added per hours worked). In a nutshell, this suggests that changes in the capacity for technology upgrading do not necessarily translate into broadly defined “efficiency” gains, but also that productivity is not necessarily caused by technology upgrading.
Productivity can increase by decreasing wages, economies of scale, or institutional improvements with no increase in technology upgrading. Advances in technology capabilities may not be reflected in aggregate productivity, which can be driven by changing economic structure and its capital or labour sector biases. For example, periods of higher productivity may be characterised by structural deterioration.
ITU reflects the investment and capability-building activities and processes not necessarily related directly to current growth. These activities and processes are often not part of the business cycle but may reflect strategic behaviour or changes driven by various other policy choices driven by non-economic considerations.
Still, given the prevalent use of conventional macroeconomic proxies of technology and the potential link with sub-components of the index of TU we test these relationships econometrically.

4.3.2. Regressions Specification

The paper implements an econometric model from a theory-based equation for the determinants of total factor productivity, S labour productivity, and GDP per capita, respectively. The paper follows the decomposition described in Bruno Osaulenko Radosevic [30,31] (83–88) to estimate total factor productivity, labour productivity and income per capita as a function of the index of technology upgrading. Finally, we test this relationship’s validity at different development levels (income per capita). All regressions have been run with robust standard errors for autocorrelation and heteroscedasticity and include country- and time-fixed effects.

Total Factor Productivity as a Function of the Index of Technological Upgrading

The first estimated equation analyses the relationship between the change of total factor productivity and the change (lagged to avoid reverse causality) of each separate component of the index of technology upgrading, controlling for countries-fixed effects—unobserved heterogeneity—and time dummies—macro shocks (Bruno Osaulenko Radosevic [6]):
ΔlogTFPit = α0 + α1Δlog(Ij)it−1 + Di + Dt + Δεit
Ij = I1, I2, I3, …, I8
Eight indicator-by-indicator regressions are compared to a so-called “horse-race” equation where all eight sub-components are simultaneously included in the specification:
ΔlogTFPit = α0 + α1Δlog(I1)it−1 + α2Δlog(I2)it−1 + α3Δlog(I3)it−1 + α4Δlog(I4)it−1 +
α5Δlog(I5)it−1 + α6Δlog(I6)it−1 + α7Δlog(I7)it−1 + α8Δlog(I8)it−1 + Di + Dt + Δεit
Definition, unit of measure, and value range for each variable are described below:
  • ΔlogTFPit is defined as the natural log of total factor productivity in year (t) minus the log of total factor productivity in year (t − 1) (source is the “Conference Board” 2). The unit of measure is the percentage growth of GDP minus the sum of the respective growth of [Contribution of Labour Quantity to GDP + Contribution of Labour Quality to GDP + Contribution of Total Capital Services to GDP]. The variable range is [−38%, +24%].
  • I1 production capability is defined as the annual change of a composite indicator of three specific quantitative subcomponents, equally weighted (full detail in Table A5). The unit of measure of the composite indicator is standardised along the interval [0–1]. The variable range is [−9%, +13%].
  • I2 technology capability is defined as the annual change of a composite indicator of four specific quantitative subcomponents, equally weighted (full detail in Table A5). The unit of measure of the composite indicator is standardised along the interval [0–1]. The variable range is [−12%, +16%].
  • I3 R&D and knowledge are defined as the annual change of a composite indicator eight specific quantitative subcomponents, equally weighted (full detail in Table A5). The unit of measure of the composite indicator is standardised along the interval [0–1]. The variable range is [−8%, +9%].
  • I4 infrastructure is defined as the annual change of a composite indicator of six specific quantitative subcomponents, equally weighted (full detail in Table A5). The unit of measure of the composite indicator is standardised along the interval [0–1]. The variable range is [−9%, +11%].
  • I5 structural change is defined as the annual change of a composite indicator of seven specific quantitative subcomponents, equally weighted (full detail in Table A5). The unit of measure of the composite indicator is standardised along the interval [0–1]. The variable range is [−32%, +27%].
  • I6 firm-level capabilities is defined as the annual change of a composite indicator of five specific quantitative subcomponents, equally weighted (full detail in Table A5). The unit of measure of the composite indicator is standardised along the interval [0–1]. The variable range is [−16%, +11%].
  • I7 digitalisation is defined as the annual change of a composite indicator of three specific quantitative subcomponents, equally weighted (full detail in Table A5). The unit of measure of the composite indicator is standardised along the interval [0–1]. The variable range is [−23%, +23%].
  • I8 greening is defined as the annual change of a composite indicator of six specific quantitative subcomponents, equally weighted (full detail in Table A5). The unit of measure of the composite indicator is standardised along the interval [0–1]. The variable range is [−15%, +12%].
  • Di are defined as country dummies and can assume the value 0 or 1.
  • Dt are defined as time dummies and can assume the value 0 or 1.

Labour Productivity as a Function of the Index of Technological Upgrading

The second estimated equation is the change in labour productivity (measured as value added per person employed or value added per hour worked) as a function of the lagged change of each of the eight subcomponents of the index of technology upgrading in turn, controlling for countries-fixed effects—all unobserved heterogeneity—and time dummies (macro shocks):
Δlog(VA/L)it = α0 + α1Δlog(Ij)it−1 + Di + Dt + Δεit
Ij = I1, I2, I3, , I8
Definition, unit of measure, and value range for each variable are described below:
  • Δlog(VA/L)it is defined as growth of the ratio of value added (in constant 2019 US$,) per person employed (source, the “Conference Board”). The variable range is [−33%, +33%]. Alternatively, Δlog(VA/L)it is defined as the ratio of value added (in constant 2019 US$,) per hour worked (same source). In the latter case, the variable range is [−16%, +16%]
  • I1, production capability, is defined as the annual change of a composite indicator of three specific quantitative subcomponents, equally weighted (full detail in Table A5). The unit of measure of the composite indicator is standardised along the interval [0–1]. The variable range is [−9%, +13%]
  • I2, technology capability, is defined as the annual change of a composite indicator of four specific quantitative subcomponents, equally weighted (full detail in Table A5). The unit of measure of the composite indicator is standardised along the interval [0–1]. The variable range is [−12%, +16%]
  • I3, R&D and knowledge, is defined as the annual change of a composite indicator eight specific quantitative subcomponents, equally weighted (full detail in Table A5). The unit of measure of the composite indicator is standardised along the interval [0–1]. The variable range is [−8%, +9%]
  • I4, infrastructure, is defined as the annual change of a composite indicator of six specific quantitative subcomponents, equally weighted (full detail in Table A5). The unit of measure of the composite indicator is standardised along the interval [0–1]. The variable range is [−9%, +11%]
  • I5, structural change, is defined as the annual change of a composite indicator of seven specific quantitative subcomponents, equally weighted (full detail in Table A5). The unit of measure of the composite indicator is standardised along the interval [0–1]. The variable range is [−32%, +27%]
  • I6, firm-level capabilities, is defined as the annual change of a composite indicator of five specific quantitative subcomponents, equally weighted (full detail in Table A5). The unit of measure of the composite indicator is standardised along the interval [0–1]. The variable range is [−16%, +11%]
  • I7, digitalisation, is defined as the annual change of a composite indicator of three specific quantitative subcomponents, equally weighted (full detail in Table A5). The unit of measure of the composite indicator is standardised along the interval [0–1]. The variable range is [−23%, +23%]
  • I8, greening, is defined as the annual change of a composite indicator of six specific quantitative subcomponents, equally weighted (full detail in Table A5). The unit of measure of the composite indicator is standardised along the interval [0–1]. The variable range is [−15%, +12%]
  • Di are defined as country dummies and can assume the value 0 or 1
  • Dt are defined as time dummies and can assume the value 0 or 1
As in the specification with TFP, these eight regressions are also compared to a so-called “horse-race” equation where all eight lagged sub-components are included in the specification:
Δlog(VA/L)it = α0 + α1Δlog(I1)it−1 + α2Δlog(I2)it−1 + α3Δlog(I3)it−1 + α4Δlog(I4)it−1 + α5Δlog(I5)it−1 + α6Δlog(I6)it−1 + α7Δlog(I7)it−1 + α8Δlog(I8)it−1 + Di + Dt + Δε

GDP per Capita as a Function of the Index of Technological Upgrading

Finally, the last set of regression investigates the association between the component of ITU and GDP per capita controlling for countries’ fixed effects -all unobserved heterogeneity- and time dummies (macro shocks):
ΔGDPpcit = α0 + α1Δlog(Ij)it−1 + Di + Dt + Δεit
Ij = I1, I2, I3, , I8
ΔlogGDPpcit = α0 + α1Δlog(I1)it−1 + α2Δlog(I2)it−1 + α3Δlog(I3)it−1 + α4Δlog(I4)it−1 + α5Δlog(I5)it−1 + α6Δlog(I6)it−1 + α7Δlog(I7)it−1 + α8Δlog(I8)it−1 + Di + Dt + Δεit
Definition, unit of measure, and value range for each variable are described below:
  • ΔlogGDPpcit is defined as growth of GDP per capita (in constant 2019 US$) (source, the “Conference Board”). The variable range is [−33%, +33%].
  • I1, production capability, is defined as the annual change of a composite indicator of three specific quantitative subcomponents, equally weighted (full detail in Table A5). The unit of measure of the composite indicator is standardised along the interval [0–1]. The variable range is [−9%, +13%]
  • I2, technology capability, is defined as the annual change of a composite indicator of four specific quantitative subcomponents, equally weighted (full detail in Table A5). The unit of measure of the composite indicator is standardised along the interval [0–1]. The variable range is [−12%, +16%]
  • I3, R&D and knowledge, is defined as the annual change of a composite indicator eight specific quantitative subcomponents, equally weighted (full detail in Table A5). The unit of measure of the composite indicator is standardised along the interval [0–1]. The variable range is [−8%, +9%]
  • I4, infrastructure, is defined as the annual change of a composite indicator of six specific quantitative subcomponents, equally weighted (full detail in Table A5). The unit of measure of the composite indicator is standardised along the interval [0–1]. The variable range is [−9%, +11%]
  • I5, structural change, is defined as the annual change of a composite indicator of seven specific quantitative subcomponents, equally weighted (full detail in Table A5). The unit of measure of the composite indicator is standardised along the interval [0–1]. The variable range is [−32%, +27%]
  • I6, firm-level capabilities, is defined as the annual change of a composite indicator of five specific quantitative subcomponents, equally weighted (full detail in Table A5). The unit of measure of the composite indicator is standardised along the interval [0–1]. The variable range is [−16%, +11%]
  • I7, digitalisation, is defined as the annual change of a composite indicator of three specific quantitative subcomponents, equally weighted (full detail in Table A5). The unit of measure of the composite indicator is standardised along the interval [0–1]. The variable range is [−23%, +23%]
  • I8, greening, is defined as the annual change of a composite indicator of six specific quantitative subcomponents, equally weighted (full detail in Table A5). The unit of measure of the composite indicator is standardised along the interval [0–1]. The variable range is [−15%, +12%]
  • Di are defined as country dummies and can assume the value 0 or 1
  • Dt are defined as time dummies and can assume the value 0 or 1

4.3.3. Regression Results and Discussion

The regression analysis explores how the growth of different technology upgrading components relates to the change in total factor productivity, labour productivity, and GDP per capita. Results for individual indicators are in Appendix B Table A1, Table A2, Table A3 and Table A4.
First, the explanatory power of individual subcomponents of the index of technology upgrading varies in each of the four macro indicators of productivity.
Total factor productivity and labour productivity per hour capture quite different dimensions of “efficiency” improvements in the economy. TFP contains many non-technological factors and can vary significantly over business cycles. Hence, it is unsurprising that the relationship with several components of the index of technology upgrading is either nonsignificant and/or negative. TFP is negatively associated with R&D, reflecting the marginal role of R&D in many middle-and low-income economies, and the broad nature of the TFP concept.
Compared to TFP, labour productivity per person employed is much closer to being a direct proxy of technology accumulation, but also contains many non-technological (labour market) and structural dimensions (capital intensities) unrelated to directly observable technology accumulation activities. Thus, similar to TFP, the relationship with all components of the index of TU is nonsignificant, and none of the components is negatively significant.
Compared to the other two macro indicators, labour productivity per hour is much closer to directly observable technology accumulation activities. Hence, it is significantly and positively associated with infrastructure and organisational capabilities. Our infrastructure capability index is about what broadly defined (physical, human, organisational) infrastructure enterprises rely on to grow. The organisational capabilities index is about firms’ capacities to convert technological knowledge into marketable products. These two factors are essential to technology upgrading. They indicate that knowledge generation capacities and the capacity to convert that knowledge into commercial products depend not on S&T per se but much more on firms’ management and organisational capabilities and the infrastructure on which firms rely [19]. This result has significant implications for transitional science and technology policy, which is overly focused on knowledge generation and much less on knowledge conversion into innovative products and processes.
The income per capita reflects a combined outcome of productivity and the economy’s accumulated welfare. It correlates positively and significantly with changes in production capability and structural change. This result demonstrates the relevance of structural upgrading and the sophistication of production capabilities, which are significant in economies of all income levels.
A quite puzzling result is that change in the R&D capability index negatively correlates to TFP and income per capita. As recognised by extensive literature, R&D capability has two faces. R&D contributes to knowledge generation but also to knowledge absorption [32,33]. Its negative relationship with two macro proxies of productivity and insignificant relationship with the other two suggests that its growth does not affect productivity directly. In middle- and low-income economies, R&D investments are marginal, and even when significant, they are not present in the business enterprise sector. Hence, the causation chain seems much more complex and indirect. Its impact on welfare and productivity is conditioned by the orientation of the R&D system, especially the degree of its integration into and with the business sector. This result has significant implications for S&T policy as it shows the need for much more innovation-oriented restructuring of the R&D system in addition to their general knowledge generation/absorption role.
Fourth, two indexes of our special interest—digitalisation and greening—do not have a significant relationship to macro productivity proxies. Again, digitalisation is a broad economic and social process, and its links to the overall income rather than to defined productivity measures seem intuitively more plausible. However, it appears that the diffusion of digital technologies is not yet the driver of long-term growth [34]. Similarly, but also differently, greening has not yet become a broad transformational process that would increase productivity and welfare.
Overall, conventional macro indicators of productivity and welfare (except partly labour productivity per hour) are still remotely or not driven by direct components of technology upgrading and are inimical to its structural directions (greening and digitalisation). This result may not be that surprising. It calls for a rethink of conventional productivity metrics, including natural capital indicators. However, more importantly, it shows that growth drivers may differ at different income levels.
To address this issue, we run the above regressions and include income levels as differentiating factors: each RHS indicator is interacted with a dummy for level of development “Low”, “Lower-middle”, “Upper-middle”, and “High”, respectively. This specification is similar in spirit with the empirical analysis conducted by Acemoglu et al. [14]. They estimate a growth equation with the variable “distance to frontier” interacted with low barriers and high barriers of entry, respectively. We estimate a growth/productivity equation with different levels of development (our distance to frontier) interacting with technology upgrading indexes, our proxy of facilitators of entry and innovation strategy (as opposed to investment strategy of emerging economies). In Table 1, for reasons of clarity, we report only significant results. The picture that emerges once income levels are considered is much more elaborate and telling and it goes along the line of Acemoglu et al. [14].
First, results are quite different across different measures of macro productivity. This is obvious in regression results where we do not differentiate across income levels (Table A1, Table A2, Table A3 and Table A4), but also in Table 1, where we differentiate across income levels, our proxy for “distance to frontier”. The relationship between direct measures of technology upgrading and three proxies of macro productivity differ depending on their mutual “distance”. Labour productivity per hour worked is the proxy that is the most closely related to technology upgrading, while income per capita is probably the furthest, with labour productivity per person being in the middle. The more distant the relationship, the more moderating factors shape the relationship between technology upgrading and productivity.
Second, income per capita reflects productivity but also past wealth accumulation. Hence, the structural change component as the driver of income per capita is positively significant only in the case of low-income economies. In these economies, the wealth component of changes in income is marginal, enabling direct impact from structural index to broadly defined productivity measure. Changes in the structural change index in low-income economies probably reflect changes in buyer sophistication and the levels and pace of changes in the availability of the latest technologies. In low-income economies, these levels are low and denote bigger catching-up opportunities compared to higher-income economies. Acemoglu et al. [14] show that low-income countries more distant from the frontier benefit from investment (and possibly high-barrier) strategies.
Third, labour productivity per person employed is “medium” distance proxy of technology accumulation. Structural upgrading is again the only significant driver of labour productivity per person employed. However, its impact is non-linear across different income levels. It is a positive and significant driver of increased labour productivity per person employed in low-income economies. Still, it does not drive productivity at the lower-middle- and high-income levels. An explanation for this should be sought in our proxy for structural change (index 5). This is a mixture of indicators that measure diversification of knowledge generation activities as reflected in patents, demand-side drivers of structural changes, such as buyer sophistication, and supply changes in the availability of the latest technologies. At different income levels, these factors operate differently, and we observe their net impact. At low-income levels, knowledge generation through patents is a marginal activity, and structural change is probably mainly driven by changes in the demand and supply of technology. In high-income countries (at the frontier), diversification of patent classes saturates, as countries already have patents in many patent classes. Moreover, demand-side drivers of structural changes such as buyer sophistication and levels of assessment of the availability of the latest technologies have reached important levels, and further increases can be only marginal. Therefore, their cumulative impact does not impact an increase in labour productivity per employed person. The real puzzle is the negative impact of this index in the case of lower-middle income economies. Their negative impact can be explained by the relevance of knowledge generation activities (patents) to domestic technology upgrading, which is much more focused on knowledge assimilation (e.g., via higher barriers, as explained by Acemoglu et al. [14]) than knowledge generation, especially at the world frontier.
Fourth, labour productivity per hour is the most “realistic” or the most “true” measure. This explains the biggest number of significant determinants of TU driving this productivity measure. Moreover, given its closest distance, it is a measure that carries the biggest weight and helps us understand better the impact of technology upgrading on productivity. Upper-middle-income economies are transitioning from growth driven by production capabilities (investment strategy) towards growth driven by innovation capabilities (innovation strategy). A negative coefficient of production capabilities only for this group indicates a middle-income trap, difficulties in shifting from implementation to design capacities [35] or—vice-versa—switching out of an investment-based strategy too soon [14]. In low-income economies, the organisational capabilities of firms are a positive and significant driver of labour productivity per hour. It would be expected that in these economies, organisational capabilities are still rudimentary. Still, it seems that those economies which are distinctly better in this respect are also better in increased productivity. Therefore, we expect organisational capabilities to contribute to increased productivity at higher income levels (middle-income group). However, it seems that other factors in innovation systems (infrastructure upgrading, technology and R&D capabilities, etc.) would have to be present for organisational capabilities to be a distinctive driver of productivity [19].
Fifth, quite unexpectedly, greening turned out to be a positive and significant driver of increasing labour productivity per hour in upper-middle- and high-income economies. This result follows evidence showing that only countries at these income levels (the frontier) can reduce the energy and environmental intensity of their GDP [36]. Large regression coefficients suggest that high-income economies have been decoupling sources of their growth from material consumption. These results should be further verified by separating production from consumption-based indicators. Still, they bode well with the assumption that drivers of technology upgrading are different at different income levels. Additionally, this result suggests that “greening” of economies at low- and low-middle-income levels would require much more radical changes in the nature of their industrialisation and growth for greening to have a discernible impact on productivity.
Overall, results suggest that low-income countries mainly benefit from accelerated structural change and improved organisational capabilities, while to benefit from greening, the level of development should be pretty high (upper-middle- and high-income at the frontier exploiting innovation-strategy). On the downside, production capabilities might not help upper-middle-income countries further increase their productivity, as their growth should focus on technology generation. Finally, structural change, as defined by our index, might not be associated with higher productivity in countries at a relatively higher development level.

5. Discussion

Based on data for 164 economies in 2002–2019, among which are many catching-up economies, the paper uses and develops further a new conceptual approach to measuring technology upgrading [1,2]. Within that approach, we focus on the interlinkages between digitalisation, greening, and technology upgrading.
The index of technology upgrading (ITU for short) is based on two complementary—but independent—components, which proxy for two dimensions of the technology upgrading process: scale or intensity of technology activities, and breadth or scope of technology upgrading activities. In turn, the breadth of technology upgrading includes digitalisation and “greening”. The technology and knowledge exchange with the global economy is a separate index.
The technology upgrading framework should be considered a proxy for the potential for catching up with economies based on broadly defined technology capability. Within that context, future growth is expected to depend on digitalisation and sustainable development based on structural transformation towards the lesser intensity of energy and materials intensity of production activities—or “greening”.
The technology upgrading framework uncovers new aspects of the technology accumulation process and the relative positions of countries, which conventional mainstream approaches and composite indicators do not reveal or capture only marginally. The paper has explored the relationship between the individual subcomponents of the ITU and changes in TFP and labour productivity. We explore the relationship between the technology upgrading framework and conventional macroeconomic productivity indicators. In particular, we focus on “greening” and digitalisation as two components of structural upgrading.
A longitudinal regression model controlling for panel fixed effects and macro-shocks suggests that the index of technology upgrading could be used to understand some changes to total factor productivity and labour productivity, and income per capita. Of course, we recognise the limitation of conventional macro-productivity indicators to capture technology accumulation. Relatively weak associations between traditional measures of productivity and much more direct measures of technology accumulation, as reflected in our technology upgrading framework, indicate that they are a poor guide to policy. Much more direct measurements of different dimensions of technology upgrading carry much more analytical value and policy relevance. When we control for income levels, the most credible results are with labour productivity per hour, which directly measures productivity.

6. Conclusions and Implications for Science & Technology Policies

Five results of our analysis represent the most significant policy-relevant conclusions. First, infrastructure and a firm’s organisational capabilities are significant determinants of changes in aggregate productivity.
Second, the growth of R&D capabilities does not directly “translate” into aggregate productivity growth. Despite its strong relevance for science and technology policy, our results point out that the orientation and relevance of R&D may be much more significant than its levels and changes in intensity.
Third, changes in production capability significantly impact growth in aggregate productivity. However, when income levels control the relationship, this impact is no more significant. Moreover, in countries that transition from middle- to high-income level, increased production capability is a sign of structural stagnation and delayed growth of innovation capability.
Fourth, there is a lack of unconditional relationship between aggregate productivity growth, digitalisation, and greening. In addition, levels of digitalisation and greening do not correlate, suggesting these two transformation processes are not yet integrated into “ICT-assisted greening”. However, when we control for income levels, greening is the most significant driver of productivity in the case of upper-middle-income and high-income economies. This may suggest the emergence of the process of decoupling growth from material consumption and environmental degradation.
Fifth, it is surprising that digitalisation does not directly impact conventional productivity measures [37]. This may have to do with the productivity (de facto IT) paradox (Solow residual) [38]. Still, it also may reflect that our indicators of digitalisation (due to availability) are confined to basic ICT indicators. Even more surprising is that the greening index significantly impacts productivity in upper-middle-income and high-income economies, while digitalisation is absent. This result becomes somewhat clearer when seen from a long-term perspective. It was more than 25 years ago that Chris Freeman [39] noted that “what is required for the worldwide transition to a “green techno-economic paradigm” is something more fundamental than incremental change to an information technology regime” (p. 38). It seems that despite all policy rhetoric, we are not yet in the stage of the socio-technical transformations required for the sustainability paths.
The research presented in this paper has three significant policy implications. First, direct links between only a few components of TU and productivity point to the absence of complementary impacts of different components of TU on productivity (for a theoretical model on tightening environmental standards [40]). This reflects the lack of systemic changes or widespread “transformation failures” [41]. For example, the links between the ITU sub-components and productivity show that factors that contribute significantly to increased productivity go beyond conventional views, recipes for structural reforms and recommendations about more investment in R&D. They suggest that the orientation of R&D and its relevance, rather than R&D per se, may be more relevant issues.
Second, the analysis demonstrates the need to focus on the middle-income innovation trap, especially in upper-middle-income economies [35]. Bridging this gap would require a simultaneous increase in all three components of technology upgrading intensity (production, R&D, and technology generation) which in turn requires better coordination among these policies.
Third, broadening the scope of technology upgrading is linked to the structural transformation that digitalisation and “greening” fully embrace. Innovation policies for sustainable development should go beyond R&D-driven growth, be transformative, and include digitalisation and greening.
Coordination failures in this area are far more pervasive, and coordination successes are more difficult to achieve than isolated investments in R&D, production, and technology generation capabilities. Digitalisation and greening should be embraced as essential components of technology upgrading. It is encouraging that greening has positively and significantly impacted upper-middle and high-income economies. The challenge is whether greening can exert a similar impact in lower-income economies and how it can be integrated with digitalisation into “ICT-based greening” [42].
Overall, the absence of a significant impact of simultaneous changes in different components of technology upgrading on productivity demonstrates the widespread transformation failures. It seems that science and technology policies are firmly rooted in the previous two policy paradigms of R&D (based on market failures) and a system of innovation (based on system failure). These approaches are necessary but insufficient when we face widespread transformation failures [43,44]. Additionally, the diversification of technological knowledge and coordinated improvements to the demand and supply of technology require improvements to innovative enterprises’ social conditions [45,46]. We allude to coordination between conventional innovation and broader development and social policies [47,48].
Technology upgrading for sustainable development is a new policy agenda, where the main challenge is a failure in coordination or integration of conventional policy areas that are so far disconnected. In our view, this represents the main challenge for the S&T system and traditional S&T policies.
As would be expected, the paper highlights some limitations. First, choosing appropriate indicators is inevitably complex; future work might improve on the 49 sub-components choice. The analysis would benefit from longer time series (including the potential consequences of COVID-19 in 2020–2021 and the more recent military conflict in Ukraine and ensuing waves across markets worldwide), and a larger sample of economies.
Our research shows the need to devote more research to various measures of productivity and explore the extent to which they capture different measures of technology accumulation. Productivity indicators as aggregate efficiency outcomes contain other non-technological or institutional processes. They reflect the coevolution of technology accumulation and various non-technological factors in increasing complexity as we move from productivity per hour, per employed person, and per population. This issue has not been systematically addressed, yet it seems essential in understanding the coevolutionary nature of technology upgrading and sustainable economic performance.

Author Contributions

Conceptualization, R.L.B., K.O. and S.R.; methodology, R.L.B., K.O. and S.R.; validation, R.L.B., K.O. and S.R.; formal analysis, R.L.B., K.O. and S.R.; data curation, R.L.B., K.O. and S.R.; writing—original draft preparation, R.L.B., K.O. and S.R.; writing—review and editing, M.M.; supervision, M.M.; project administration, M.M.; funding acquisition, M.M. All authors have read and agreed to the published version of the manuscript.

Funding

European Commission Joint Research Center, Research project on “Technology Transformation for Sustainable Development with a Focus on Industrial and Innovation Policy Challenges Based on Technology Upgrading Metrics.” Expert contract EX2020D378483-102.

Institutional Review Board Statement

Not applicable.

Informed Consent Statement

Not applicable.

Data Availability Statement

Publicly available datasets were analyzed in this study. This data can be found in different sources listed in detail in Table A5.

Conflicts of Interest

The authors declare no conflict of interest.

Abbreviations

EPOEuropean Patent Office
FDIForeign Direct Investment
GDPGross Domestic Product
ITUIndex of Technology Upgrading
R&DResearch and Development
S&TScience and Technology
TFPTotal Factor Productivity
TUTechnology Upgrading
USPTOUnited States Patent and Trademark Office
WEFWorld Economic Forum
WIPOWorld Intellectual Property Organisation

Appendix A

The Index of Technology Upgrading (ITU) is composed of: Index A—intensity/type of technology upgrading; and Index B—breadth of technology upgrading:
ITU = IndexA + IndexB
Index A includes production capability, technology capability, and R&D, and knowledge intensity, based on 15 indicators. Index B includes human capital and physical infrastructure, structural change, digitalisation, and “greening”, based on 28 indicators. Appendix C, Table A5 presents the weights and components of each category and the quantitative indicators for each sub-index. All indexes and sub-indexes are estimated based on standardised quantitative indicators (i.e., all rescaled between 0 and 1) and aggregation of components with equal weights:
I c = j = 1 J m = 1 M w j m   ( X j m c X j m m i n )   |   X j m m a x X j m m i n
where c indicates country, w is the weight, j and m are indicator and component subscripts, and min and max denote the minimum and maximum values of each indicator across countries (OECD JRC Handbook on Constructing Composite Indicators, Methodology and user Guide, OECD [31]).

Appendix B. Regression Analyses for Different Variables

a.
Growth of TFP
b.
Growth of labour productivity (value added per person employed)
c.
Growth of labour productivity (value added per hours worked)
d.
Growth of income per capita
Regressions based on data sourced from: the World Bank Development Indicators, the World Economic Forum Global Competitiveness Index, World Intellectual Property data, the Scopus database, the International Organization for Standardization, United Nations Educational, Scientific and Cultural Organization, Barro-Lee, Forbes, and UN Comtrade databases (see Appendix C Table A5).
Table A1. Lagged growth of individual components of technology upgrading as determinants of growth of total factor productivity.
(1)(2)(3)(4)(5)(6)(7)(8)(9)
Dependent Variable: Growth in Total Factor Productivity
Δ(t − 1)Index1 Production1.777 2.940
(5.466) (4.769)
Δ(t − 1)Index2 Technological 0.297 2.000
(6.472) (5.880)
Δ(t − 1)Index3 R&D −13.210 * −13.892 *
(7.835) (7.547)
Δ(t − 1)Index4 Infrastructure −4.418 4.298
(7.785) (7.868)
Δ(t − 1)Index5 Structural Change 1.027 0.998
(1.048) (0.935)
Δ(t − 1)Index6 Firms’ Organizational capabilities −4.288 1.269
(4.338) (3.737)
Δ(t − 1)Index7 Digitalisation −3.201 −2.887
(2.471) (2.448)
Δ(t − 1)Index8 “Greening” −5.836−8.411
(8.126)(10.617)
Year DummiesY ***Y ***Y ***Y ***Y ***Y ***Y ***Y ***Y ***
Constant1.948 ***1.831 ***1.847 ***1.864 ***1.119 **1.841 ***1.899 ***1.958 ***1.853 ***
(0.330)(0.370)(0.361)(0.384)(0.460)(0.361)(0.478)(0.360)(0.604)
Observations201619361968196815941936176120481431
Number of countries (Fixed Effects)126121123123122121128128116
Adjusted R-squared0.1250.1250.1340.1240.1350.1260.1300.1240.173
Robust standard errors in parentheses. *** p < 0.01, ** p < 0.05, * p < 0.1.
Table A2. Lagged growth of individual components of technology upgrading as determinants of growth of Labour Productivity (as value added per person employed).
(1)(2)(3)(4)(5)(6)(7)(8)(9)
Dependent Variable: Growth in Labour Productivity
(per Person Employed)
Δ(t − 1)Index1 Production2.095 −1.679
(5.565) (5.154)
Δ(t − 1)Index2 Technological −0.406 0.785
(5.721) (6.602)
Δ(t − 1)Index3 R&D −7.821 −9.961
(8.539) (9.226)
Δ(t − 1)Index4 Infrastructure 2.093 7.321
(8.446) (9.363)
Δ(t − 1)Index5 Structural Change 1.001 0.323
(1.322) (1.414)
Δ(t − 1)Index6 Firms Organizational −3.335 3.410
(5.187) (4.935)
Δ(t − 1)Index7 Digitalisation −1.356 −3.122
(2.587) (2.613)
Δ(t − 1)Index8 “Greening” −0.808−13.317
(6.318)(20.360)
Year DummiesY ***Y ***Y ***Y ***Y ***Y ***Y ***Y ***Y ***
Constant3.805 ***3.620 ***3.740 ***3.599 ***3.449 ***3.678 ***3.843 ***3.713 ***4.281 ***
(0.326)(0.382)(0.372)(0.407)(0.426)(0.381)(0.495)(0.376)(0.616)
Observations201619361968196815941936176120481431
Number of countries (Fixed Effects)126121123123122121128128116
Adjusted R-squared0.1090.1090.1140.1040.1140.1060.1030.1070.134
Robust standard errors in parentheses. *** p < 0.01.
Table A3. Lagged growth of individual components of technology upgrading as determinants of growth of Labour Productivity (as value added per hour worked).
(1)(2)(3)(4)(5)(6)(7)(8)(9)
Dependent Variable: Growth Lab Productivity
(per Hour Worked)
Horse Race
Δ(t − 1)Index1 Production−1.622 −5.417
(4.494) (5.014)
Δ(t − 1)Index2 Technological 1.412 −0.152
(5.518) (5.604)
Δ(t − 1)Index3 R&D 0.865 −10.589
(7.213) (8.991)
Δ(t − 1)Index4 Infrastructure. 15.162 ** 17.985 **
(6.181) (7.448)
Δ(t − 1)Index5 Structural Change 1.418 −0.066
(1.559) (1.489)
Δ(t − 1)Index6 Firms Organizational 9.736 ** 6.698
(3.811) (4.043)
Δ(t − 1)Index7 Digitalisation −3.491 −3.277
(2.469) (2.441)
Δ(t − 1)Index8 “greening” 11.7344.329
(10.037)(9.047)
Year DummiesY ***Y ***Y ***Y ***Y ***Y ***Y ***Y ***Y ***
Constant3.640 ***3.522 ***3.671 ***3.532 ***3.510 ***3.649 ***3.806 ***3.552 ***3.451 ***
(0.329)(0.299)(0.308)(0.305)(0.336)(0.306)(0.362)(0.325)(0.392)
Observations104310271043104394710439811043901
Number of countries (Fixed Effects)666566666666666665
Adjusted R-squared0.1800.1760.1800.1850.1740.1850.1870.1810.188
Robust standard errors in parentheses. *** p < 0.01, ** p < 0.05.
Table A4. Lagged growth of individual components of technology upgrading as determinants of income per capita.
(1)(2)(3)(4)(5)(6)(7)(8)(9)
Dependent Variable: Income per Capita Growth
Δ(t − 1)Index1 Production8.058 9.466 *
(5.631) (5.529)
Δ(t − 1)Index2 Technological −2.191 −0.086
(5.447) (5.671)
Δ(t − 1)Index3 R&D −19.874 ** −26.074 ***
(8.475) (8.388)
Δ(t − 1)Index4 Infrastructure 2.789 10.639
(8.064) (8.567)
Δ(t − 1)Index5 Structural Change 1.881 * 1.118
(1.027) (0.960)
Δ(t − 1)Index6 Firms Organizational −3.648 4.179
(4.284) (3.778)
Δ(t − 1)Index7 Digitalisation 3.350 1.511
(3.033) (3.000)
Δ(t − 1)Index8 “greening” 0.556−4.299
(6.215)(11.669)
Year DummiesY ***Y ***Y ***Y ***Y ***Y ***Y ***Y ***Y ***
Constant4.975 ***4.667 ***4.784 ***4.617 ***4.539 ***4.723 ***4.376 ***4.719 ***4.985 ***
(0.305)(0.340)(0.332)(0.364)(0.397)(0.339)(0.515)(0.332)(0.636)
Observations201619361968196815941936176120481431
Number of countries (Fixed Effects)126121123123122121128128116
Adjusted R-squared0.1940.1940.2080.1900.2250.1930.1980.1900.278
Robust standard errors in parentheses *** p < 0.01, ** p < 0.05, * p < 0.1.

Appendix C. Components of Technology Upgrading

Following the seminal OECD JRC Handbook on Constructing Composite Indicators, Methodology and user Guide, OECD [31], we have maintained the simplest structure possible as far as weights are concerned, with equal weight for each of the 49 quantitative indicators. The 49 quantitative indicators aggregate (equally weighted) in nine components (called sub-indexes), and in turn the nine sub-indexes aggregate (equally weighted) in the Index A, B and C.
Table A5. Components of technology upgrading.
Category
(Index)
Component (Sub-Index)Quantitative IndicatorsComponent WeightCategory WeightCronbach’s Alpha
Index A: Intensity and Types of technology upgrading1. Production Capability1. ISO9001 Certificates per million inhabitants (Source: ISO website)1/31/20.8615
2. Trademark Application, residents per million inhabitants (Source: WIPO Database)
3. Extent of Staff Training (Source: WEF Global Competitiveness Report Database)
2. Technology capability4. Patents resident applications to national office per million inhabitants (Source: WIPO Database)1/4
5. Patent applications to USPTO per million inhabitants (Source: WIPO Database)
6. Patent applications to EPO per million inhabitants (Source: WIPO Database)
7. Resident’s industrial design count per million inhabitants (Source: WIPO Database)
3. R&D
Capability
8. Business enterprise sector R&D expenditure (as % of GDP) (Source: UNESCO UIS.Stat)1/8
9. R&D expenditure (% of GDP) (Source: World Bank)
10 Researchers in R&D per million inhabitants (Source: World Bank)
11 Technicians in R&D per million inhabitants (Source: World Bank)
12. Scientific and technical journal articles per million inhabitants (Source: World Bank)
13. Science citations per million inhabitants (Source: Scimago Journal & Country Rank)
14. Quality of scientific research institutions Q.12.02 (Source: WEF Global Competitiveness Report Database)
15. University-industry collaboration in R&D Q.12.04 (Source: WEF Global Competitiveness Report Database)
Index B: Breadth of technology upgrading: Structural Features4. Infrastructure: human capital and physical16.Labor Force with advanced education (Source: World Bank)1/61/20.7051
17.Quality of maths and science education Q.5.04 (Source: WEF Global Competitiveness Report Database)
18.Availability of research and training services Q.5.07 (Source: WEF Global Competitiveness Report Database)
19.Availability of scientists and engineers Q.12.06 (Source: WEF Global Competitiveness Report Database)
20.Logistic performance index (Source: World bank)
21.Gross Fixed Investment as % of GDP (Source: World Bank)
5. Structural Change22.Herfindahl-Hirschman Index for total national patent applications (Source: WIPO Database)1/7
23.Herfindahl-Hirschman Index for patent applications to EPO (Source: WIPO Database)
24.Herfindahl-Hirschman Index for patent applications to USPTO (Source: WIPO Database)
25.Buyer sophistication Q.6.16 (Source: WEF Global Competitiveness Report Database)
26.Change in buyer sophistication (% change in Q. 6.16) (Source: WEF Global Competitiveness Report Database)
27.Availability of state-of-the-art technologies Q.9.01 (Source: WEF Global Competitiveness Report Database)
28.Change in availability of latest technologies (% change in 9.01) (Source: WEF Global Competitiveness Report Database)
6. Firm organisational capabilities29.Number of firms in Forbes 2000 per million inhabitants (Source: Forbes Global 2000 companies reports)1/5
30.Firm level technology absorption Q.9.02 (Source: WEF Global Competitiveness Report Database)
31. Reliance on professional management Q7.07(Source: WEF Global Competitiveness Report Database)
32. Control of International Distribution (Source: WEF Global Competitiveness Report Database)
33. Firms offering formal training (% of firms) (Source: World Bank)
7. Digitalisation34. Fixed broadband Internet subscribers (per 100 people) (Source: World Bank)1/3
35. Secure Internet servers (per 1 million people) (Source: World Bank)
36. International Bandwidth in Mbits (Source: International Telecommunication Union)
8. “Greening”38. Renewable energy consumption (% of total final energy consumption) (Source: World Bank)1/6
39. CO2 emissions (metric tons per capita) inverted Higher = better (Source: World Bank)
40. Energy Intensity level of Primary energy (Source: World Bank)
41. Nitrous oxide emission (% change from 1990) inverted Higher = better (Source: World Bank)
42. Fertiliser Consumption (Kilograms per hectare of arable land) inverted Higher = better (Source: World Bank)
43. Total Greenhouse gas emission (% change from 1990) inverted Higher = better (Source: World Bank)
Category (Index)Component (Sub-Index)Quantitative IndicatorsComponent WeightCronbach’s Alpha
Index C: Interactions
with the Global Economy
Technology and knowledge exchange44. Technology balance of payments (receipts) as % of GDP (Source: World Bank)
45. Technology balance of payments (payments) as % of GDP (Source: World Bank)
46. Share of exports in complex industries in total exports (SITCRev3 5 71-79 87 88) (2002–16 avg) (Source: UN Comtrade database)
47. Foreign direct investment, net outflows (% of GDP) (Source: World Bank)
48. Foreign direct investment, net inflows (% of GDP) (Source: World Bank)
49. Economic Complexity of export products (Source: The Observatory of Economic Complexity)
1/60.7721

References

  1. Radosevic, S.; Yoruk, E. Why Do We Need Theory and Metrics of Technology Upgrading? Asian J. Technol. Innov. 2016, 24, 8–32. [Google Scholar] [CrossRef]
  2. Radosevic, S.; Yoruk, E. Technology Upgrading of Middle-Income Economies: A New Approach and Results. Technol. Forecast. Soc. Chang. 2018, 129, 56–75. [Google Scholar] [CrossRef]
  3. Nguyen, H.T.; Hoang, T.G.; Nguyen LQ, T.; Le, H.P.; Mai HX, V. Green technology transfer in a developing country: Mainstream practitioner views. Int. J. Organ. Anal. 2021, 30, 699–720. [Google Scholar] [CrossRef]
  4. Elgin, C.; Özgür, G.; Cantekin, K. Measuring green technology adoption across countries. Sustain. Dev. 2022, 1–11. [Google Scholar] [CrossRef]
  5. Hossain, M.I.; San Ong, T.; Teh, B.H.; Said, R.M.; Siow, M.L. Nexus of Stakeholder Integration, Green Investment, Green Technology Adoption and Environmental Sustainability Practices: Evidence from Bangladesh Textile SMEs. Pertanika J. Soc. Sci. Humanit. 2022, 30, 253–281. [Google Scholar] [CrossRef]
  6. Lall, S. Technological Capabilities and Industrialization. World Dev. 1992, 20, 165–186. [Google Scholar] [CrossRef]
  7. Syverson, C. What Determines Productivity? J. Econ. Lit. 2011, 49, 326–365. [Google Scholar] [CrossRef]
  8. Plekhanov, D.; Franke, H.; Netland, T.H. Digital transformation: A review and research agenda. Eur. Manag. J. 2022. [Google Scholar] [CrossRef]
  9. Sareen, S.; Håvard, H. Digitalisation as a driver of transformative environmental innovation. Environ. Innov. Soc. Transit. 2021, 41, 93–95. [Google Scholar] [CrossRef]
  10. Chetna, C.; Parida, V.; Dhir, A. Linking circular economy and digitalisation technologies: A systematic literature review of past achievements and future promises. Technol. Forecast. Soc. Change 2022, 177, 121508. [Google Scholar]
  11. EC. Strategic Foresight Report: Twinning the Green and Digital Transitions in the New Geopolitical Context; Euroean Commisison: Brussels, Belgium, 2022.
  12. Schreyer, P.; Pilat, D. Measuring Productivity. OECD Econ. Stud. 2003, 2001, 127–170. [Google Scholar]
  13. Prescott, E.C. Needed: A Theory of Total Factor Productivity. Int. Econ. Rev. 1998, 39, 525–552. [Google Scholar] [CrossRef]
  14. Acemoglu, D.; Aghion, P.; Zilibotti, F. Distance to Frontier, Selection, and Economic Growth. J. Eur. Econ. Assoc. 2006, 4, 37–74. [Google Scholar] [CrossRef]
  15. Farrell, M.J. The Measurement of Productive Efficiency. J. R. Stat. Soc. Ser. A (Gen.) 1957, 120, 253–290. [Google Scholar] [CrossRef]
  16. Cusolito, A.P.; Maloney, W.F. Productivity Revisited: Shifting Paradigms in Analysis and Policy; World Bank: Washington, DC, USA, 2018. [Google Scholar]
  17. Bell, M.; Pavitt, K. Technological Accumulation and Industrial Growth: Contrasts between Developed and Developing Countries. Ind. Corp. Chang. 1993, 2, 157–210. [Google Scholar] [CrossRef]
  18. Kay, J.A. Foundations of Corporate Success; Oxford University Press: Oxford, UK, 1993. [Google Scholar]
  19. Neculaesei, A.N.; Tatarusanu, M.; Anastasiei, B.; Dospinescu, N.; Grigoruta, M.V.B.; Ionescu, M.A. A model of the relationship between organizational culture, social responsibility and performance. Transform. Bus. Econ. 2019, 18, 42–59. [Google Scholar]
  20. Mowery, D.C.; Oxley, J.E. Inward Technology Transfer and Competitiveness: The Role of National Innovation Systems. Camb. J. Econ. 1995, 19, 67–93. [Google Scholar]
  21. Organisation for Economic Cooperation and Development (OECD). Handbook on Constructing Composite Indicators, Methodology and User Guide; OECD: Paris, France, 2008.
  22. Amoroso, S.; Moncada-Paternò-Castello, P. Inward greenfield FDI and patterns of job polarisation. Sustainability 2018, 10, 1219. [Google Scholar] [CrossRef]
  23. Rojec, M.; Knell, M. Why Is There a Lack of Evidence on Knowledge Spillovers From Foreign Direct Investment? J. Econ. Surv. 2017, 32, 579–612. [Google Scholar] [CrossRef]
  24. Bruno, R.; Cipollina, M. A Meta-analysis of the Indirect Impact of Foreign Direct Investment in Old and New EU Member States: Understanding productivity spillovers. World Econ. 2017, 41, 1342–1377. [Google Scholar] [CrossRef]
  25. Bruno, R.; Campos, N.; Estrin, S. Taking Stock of Firm-level and Country-level Benefits from Foreign Direct Investment. Multinatl. Bus. Rev. 2018, 26, 126–144. [Google Scholar] [CrossRef]
  26. Peneder, M. Industrial Structure and Aggregate Growth. Struct. Change Econ. Dyn. 2004, 14, 427–448. [Google Scholar] [CrossRef]
  27. Kergroach, S. National Innovation Policies for Technology Upgrading through GVCs: A cross-country comparison. Technol. Forecast. Soc. Chang. 2019, 145, 258–272. [Google Scholar] [CrossRef]
  28. Fu, X.; Gong, Y. Indigenous and Foreign Innovation Efforts and Drivers of Technological Upgrading: Evidence from China. World Dev. 2011, 39, 1213–1225. [Google Scholar] [CrossRef]
  29. Fouquet, R.; Hipper, R. Twin transitions of decarbonisation and digitalisation: A historical perspective on energy and information in European economies. Energy Res. Soc. Sci. 2022, 91, 102736. [Google Scholar] [CrossRef]
  30. Santoalha, A.; Consoli, D.; Castellacci, F. Digital skills, relatedness and green diversification: A study of European regions. Res. Policy 2021, 50, 104340. [Google Scholar] [CrossRef]
  31. Bruno, R.; Osaulenko, K.; Radosevic, S. Technology Upgrading in Emerging Economies: A new approach to its Measurement; Oxford University Press: Oxford, UK, 2021. [Google Scholar]
  32. Lee, J.D.; Lee, J.K.; Radosevic, S.; Vonortas, N. Results, and relationship to mainstream measures. In The Challenges of Technology and Economic Catch-up in Emerging Economies; Lee, J.-D., Lee, K., Meissner, D., Radosevic, S., Vonortas, N., Eds.; Oxford University Press: Oxford, UK, 2021; Chapter 3; pp. 67–99. [Google Scholar]
  33. Cohen, W.M.; Levinthal, D.A. Innovation and Learning: The two faces of R&D. Econ. J. 1990, 99, 569–596. [Google Scholar]
  34. Cohen, W.M.; Levinthal, D.A. Absorptive Capacity: A new perspective on learning and innovation. Adm. Sci. Q. 1990, 35, 128–152. [Google Scholar] [CrossRef]
  35. van Ark, B. Productivity and Digitalisation in Europe: Paving the Road to Faster Growth. Digiworld Econ. J. 2015, 100, 107–124. [Google Scholar]
  36. Lee, J.D.; Baek, C.; Yeon, J.I. Middle Innovation Trap: Capability Transition Failure and Stalled Economic Growth. In The Challenges of Technology and Economic Catch-Up in Emerging Economies; Lee, J.-D., Lee, K., Meissner, D., Radosevic, S., Vonortas, N.S., Eds.; Oxford University Press: Oxford, UK, 2021. [Google Scholar]
  37. UNIDO. Industrial Development Report 2018: Demand for Manufacturing: Driving Inclusive and Sustainable Industrial Development; United Nations: New York, NY, USA, 2018. [Google Scholar]
  38. Gal, P.; Nicoletti, G.; Renault, T.; Sorbe, S.; Timiliotis, C. Digitalisation and productivity: In search of the holy grail—Firm-level empirical evidence from EU countries. OECD Econ. Dep. Work. Pap. 2019, 1533. [Google Scholar]
  39. Gopane, T.J. Digitalisation, Productivity, and Measurability of Digital Economy: Evidence from BRICS. In Digital Economy. Emerging Technologies and Business Innovation ICDEc 2020 Lecture Notes in Business Information Processing; Bach Tobji, M.A., Jallouli, R., Samet, A., Touzani, M., Strat, V.A., Pocatilu, P., Eds.; Springer: Berlin/Heidelberg, Germany, 2020; Volume 395, pp. 27–37. [Google Scholar]
  40. Freeman, C. The Greening of Technology and Models of Innovation. Technol. Forecast. Soc. Chang. 1996, 53, 27–39. [Google Scholar] [CrossRef]
  41. Wang, X.; Soo-Haeng, C.; Scheller-Wolf, A. Green technology development and adoption: Competition, regulation, and uncertainty—A global game approach. Manag. Sci. 2021, 67, 67201–67219. [Google Scholar] [CrossRef]
  42. Weber, K.M.; Rohracher, H. Legitimising research, technology and innovation policies for transformative change. Combining insights from innovation systems and multi-level perspective in a comprehensive ‘failures’ framework. Res. Policy 2012, 41, 1037–1047. [Google Scholar] [CrossRef]
  43. Kunkel, S.; Tyfield, D. Digitalisation, sustainable industrialisation and digital rebound—Asking the right questions for a strategic research agenda. Energy Res. Soc. Sci. 2021, 82, 102295. [Google Scholar] [CrossRef]
  44. Schot, J.; Steinmueller, W.E. Three frames for innovation policy: R&D, systems of innovation and transformative change. Res. Policy 2021, 47, 1554–1567. [Google Scholar]
  45. Steward, F. Transformative innovation policy to meet the challenge of climate change: Sociotechnical networks aligned with consumption and end-use as new transition arenas for a low-carbon society or green economy. Technol. Anal. Strateg. Manag. 2012, 24, 331–343. [Google Scholar] [CrossRef]
  46. Lazonick, W. The Theory of Innovative Enterprise. In International Encyclopaedia of Business and Management; Warner, M., Ed.; Thomson Learning: Chicago, IL, USA, 2002; pp. 3055–3076. [Google Scholar]
  47. Lazonick, W. Innovative Enterprise and Historical Transformation. Enterp. Soc. 2002, 3, 3–37. [Google Scholar] [CrossRef]
  48. Heyman, F.; Norbäck, P.J.; Persson, L. Digitalisation, Productivity and Jobs: A European Perspective. In The European Union and the Technology Shift; Bakardjieva Engelbrekt, A., Leijon, K., Michalski, A., Oxelheim, L., Eds.; Palgrave Macmillan: London, UK, 2021. [Google Scholar] [CrossRef]
Figure 1. Relationship between gross domestic product per capita and “Index of Technology Upgrading (A + B), average 2002–2019 (in values standardised between 0 and 1)”.
Sustainability 15 01838 g001
Figure 2. Indexes A (scale/intensity) and B (scope/breadth), average 2002–2019 (in values standardised between 0 and 1).
Sustainability 15 01838 g002
Figure 3. Index of technology upgrading (A + B) and C (technology/knowledge exchange), average 2002–2019 (in values standardised between 0 and 1).
Sustainability 15 01838 g003
Figure 4. “Levels of greening” and digitalisation across 164 economies, 2019.
Sustainability 15 01838 g004
Figure 5. Relationship between average growth rates of index A (intensity) and index B (breadth) of technology upgrading 2002–2019.
Sustainability 15 01838 g005
Figure 6. Relationship between average rates of growth of index of “technology upgrading” (A + B) and average rates of growth of “knowledge exchange” (C), 2002–2019.
Sustainability 15 01838 g006
Figure 7. Relationship between growth rates of the technology upgrading index and labour productivity growth rate. Note: Before calculating the growth rate, both variables were standardised using the min-max method. Labour productivity per person employed in 2017 US$ (converted to 2017 prices based on updated 2011 PPPs). The average growth rate is calculated as the mean of the variables’ yearly growth between 2002–2019.
Sustainability 15 01838 g007
Table 1. Technology upgrading determinants of macro levels of productivity at different level of development.
Dependent:
Δ Labour Productivity
(per Person Employed)
Dependent:
Δ Labour Productivity
(per Hour Worked)
Dependent:
Δ Income
per Capita
Index 1 Production capability Upper-Middle income −28.616 **
(13.244)
Index 5 Structural change Low income8.392 * 8.033 *
(5.028) (4.743)
Index 5 Structural change Lower Middle-Income−9.460 *
(5.356)
Index 5 Structural change High Income−10.688 *
(5.980)
Index 6 Organisational Capabilities Low income 13.330 *
(7.976)
Index 8 Greening Upper-Middle Income 59.140 *
(35.216)
Index 8 Greening High Income 53.105 *
(28.731)
Constant3.454 ***3.529 ***4.530 ***
(0.427)(0.322)(0.400)
Observations159410431594
Number of Countries12266122
Adjusted R-squared0.1170.1840.227
Robust standard errors in parentheses *** p < 0.01, ** p < 0.05, * p < 0.1.
Disclaimer/Publisher’s Note: The statements, opinions and data contained in all publications are solely those of the individual author(s) and contributor(s) and not of MDPI and/or the editor(s). MDPI and/or the editor(s) disclaim responsibility for any injury to people or property resulting from any ideas, methods, instructions or products referred to in the content.

