
Unveiling the Environmental–Economic Nexus: Cointegration and Causality Analysis of Air Pollution and Growth in Oman

Abstract
:1. Introduction
1.1. Greenhouse Gas Emissions in Oman
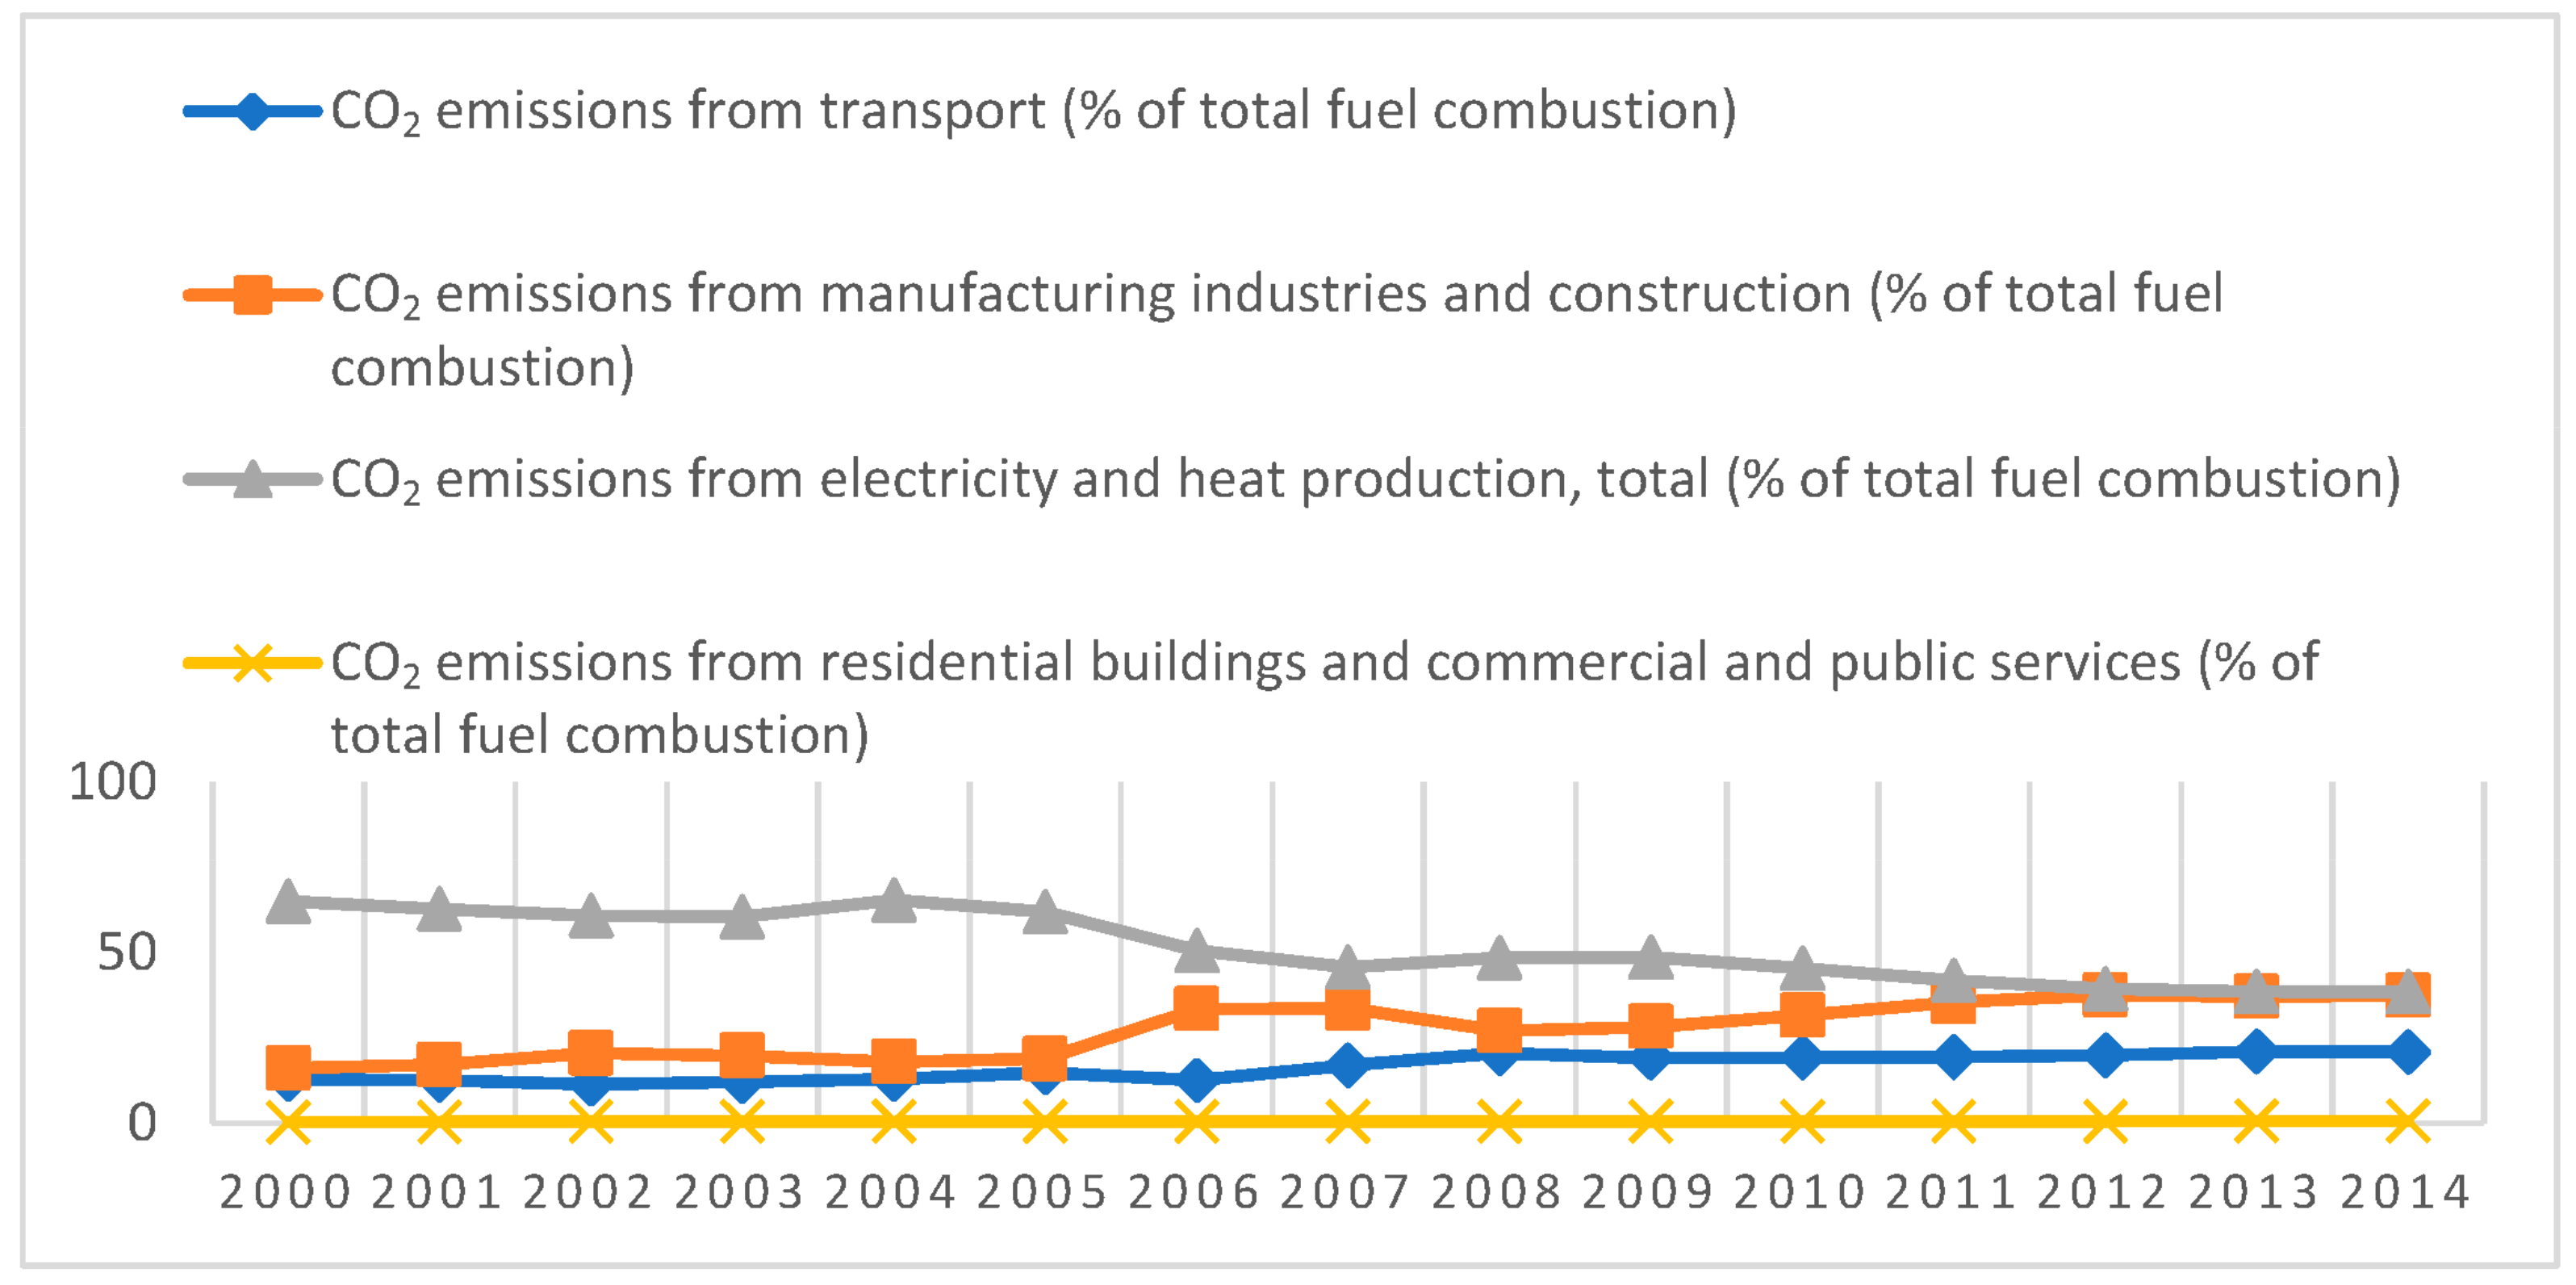
- Energy production: A major portion of Oman’s greenhouse gas emissions come from the energy sector. Because the nation’s economy and electricity generation are mostly dependent on oil and natural gas, fossil fuels are burned in power plants and other industrial processes, which contributes to the atmospheric release of large amounts of carbon dioxide (CO2) [6].
- Transportation: Due to Oman’s expanding population and economy, there are more cars on the road, which means that gasoline- and diesel-powered cars are the main contributors to CO2 emissions. The reliance on private vehicles is additionally exacerbated by the absence of a well-developed public transportation system [5].
- Industrial processes: As a byproduct of their operation, industrial processes, including the manufacture of cement, smelting metal, and producing petrochemicals, emit greenhouse gases. CO2 and other gases including nitrous oxide (N2O) and methane (CH4) are among these emissions [7].
- Waste management is essential to reducing methane emissions. Organic materials that are improperly disposed of as solid trash in landfills may break down anaerobically, producing methane. However, it is possible to reduce these emissions by putting in place appropriate waste management and recycling procedures [8,9].
- 5.
- Reductions in carbon sinks and the release of carbon stored in soils and plants can be the outcomes of changes in land use, such as urbanization and deforestation. This drop in biodiversity could have a substantial effect on the climate and ecology. The ecosystem and climate may be significantly impacted by this decline in carbon sinks [12].
- 6.
- Emissions of greenhouse gases can rise due to improper wastewater treatment system management. Better wastewater treatment systems can reduce methane emissions and improve the overall health of the environment [13].
1.2. Causes of Air Pollution in Oman
- Industrial emissions: Processes used in the extraction of oil and gas, the production of petrochemicals, and other heavy industries discharge a range of air pollutants into the environment. These emissions include, but are not limited to, particulate matter, sulfur dioxide (SO2), nitrogen oxides (NOx), and volatile organic compounds (VOCs).
- Vehicle emissions: The increasing number of cars on the road exacerbates air pollution. Both gas-powered and diesel-powered vehicles emit various pollutants, such as NOx, particulate matter, carbon monoxide (CO2), and volatile organic compounds.
- Infrastructure building and development: As cities get more populated, there may be an increase in dust and particulate matter in the air. These particles can cause respiratory problems and reduce air quality.
- Natural sources: Dust storms can have a major impact on air pollution, particularly in Oman’s arid climate. Sand and dust particles are carried into the atmosphere and, once settled, have the potential to impact air quality.
- Maritime transport: Oman has a sizable shipping sector due to its advantageous location close to the Arabian Sea and the Gulf of Oman. The air quality around the shore is impacted by ship emissions, which might include sulfur dioxide, SO2, and particulate matter.
- Waste management: Open burning of trash and inefficient waste disposal can release pollutants back into the atmosphere. Particularly in certain less developed areas, this is a worry.
- Oil and gas operations: As a significant producer of both, Oman may emit greenhouse gases and pollutants during the extraction and processing of these resources.
- Refineries and petrochemical facilities: The refining and petrochemical of natural gas and oil can discharge a number of airborne pollutants.
- Agricultural practices: Ammonia (NH3) and other chemicals can be released back into the atmosphere during the use of fertilizers and pesticides in agriculture.
- Power generation: Pollutants may be released back into the atmosphere when fossil fuels are burned to create energy. To lessen this cause of pollution, Oman is attempting to diversify its energy sources, particularly through renewable energy initiatives.
2. Related Literature
2.1. Economic Growth and Air Pollution
2.2. Urbanization and Air Pollution
2.3. Energy Consumption and Air Pollution
3. Model Specification, Data, and Econometric Methodology
3.1. Model Specification
- Model 1:
- Model 2:
3.2. Data Analysis
- Economic growth (RGDPc): Denoted as RGDPc, it is the dependent variable in this study. It represents the real gross domestic product (GDP) per capita in Oman. It measures the average economic output generated by each individual in the country. It is a key indicator of the standard of living and economic well-being of a nation’s population.
- Carbon dioxide emissions (CO2): Denoted as CO2, they are measured in metric tons per capita. They represent the total amount of carbon dioxide gas released into the atmosphere per person in Oman. CO2 emissions are a significant environmental variable. They are a measure of the carbon footprint associated with economic activities, particularly energy production and consumption. An increase in CO2 emissions is often linked to industrialization and economic growth.
- Nitrogen dioxide emissions (N2O): Denoted as N2O, they are measured in kilotons and represent the amount of nitrous oxide gas emitted from fossil fuel consumption in Oman. N2O emissions are another important environmental variable. Nitrous oxide is a potent greenhouse gas and air pollutant. It is released from various human activities, including the burning of fossil fuels. Tracking N2O emissions is crucial for assessing the environmental impact of economic activities.
- Energy use (ENGU): Denoted as ENGU, it is measured in kilograms of oil equivalents (kgoe) per capita in Oman. ENGU represents the amount of energy consumed by an individual in Oman, typically expressed in terms of the energy equivalents of oil. It reflects the energy demand of the population and is a crucial variable when examining the relationship between energy consumption and economic growth.
- Percentage of urban population (URP): Denoted as URP, it represents the proportion of Oman’s total population living in urban areas. It is expressed as a percentage. URP is a demographic variable that reflects the level of urbanization in Oman. It indicates the extent to which the population is concentrated in urban centers as opposed to rural areas. Urbanization is often associated with economic development, as cities tend to be hubs for economic activities and job opportunities.
3.3. Econometric Methodology
- Dynamic ordinary least squares (DOLS)
- ΔYt is the dependent variable at time t;
- ΔXt is/are the independent variable(s) at time t;
- α is the intercept;
- β is/are the coefficient(s) of the independent variable(s);
- εt is the error term at time t.
- Johansen cointegration test
- Trace statistic (λ_trace): This statistic evaluates the null hypothesis, which suggests that the number of cointegration relationships is less than or equal to a specified value (r). It aids in determining the presence of cointegration within the dataset.
- Maximum eigenvalue statistic (λ_max): This statistic assesses the null hypothesis that the number of cointegration relationships precisely equals a specified value (r).
- T represents the sample size, denoting the number of observations;
- Λ is the product of the (1 − p_i) terms, where p_i signifies the eigenvalues of the estimated VAR model;
- Λ_max denotes the largest eigenvalue within the estimated VAR model.
- The error correction model (ECM)
4. Results and Discussion
4.1. Descriptive Statistics
4.2. Results of DOLS
- Model 1: economic growth (RGDPC)
- The coefficient of Ln CO2 is positive and highly significant (t-statistic = 8.022319, prob. = 0.0000), indicating that there is a positive association between carbon dioxide emissions (Ln CO2) and real GDP per capita (RGDPc). This suggests that as CO2 emissions increase, RGDPc also tends to increase, potentially highlighting a link between economic expansion and increased CO2 emissions (the result is consistent with the results of [66,67].
- The coefficient for Ln N2O is negative and highly significant (t-statistic = −10.98754, prob. = 0.0000). This indicates a negative impact of nitrous oxide (N2O) emissions on RGDPc. A decrease in N2O emissions appears to be associated with higher per capita GDP.
- The coefficient for Ln URP is positive and highly significant (t-statistic = 19.76856, prob. = 0.0000), indicating a positive relationship between urban population (URBN) and RGDPc. This suggests that urbanization has a significant and positive impact on economic growth.
- The coefficient for Ln ENGU is positive but not statistically significant (t-statistic = 0.982604, prob. = 0.3342). This suggests that energy use (ENGU) may not have had a substantial impact on Oman’s economic growth during the period under study.
- Model 2: air pollution (N2O)
- Ln RGDPC: The coefficient for Ln RGDPC is positive and highly significant (t-statistic = 7.320290, prob. = 0.0000), indicating a positive association between real GDP per capita (RGDPC) and nitrous oxide (N2O) emissions. This supports the environmental Kuznets curve (EKC) hypothesis, suggesting that economic growth initially leads to an increase in pollution before eventually decreasing it.
- Ln (RGDPcit)2: The coefficient for Ln RGDPC2 (quadratic term) is negative and highly significant (t-statistic = −5.511561, prob. = 0.0000). This quadratic term reflects the curvature in the EKC relationship, implying that, as economic growth reaches higher levels, the impact on reducing N2O emissions becomes more pronounced.
- Ln CO2, Ln URP, and Ln ENGU: These variables also show significant coefficients, suggesting their influence on N2O emissions.
4.3. Unit Root Test
- Criteria overview: The table presents various lag order selection criteria, including log likelihood (LogL), sequential modified LR (LR), final prediction error (FPE), Akaike information criterion (AIC), Schwarz information criterion (SC), and Hannan–Quinn information criterion (HQ). These criteria help determine the optimal lag order for a VAR model.
- Lag order selection: Based on the different criteria, it is clear that lag three appears to be the ideal choice for the VAR model. This is supported by the asterisks (*) in the table, indicating that lag three is the selected order by these criteria. Specifically, LR, FPE, AIC, and SC all point to lag three as the preferred choice.
4.4. Cointegration Test Results
4.4.1. Results of Johansen Cointegration Test
- Optimal lag length: Before conducting the cointegration test, the optimal lag length was determined using the minimum Akaike information criterion (AIC) and Schwarz criterion (SC) from the estimate of the unconstrained vector autoregression (VAR) model for the first difference in the variables. It was found that the lag length is one.
- Cointegration equations: The Johansen cointegration test was conducted since all variables are integrated at the same order, I(1) and I(2). The results indicate that there are three cointegration equations at the 5% significance level, as the trace value surpasses the critical threshold. However, the maximum eigenvalue suggests that there are only two cointegration equations.
- Hypothesized tests: Table 8 below shows the results of various hypothesized tests. The “Trace” test statistic is used to determine the number of cointegrating equations. It indicates that there are three cointegrating equations at the 0.05 significance level.
- Interpretation: The presence of cointegrating equations suggests that there are long-term relationships among the variables, meaning that they move together in the long run. In this analysis, one can explore these cointegrating relationships further to understand how changes in one variable affect the others in the long term.
4.4.2. Results of Granger Causality Tests
- RGDPc → N2O (F-Stat. 4.647, p-value 0.0192, causality: yes):
- N2O → RGDPc (F-Stat. 3.099, p-value 0.0628, causality: no):
- ENGU → CO2 (F-Stat. 16.149, p-value 0.000, causality: yes):
- CO2 → ENGU (F-Stat. 11.583, p-value 0.0003, causality: yes):
- URP → RGDPc (F-Stat. 4.281, p-value 0.0252, causality: yes):
- RGDPc → URP (F-Stat. 4.363, p-value 0.0237, causality: yes):
- There is a statistically significant unidirectional causal relationship from real GDP per capita (RGDPc) to urban population (URP).
- URP → CO2 (F-Stat. 0.82434, p-value 0.4501, causality: no):
- CO2 → URP (F-Stat. 5.92209, p-value 0.0078, causality: yes):
5. Conclusions and Policy Implications
- Long-term cointegration: We have established that there is a substantial long-term cointegration among the variables, indicating a stable relationship between economic growth and air pollution in Oman.
- Positive link between economic growth and CO2 emissions: Our analysis has revealed a statistically significant positive association between economic growth and CO2 emissions, suggesting that, as the economy grows, so does the level of carbon dioxide emissions.
- N2O emissions correction: We found that there is an annual correction rate of approximately 14.9% in N2O emissions in the short term, indicating a dynamic adjustment towards an equilibrium.
- Causality analysis: The Granger causality analysis has shown unidirectional causal relationships between economic growth, energy use, urban population, and emissions in Oman, emphasizing the dynamic interplay between economic activity and air pollution.
- Balanced development: Oman should adopt a balanced approach to development that recognizes the interdependence of the environment and the economy. Policymakers should prioritize environmental preservation alongside economic growth to ensure long-term sustainability.
- Environmental protection initiatives: Stronger regulations, incentives for environmentally friendly innovation, and investments in renewable energy sources are crucial to reduce pollution levels and mitigate the negative impact of air pollution on economic growth.
- Policy framework: Oman needs a comprehensive policy framework that promotes sustainable practices and environmentally responsible policies. This framework should encourage the transition to cleaner energy sources and stricter environmental standards.
- Public engagement: It is essential to involve the general population in advancing environmental responsibility. Public awareness campaigns and education initiatives can play a significant role in fostering a culture of sustainability.
- Sectoral analysis: Delve into the contribution of various economic sectors in Oman to CO2 and N2O emissions. This entails breaking down economic and emissions data to pinpoint which sectors are primarily responsible for the observed relationships.
- Environmental impact assessment: Undertake a comprehensive assessment of the environmental impact, including ecological and health consequences, resulting from the documented air pollution in Oman. Such an evaluation can guide policymakers in setting priorities for environmental enhancements.
- Comparative Studies: Conduct comparative analyses involving other Gulf region countries to discern regional disparities in the interplay between economic growth and environmental variables. This approach can uncover best practices and lessons that are applicable to Oman.
Author Contributions
Funding
Institutional Review Board Statement
Informed Consent Statement
Data Availability Statement
Conflicts of Interest
References
- Fiore, A.M.; Naik, V.; Leibensperger, E.M. Air Quality and Climate Connections. J. Air Waste Manag. Assoc. 2015, 65, 645–685. [Google Scholar] [CrossRef] [PubMed]
- Asif, M.; Sharma, R.B.; Adow, A.H. An Empirical Investigation of the Relationship between Economic Growth, Urbanization, Energy Consumption, and CO2 Emission in GCC Countries: A Panel Data Analysis. Asian Soc. Sci. 2015, 11, 270. [Google Scholar] [CrossRef]
- Odat, S.; Al-Jedaih, M.A. Regression Analysis of Air Pollution in Marka Area—Jordan. Basic Sci. Eng. 2011, 20, 53–65. [Google Scholar]
- Bekhet, H.A.; Matar, A.; Yasmin, T. CO2 emissions, energy consumption, economic growth, and financial development in GCC countries: Dynamic simultaneous equation models. Renew. Sustain. Energy Rev. 2017, 70, 117–132. [Google Scholar] [CrossRef]
- Samour, A.; Tawfik, O.I.; Radulescu, M.; Baldan, C.F. Do Oil Price, Renewable Energy, and Financial Development Matter for Environmental Quality in Oman? Novel Insights from Augmented ARDL Approach. Energies 2023, 16, 4574. [Google Scholar] [CrossRef]
- AlWaaili, A.; Malik, A. Energy and Capacity Saving Potential in the Residential Sector of Oman. Renew. Energy Power Qual. J. 2023, 21, 633–637. [Google Scholar] [CrossRef]
- AlAzri, A.; Alkaabi, S.; AlZakwani, S.; Altamimi, F.; AlMamari, M.; AlSulaimani, M. Oil Pipeline Leak Detection Using Deep Learning: A Review on POC Implementation. In Proceedings of the SPE Middle East Oil and Gas Show and Conference 2023, Manama, Bahrain, 19 February 2023. [Google Scholar] [CrossRef]
- Ninzo, T.; Mohammed, J.M.; Venkateswara, R.C. Enactment of NZEB by state of art techniques in sultanate of Oman. i-manager’s J. Future Eng. Technol. 2023, 18, 19163. [Google Scholar] [CrossRef]
- Hamid, I.; Alam, S.; Murshed, M.; Jena, P.K.; Sha, N.; Alam, M.N. The roles of foreign direct investments, economic growth, and capital investments in decarbonizing the economy of Oman. Environ. Sci. Pollut. Res. 2021, 29, 22122–22138. [Google Scholar] [CrossRef]
- Charabi, Y.; Al Nasiri, N.; Al Awadhi, T.; Choudri, B.; Al Bimani, A. GHG emissions from the transport sector in Oman: Trends and potential decarbonization pathways. Energy Strat. Rev. 2020, 32, 100548. [Google Scholar] [CrossRef]
- Choudri, B.S.; Al-Busaidi, A.; Ahmed, M. Climate change, vulnerability and adaptation experiences of farmers in Al-Suwayq Wilayat, Sultanate of Oman. Int. J. Clim. Chang. Strat. Manag. 2013, 5, 445–454. [Google Scholar] [CrossRef]
- Qazi, W.A.; Abushammala, M.F.M. The analysis of electricity production and greenhouse-gas emission reduction from municipal solid waste sector in Oman. Int. J. Environ. Sci. Technol. 2021, 18, 1395–1406. [Google Scholar] [CrossRef]
- Mannina, G.; Ekama, G.; Caniani, D.; Cosenza, A.; Esposito, G.; Gori, R.; Garrido-Baserba, M.; Rosso, D.; Olsson, G. Greenhouse gases from wastewater treatment—A review of modelling tools. Sci. Total. Environ. 2016, 551–552, 254–270. [Google Scholar] [CrossRef]
- Abdul-Wahab, S.A. Two case studies of air pollution from Oman and Kuwait. Int. J. Environ. Stud. 2009, 66, 179–191. [Google Scholar] [CrossRef]
- Bouhamra, W.; Abdul-Wahab, S. Description of outdoor air quality in a typical residential area in Kuwait. Environ. Pollut. 1999, 105, 221–229. [Google Scholar] [CrossRef]
- Abdul-Wahab, S.; Bouhamra, W.; Ettouney, H.; Sowerby, B.; Crittenden, B. Prediction of air pollution around heavily industrialised areas: Use of the industrial source complex short-term model with emissions from a large number of sources. Environ. Prot. Bull. 1999, 58, 3–13. [Google Scholar]
- Grossman, G.M.; Krueger, A.B. Economic growth and the environment. Q. J. Econ. 1995, 110, 353–377. [Google Scholar] [CrossRef]
- Wang, X.; Yan, L.; Zhao, X. Tackling the ecological footprint in China through energy consumption, economic growth, and CO2 emission: An ARDL approach. Qual. Quant. 2022, 56, 511–531. [Google Scholar] [CrossRef]
- Boukhelkhal, A. Energy use, economic growth and CO2 emissions in Africa: Do the environmental Kuznets curve hypothesis exist? New evidence from the heterogeneous panel under cross-sectional dependence. Environ. Dev. Sustain. 2022, 24, 13083–13110. [Google Scholar] [CrossRef]
- Abdel-Gadir, S. Energy Consumption, CO2 Emissions and Economic Growth Nexus in Oman: Evidence from ARDL Approach to Cointegration and Causality Analysis. Eur. J. Soc. Sci. 2020, 60, 67–78. [Google Scholar]
- Wang, P.; Wu, W.S.; Zhu, B.Z.; Wei, Y.M. Examining the impact factors of energy-related CO2 emissions using the STIRPAT model in Guangdong Province. China Appl. Energy 2013, 106, 65–71. [Google Scholar] [CrossRef]
- Elif, A.; Gul, I.T.; Serap, T.A. CO2 emissions of Turkish manufacturing industry: A decomposition analysis. Appl. Energy 2011, 88, 2273–2278. [Google Scholar]
- Adebanjo, S.A.; Shakiru, T.H. Dynamic relationship between air pollution and economic growth in Jordan: An empirical analysis. J. Environ. Sci. Econ. 2022, 1, 30–43. [Google Scholar] [CrossRef]
- Weimin, Z.; Sibt-e-Ali, M.; Tariq, M.; Dagar, V.; Khan, M.K. Globalization toward environmental sustainability and electricity consumption to environmental degradation: Does EKC inverted U-shaped hypothesis exist between squared economic growth and CO2 emissions in top globalized economies. Environ. Sci. Pollut. Res. 2022, 29, 59974–59984. [Google Scholar] [CrossRef]
- Heidari, H.; Katircioglu, S.T.; Seidpour, L. Economic growth, CO2 emissions and energy consumption in the five ASEAN countries. Int. J. Electr. Power Energy Syst. 2015, 64, 785–791. [Google Scholar] [CrossRef]
- Jaunky, V.C. The CO2 emissions–income nexus: Evidence from rich countries. Energy Policy 2010, 39, 1228–1240. [Google Scholar] [CrossRef]
- Manuel, A.Z.-M.; Mario, A.F. An Environmental Kuznets Curve for N2O emissions in Germany: An ARDL Approach. Nat. Resour. Forum 2017, 41, 119–127. [Google Scholar]
- Wang, L.; Wang, H.; Dong, Z.; Wang, S.; Cao, Z. The air pollution effect of government economic growth expectations: Evidence from China’s cities based on green technology. Environ. Sci. Pollut. Res. 2021, 28, 27639–27654. [Google Scholar] [CrossRef]
- Li, J.; Hou, L.; Wang, L.; Tang, L. Decoupling Analysis between Economic Growth and Air Pollution in Key Regions of Air Pollution Control in China. Sustainability 2021, 13, 6600. [Google Scholar] [CrossRef]
- Dong, D.; Xu, B.; Shen, N.; He, Q. The Adverse Impact of Air Pollution on China’s Economic Growth. Sustainability 2021, 13, 9056. [Google Scholar] [CrossRef]
- Fotourehchi, Z.; Ebrahimpour, H. Happiness, economic growth and air pollution: An empirical investigation. Int. J. Happiness Dev. 2019, 5, 1–13. [Google Scholar] [CrossRef]
- Abbass, R.A.; Kumar, P.; El-Gendy, A. An overview of monitoring and reduction strategies for health and climate change related emissions in the Middle East and North Africa region. Atmos. Environ. 2018, 175, 33–43. [Google Scholar] [CrossRef]
- Al-Rawashdeh, R.; Jaradat, A.Q.; Al-Shboul, M. Air Pollution and Economic Growth in MENA Countries: Testing EKC Hypothesis. Environ. Res. Eng. Manag. 2015, 70, 54–65. [Google Scholar] [CrossRef]
- Yiew, T.-H.; Lee, C.-Y.; Lau, L.-S. Economic growth in selected G20 countries: How do different pollution emissions matter? Environ. Dev. Sustain. 2021, 23, 11451–11474. [Google Scholar] [CrossRef]
- Aljawareen, A.; Saddam, A. The Impact of GDP, FDI, and Import on Carbon Dioxide Emissions in of GCC Countries: A Panel Data Approach. Eur. Sci. J. 2017, 7881, 31–56. [Google Scholar]
- Aristotelous, K. A Re-examination of the Empirical Relationship between Economic Growth and Air Pollution. Int. J. Ecol. Dev. 2017, 32, 1–6. [Google Scholar]
- Cole, M.A. Trade Liberalization, Economic Growth and the Environment; University of Birmingham: Birmingham, UK, 2000. [Google Scholar]
- Khoshnevis Yazdi, S.; Khanalizadeh, B. Air pollution, economic growth and health care expenditure. Econ. Res.-Ekon. Istraživanja 2017, 30, 1181–1190. [Google Scholar] [CrossRef]
- Sallis, P. (Ed.) Air Quality—Measurement and Modeling; InTech: London, UK, 2016. [Google Scholar] [CrossRef]
- Zhanhong, Y.; Hong, L.; Xiao, W. Study on the Relationship between Air Pollution and Economic Development. Sci. Discov. 2018, 6, 12–18. [Google Scholar] [CrossRef]
- Deng, H.; Mendelsohn, R. The effect of urbanization on air pollution damage. J. Assoc. Environ. Resour. Econ. 2021, 8, 955–973. [Google Scholar] [CrossRef]
- Wang, S.; Gao, S.; Li, S.; Feng, K. Strategizing the relation between urbanization and air pollution: Empirical evidence from global countries. J. Clean. Prod. 2020, 243, 118615. [Google Scholar] [CrossRef]
- Liang, Z.; Wei, F.; Wang, Y.; Huang, J.; Jiang, H.; Sun, F.; Li, S. The Context-Dependent Effect of Urban Form on Air Pollution: A Panel Data Analysis. Remote Sens. 2020, 12, 1793. [Google Scholar] [CrossRef]
- Liu, H.; Ma, W.; Qian, J.; Cai, J.; Ye, X.; Li, J.; Wang, X. Effect of urbanization on the urban meteorology and air pollution in Hangzhou. J. Meteorol. Res. 2015, 29, 950–965. [Google Scholar] [CrossRef]
- Argun, Y.A.; Tırınk, S.; Bayram, T. Effect of Urban Factors on Air Pollution of Igdir. Black Sea J. Eng. Sci. 2019, 2, 123–130. [Google Scholar] [CrossRef]
- Charabi, Y.; Al-Yahyai, S. Integral assessment of air pollution dispersion regimes in the main industrialized and urban areas in Oman. Arab. J. Geosci. 2011, 4, 625–634. [Google Scholar] [CrossRef]
- Shi, G.; Lu, X.; Zhang, H.; Zheng, H.; Zhang, Z.; Chen, S.; Xing, J.; Wang, S. Air pollutant emissions induced by rural-to-urban migration during China’s urbanization (2005–2015). Env. Sci. Ecotechnol. 2022, 10, 100166. [Google Scholar] [CrossRef]
- Li, S.; Yu, Y.; Jahanger, A.; Usman, M.; Ning, Y. The Impact of Green Investment, Technological Innovation, and Globalization on CO2 Emissions: Evidence From MINT Countries. Front. Environ. Sci. 2022, 10, 156. [Google Scholar] [CrossRef]
- Li, X.; Lu, Z.; Hou, Y.; Zhao, G.; Zhang, L. The coupling coordination degree between urbanization and air environment in the Beijing (Jing)-Tianjin (Jin)-Hebei (Ji) urban agglomeration. Ecol. Ind. 2022, 137, 108787. [Google Scholar] [CrossRef]
- Zhang, X.; Han, L.; Wei, H.; Tan, X.; Zhou, W.; Li, W.; Qian, Y. Linking urbanization and air quality together: A review and a perspective on the future sustainable urban development. J. Clean. Prod. 2022, 346, 130988. [Google Scholar] [CrossRef]
- Zambrano-Monserrate, M.A.; Carvahal-Lara, C.; Urgiles-Sanchezi, R. Is there an inverted u-shaped curve? Empirical analysis of environmental Kuznets curve in Singapore. Asia-Pac. J. Acc. Econ. 2018, 1, 145–168. [Google Scholar]
- Nasreen, S.; Anwar, S.; Ozturk, I. Financial stability, energy consumption and environmental quality: Evidence from South Asian economies. Renew. Sustain. Energy Rev. 2017, 67, 1105–1122. [Google Scholar] [CrossRef]
- Rahman, M.M. Do population density, economic growth, energy use, and exports adversely affect environmental quality in Asian populous countries? Renew. Sustain. Energy Rev. 2017, 77, 506–514. [Google Scholar] [CrossRef]
- Alam, M.M.; Murad, M.W.; Noman, A.H.; Ozturk, I. Relationships among carbon emissions, economic growth, energy consumption and population growth: Testing Environmental Kuznets Curve hypothesis for Brazil, China, India and Indonesia. Ecol. Indic. 2016, 70, 466–479. [Google Scholar] [CrossRef]
- Karakaş, A. Yaklaşan Tehlikenin Farkına Varmak: İktisadi Buyume, Nufus ve Cevre Kirliliği İlişkisi. J. Selcuk Unıv. Soc. Sci. Vocat. Sch. 2016, 19, 57–73. [Google Scholar]
- Bozkurt, S.; Savrun, A.; Okumus, M.; Bilal, Ö.; Baykan, H.; Kalender, A.M. Evaluation of patients applying to the emergency service with complaint of isolated hand injuries. Eurasian J. Emerg. Med. 2015, 14, 54. [Google Scholar] [CrossRef]
- Ohlan, R. The impact of population density, energy consumption, economic growth, and trade openness of CO2 emissions in India. Nat. Hazards 2015, 79, 1409–1428. [Google Scholar] [CrossRef]
- Onofowora, O.A.; Owoye, O. Bounds testing approach to the analysis of the environment Kuznet curve hypothesis. Energy Econ. 2014, 44, 47–62. [Google Scholar] [CrossRef]
- Xie, J.Y.; Suh, D.H.; Joo, S.-K. A Dynamic Analysis of Air Pollution: Implications of Economic Growth and Renewable Energy Consumption. Int. J. Environ. Res. Public Health 2021, 18, 9906. [Google Scholar] [CrossRef] [PubMed]
- Ai, H.; Tan, X. A Literature Review of the Effects of Energy on Pollution and Health. Energy Res. Lett. 2021, 2, 28135. [Google Scholar] [CrossRef]
- Li, L.; Hong, X.; Wang, J. Evaluating the impact of clean energy consumption and factor allocation on China’s air pollution: A spatial econometric approach. Energy 2019, 195, 116842. [Google Scholar] [CrossRef]
- Shen, N.; Wang, Y.; Peng, H.; Hou, Z. Renewable Energy Green Innovation, Fossil Energy Consumption, and Air Pollution—Spatial Empirical Analysis Based on China. Sustainability 2020, 12, 6397. [Google Scholar] [CrossRef]
- Wang, Q.; Kwan, M.-P.; Zhou, K.; Fan, J.; Wang, Y.; Zhan, D. Impacts of residential energy consumption on the health burden of household air pollution: Evidence from 135 countries. Energy Policy 2019, 128, 284–295. [Google Scholar] [CrossRef]
- Alvarez-Herranz, A.; Balsalobre-Lorente, D.; Shahbaz, M.; Cantos, J.M. Energy in-novation and renewable energy consumption in the correction of air pollution levels. Energy Policy 2017, 105, 386–397. [Google Scholar] [CrossRef]
- Available online: https://databank.worldbank.org/source/world-development-indicators (accessed on 19 October 2023).
- Biswas, M.R.; Alzubaidi, M.S.; Shah, U.; Abd-Alrazaq, A.A.; Shah, Z. A Scoping Review to Find out Worldwide COVID-19 Vaccine Hesitancy and Its Underlying Determinants. Vaccines 2021, 9, 1243. [Google Scholar] [CrossRef] [PubMed]
- Onofrei, M.; Vatamanu, A.F.; Cigu, E. The Relationship Between Economic Growth and CO2 Emissions in EU Countries: A Cointegration Analysis. Front. Environ. Sci. 2022, 10, 934885. [Google Scholar] [CrossRef]
- Mohamed, E.S.E. Economic Growth, CH4 and N2O Emissions in Sudan: Where Should the Policy Focus Be? J. Geosci. Environ. Prot. 2020, 8, 202–229. [Google Scholar] [CrossRef]
- MacKinnon, J.G.; Haug, A.A.; Michelis, L. Numerical Distribution Functions of Likelihood Ratio Tests for Cointegration. J. Appl. Econom. 1999, 14, 563–577. [Google Scholar] [CrossRef]


| Variable | Definition | Codes of Variable | Source |
|---|---|---|---|
| Dependent variable | Real GDP at constant 2011 national prices (Converted to the equivelant USD million, 2011) | RGDPc | PWT 10.0 * |
| Independent variables | CO2 emissions (metric tons per capita) Nitrous oxide emissions (thousand metric tons of CO2 equivalents) | CO2 N2O | WDI, 2022 ** WDI, 2022 |
| Control variables | Urban population (% of the total population) | URB | WDI, 2022 |
| Energy use (kg of oil equivalents per capita) | ENGU | WDI, 2022 |
| Variables | Mean | Median | Max. | Min. | Std. Dev. | CV |
|---|---|---|---|---|---|---|
| Ln RGDPC | 18,747.86 | 19,189.55 | 21,458.39 | 14,792.32 | 1740.012 | 9.281123286 |
| Ln CO2 | 12.5148 | 13.0604 | 17.30974 | 6.566793 | 3.623088 | 28.95042669 |
| Ln N2O | 703.4375 | 655 | 1090 | 340 | 265.1671 | 37.69590049 |
| Ln URP | 75.26406 | 72.6835 | 87.044 | 66.102 | 5.698879 | 7.571846377 |
| Ln ENGU | 126.1235 | 122.4913 | 181.8656 | 76.75578 | 39.29334 | 31.15465397 |
| Variables | RGDPC | CO2 | N2O | URBN | ENGU |
|---|---|---|---|---|---|
| Ln RGDPC | 1 | ||||
| Ln CO2 | 0.241857 | 1 | |||
| Ln N2O | −0.096951 | 0.915519 | 1 | ||
| Ln URP | −0.316633 | 0.762638 | 0.94191 | 1 | |
| Ln ENGU | 0.056571 | 0.893628 | 0.89911 | 0.747322 | 1 |
| Variable | Coefficient | Std. Error | t-Statistic | Pro. |
|---|---|---|---|---|
| Ln CO2 | 1164.263 | 145.1280 | 8.022319 | 0.0000 |
| Ln N2O | −21.55100 | 1.961402 | −10.98754 | 0.0000 |
| Ln URP | 236.2125 | 11.94890 | 19.76856 | 0.0000 |
| Ln ENGU | 12.30533 | 12.52318 | 0.982604 | 0.3342 |
| R-squared | 0.632001 | Mean dependent var. | 18,747.86 | |
| Adjusted R-squared | 0.592572 | S.D. dependent var. | 1740.012 | |
| S.E. of regression | 1110.651 | Akaike info criterion | 16.97975 | |
| Sum squared resid. | 34,539,276 | Schwarz criterion | 17.16297 | |
| Log likelihood | −267.6760 | Hannan–Quinn criter. | 17.04048 | |
| Durbin–Watson stat. | 0.868178 |
| Variable | Coefficient | Std. Error | t-Statistic | Pro. |
|---|---|---|---|---|
| Ln RGDPC | 0.149294 | 0.020395 | 7.320290 | 0.0000 |
| Ln (RGDPcit)2 | −3.81 × 10⁻⁶ | 6.92 × 10⁻⁷ | 5.511561 | 0.0000 |
| Ln CO2 | 27.15082 | 5.716932 | 4.749195 | 0.0001 |
| Ln URP | 21.56324 | 2.447204 | 8.811379 | 0.0000 |
| Ln ENGU | 1.490693 | 0.361947 | 4.118538 | 0.0003 |
| R-squared | 0.986968 | Mean dependent var | 703.4375 | |
| Durbin Watson (D.W). | 0.875121 | Akaike info criterion | 9.939011 | |
| S.E. of regression | 32.43592 | Schwarz criterion | 10.16803 | |
| Sum squared resid. | 28,406.40 | Hannan–Quinn criter. | 10.01492 | |
| Log likelihood | −154.0242 |
| Variables | Level Critical Values | First Difference Critical Values | ||||||||
|---|---|---|---|---|---|---|---|---|---|---|
| 1% | 5% | 10% | t-Values | p-Values | 1% | 5% | 10% | t-Values | p-Values | |
| Ln CO2 | −3.662 | −2.96 | −2.612 | −2.6192 | 0.4791 | −3.670 | −2.964 | −2.621 | −4.88688 | 0.0004 * |
| Ln N2O | −3.6617 | −2.960 | −2.6192 | 0.013780 | 0.9529 | −3.6702 | −2.9640 | −2.612 | −4.445660 | 0.0014 * |
| Ln RGDPc | −3.6702 | −2.9640 | −2.621 | −0.902244 | 0.7735 | −3.6892 | −2.9719 | −2.6251 | −6.875273 | 0.0000 ** |
| Ln URP | −3.6892 | −2.9719 | −2.6251 | 2.556510 | 1.0000 | −3.6892 | −2.972 | −2.6251 | −3.048164 | 0.0421 ** |
| Ln ENRU | −3.6892 | −2.9719 | −2.6251 | −0.822161 | 0.7972 | −3.679 | −2.9678 | −2.6229 | −5.727279 | 0.0001 * |
| Lag | LogL | LR | FPE | AIC | SC | HQ |
|---|---|---|---|---|---|---|
| 0 | 23.02299 | NA | 6.60 × 10⁻⁵ | −1.112388 | −0.980428 | −1.066331 |
| 1 | 124.4002 | 180.2262 | 3.91 × 10⁻⁷ | −6.244458 | 5.716618 * | −6.060227 |
| 2 | 128.8578 | 7.181681 | 5.09 × 10⁻⁷ | −5.992102 | −5.068382 | −5.669699 |
| 3 | 145.3521 | 23.82506 * | 3.46 × 10⁻⁷ * | 6.408450 * | −5.088851 | −5.947875 * |
| Hypothesized No. of CE(s) | Eigenvalue | Trace Statistic | 0.05 Critical Value | Prob. ** |
|---|---|---|---|---|
| None * | 0.657911 | 84.88720 | 69.81889 | 0.0020 |
| At most 1 * | 0.512398 | 52.70670 | 47.85613 | 0.0163 |
| At most 2 * | 0.409125 | 31.15902 | 29.79707 | 0.0346 |
| At most 3 | 0.255103 | 15.37452 | 15.49471 | 0.0521 |
| At most 4 * | 0.195855 | 6.539257 | 3.841466 | 0.0105 |
| Error Correction: | D (N2O) | D (CO2) | D (RGDPC) | D (RGDPcit)2 | D (URP) | D (ENGU) |
|---|---|---|---|---|---|---|
| CointEq1 | −0.149294 | −0.008377 | −5.620052 | −215635.7 | 0.001124 | 0.096518 |
| (0.020395) | (0.00216) | (2.11362) | (82262.9) | (0.00092) | (0.06386) | |
| [−7.320290] | [−3.88557] | [−2.65897] | [−2.62130] | [1.21631] | [1.51144] |
| Variables | F-Stat. | p-Value | Causality |
|---|---|---|---|
| RGDPc → N2O | 4.647 | 0.0192 | Yes |
| N2O → RGDPc | 3.099 | 0.0628 | No |
| ENGU → CO2 | 16.149 | 0.000 | Yes |
| CO2 → ENGU | 11.583 | 0.0003 | Yes |
| URP → RGDPc | 4.281 | 0.0252 | Yes |
| RGDPc → URP | 4.363 | 0.0237 | Yes |
| URP → CO2 | 0.82434 | 0.4501 | No |
| CO2 → URP | 5.92209 | 0.0078 | Yes |
Disclaimer/Publisher’s Note: The statements, opinions and data contained in all publications are solely those of the individual author(s) and contributor(s) and not of MDPI and/or the editor(s). MDPI and/or the editor(s) disclaim responsibility for any injury to people or property resulting from any ideas, methods, instructions or products referred to in the content. |
© 2023 by the authors. Licensee MDPI, Basel, Switzerland. This article is an open access article distributed under the terms and conditions of the Creative Commons Attribution (CC BY) license (https://creativecommons.org/licenses/by/4.0/).
Share and Cite
Mohammed, M.; Abdel-Gadir, S. Unveiling the Environmental–Economic Nexus: Cointegration and Causality Analysis of Air Pollution and Growth in Oman. Sustainability 2023, 15, 16918. https://doi.org/10.3390/su152416918
Mohammed M, Abdel-Gadir S. Unveiling the Environmental–Economic Nexus: Cointegration and Causality Analysis of Air Pollution and Growth in Oman. Sustainability. 2023; 15(24):16918. https://doi.org/10.3390/su152416918
Chicago/Turabian StyleMohammed, Mwahib, and Sufian Abdel-Gadir. 2023. "Unveiling the Environmental–Economic Nexus: Cointegration and Causality Analysis of Air Pollution and Growth in Oman" Sustainability 15, no. 24: 16918. https://doi.org/10.3390/su152416918