1. Introduction
Environmental deterioration is a great challenge facing the whole world at present, and the key to solving this problem lies in how the government formulates and implements reasonable and effective environmental policies and means of governance. The central environmental inspection system is a unique environmental governance method, infused with Chinese characteristics and characterized by a campaign-style approach. It involves the central government’s directly affiliated environmental inspection teams conducting short-term environmental inspections on pollution issues across diverse regions of China. As the largest developing country in the world, for a long time, China’s economic development policy has been guided by the pursuit of high-speed growth. The realization of this economic growth rate relies on an extensive economic development model with high pollution, high energy consumption, and high emissions. This traditional development model has freed China from the trap of the poverty cycle and laid the foundation for its economic take-off, but it has also inevitably caused environmental pollution [
1,
2,
3,
4].
At present, China has the largest energy system in the world, in which fossil energy consumption occupies a dominant position, and has surpassed the United States to become the largest greenhouse gas emitter in the world [
5,
6]. The traditional concept of economic development and the path of long-term dependence on development has led to the subordination of environmental policies to economic growth goals, which has hindered the transformation of the existing green economic growth model and the achievement of pollution reduction targets. With the depletion of resources and the deterioration of natural ecology, it is an inevitable choice for China to seek a sustainable green economic development model under the background of global climate change. China has formulated a series of environmental policies aimed towards shifting the goal of economic growth from high-speed growth to the pursuit of higher quality development; it also made carbon reduction commitments to achieving “Peak carbon by 2030” and “Carbon neutrality by 2060”, and issued a series of related work plans and green transformation plans, providing a direction for comprehensively promoting the transition of China’s economy to a sustainable model.
Current research has shown that long-term economic growth is driven by increases in factor input and factor productivity, and that total factor productivity improvement is an important measure of economic quality [
7,
8,
9]. In the context of global climate change and energy and environmental constraints, the green total factor productivity derived from the inclusion of pollutant emissions and energy elements in the TFP growth-accounting framework can more accurately estimate whether this economic development approach meets the dual requirements of energy saving and emission reduction alongside economic growth [
10]. In related studies, green total factor productivity levels are often used to reflect the harmony between green productivity growth, sustainable economic growth and environmental protection, and economic development [
11,
12]. In this paper, green total factor productivity is regarded as the core index for measuring the development of green economy.
There are differing opinions in the literature on the role of environmental regulation in promoting a green economy. Hao et al. [
13] believes that proper environmental regulation can achieve a win-win situation of economic prosperity and ecological improvement. Zhuo et al. [
14] believes that cross-regional environmental protection mechanisms can enhance GTFP, reduce energy intensity, and reduce carbon emissions while promoting urban innovation and industrial upgrading. Fan et al. [
15] examined the role of environmental regulation in promoting green total factor productivity from a spatial correlation perspective, arguing that environmental regulation can indirectly promote total factor productivity growth by promoting green technology; however, there is spatial heterogeneity. The promotion in the eastern and central regions of China is significant, while the role of the western region is not significant. Some scholars argue that environmental regulations are not conducive to the development of a green economy. One study from Yuan and Xiang [
16], based on a study of China’s manufacturing sector, argues that in the short term, environmental regulations promote labor productivity and energy efficiency, among other things; but in the long run, green total factor productivity aside, environmental regulations will only improve energy efficiency and hinder productivity growth. Tian and Feng [
17] studied the effects of different types of environmental regulations on GTFP and concluded that different types of environmental regulations have different internal structural effects: environmental regulation of the command and control type can promote GTFP by guiding technological innovation and optimizing the industrial structure; however, market-based environmental regulation has a negative impact on GTFP by inhibiting technological innovation, reducing the efficiency of the industrial structure and resource allocation. Li et al. [
18] studied market-based environmental regulations and found that carbon trading in China promotes carbon emission reduction, but has no significant impact on industrial output; however, it has no significant effect on the improvement of GTFP.
Technological progress is key to saving energy and reducing emissions and the realization of a green and sustainable economic development model [
19,
20,
21], and it is also an important way to promote the transformation of economic growth models [
22,
23,
24]. The most important path to take for China’s environmental protection and sustainable economic development is to adopt environmental regulation policies that can promote the progress of green technology, to achieve the dual objectives of energy saving and emission reduction and green economic transformation [
25,
26,
27].
Moreover, the assumption that the substitution elasticity between labor and capital is one and that technological progress is neutral is not applicable to the present research. Hicks [
28] put forward the concept of biased technological progress, and considered that technological progress is more conducive to the improvement of the marginal output of a certain factor, resulting in the deflection of the tangent line of the isoquant curve, that is, technological progress towards the direction of this element or a bias towards this element. Kang et al. [
29] recognizes that new technologies may favor energy conservation, pollution reduction, and economic output, and that promoting green technological progress is key to improving the quality of economic development. According to Liu et al. [
30], the technological progress of China’s manufacturing industry is biased, and environmental regulation has a significant threshold effect on technological progress. Meng et al. [
31] argue that environmental regulation and environmentally friendly technological progress have important implications for reducing air pollution and green economic development in China, and that environmental regulation can strengthen technological progress in favor of environmental development. Zhou et al. [
32] analyzed the impact of different types of environmental regulations on technological progress biases, and concluded that government-regulated environmental regulations promote technological progress in energy conservation and emission reduction, and market-based environmental regulations promote technological progress in energy conservation, but that informal environmental regulation can only accelerate the technical progress of environmental protection. Sun et al. [
33] argue that the green output preference of technological progress is the key factor driving the green transition of mariculture in China, and that environmental regulation has a U-shaped relationship with green output preferences. Some scholars think that the effect of environmental regulation on technological progress biases is not clear. For example, Song et al. [
34] think that weak environmental regulations have no significant effect on the technological progress of environmental biases.
Faced with the current environmental pollution, many countries have enacted relevant environmental protection laws to protect people’s environmental rights and reverse the status quo of pollution [
35,
36]. The development of China’s environmental governance system has formed a governance framework based on government regulatory tools, guided by market-oriented tools, and supplemented by information disclosure tools [
37,
38]. Among them, the central environmental inspection system, as a government regulatory environmental regulation policy, is the most official and strongest regulatory policy among all environmental regulation tools in China. Analyzing the changes in China’s green total factor productivity before and after these environmental inspections can effectively promote China’s economic transformation process. For green total factor productivity, technological progress is the driving force behind its growth. Therefore, finding out whether the central environmental protection inspection policy can effectively promote green technological progress and reduce biased technological progress is also the main objective of this paper.
2. Policy Background and Research Hypothesis
Addressing the challenge of formulating environmental policies that simultaneously promote economic development and safeguard the environment, in accordance with national circumstances, is an imminent and intricate matter in need of urgent resolution. As the world’s largest developing country, China’s environmental protection system has developed into a governance strategy based on government-regulated policy instruments, complemented by market- and public-participatory environmental regulations [
39]. However, the government-regulated, i.e., “command and control”-oriented environmental regulation strategy is highly susceptible to problems such as competition among local governments, economic pressure, collusion between the government and enterprises, falsification of pollution data, or formalized governance [
40,
41,
42]. The emergence of these problems has seriously weakened the corrective effect of environmental regulatory policies on environmental externalities.
In order to address the impact of these issues on environmental regulation, the Chinese government has issued a new environmental protection law, which has been described by many media reports as the strictest in history [
43]. Moreover, in order to supervise the implementation of this new environmental protection law by local governments, the central government initiated the Central Environmental Protection Supervision scheme in 2016 to “supervise” the effectiveness of local governments’ environmental governance in a “campaign-style” manner; and, in 2019, the central government promulgated provisions amongst the work of the Central Ecological Environmental Protection Inspectorate, which explicitly stated in the form of internal regulations of the Communist Party of China (CPC) that environmental protection inspections would be carried out on a regular basis once every five years. Since then, China’s environmental regulatory system has entered a phase of dual constraints between government-controlled policies and environmental protection inspections.
Unlike traditional environmental regulatory measures, the central environmental inspection policy takes into account various levels and aspects of environmental regulation, which not only has the authority of the state but also ensures the political and social interaction of public participation. The central environmental protection inspection policy is no longer based on a hierarchical government, but rather on empowering environmental protection regulatory agencies with higher supervision rights and the authority represented by the central government, horizontally integrating environmental protection regulatory agencies, and constructing a more targeted supervision system. Through “party and government shared responsibility” and public supervision, the centralized governance model is regularly under the direct management of the central government [
44,
45]. From the preparation of inspectors, the presence of inspection teams, and the reporting of inspection sites to the feedback of inspection teams, the handing over of inspection issues, and the rectification of inspection issues, the process of the central environmental protection inspectors (inspecting each province under inspection before and after a total of about one month) includes listening to the environmental work reports of the inspected provinces, consulting the information on the local environmental work, visiting and inquiring, accepting reports, and environmental spot checks. After the completion of this inspection, the province under supervision shall submit their environmental rectification plan to the central committee and State Council within 30 days and complete the rectification requirements within half a year. At the same time, the contents of their rectification plan shall be disclosed to the public. In addition, the Central Ministry of Ecology and Environmental Protection has set up special channels for environmental reporting, including telephone and email accounts, to expand the “government–society communication” model for environmental issues; this allows the central government to co-ordinate the planning and inspection of environmental protection at all levels of local governments, to a certain extent avoiding the problem of information asymmetry, and reducing the possibility of local governments hiding or falsely reporting environmental problems. In addition, the central environmental inspection scheme and inspection team has adopted a “looking back” approach to ensure that this innovative environmental regulation system adheres to its original problem-oriented design. “Looking back” means that the central environmental inspection team will focus on monitoring the effectiveness of the plans for the rectification of environmental inspections at all levels of government, which have been vetted by the central committee and the State Council, to supervise the environmental protection results of the provinces inspected [
46]. This kind of “looking back” system designed to elevate environmental protection into becoming a political mission has enhanced the authority and public participation of environmental inspectors; it also promotes political–social interactions and the sustainable governance of environmental regulation, and promotes the effectiveness of environmental regulation.
The implementation of central environmental supervision represents a strategic adjustment of environmental policies from the perspective of the Chinese government’s environmental regulation, from the traditional “supervision of enterprises” to the present “supervision of enterprises” and “supervision of government”. However, as a newly implemented environmental regulation policy, this policy’s ability to balance environmental governance and green total factor productivity is an important theoretical underpinning for China’s strategy of normalizing the implementation of central environmental inspections.
At present, existing studies on central environmental inspection are mainly from the perspective of the policy’s effect on corporate environmental governance and air pollution control, and whether it can promote the development of green economy. Wang et al. [
47] discovered through their analysis of enterprise-level pollution data in China from 2011 to 2018 that since the implementation of the central environmental inspection policy, the number of polluting enterprises has decreased by 48%, and emissions have significantly reduced. Research by Feng et.al [
48] shows that environmental inspections have greatly improved air quality, but that their subsequent impact is waning. Similarly, Zhao Zhang and Wang’s [
49] research shows that such campaign-style treatment is effective in reducing pollution, but that its impact on pollutant emissions is only temporary. On the contrary, Jia and Chen [
50] believe that the central environmental inspection system can play a positive role in improving environmental performance, and that this role of improvement does not disappear after the inspection. According to Cheng and Yu [
51], the central environmental watchdog scheme has greatly promoted green technology innovation in pollution-intensive industries and improved fossil energy efficiency, but rather than driving green innovation to reduce pollutants, it is crowding out other technological innovations. Kopyrina, Wu, and Ying’s [
52] study demonstrated that this policy can have has a long-term positive effect on corporate green innovation in the form of green patents. He and Geng [
53] argue that not all areas inspected have seen a significant reduction in their air quality index since the implementation of the central environmental inspection policy, and that individual areas and individual pollutants have not. Pan, Yu, Hong, and Chen [
43] believe that the central environmental inspection policy can significantly improve green economic growth and that this effect is sustainable.
Based on the analysis of the aforementioned policy background, this article proposes the following hypotheses.
① The impact of the central environmental inspection policy on green total factor productivity:
The central environmental inspection policy can provide strong supervision of enterprises and industries to change their environmental decision-making and incorporate environmental management into their corresponding production and operation processes. During the implementation of this policy, production and business operators in the region received policy notices, changed their environmental strategies, increased their environmental investment quotas, actively developed and introduced green production technologies, and proactively turned to green production. The post-inspection responsibility system adopted by the central environmental inspection policy can hold government officials accountable for their dereliction of duty in supervising local industry production and environmental governance. This system has stimulated local officials to actively respond to their region’s economic green transformation and improved the implementation effect of this environmental protection system. Therefore, this article proposes the following hypothesis:
Hypothesis 1. The central environmental protection inspection policy can significantly improve the productivity of green total factor production.
② The impact of the central environmental inspection policy on the progress of green technology:
The central environmental inspection system, with the strong authoritative attribute of the central government, endows the environmental inspection agencies with authority and effectiveness, directly promoting the strong implementation of environmental regulation. Therefore, it is recognized as a “campaign-style governance model”. Through the official responsibility system, the long-standing phenomenon of “collusion between the government and enterprises” in local areas is resolved, promoting polluting enterprises to break away from their original production model, enabling the corresponding industries to upgrade their model, and increasing the introduction and adoption of environmental protection technologies in production processes. At the same time, for enterprises in the inspected areas with green research and development attributes, their financing and research and development investment will receive more attention and support, accelerating the commercialization of corresponding green technologies. By avoiding the “formalization” of environmental problems, the sustainable development process of the regional economy is promoted. Therefore, this article proposes the following hypothesis: by avoiding the “formalization” of environmental problems, the sustainable development process of the regional economy is promoted.
Hypothesis 2. The central environmental protection inspection policy can significantly improve the level of green technological progress.
③ The impact of central environmental inspections on biased technological advancements:
Compared to neutral technological progress, biased technological progress refers to the marginal output improvement of a specific production factor. Under the guidance of environmental regulations, technological progress is no longer simply a matter of improving technical levels, but has a certain bias. During the process of technological research and development, companies will control the pollution generated by their technology, minimize environmental costs, and gradually shift technological progress towards green development. However, unlike other environmental regulatory policies, the central environmental protection inspection system, as a new type of environmental policy with Chinese characteristics, has the short-term governance characteristics of “authoritative attributes” and “campaign-style governance”. This forces companies to deal with pollution output from the production end, increase their investment in pollution control, and change their current pollution situation. However, fundamentally reversing the biased technological progress of corporate production requires improving the production nature of companies from the source, adopting green production models, introducing green production equipment, and making production factors more inclined towards economic output while reducing pollution output. Therefore, guiding biased technological progress is difficult to implement in the short term and requires fundamentally transforming the production mode of companies from “polluting” to “green” production. Therefore, this article proposes the following hypothesis:
Hypothesis 3. The central environmental protection inspection policy cannot significantly improve the level of biased technological progress.
The aforementioned findings indicate the existence of certain controversies surrounding the effectiveness of existing research on the implementation of the central environmental inspection, particularly regarding the impact on green total factor productivity. Additionally, there appears to be a scarcity of studies focusing on the decomposition of the impact pathway of green total factor productivity. The implementation of central environmental inspection will exert pressure on local governments and polluting enterprises in the provinces being inspected, and will be sudden and random. Most of the cases accepted by the central environmental inspection group come from public reports and other means. The inspection projects also have a certain suddenness and confidentiality. Local governments do not make “response” plans for the inspection projects in advance, therefore, the central environmental inspection conforms to the idea of a quasi-natural experiment. This paper uses a regression discontinuity design to analyze the impact of the innovative environmental regulation policy of central environmental protection inspections on green total factor productivity, and decompose the green total factor productivity index into technical efficiency and technological progress, and will continue to deconstruct the technical progress index into a scale of technical progress and biased technical progress. Our aim is to analyze in detail the impact of “campaign-style” environmental regulations on green total factor productivity and provide recommendations for China’s transition towards a green economy and achieving pollution reduction targets.
3. Methods and Data
3.1. The Measurement and Decomposition of the Green Total Factor Productivity
Stochastic frontier approaches (SFAs) and data envelopment analyses (DEAs) are the main methods used to measure total factor productivity in academic circles; this can avoid the structural deviation caused by the misunderstanding of production function, such as occurs in the traditional accounting method and SFA method [
54,
55,
56]. In view of this, the traditional DEA model cannot solve the problem of relaxation variable, and when the efficiency of efficient decision-making units is 1, the units cannot be distinguished well. Therefore, this paper adopts the Tone and Tsutsui (2010) SBM model, which considers the relationship between the input, output, and adverse pollution output, and which can solve the problem of slack in efficiency evaluation.
In this study, we construct a non-radial and non-oriented relaxation-based directional distance function [
57], combining the work of Fare [
58] to calculate the Malmquist index, and then decomposing the Malmquist index according to Fare [
59]. It is decomposed into changes towards green technology and green efficiency, and further decomposed into the magnitude of technological changes and the biased technological change index. In this study, we regard the Chinese city as a production decision unit (DMU) to construct the optimal production technology boundary. Assuming that each city uses
inputs to obtain
expected outputs and
unexpected outputs, the production process can be expressed as:
where
,
, and
respectively represent the factor input, economic output, and unexpected output of
k-city in
t-period;
,
, and
indicate the direction vector of the input of production factors, the increase in economic output, and the decrease in undesired output, respectively; and
,
, and
respectively represent the relaxation vectors for the input of production factors, the economic output, and the unexpected output.
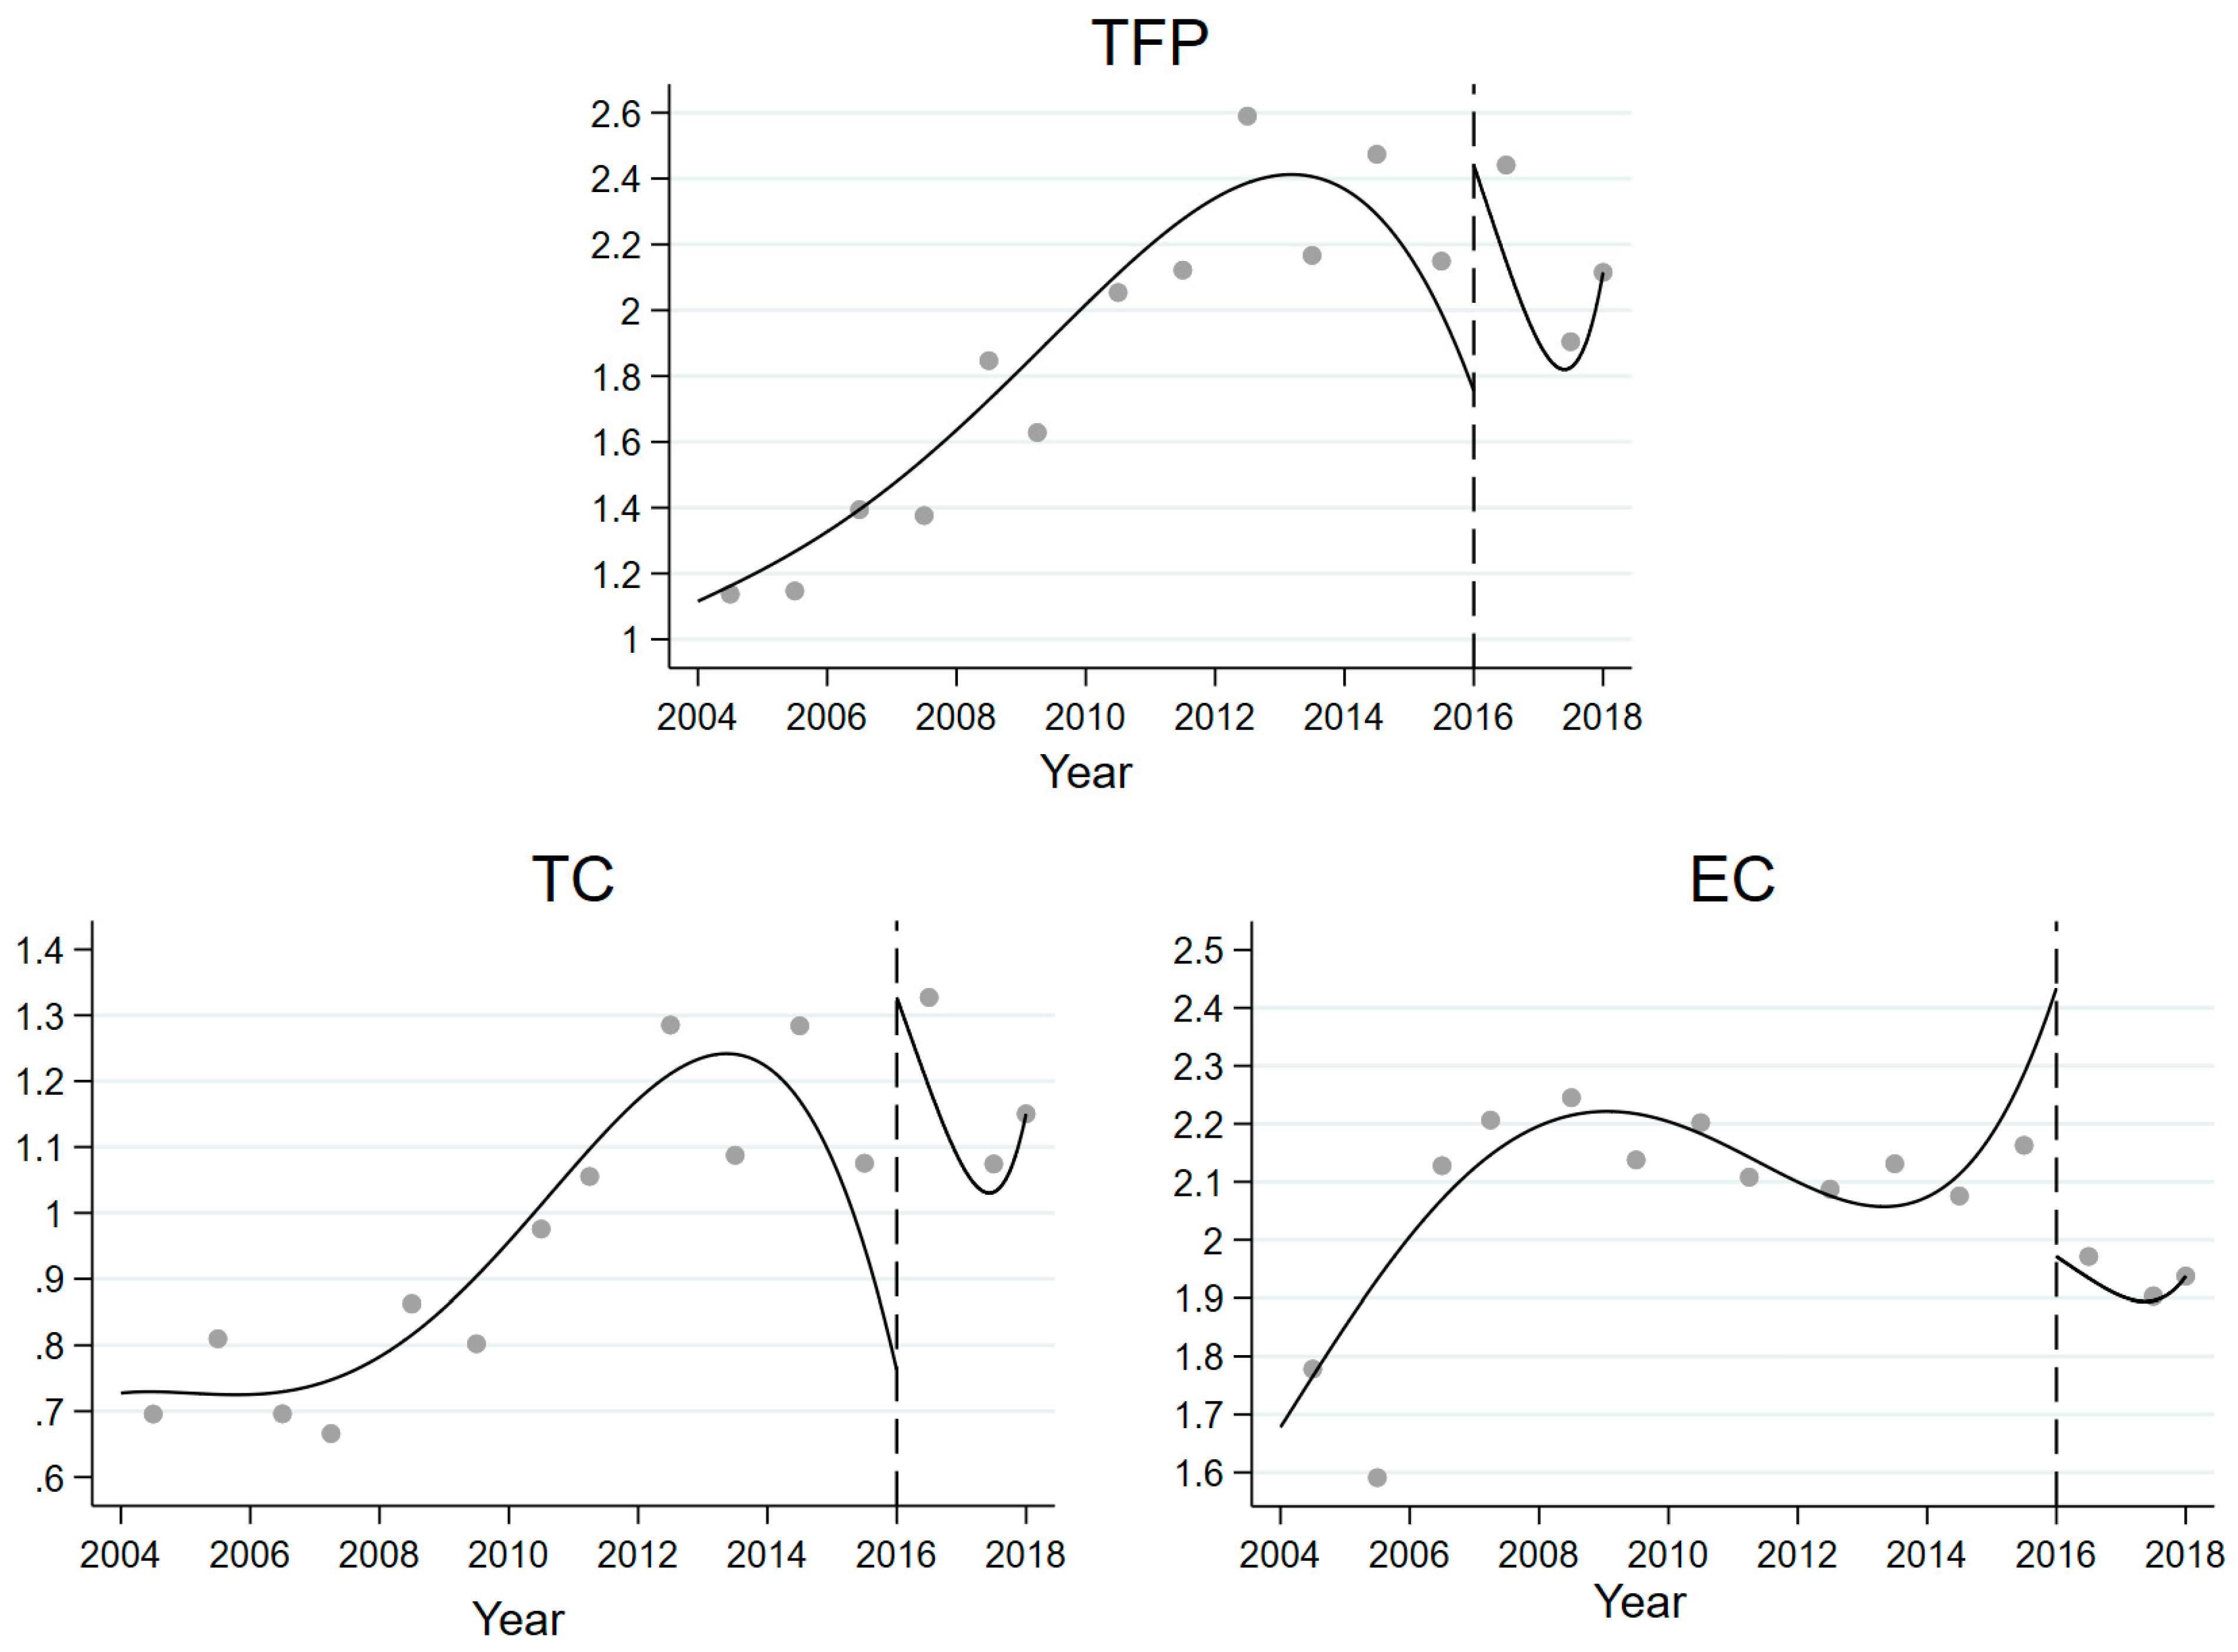
Combining the SBM non-radial model with undesirable outputs, a distance function of the Malmquist index is constructed. Based on the Malmquist index decomposition method, the
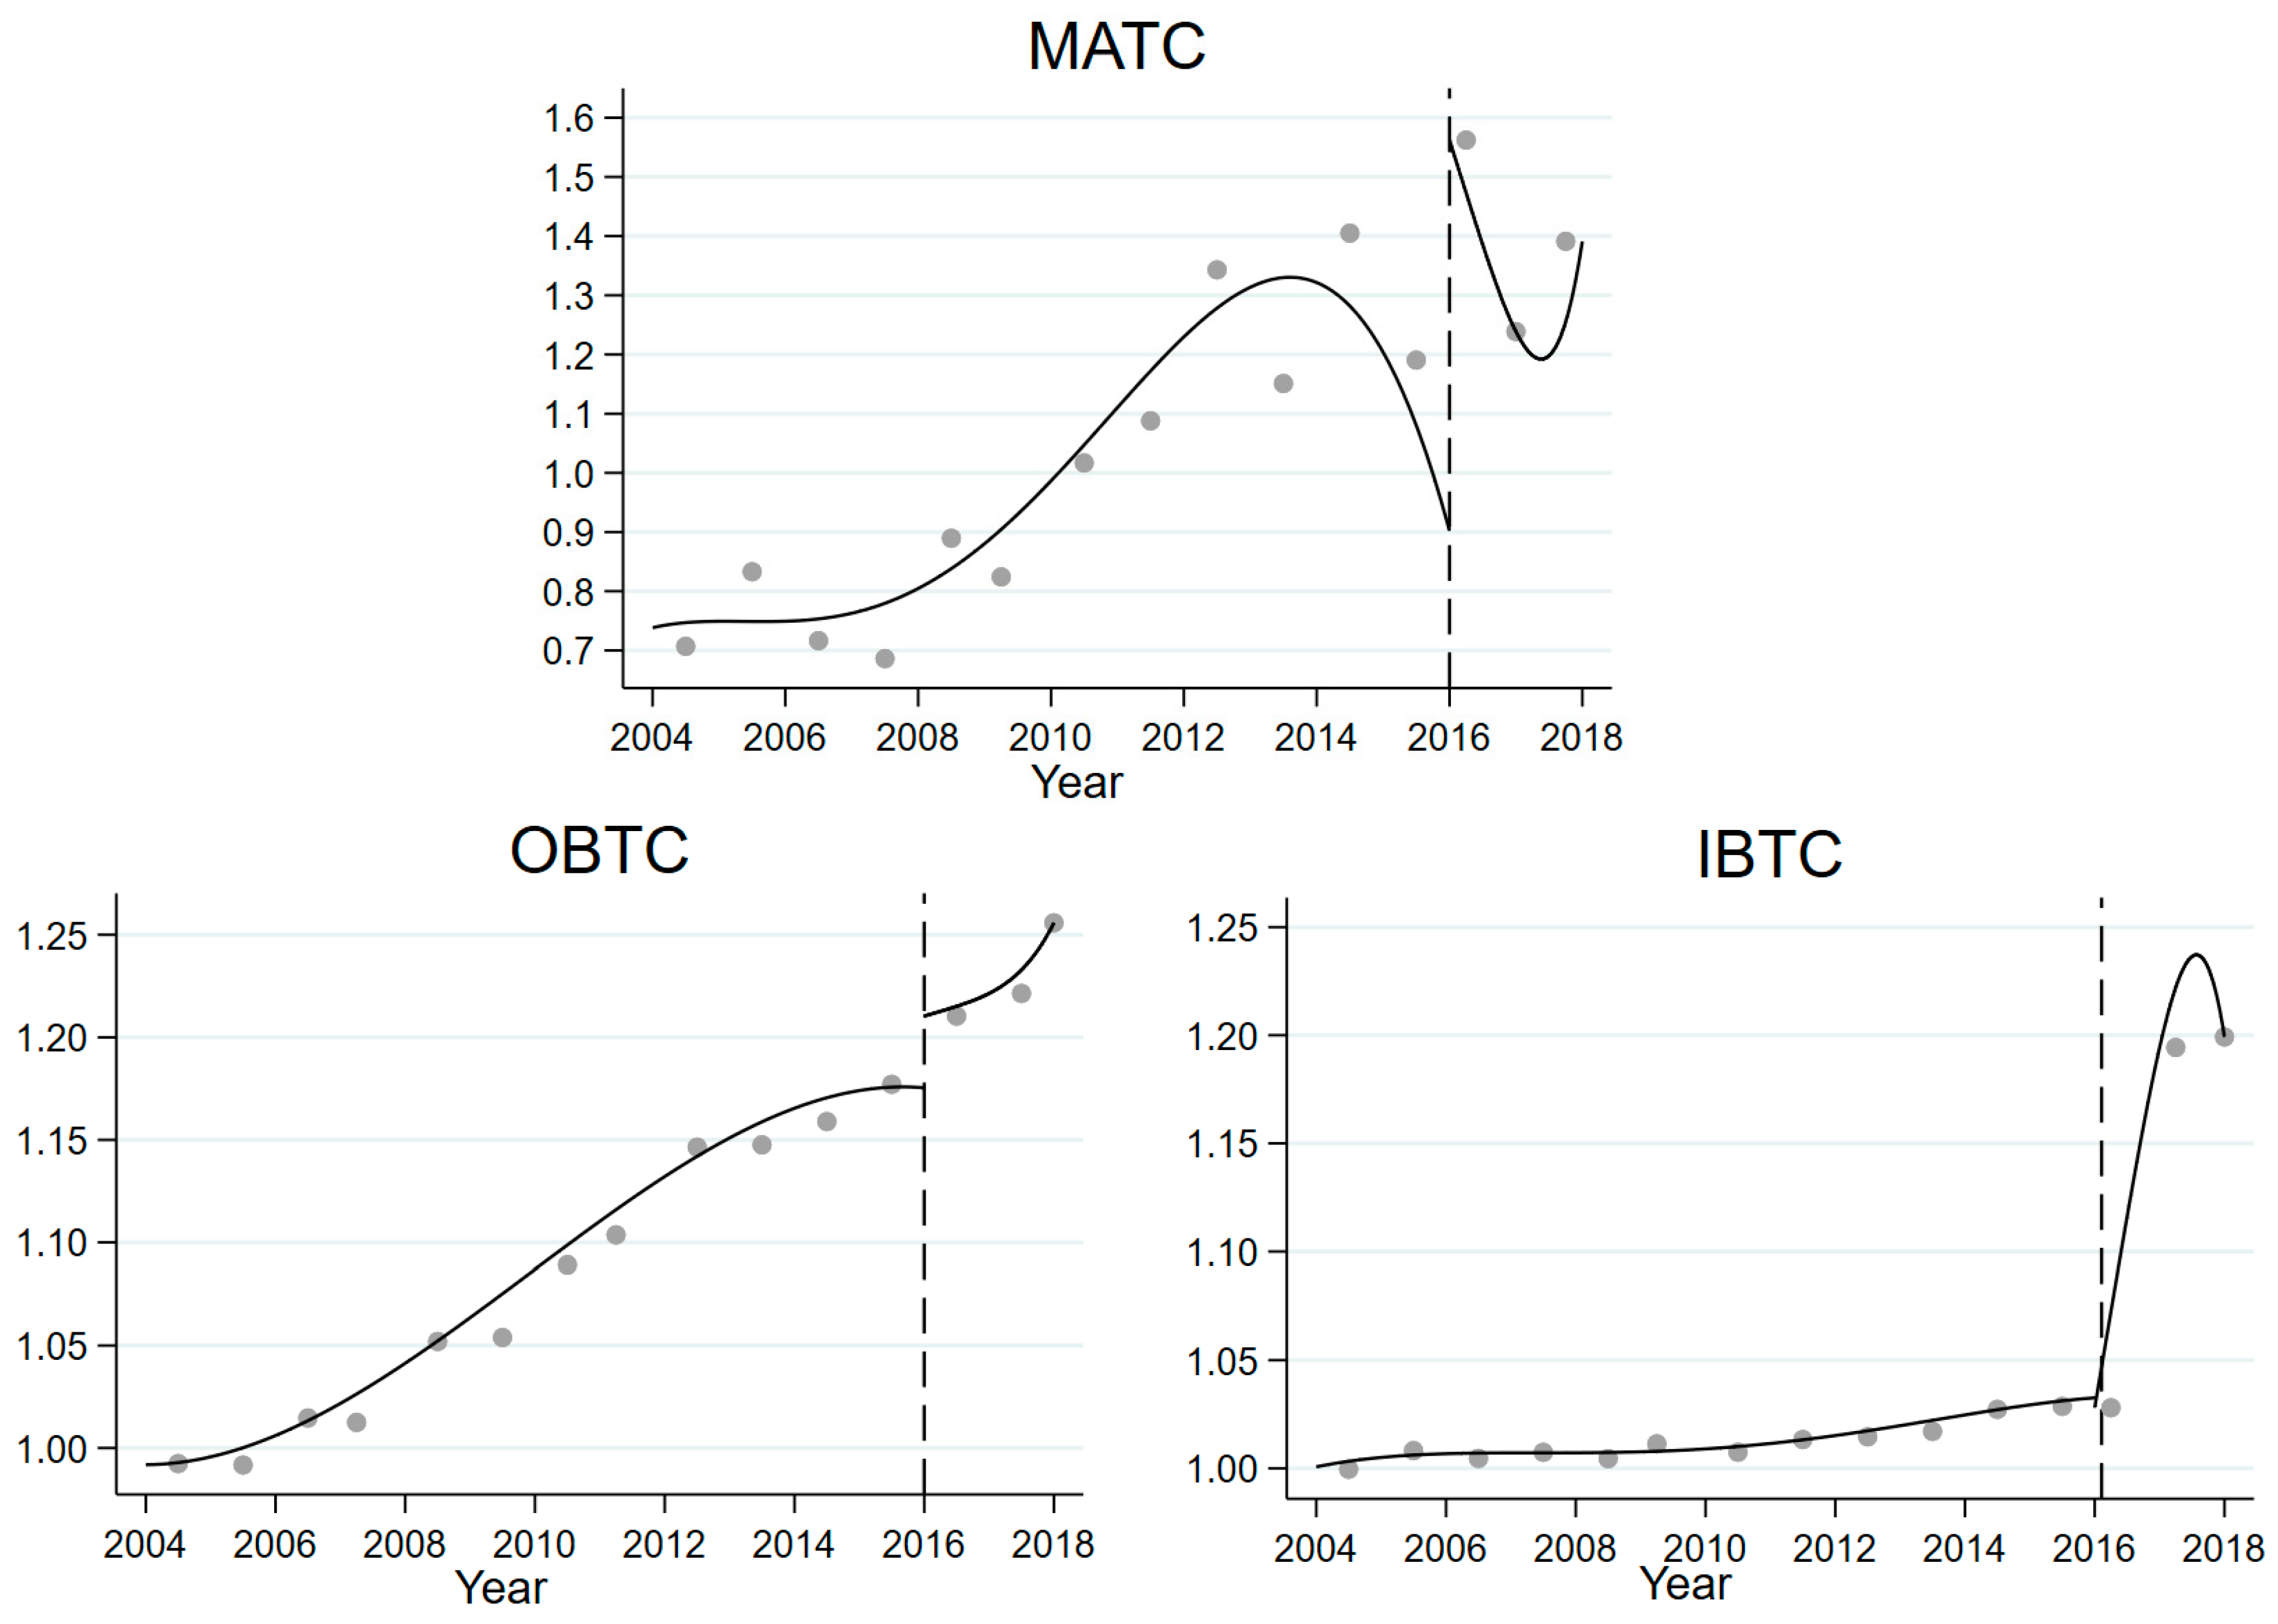
GTFP growth rate is decomposed into technological changes and changes in efficiency. Furthermore, the technological changes are further decomposed into three parts: output-biased technological changes (OBTCs), input-biased technological changes (IBTCs), and the magnitude of the technological change (MATC).
In Formula (2),
represents the change in green technology efficiency from period
to period
under the technological conditions at period
, and
also represents the change in technology efficiency from period
to period
under the technological conditions at period
.
is the geometric mean of
and
. When
> 1, it means that the
GTFP increases from
period to
period. When
< 1, it means that the
GTFP decreases from
period to
period. According to the Malmquist index decomposition method,
GTFP growth is decomposed into technical changes and efficiency changes as follows:
where
represents the technological change of the
kth DMU during the period from
to
, that is, the movement of the technological frontier; and
represents the change in relative efficiency.
After decomposing
MI,
TC is decomposed into the magnitude of technological change (
MATC) and biased technology change (
BTC) according to the decomposition method of Fare, Grosskopf, and Margaritis (2006). Further, the technology bias index can be decomposed into input-biased technology change (
IBTC) and output-biased technology change (
OBTC). This specific decomposition process is as follows:
Furthermore, the biased technology index is decomposed as follows:
That is,
where
MATC represents the magnitude of technological change, which is the neutral transfer of the technological frontier, and
BTC represents the bias of technological change, which is the “non-neutral” transfer of the technological frontier.
IBTC and
OBTC reflect the impact of input and output changes on technological progress. If
IBTC (OBTC) > 1 (<1), it indicates that there is progress in input-biased technology (retrogression). When
IBTC and
OBTC = 1, it indicates that the technical change is Hicks neutral.
3.2. Establishment of the Impact Model of the Central Environmental Protection Inspection Policy on Green Total Factor Productivity
A regression discontinuity design (RDD) is a quasi-natural experiment-based measurement method applied to policy assessments. Compared with the instrumental variable method and propensity score-matching method, a regression discontinuity design is closer in nature to randomized trials and thus has become the preferred method in current causal identification studies [
60,
61].
The regression discontinuity design method is now widely used in labor economics, health economics, political economy economics, and environmental economics. According to the regression discontinuity design concept, if variables such as the green total factor productivity and their decomposition items suddenly change before and after the central environmental inspection policy, and other important variables that affect the green total factor productivity and their decomposition are not suddenly changed, then we have reason to believe that the sudden change in variables such as the green total factor productivity is caused by the central environmental inspection, i.e., that it has an effect on the green total factor productivity indices and their decomposition items.
According to the regression discontinuity design principle, this paper establishes the following model for calculating the impact of the central environmental protection inspection policy on green total factor productivity:
where
represents the central environmental protection inspection city and
represents the year;
is the green total factor productivity of the inspected city in the current year, which is logarithmized in this section to reduce heteroscedasticity and ensure stability;
is a dummy variable representing the central environmental protection inspector.
is 0 for
city in the year before the central environmental protection inspector’s inspection, and 1 for
city in the year after the central environmental protection inspector’s inspection. The first pilot of China’s central environmental protection inspection policy and the implementation of the first round of inspections all started after 2016, so the time of the exogenous impact proxy variable of regression discontinuity design model was set to 2016.
is a polynomial function with
as the independent variable;
is a series of control variables;
is the regional fixed effect;
is the time-fixed effect; and
is the random disturbance term. In this formula, the coefficient
is the difference in green total factor productivity before and after the central environmental protection inspection.
In order to explore the impact mechanism of central environmental protection inspections on the green total factor productivity in detail, we decomposed
into technical efficiency
and green technological progress
, and used the model idea of formula to establish the following model, so as to analyze the mechanism of the impact of the central environmental protection inspections on these two decomposition items.
In order to explore whether central environmental protection inspections can change the direction of technological progress, this paper further decomposes the green technological progress into the output-biased technological change , the input-biased technological change , and the magnitude of technological change . If the central environmental protection inspection cannot significantly change the technological progress bias, this indicates that the environmental regulation has not fundamentally promoted the green transformation but rather the “short-term effect” of environmental governance.
3.3. Variables and Data
Since the sample selected in this paper is a sample of Chinese cities, based on the availability and integrity of data, we selected panel data from a total of 267 cities from 2004 to 2018. The relevant data of the variables explained above and the control variables are from the China Urban Statistical Yearbook, China Statistical Yearbook, and the Province Statistical Yearbook. Any missing values in the process of data collation were filled using the mean method.
(1) Explanatory variables: the explanatory variables are the green total factor productivity
and the technical efficiency
, the green technological progress
, the biased technological progress after the decomposition of green technological progress
and
, and the magnitude of technological change
of 267 cities in China, measured by using the non-radial super-efficiency SBM model considering the undesirable output. The specific labor input, capital input, energy input, desirable output, and undesirable output indicators involved are shown in
Table 1.
The specific input–output indicators are selected as follows:
(2) Explanatory variables: the core explanatory variable is the central environmental protection inspection , and the remaining control variables are foreign direct investment , human capital , industrial structure , fiscal revenue , and R&D capacity . The details of the variables are as follows:
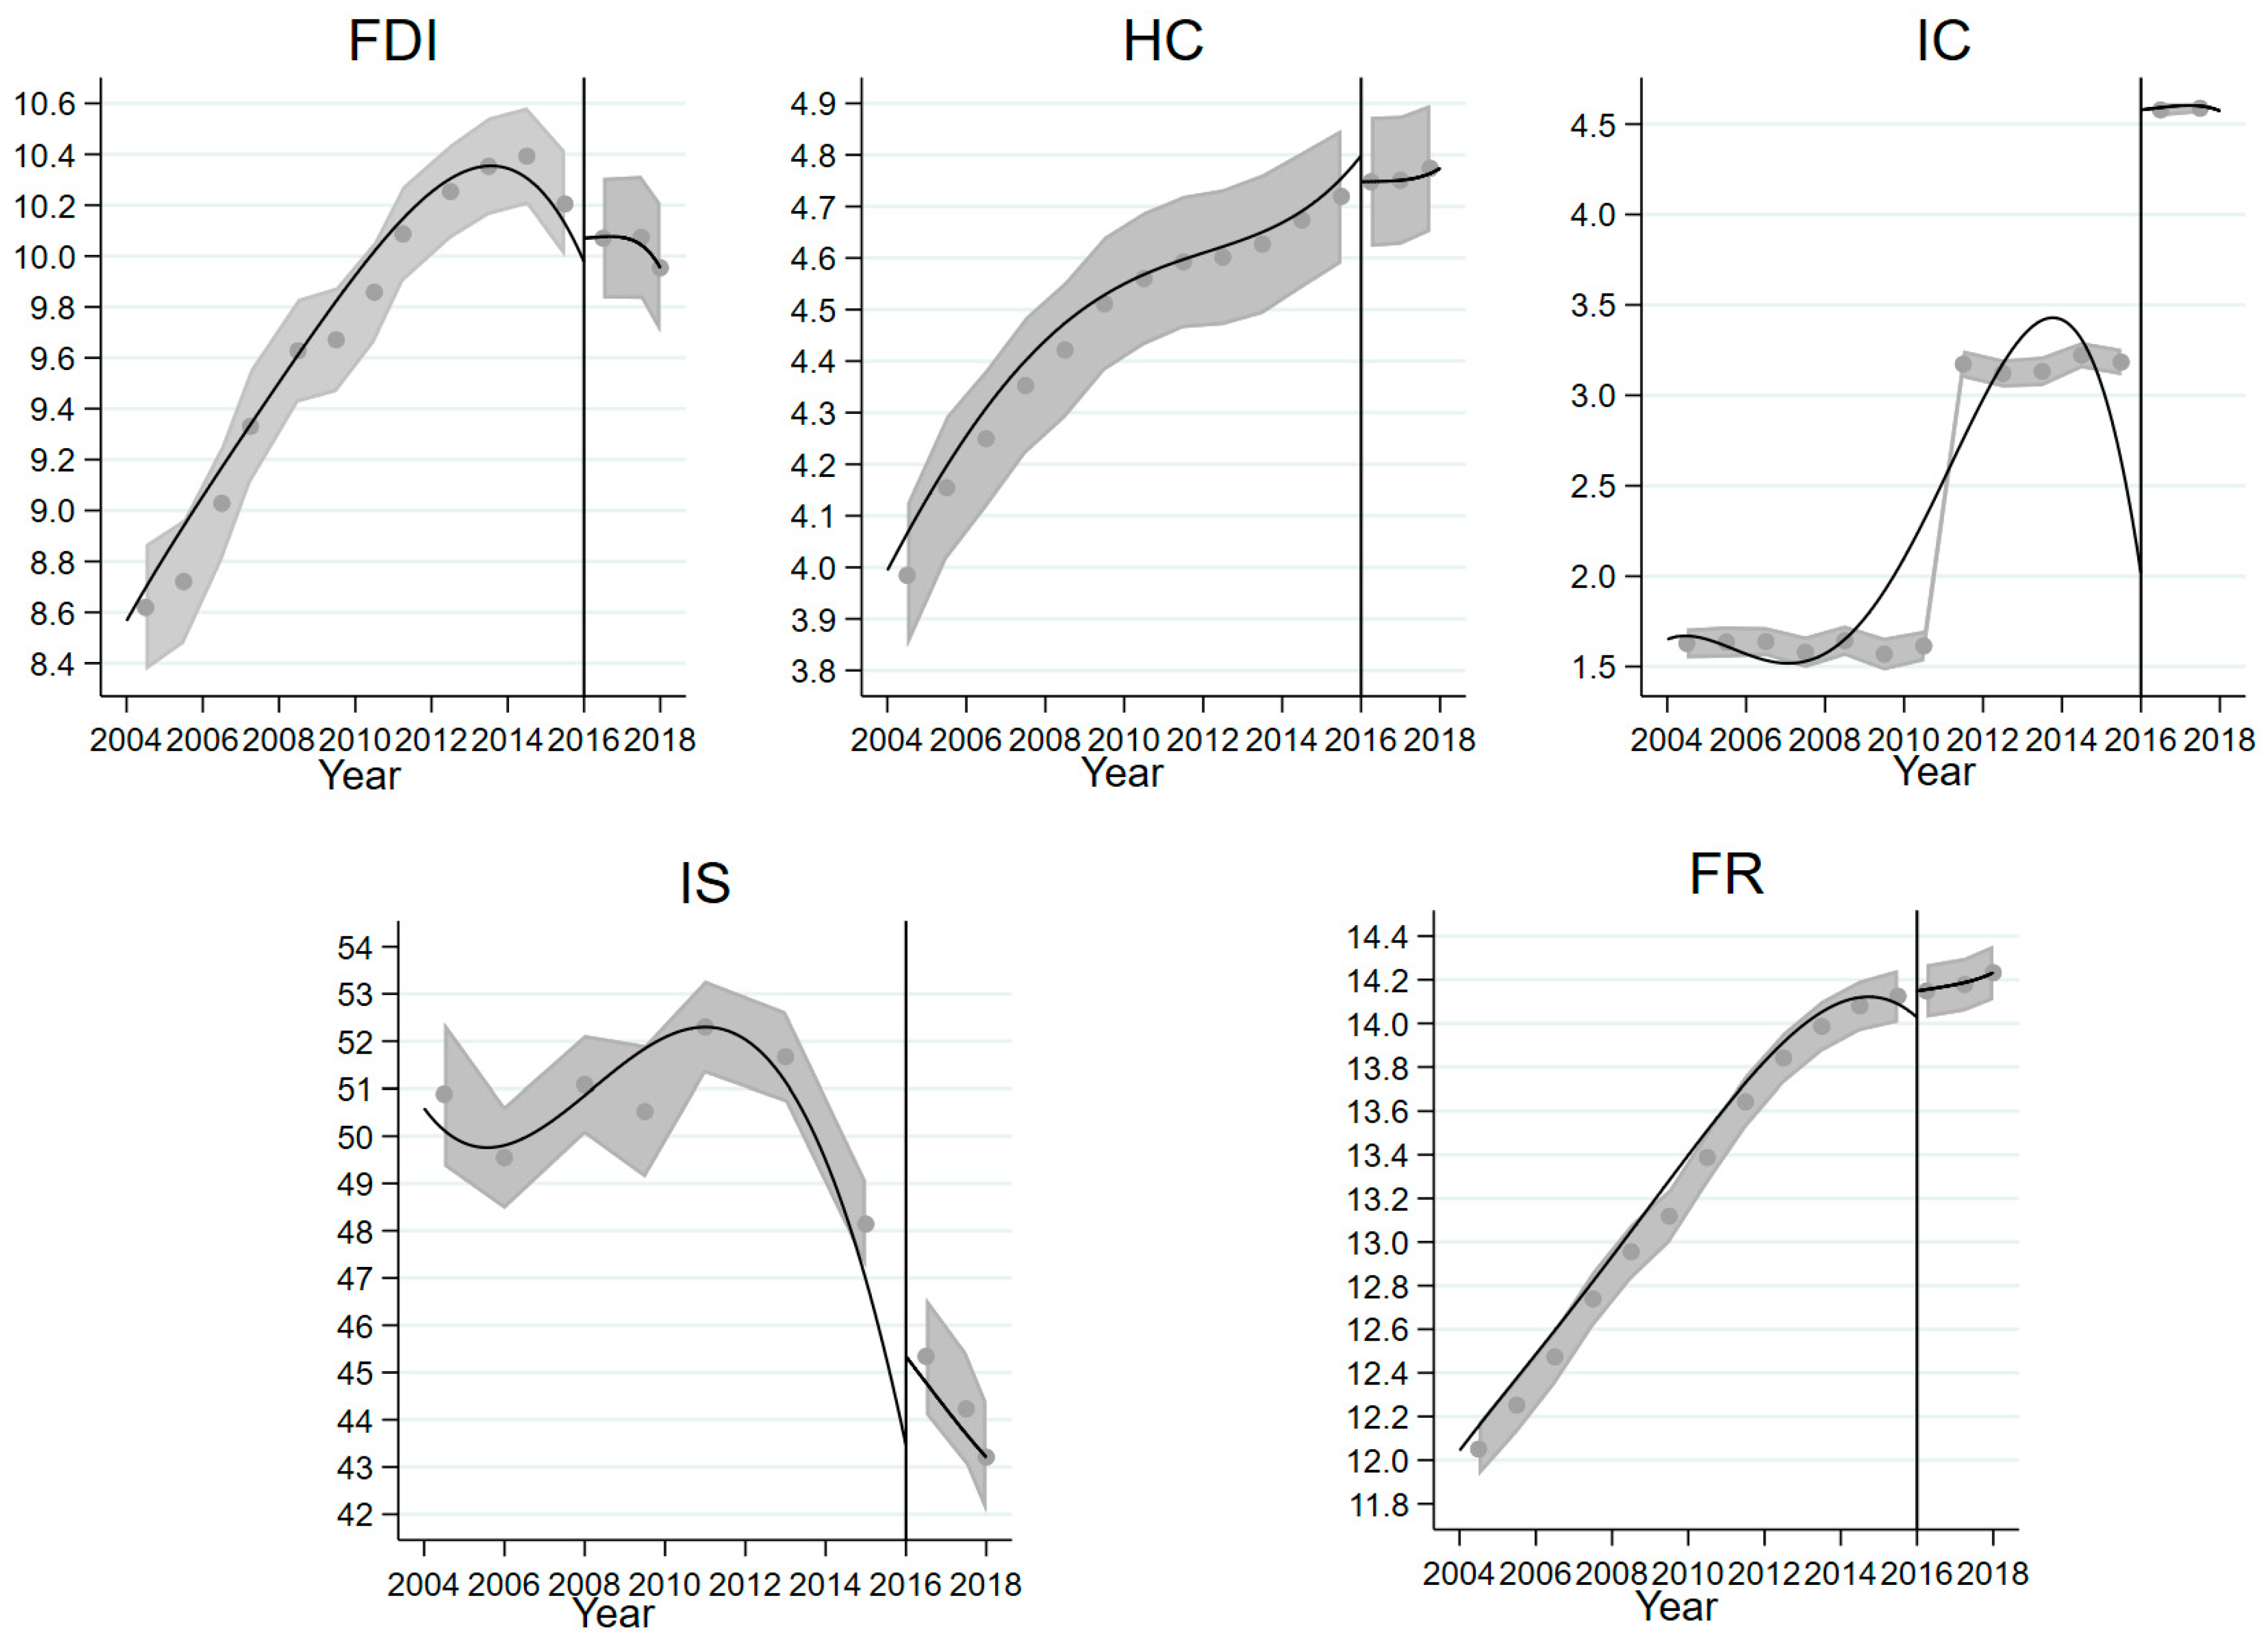
① Foreign direct investment (FDI): there are two opposite hypotheses of a “pollution halo” and “pollution refuge” in foreign investment. When foreign investment brings advanced technological production, it will also transfer pollution to the local area. Therefore, the proportion of foreign direct investment in the local GDP of each city is selected to represent this indicator.
② Human capital (HC): the higher the level of human capital, the higher the level of industrial labor quality and knowledge. This indicator is represented by the number of college students per million population.
③ Industrial structure (IS): if a city takes a polluting industry as its pillar industry, the more dependent it is, the more difficult it is to transform and upgrade the polluting industry. This indicator is represented by the proportion of the secondary industry in the local GDP.
④ Fiscal revenue (FR): the general fiscal revenue of each city in the current year is used to represent the local tax revenue and other economic conditions.
⑤ R&D capability (IC): the support of cities for scientific undertakings can effectively ensure their R&D capability and application of green technologies and their introduction and adoption of advanced production technologies. The R&D capability is characterized by the proportion of local fiscal expenditure on scientific undertakings in the local GDP.
5. Conclusions and Policy Recommendations
In recent years, the central environmental inspection policy has been an important means of promoting ecological civilization in China; it is an important means to correct the problem of “emphasizing legislation, neglecting law enforcement, and neglecting supervision” in the process of implementing environmental regulation via local governments and the predicament of environmental regulation failure caused by the “collusion of government and enterprises” by local governments, and it is of great practical significance to China’s current environmental governance. However, there are few studies on the impact of the central environmental inspection policy on Chinese GTFP. Here, the regression discontinuity design method was used to examine the effect of the central environmental inspection policy on Chinese GTFP. The empirical results suggest that: (1) The Chinese central environmental inspection policy has a significant effect on the promotion of GTFP. (2) The mechanism of the central environmental inspection policy’s impact on GTFP is brought about through significant TC; however, in the implementation of the central environmental inspection policy, the punishment of polluting enterprises, pollution rectification, and the promotion of the use of environmental technologies by manufacturing enterprises, conducting environmental inspections on manufacturing enterprises in various industries and the supervision of local governments by the environmental inspection teams will have a negative impact on technical efficiency. (3) The impact of the central environmental inspection policy on GTFP did not affect the main control variables, such as foreign investment, human capital level, industrial structure, and fiscal revenue. This shows that the central environmental inspection policy was the main reason for the increase in GTFP during the year of its implementation. In addition, the increase in R&D capacity after the year of the policy’s implementation may be due to an increased support for R&D by local governments under pressure from central environmental inspection policy authorities and the need to improve environmental performance after environmental inspections. (4) The effect of the central environmental inspection policy on TC is brought about by significantly increasing the magnitude of technological change. Although the policy has a positive effect on biased technological change, it is not significant. The policy’s impact on TC is short-term to promote “pollution” in the production process; however, it has no significant effect on the allocation of resources, the expected output, and the proportion of pollution output, indicating that the technological nature of the production process has not been fundamentally reversed by the policy, that is, the jump-up effect of the Chinese central environmental inspection policy on GTFP is likely a short-term influence that does not significantly reverse the pollution output in the production process during the observation period, and is rather about regulating the act of polluting.
The above conclusions are of great theoretical and practical significance to the analysis of the effectiveness of the Chinese central environmental inspection policy and the subsequent implementation of environmental inspections. In response to the above conclusions, we give the following policy recommendations: (1) Give full play to the role of the central environmental inspection policy in correcting the “failure” of conventional environmental regulations, fully affirming the “authority” and effectiveness of the central environmental inspection policy central environmental inspection policy as an important means of correcting local governments’ “emphasis on the economy and neglect of the environment”. The role of the central environmental inspection policy in the coordination of government–enterprise relations in the process of local government governance will be brought into play to promote the environmental improvement of enterprise production and enhance the important functions of the technological progress. (2) The role of the central environmental inspection policy team should be limited to the scope of the planning of the policy for correcting the deviation of environmental regulations in the process of conducting inspections at the places where they are stationed, so as to avoid the expansion of the scope of environmental inspections and excessive administrative means, and to avoid the negative effects on management efficiency and production efficiency in the process of production to the greatest extent. (3) Improve the system of public participation in the implementation of the central environmental inspection policy, giving full play to the power of public supervision, and establishing a sound channel and complaint mechanism for the public to complain about environmental protection supervision, in order to enhance the interaction between the government and society in the process of local governments’ environmental regulation, so that the central environmental inspection policy can become a continuous and regular environmental governance means, and so that the “short-term effect” of the central environmental inspection policy can be avoided. (4) Optimize the supervision mechanism of the central environmental inspection policy, integrate an ecological environment detection system in the process of central environmental inspection policy, establish a punishment system for pollution-related enterprises, and establish an incentive system for the green transformation of enterprises. To encourage enterprises’ green technology research and development, we should not only strengthen the treatment technology of pollution emissions but also really strengthen the green transformation of enterprise production.
This study focuses on the meticulous analysis of the inherent mechanism of the impact that China’s central environmental inspection policy exercises on green total factor productivity, based on Chinese urban data. Furthermore, it delves into the biased technological progress aspect and scrutinizes how this policy can promote the transition towards a greener economy. However, there are some defects in this study; for example, this study only analyzed the environmental protection policy for the promotion of the region, lacking manufacturers for micro-observation. Given that the implementation of the central environmental inspection policy targets production enterprises, the response measures these companies take following environmental inspections serve as the most direct reflection of this environmental regulatory policy. The core goal of the central environmental inspection policy is to ensure that production enterprises upgrade their technology, update their equipment, and progress towards becoming more green. Therefore, the success of this policy primarily hinges upon the extent to which production enterprises can achieve this objective. In the future, we intend to examine the implementation effect of the central environmental inspection policy from the perspective of production enterprises.


