Article

Optimization of Renewable Energy Supply Chain for Sustainable Hydrogen Energy Production from Plastic Waste

1
Department of Industrial Engineering, Faculty of Engineering, Urmia University, Urmia 5756151818, Iran
2
Department of Mechanical Engineering, Faculty of Engineering, Urmia University, Urmia 5756151818, Iran
*
Authors to whom correspondence should be addressed.
Sustainability 2023, 15(24), 16813; https://doi.org/10.3390/su152416813
Submission received: 26 October 2023 / Revised: 11 December 2023 / Accepted: 11 December 2023 / Published: 13 December 2023
(This article belongs to the Special Issue Sustainable Development of Materials Recycling and Green Technology)

Abstract

:
Disposing of plastic waste through burial or burning leads to air pollution issues while also contributing to gas emissions and plastic waste spreading underground into seas via springs. Henceforth, this research aims at reducing plastic waste volume while simultaneously generating clean energy. Hydrogen energy is a promising fuel source that holds great value for humanity. However, achieving clean hydrogen energy poses challenges, including high costs and complex production processes, especially on a national scale. This research focuses on Iran as a country capable of producing this energy, examining the production process along with related challenges and the general supply chain. These challenges encompass selecting appropriate raw materials based on chosen technologies, factory capacities, storage methods, and transportation flow among different provinces of the country. To deal with these challenges, a mixed-integer linear programming model is developed to optimize the hydrogen supply chain and make optimal decisions about the mentioned problems. The supply chain model estimates an average cost—IRR 4 million (approximately USD 8)—per kilogram of hydrogen energy that is available in syngas during the initial period; however, subsequent periods may see costs decrease to IRR 1 million (approximately USD 2), factoring in return-on-investment rates.

1. Introduction

The excessive production of plastic products has become an environmental crisis. Petroleum-based plastics, commonly known as non-biodegradable, take hundred years to decompose in soil. This raises the concern that if we do not treat plastic waste, the crisis will escalate to a point where our planet is entirely covered with plastic debris [1]. Research indicates that there is now more plastic in the world than all living organisms combined. Global plastic production statistics reveal a quadrupling from 2000 to 2019, reaching a staggering 460 million tons [2]. The emissions and residues from factories manufacturing these plastics have caused significant harm to the environment [3]. On another note, fossil fuels and greenhouse gas emissions pose risks to both our planet and its inhabitants. Considering limited fossil energy reserves and increasing consumption rates, relying solely on existing energy sources is no longer sustainable [4]. Converting plastic waste into non-fossil energy could offer double benefits, reducing reliance on fossil fuels while utilizing an alternative source of energy and reducing the problems caused by plastic waste [5].
Hydrogen energy emerges as a promising solution for humanity’s future needs due to its clean burning properties without emitting pollutants or leaving any harmful residuals like greenhouse gases or acid rain [6]. Hydrogen stands out as having high energy content per unit weight among all known fuels despite being lightweight itself. Currently, about 98% of hydrogen production relies on fossil fuels; however, transitioning towards alternative methods would be advantageous for sustainability efforts [7]. The demand for hydrogen has tripled since 1975 with approximately six percent sourced from natural gas, two percent from coal, and the remaining percentage derived through hydrocarbon electrolysis or other means [8].
Najafi et al. [9] provided an overview of the methods and raw materials required for hydrogen production. There are several methods for hydrogen production based on the type of raw materials. This process can be analyzed using three types of chemistry: electrochemical, biological, and thermochemical [10]. These methods are essential for hydrogen energy production. Within the thermochemical category, various processes exist such as gasification [11] and pyrolysis [12]. Also, different processes such as steam methane reforming [13], plasma reforming [14], partial oxidation [15], and direct solar energy production [16] can be utilized. The raw materials commonly used in these methods include coal, biomass and oil feedstock (such as natural gas), and solar energy. The electrochemical sector involves electrolysis and photolysis of water using solar or wind energy. Additionally, biomass materials can be utilized in the biological sector [9]. Currently, global demand for hydrogen consumption stands at 90 million tons [17]. It is important to note that hydrogen has some disadvantages as well. It possesses high fire and explosion risks when mixed with air; it can cause suffocation in its pure or oxygen-free form; and it has a propensity to dissolve in certain metals. Hydrogen exhibits versatility across various industries including transportation, power plants, military aviation sectors, and meeting urban industry energy demands [6].
Table 1 shows a review of some recent relevant works conducted to identify gaps in the existing literature. Carrera and Azzaro-Pantel [18] considered a mixed-integer linear program (MILP) model for the hydrogen supply chain with a multi-period scenario. Their model was based on the power-to-gas conversion system. The energies considered in the research were wind, photovoltaic, and hydro-energies. Their objective was minimization and their goal was to reduce the annual cost and the emission of greenhouse gases. Their model was analyzed in GAMS-24.1.2 software. The applications that were considered for the chain were transportation and green fuels. Demirihan et al. [19] provided a MILP model that had a multi-scale strategy for optimization of a multi-product process system from renewable and fossil resources. Their strategy was applied to lower emissions and production costs from natural gas, solar energy, and wind energy. Their model could reduce 17% of total production cost. The applications of hydrogen considered in their article were refineries, E-fuel (also known as synthetic fuel or electrofuel, a type of fuel that is produced from renewable energy sources such as electricity), and power production. Guler and et al. [20] studied the hydrogen supply chain to forecast the hydrogen demand between 2021 and 2050 in five periods; every period was 5 years. Their aim was to minimize the total cost of the hydrogen supply chain while meeting the demand for hydrogen in the transportation sector. Their model was a mixed-integer program (MIP) and, in the first period, about 12% of demand was fulfilled from local production and, in the last period, about 48% of demand was fulfilled. Kazi et al. [21] performed research on the design of a hydrogen supply chain for industrial and multi-sector application like transportation, energy, and shipping via a green hydrogen economy. The problem was modeled as a MILP and solved in GAMS. The solution was able to find an optimal hydrogen supply chain network with an optimal amount of green hydrogen production of 453.03 million metric kg/year. Shamsi et al. [22] provided multiple objectives for the optimal size and location of hydrogen infrastructure. The model was a MILP and the results showed that the cost of hydrogen production and delivery could be reduced from 22.7 USD/kg-H2 to 14.7 USD/kg-H2. The environmental and health-related benefits of developing hydrogen fueling infrastructure for heavy vehicles were USD 1.63 million per year and USD 1.45 million per year, respectively. Also, each kg of H2 could prevent 11.09 kg of CO2 from entering the atmosphere. Reyes-Barquet et al. [23] provided a MILP model for hydrogen production and electricity generation for sugarcane factories. The feedstock was biomass waste and the aims were maximizing annual profit and minimizing greenhouse emissions. Optimization was performed via a genetic algorithm and the optimal configuration of the chain network was selected using a multi-criteria decision-making technique. The main results showed that the average internal rate of return was estimated at 21.5% and the average payback period was 5.02 years. Yoon et al. [24] suggested a hydrogen supply chain with aims for minimizing capital and operating costs with MILP. Their result for an optimal hydrogen supply chain network indicated that natural gas pipelines and byproduct hydrogen had effects on reducing the total costs. Compared to this scenario, if byproduct hydrogen, natural gas pipelines, or both were available as part of the hydrogen supply chain, the average costs were reduced by 0.93, 1.40, and 2.03 USD/kg-H2. Wickham et al. [25] provided hydrogen supply chains for the transport sector up to the year 2050. Due to the costs from separation needed to meet hydrogen purity standards for transport applications, the total discounted cost of the hydrogen supply chain was significantly high. It was cost-optimal when using hydrogen production from steam methane reforming; installing transmission pipelines; and repurposing the natural gas distribution network to supply 100% hydrogen. Considering these given techno-economic assumptions, hydrogen could be provided at a rate of 7.75 USD/kg. Ibrahim and Al-Mohannadi [26] worked on optimizing a hydrogen supply chain network for CO2 emission policies. The novelty of their research was tracking resources in hydrogen supply chains and interactions between production, storage, and transportation. The model was formulated as a MILP for minimizing cost. They also provided a Pareto curve to understand the cost of hydrogen and emission reduction. Also, hydrogen transported as ammonia was reported to cost 19% less than other alternatives like liquid hydrogen. Perna et al. [27] focused on designing, sizing, and the economic feasibility of hydrogen supply chain networks with a solar electrolysis system that generates hydrogen to power fuel cells based on a propulsion system installed on board a small passenger boat. The findings show that an alkaline electrolysis unit of 1780 kW combined with an 8.15 MW solar power plant can create 128.7 tons of hydrogen per year. The discounted payback period and profitability index were 9 and 2.03 years. Forghani et al. [28] provided a MIP model with steam methane reforming, gasification with coal and biomass, and water electrolysis. They also considered above-ground tank and salt cavern storage to account for facility size. Trucks and pipelines were the transport modes for the model. Objective functions were total costs and CO2 emissions. The production and storage facilities could be scaled up over time. The results showed that the pipelines combined with modern tube trucks were the best option for transferring H2. Also, storing H2 in salt caverns could reduce total cost by up to 43% and these caverns could offer much higher capacity.
The optimization of the renewable energy supply chain to produce hydrogen energy from plastic waste is of utmost importance for several reasons. Firstly, it allows for the efficient utilization of plastic waste, which is a major environmental concern worldwide. Secondly, optimizing the supply chain for hydrogen production from plastic waste promotes sustainability and energy independence. By using plastic waste as a feedstock for hydrogen production, we can simultaneously address two pressing issues: waste management and renewable energy production.
Optimizing the supply chain for hydrogen production from plastic waste opens up avenues for innovation and technological advancement. Researchers can explore different methods and technologies to efficiently convert plastic waste into hydrogen energy, such as through pyrolysis or gasification processes. They can also investigate ways to streamline the collection, sorting, and processing of plastic waste to ensure a continuous supply for hydrogen production. Furthermore, a research study in this area can contribute towards developing policies and regulations that promote the adoption of hydrogen energy from plastic waste. It can provide insights into the economic feasibility, environmental impacts, and scalability of such a supply chain. This knowledge can help governments, businesses, and other stakeholders make informed decisions regarding investments in infrastructure, incentives for recycling, and strategies for transitioning towards a circular economy.
The innovation presented in this article offers a holistic approach to addressing environmental pollution by effectively utilizing plastic waste as feedstock and discussing the generation of renewable energy through hydrogen production. A real case study is conducted in Iran to verify and validate the proposed model.

2. Problem Description and Methodology

The hydrogen supply chain model consists of various components, including sources and raw materials, production centers with related technologies, transmission methods, storage techniques, and applications in different industries. Hydrogen energy has certain drawbacks. Its storage necessitates large tanks and exceptional thermal insulation, which can result in significant costs. Additionally, ensuring the safety of these tanks requires regular inspections. Therefore, in this research, syngas output is utilized due to hydrogen’s high reactivity. At the beginning of any supply chain are raw materials. Coal, biomass, natural gas, plastic waste, and water have been identified as raw materials based on considered technology. Three methods of gasification, electrolysis, and steam methane reforming are examined within this research context. It is worth mentioning that wind and solar energy provide electricity for these processes. Consequently, different technologies yield varying quantities of gaseous or liquid form or both types of hydrogen. Continuing from production comes the consideration for storage and transfer to designated storage areas. Special means such as tube trailers, railway lines, trucks, and pipelines are employed to transport hydrogen to these locations accordingly as per their physical state (gaseous or liquid). Finally, depending on demand levels, the desired fuel is distributed to diverse destinations for consumption. Figure 1 provides an illustration depicting the description of the hydrogen supply chain.

2.1. Assumptions

The problem was modeled with the following assumptions:
  • Each production center utilizes specific raw materials for its respective technology;
  • Considering hydrogen’s significance as an energy source, any shortage should not be transferred to demand locations;
  • The model does not possess sufficient dynamic capabilities and is evaluated over a one-year period;
  • Hydrogen can be utilized in both liquid and gas forms based on different technologies;
  • Energy consumption patterns are not investigated within this study;
  • This particular model is designed for application within Iran;
  • Electricity required by the factory is generated from wind turbines and solar panels.

2.2. Mathematical Formulation

The MIP (mixed-integer programming) model under consideration aims to minimize the total cost in the hydrogen energy production supply chain. The reason for using MIP is twofold: the problem’s large size and the flexibility offered by this approach. After reviewing and analyzing the results of the comprehensive model, a specific case is examined relating to producing hydrogen energy from plastic waste. All variables are assumed to be numerically continuous. Additionally, binary variables are utilized for determining whether factories and storage centers should be constructed. Indices and parameters considered for developing the supply chain are presented in Table 2.

2.2.1. Objective Function

In our model, the objective function focuses on minimizing six elements within the chain. These elements include costs associated with constructing production and storage buildings, production quantity, raw materials, and transportation costs based on demand levels. Equation (1) involves two binary variables: x 1 p e and x r l j . The variable x r l j is used for selecting locations for constructing production sites with specific technologies and capacities. Due to high construction costs, our approach seeks a solution that requires minimal production sites while meeting provincial demand requirements. The variable x 1 p e l is employed for selecting storage locations based on hydrogen type. Construction costs differ depending on technology type, capacity level, hydrogen type, and the province considered. Other variables in this objective function include y i s j (representing raw material transfer to production sites), u p j (indicating production amount at different sites when their corresponding binary variable is set as 1), w p j n e (depicting transfer rate of produced material from production sites to storage locations), and v p e n k (reflecting transfer rate from storage sites to consumption centers). This objective function adopts a minimization approach considering demand levels.
Z = r l j f r l j · x r l j + p e f 1 p e · x 1 p e + i s j a i s j · y i s j + r p j b p j r · u p j r + p j n e c p j n e · w p j n e + p e n k g p e n k · v p e n k

2.2.2. Demand Constraints

Considering the high production and construction costs of production and storage sites, it is important to align hydrogen production with the demand of each province. Equation (2) ensures that the amount of hydrogen transferred from storage sites to demand locations matches the corresponding demand, thus maintaining balance. According to Equation (3), the energy output from all production sites to the storage location should be equal to the energy output from the same storage location to all demand sectors.
e n v p e n k = d p k , p , k
j n w p j n e = k n v p e n k   ,   p , e

2.2.3. Production Output

According to Equation (4), the production quantity for each type of hydrogen at each production site is equal to the amount transferred to all storage locations.
n e w p j n e = r u p j r ,   p , j

2.2.4. Conversion Factors

Taking into account efficiency and the inherent waste of materials and energy, a coefficient is assigned in Equation (4). Additionally, due to technological constraints, not all feedstock types can be used for energy production. Therefore, a zero coefficient is assigned to this incompatible feedstock.
i p s y i s j · α i r p = p u p j r ,   j , r

2.2.5. Feedstock Capacity

Considering that the availability of raw materials in each province is limited, Equation (6) is considered.
j y i s j   C a i s ,   i , s

2.2.6. Production Capacity

By considering production costs, production space, and the expenses associated with constructing hydrogen production sites, Equation (7) is taken into consideration.
u p j r l C a 1 p j r l · x r l j ,   p , j , r

2.2.7. Reasonable Relations

Based on the specific conditions of the problem in each province, the ability to establish a factory is taken into account with only one capacity and one type of technology. As a consequence of their binary nature, the sum of all production site construction modes within each province should be equal to one, as follows:
r l x r l j = 1 ,   j

2.2.8. Transport Capacity

Each of the methods considered for transferring energy has a specific transfer capacity. However, pipes have the highest transfer volume as they facilitate continuous transfers. Therefore, when it comes to transferring energy from production sites to storage locations Equation (9) and from storage locations to demand areas Equation (10), the following constraints are applicable:
w p j n e C a 2 p j n e ,   p , e , j , n
v p e n k C a 3 p e n k ,   p , e , n , k

2.2.9. Storage Capacity

Similar to production capacity, the limitation of storage capacity has also been taken into account. Storage is allocated in each province based on the available capacity and a binary decision variable as follows:
n k v p e n k C α 4 p e · x 1 p e ,   p , e

3. Computational Results

After modeling the problem, in this section, we examine the input information of the model. Therefore, data related to the model need to be collected at this stage. For data collection, ChatGPT was used along with expert opinions [29]. The modeling focuses on Iran as a case study which includes 30 provinces. Each province has its own set of raw materials, costs associated with it, as well as inflation rates. Figure 2 illustrates the map of Iran. Regarding the raw material of natural gas, only seven provinces have the ability to supply natural gas. The distance measurement considers both road distances as well as train lines connecting different provinces. Three capacities have been considered based on existing capabilities, material costs, and demand levels for constructing factories. Inflation rates specific to each province are factored in when calculating the construction costs. The cost of constructing storage centers is lower compared to production centers. The cost of production varies across cities due to inflation rates. Also, the conversion factor is determined based on the type of technology utilized and the raw materials employed. Energy transportation occurs through four modes: pipelines, trains, tube trailers, and normal trucks. Tube trailers represent a newer generation of trucks with significantly higher capacity compared to regular trucks. Considering their high installation costs, pipelines are more suitable for short distances due to their permanent nature and ability to transport larger quantities of material; they provide an option worth considering despite being costly upfront. According to Statista, hydrogen energy consumption in Iran for 2020 was approximately 3.6 million tons [30]. This figure is about six times lower than the demand for first-world economic countries. Given that hydrogen energy is relatively new, green, widely utilized, and still not fully understood due to technological advancements and associated costs, this model aims to satisfy roughly 25 thousand tons of demand for the first period.

4. Results and Discussion

In this section, we analyze the most important results obtained from our model. It is important to note that the model was implemented using GAMS 24.1.2 software and the CPLEX 22.1.1 solver. The model execution took place on a system with I7-9750H specifications, which includes 12 cores. Given its large dimensions, the model required considerable execution time to achieve a zero-gap solution. After running the software model for 14 h, it reached a gap of 0.9%. Table 3 presents relevant information extracted from the software output. Due to a time limit, the model status switched to Integer Solution mode. Consequently, the CPLEX solver status encountered a resource interrupt option triggered by the time limit set in the GAMS code. The output of the GAMS software, chosen based on a non-zero gap, was labeled as “Best possible”, indicating an estimated value for the objective function when reaching zero gap. Considering the input demand in the model, each kilogram of this green and non-fossil fuel has reached a price of IRR 3,664,344. The high pricing is attributed to innovation within this production system. Over time, as investments are recouped and with increased demand and raw material availability, this cost will likely decrease significantly. The model encompasses 9 production sites and 17 storage centers that cover all regions of the country.
Table 4 provides details about technology types associated with both production locations and storage facilities. According to Table 4, all three types of technology and capacities considered in the model were utilized. Gasification technology was predominantly used for raw materials due to the abundance of plastic materials, biomass, and coal. The GAMS software system maximized production at each production site to minimize total costs. Storage facilities were also optimized by utilizing maximum storage volumes where applicable. Some facilities only had capacity for storing fuel in gaseous or liquid form.
Figure 3 illustrates the production and storage sites in various provinces as well as their proximity to neighboring regions.
After production centers, the method of raw material supply is taken into consideration. There are five types of raw materials under consideration, with four types found in all provinces and one type found exclusively in seven provinces as depicted in Figure 4.
For factories related to electrolysis technology, which uses water as a raw material, Figure 5 shows the raw material supply map.
Finally, the map of raw materials for factories with steam methane reforming technology is shown in Figure 6. According to Figure 6, only seven provinces have gas fields for natural gas production. As a result, due to the shortage of raw materials, constructing a factory with this technology may be impractical. After completing the construction and obtaining raw materials for the nine designated factories, it becomes necessary to transport these materials to storage sites and determine the appropriate transportation methods.
The model considers 17 locations for establishing storage sites. There are four transfer methods available for transporting production materials in either gaseous or liquid form. The model sets a minimum internal distance of 5 km between production sites and fuel storage locations. Due to the high costs and distances involved, pipeline transportation was not utilized in any type of transfer. In most cases (with two exceptions), normal trucks and tube trailers were used as the preferred methods of transportation. Only in two instances did train transportation come into play. 
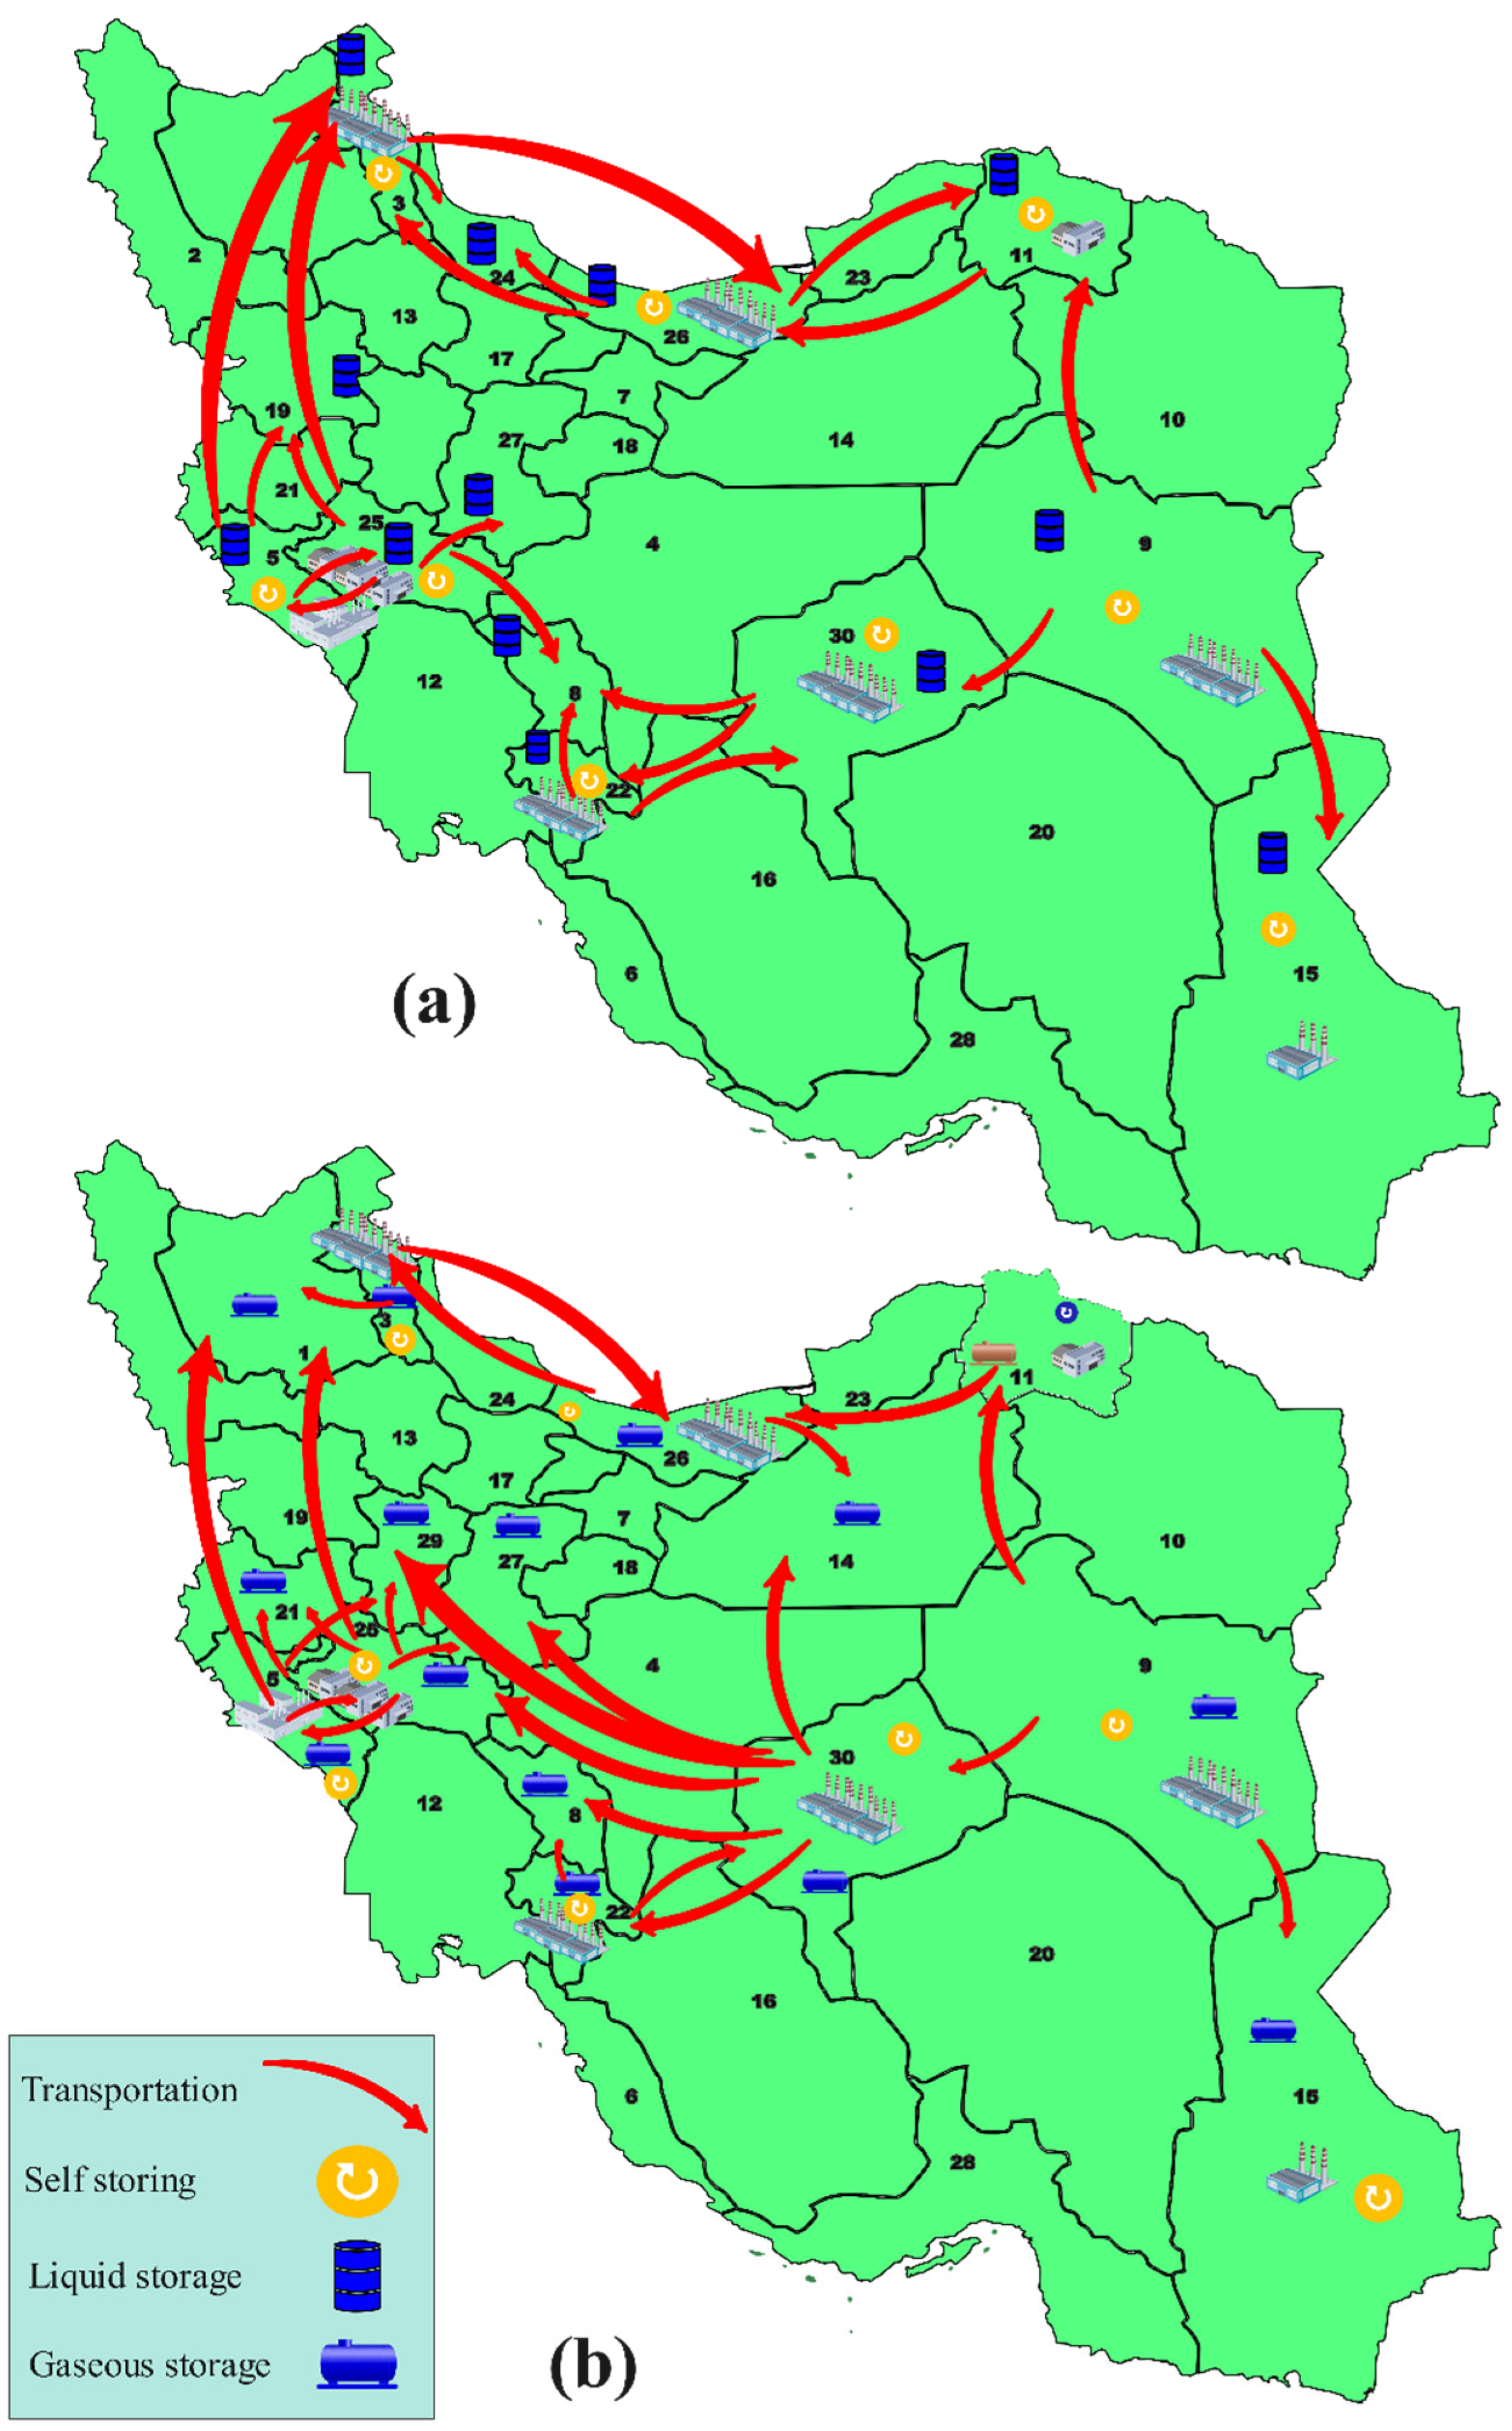
Figure 7 depicts separate maps illustrating the transfer of liquid and gas fuels from their respective production sites to designated storage sites. Finally, it is time to distribute gas fuel based on the demand of each province and the type of fuel from storage centers. Figure 8 illustrates the demand–supply map for different provinces. According to the data, we can infer that provinces where storage facilities have been established are strategically located in close proximity to key areas with shorter distances and optimal points to meet demand.

4.1. Sensitivity Analysis

According to the 13 available parameters and the analyzed data, a sensitivity analysis was performed for the model. In this analysis, each parameter was varied by ±5% within its respective range. The results of these variations are presented in Figure 9. Figure 9 includes two graphs: one depicts the total cost and the second graph analyzes the cost per kilogram of fuel. According to Figure 9a of the analysis, which considers a 5% increase in parameters, the most significant parameter affecting the total cost is the amount of demand. When demand increases by 5%, the total cost rises by approximately 6%. Following that, other important parameters influencing total cost include factory construction cost, factory capacity, storage capacity, conversion factor, and availability of raw materials. Among these parameters, increases in construction cost, production cost, and demand directly impact overall costs. Regarding the cost per kilogram of fuel metric mentioned in the analysis results depicted in Figure 9a, the factory construction parameter holds the highest rank while demand comes next. Moving on to Figure 9b of the analysis, which focuses on a 5% reduction in parameters, The amount of demand remains as one of the most important factors impacting overall costs. It is followed by factory construction cost, production costs, material conversion factor, and production capacity. Similarly, for the metric “cost per kilogram of fuel” considered in Part B analysis results, the factory construction parameter ranks first with demand being placed next. These findings indicate how variations or changes in specific parameters can influence both overall costs and costs per unit (e.g., kilograms) within this particular context.

4.2. Scenario Analysis

In this section, we analyze the model by defining some scenarios. Four scenarios are considered to explore potential outcomes if this model is not implemented at the time of solution. It is important to note that these scenarios assume a 5% change. In the first scenario, the cost of constructing factories and storage centers increases due to inflation and high production costs. Additionally, labor costs also rise in line with inflation. The second scenario examines limitations on fuel availability and raw material shortages. We consider alternative options such as coal and natural gas, while also taking into account increased transportation costs, global warming effects leading to overheating and droughts, as well as reduced underground water resources. The third scenario focuses on advancements in manufacturing technology and equipment related to each specific technology. As these technologies evolve, we anticipate an increase in conversion factors for raw materials along with expanded capacities of factories and storage centers. In the fourth scenario, assuming mankind achieves stable degradable energy sources, there would be a decrease in demand for hydrogen energy. This shift would result from reduced reliance on fossil fuels leading to decreased petroleum usage alongside lower transportation costs. A summary of these scenarios can be found in Table 5.
After entering and changing the parameters of each scenario, Figure 10 is considered as the output of this scenario analysis. Based on Figure 10, it can be observed that the first and second scenarios demonstrate an increasing trend in total price and unit price of fuel. Conversely, the third and fourth scenarios exhibit a negative trend with decreasing prices. This suggests that without government support for the development of this technology, significant financial investments will be required in the future to combat inflation, high prices, and diminishing fossil fuel reserves. Creating such technology would necessitate substantial funding; however, if these expenses do not result in losses for the government, it could lead to affordable, sustainable, and renewable fuel options. While the third scenario indicates potential cost reductions through technological advancements and increased utilization of raw materials, it alone may not be sufficient due to inflationary pressures and high costs.

5. Case Study

Considering the alarming increase in plastic waste and its detrimental effects on the environment, it is imperative to take action and prevent further escalation. Based on current societal conditions, indicators such as GDP, average age of the population, oil reserves, population size, level of education and awareness, greenness index, use of clean fuels, synthetic materials usage including plastic fibers, and imported packaging all contribute to an increase in plastic waste [31]. Research findings suggest that addressing this issue requires changes within industries associated with widespread plastic use which may result in increased costs for factories and companies. This could potentially cause public dissatisfaction while also impacting the cost of living. Plastics exhibit positive characteristics due to their affordability as raw materials along with simplicity in manufacturing high-quality products. However, once they reach their end-of-life stage, they can cause negative impacts on human lives along with animals and our planet’s ecosystem. While these adverse effects may not be immediately evident over short periods of time, if accumulated over extended durations, plastic waste can inflict immense problems and losses upon our planet’s ecosystems as well as humans and animals. Various methods exist for disposing plastics with burial and incineration being the most common approaches. Unfortunately, these methods bear numerous drawbacks for our planet including emission of hazardous gases leading to ozone layer depletion, pollution affecting soil quality, and marine contamination causing harm to land-based organisms as well as sea creatures. Consequently, there is an alternative method that optimizes certain types of plastics—the gasification process—wherein plastics are converted into gas that serves as fuel without encountering recycling disadvantages [32]. Nevertheless, this method faces challenges such as high costs and limitations in its applicability to specific types of plastics. However, technological advancements may pave the way for further improvements in this approach [33]. The gasification process of plastic waste involves thermal decomposition, breaking down the molecular structure of plastics into gaseous fuels. This method enables the recycling of specific types of plastic waste like polyethylene and polypropylene, transforming them into valuable gaseous fuels [34]. Unlike other methods that convert plastics into lower-grade fuels or energy sources, gasification allows for complete reuse. Moreover, it offers flexibility to produce desired gases with specific properties, making it useful for creating synthetic gas mixtures [35]. Compared to alternative waste disposal approaches, the advantages of plastic waste gasification are manifold. Firstly, it significantly reduces waste volume by up to 90%, requiring less landfill space and fewer resources for transportation [32]. Additionally, this process has energy generation potential through the production of syngas, a versatile fuel source that can be combusted to generate electricity or converted into hydrogen fuel [35,36]. Gasification also addresses environmental concerns by eliminating hazardous substances present in plastic waste. Dioxins and furans—chemicals known to cause cancer—are destroyed during this process. In contrast, incineration (another common method) releases these toxins into the atmosphere instead [37]. Lastly, gasification proves to be a flexible technology that can adapt to different types and quantities of plastic waste effectively. This makes it an ideal solution for large-scale management of such wastes. Overall, the gasification process demonstrates significant benefits over traditional disposal methods in terms of reducing volume efficiently while producing valuable gaseous fuels and mitigating environmental risks associated with hazardous substances found in plastics. Also, the general process of gasification is in the form of the formula [38]:
H 2 O + C x 1 H x 2 O x 3 N x 4 y 1 H 2 + y 2 C O + y 3 C H 4 + y 4 C O 2 + y 5 H 2 O
To achieve the goal of “prevention is better than cure”, it is advisable to take proactive measures in effectively managing waste to clean our planet. One effective solution is converting waste into pure hydrogen energy, which can help prevent these problems from arising in the first place. The model under investigation was created by making changes to the comprehensive model, including technology and raw material limitations. The modified model is provided in Appendix A. This model was also implemented in GAMS software, and its outputs are presented in Table 6. As can be observed, the model has achieved a zero gap and reached the optimal solution due to the reduction in model volume. For production utilizing gasification technology, 8 buildings are required, while an additional 12 buildings are needed for storage and distribution throughout the country.
The sole raw material utilized is plastic waste, which results in an increased focus on plastic waste due to the elimination of other raw materials. Consequently, compared to the comprehensive model, there is a significantly higher quantity of plastic raw materials involved. Table 7 and Figure 11 provide details regarding the provinces from which plastic raw materials are sourced for these eight factories. Based on information presented, it is apparent that in most cases, maximum available resources within each province have been utilized.
Furthermore, Table 8 provides information about the storage capacity. Similar to production sites, all storage locations except one mode have the capability to store both types of fuel and utilize their maximum capacity. Finally, Figure 12 shows how to meet the demand of different regions according to the type of transportation.

6. Conclusions

The increasing demand for fossil fuels, limited oil resources, and environmental pollution are the primary driving factors behind the production of green fuels in Iran. Among these clean fuel options, hydrogen fuel has gained significant attention worldwide and is considered a valuable resource. This study focuses on investigating the development of hydrogen energy supply chain networks in Iran by presenting a mixed-integer programming (MIP) model. The developed supply chain design model encompasses all activities related to fuel production, including raw material sourcing, fuel transportation, and distribution to meet demand. Additionally, this article introduces an innovative approach by utilizing plastic waste as a raw material source to reduce waste generation while producing energy. Results from the model highlight that construction costs and demand levels play crucial roles in determining the performance of this supply chain design model. Although the initial price of hydrogen fuel may not be competitive compared to fossil fuels at first glance, with slight improvements in various parameters like costs of factories, storages, transport methods, and government support, its cost can be significantly reduced over time. It is important to note that investing in this forward-looking energy solution requires long-term commitment and consideration. However, such investments have great potential for reducing environmental issues in upcoming years. For future research directions, it could be beneficial to incorporate multiple time periods for evaluating varying demand levels and production quantities. Other potential enhancements include incorporating production planning with penalties for shortages per month or considering multiple objective functions along with addressing pollution concerns associated with raw material production processes as well as their transportation methods. Furthermore, incorporating uncertainty analysis regarding raw material availability, transportation challenges, and other relevant factors would contribute towards refining the overall understanding of hydrogen fuel supply chains.

Author Contributions

Conceptualization, R.H. and R.B.; Methodology, E.D., R.H. and R.B.; Software, R.H. and E.D.; Formal analysis, E.D., R.H. and R.B.; Investigation, R.H. and E.D.; Writing—original draft preparation, E.D.; Writing—review and editing, R.H. and R.B. All authors have read and agreed to the published version of the manuscript.

Funding

This research received no external funding.

Institutional Review Board Statement

Not applicable.

Informed Consent Statement

Not applicable.

Data Availability Statement

The data presented in this study are available on reasoning request from the corresponding author. Any use of data in any form (data, figures, tables, regression models, etc.) needs the permission from the main corresponding author (R. Hasanzadeh).

Conflicts of Interest

The authors declare no conflict of interest.

Appendix A

Indices
jSet of candidate locations for hydrogen production centers/j1–j30
sSet of suppliers for supplying feedstock/s1–s30
nSet of transport method: truck, tube trailer, pipeline, train/n1–n4
pSet of hydrogen type: gas and liquid/p1–p2
eSet of candidate locations for hydrogen storage centers/e1–e30
lSet of volume of hydrogen production centers/l1–l3
kSet of hydrogen demand locations /k1–k30
Parameters
f l j Fixed cost of opening hydrogen production center in location (j) with capacity (l)
f 1 p e Fixed cost of opening hydrogen storage center in location (e) with hydrogen type (p)
a s j Cost of imported plastic waste supplied by supply center (s) to hydrogen production center (j)
b p j Unit production cost of hydrogen at hydrogen production center (j) with hydrogen type (p)
c p j n e Transportation cost of produced hydrogen from hydrogen production center (j) to hydrogen storage center (e) with transport method (n) and hydrogen type (p)
g p e n k Transportation cost of stored hydrogen from hydrogen storage center (e) to customer center (k) with transport method (n) and hydrogen type (p)
d p k Demand of hydrogen at customer center (k) with hydrogen type (p)
α p Conversion factor of produced hydrogen amount from plastic waste
C a s Capacity of imported plastic waste supplied by supply center (s)
C a 1 p j l Capacity of produced hydrogen in hydrogen production center (j) with capacity (l) and hydrogen type (p)
C a 2 p j n e Capacity of produced hydrogen transported from production center (j) to hydrogen storage center (e) with hydrogen type (p) and transport method (n)
C a 3 p e n k Capacity of stored hydrogen transported from hydrogen storage center (e) to customer center (k) with hydrogen type (p) and transport method (n)
C a 4 p e Capacity of stored hydrogen in hydrogen storage center (e) with hydrogen type (p)
Binary decision variable
x l j 1 if location (j) with capacity (l) and technology (r) is selected for opening hydrogen production center; otherwise, 0
x 1 p e 1 if location (e) with hydrogen type (p) is selected for opening hydrogen storage center; otherwise, 0
Continuous decision variable
y s j Amount of transported plastic waste supplied by supply center (s) to hydrogen production center (j)
u p j Amount of produced hydrogen at hydrogen production center (j) with hydrogen type (p)
w p j n e Amount of produced hydrogen transported from production center (j) with hydrogen type (p) and transport method (n) to hydrogen storage center (e)
v p e n k Amount of stored hydrogen transported from hydrogen storage center (e) with hydrogen type (p) and transport method (n) to customer center (k)
Min   Z = l j f l j · x l j + p e f 1 p e · x 1 p e + s j a s j · y s j + p j b p j · u p j + p j n e c p j n e · w p j n e + p e n k g p e n k · v p e n k
e n v p e n k = d p k , p , k
j n w p j n e = k n v p e n k ,   p , e
n e w p j n e = u p j ,   p , j
j y s j   C a s ,   s
u p j l C a 1 p j l · x l j ,   p , j
l x l j = 1 ,   j
w p j n e C a 2 p j n e ,   p , e , j , n
v p e n k C a 3 p e n k ,   p , e , n , k
n k v p e n k C α 4 p e · x 1 p e , p , e

References

  1. Hasanzadeh, R.; Mojaver, P.; Khalilarya, S.; Azdast, T.; Chitsaz, A.; Mojaver, M. Polyurethane foam waste upcycling into an efficient and low pollutant gasification syngas. Polymers 2022, 14, 4938. [Google Scholar] [CrossRef] [PubMed]
  2. Geyer, R.; Jambeck, J.R.; Law, K.L. Production, use, and fate of all plastics ever made. Sci. Adv. 2017, 3, 1700782. [Google Scholar] [CrossRef] [PubMed]
  3. Klemeš, J.J.; Van Fan, Y.; Tan, R.R.; Jiang, P. Minimising the present and future plastic waste, energy and environmental footprints related to COVID-19. Renew. Sustain. Energy Rev. 2020, 127, 109883. [Google Scholar] [CrossRef] [PubMed]
  4. Malafeev, K.V.; Apicella, A.; Incarnato, L.; Scarfato, P. Understanding the Impact of Biodegradable Microplastics on Living Organisms Entering the Food Chain: A Review. Polymers 2023, 15, 3680. [Google Scholar] [CrossRef] [PubMed]
  5. Kang, D.; Manirathinam, T.; Geetha, S.; Narayanamoorthy, S.; Ferrara, M.; Ahmadian, A. An advanced stratified decision-making strategy to explore viable plastic waste-to-energy method: A step towards sustainable dumped wastes management. Appl. Soft Comput. 2023, 143, 110452. [Google Scholar] [CrossRef]
  6. Lagioia, G.; Spinelli, M.P.; Amicarelli, V. Blue and green hydrogen energy to meet European Union decarbonisation objectives. An overview of perspectives and the current state of affairs. Int. J. Hydrogen Energy 2023, 48, 1304–1322. [Google Scholar] [CrossRef]
  7. Baykara, S.Z. Hydrogen: A brief overview on its sources, production and environmental impact. Int. J. Hydrogen Energy 2018, 43, 10605–10614. [Google Scholar] [CrossRef]
  8. International Energy Agency. Available online: https://www.iea.org/fuels-and-technologies/hydrogen (accessed on 8 July 2023).
  9. Najafi, B.; Haghighatshoar, F.; Ardabili, S.; Band, S.S.; Chau, K.W.; Mosavi, A. Effects of low-level hydroxy as a gaseous additive on performance and emission characteristics of a dual fuel diesel engine fueled by diesel/biodiesel blends. Eng. Appl. Comput. Fluid Mech. 2021, 15, 236–250. [Google Scholar] [CrossRef]
  10. Qureshi, F.; Yusuf, M.; Tahir, M.; Haq, M.; Mohamed, M.M.I.; Kamyab, H.; Nguyen, H.H.T.; Vo, D.V.N.; Ibrahim, H. Renewable hydrogen production via biological and thermochemical routes: Nanomaterials, economic analysis and challenges. Process Saf. Environ. Prot. 2023, 179, 68–88. [Google Scholar] [CrossRef]
  11. Hasanzadeh, R.; Abdalrahman, R.M. A regression analysis on steam gasification of polyvinyl chloride waste for an efficient and environmentally sustainable process. Polymers 2023, 15, 2767. [Google Scholar] [CrossRef]
  12. Schneider, S.; Bajohr, S.; Graf, F.; Kolb, T. State of the art of hydrogen production via pyrolysis of natural gas. ChemBioEng Rev. 2020, 7, 150–158. [Google Scholar] [CrossRef]
  13. Saeidi, S.; Sápi, A.; Khoja, A.H.; Najari, S.; Ayesha, M.; Kónya, Z.; Asare-Bediako, B.B.; Tatarczuk, A.; Hessel, V.; Keil, F.J.; et al. Evolution paths from gray to turquoise hydrogen via catalytic steam methane reforming: Current challenges and future developments. Renew. Sustain. Energy Rev. 2023, 183, 113392. [Google Scholar] [CrossRef]
  14. Budhraja, N.; Pal, A.; Mishra, R.S. Plasma reforming for hydrogen production: Pathways, reactors and storage. Int. J. Hydrogen Energy 2023, 48, 2467–2482. [Google Scholar] [CrossRef]
  15. Chen, W.H.; Biswas, P.P.; Ong, H.C.; Nguyen, T.B.; Dong, C.D. A critical and systematic review of sustainable hydrogen production from ethanol/bioethanol: Steam reforming, partial oxidation, and autothermal reforming. Fuel 2023, 333, 126526. [Google Scholar] [CrossRef]
  16. Rahman, M.Z.; Edvinsson, T.; Gascon, J. Hole utilization in solar hydrogen production. Nat. Rev. Chem. 2022, 6, 243–258. [Google Scholar] [CrossRef] [PubMed]
  17. IEA. Global Hydrogen Review; IEA: Paris, France, 2022; Available online: https://www.iea.org/reports/global-hydrogen-review-2022 (accessed on 8 July 2023).
  18. Carrera, E.; Azzaro-Pantel, C. A methodological design framework for hydrogen and methane supply chain with special focus on Power-to-Gas systems: Application to Occitanie region, France. Comput. Chem. Eng. 2021, 153, 107386. [Google Scholar] [CrossRef]
  19. Demirhan, C.D.; Tso, W.W.; Powell, J.B.; Pistikopoulos, E.N. A multi-scale energy systems engineering approach towards integrated multi-product network optimization. Appl. Energy 2021, 281, 116020. [Google Scholar] [CrossRef]
  20. Güler, M.G.; Geçici, E.; Erdoğan, A. Design of a future hydrogen supply chain: A multi period model for Turkey. Int. J. Hydrogen Energy 2021, 46, 16279–16298. [Google Scholar] [CrossRef]
  21. Kazi, M.K.; Eljack, F.; El-Halwagi, M.M.; Haouari, M. Green hydrogen for industrial sector decarbonization: Costs and impacts on hydrogen economy in Qatar. Comput. Chem. Eng. 2021, 145, 107144. [Google Scholar] [CrossRef]
  22. Shamsi, H.; Tran, M.K.; Akbarpour, S.; Maroufmashat, A.; Fowler, M. Macro-Level optimization of hydrogen infrastructure and supply chain for zero-emission vehicles on a canadian corridor. J. Clean. Prod. 2021, 289, 125163. [Google Scholar] [CrossRef]
  23. Reyes-Barquet, L.M.; Rico-Contreras, J.O.; Azzaro-Pantel, C.; Moras-Sánchez, C.G.; González-Huerta, M.A.; Villanueva-Vásquez, D.; Aguilar-Lasserre, A.A. Multi-objective optimal design of a hydrogen supply chain powered with agro-industrial wastes from the sugarcane industry: A Mexican case study. Mathematics 2022, 10, 437. [Google Scholar] [CrossRef]
  24. Yoon, H.J.; Seo, S.K.; Lee, C.J. Multi-period optimization of hydrogen supply chain utilizing natural gas pipelines and byproduct hydrogen. Renew. Sustain. Energy Rev. 2022, 157, 112083. [Google Scholar] [CrossRef]
  25. Wickham, D.; Hawkes, A.; Jalil-Vega, F. Hydrogen supply chain optimisation for the transport sector–Focus on hydrogen purity and purification requirements. Appl. Energy 2022, 305, 117740. [Google Scholar] [CrossRef]
  26. Ibrahim, Y.; Al-Mohannadi, D.M. Optimization of low-carbon hydrogen supply chain networks in industrial clusters. Int. J. Hydrogen Energy 2023, 48, 13325–13342. [Google Scholar] [CrossRef]
  27. Perna, A.; Jannelli, E.; Di Micco, S.; Romano, F.; Minutillo, M. Designing, sizing and economic feasibility of a green hydrogen supply chain for maritime transportation. Energy Convers. Manag. 2023, 278, 116702. [Google Scholar] [CrossRef]
  28. Forghani, K.; Kia, R.; Nejatbakhsh, Y. A multi-period sustainable hydrogen supply chain model considering pipeline routing and carbon emissions: The case study of Oman. Renew. Sustain. Energy Rev. 2023, 173, 113051. [Google Scholar] [CrossRef]
  29. Ora. Available online: https://ora.ai (accessed on 8 July 2023).
  30. Statista Search Department (24 February 2022) Hydrogen Consumption Worldwide in 2020, by Country. Available online: https://www.statista.com/statistics/1292403/global-hydrogen-consumption-by-country/ (accessed on 8 July 2023).
  31. OurWorldInData.org. Hannah Ritchie and Max Roser (2018)—“Plastic Pollution”. Available online: https://ourworldindata.org/plastic-pollution (accessed on 8 July 2023).
  32. Zheng, J.; Jin, Y.Q.; Chi, Y.; Wen, J.M.; Jiang, X.G.; Ni, M.J. Pyrolysis characteristics of organic components of municipal solid waste at high heating rates. Waste Manag. 2009, 29, 1089–1094. [Google Scholar] [CrossRef] [PubMed]
  33. Umeki, K.; Son, Y.I.; Namioka, T.; Yoshikawa, K. Basic study on hydrogen-rich gas production by high temperature steam gasification of solid wastes. J. Environ. Eng. 2009, 4, 211–221. [Google Scholar] [CrossRef]
  34. Jeong, Y.S.; Park, K.B.; Kim, J.S. Hydrogen production from steam gasification of polyethylene using a two-stage gasifier and active carbon. Appl. Energy 2020, 262, 114495. [Google Scholar] [CrossRef]
  35. Solak, A.; Rutkowski, P. The effect of clay catalyst on the chemical composition of bio-oil obtained by co-pyrolysis of cellulose and polyethylene. Waste Manag. 2014, 34, 504–512. [Google Scholar] [CrossRef] [PubMed]
  36. Hasanzadeh, R.; Mojaver, P.; Khalilarya, S.; Azdast, T. Air co-gasification process of LDPE/HDPE waste based on thermodynamic modeling: Hybrid multi-criteria decision-making techniques with sensitivity analysis. Int. J. Hydrogen Energy 2023, 48, 2145–2160. [Google Scholar] [CrossRef]
  37. Chen, J.; Fu, L.; Tian, M.; Kang, S.; Jiaqiang, E. Comparison and synergistic effect analysis on supercritical water gasification of waste thermoplastic plastics based on orthogonal experiments. Energy 2022, 261, 125104. [Google Scholar] [CrossRef]
  38. Nanda, S.; Okolie, J.A.; Patel, R.; Pattnaik, F.; Fang, Z.; Dalai, A.K.; Kozinski, J.A.; Naik, S. Catalytic hydrothermal co-gasification of canola meal and low-density polyethylene using mixed metal oxides for hydrogen production. Int. J. Hydrogen Energy 2022, 47, 42084–42098. [Google Scholar] [CrossRef]
Figure 1. Overview of the hydrogen energy production supply chain.
Sustainability 15 16813 g001
Figure 2. Map of Iran and its provinces, depicting the supply chain of hydrogen production.
Sustainability 15 16813 g002
Figure 3. Type of the built factories.
Sustainability 15 16813 g003
Figure 4. Raw material supply map for factories with gasification technology according to the output of the model: (a) supply of plastic waste, (b) supply of biomass, and (c) supply of coal.
Sustainability 15 16813 g004
Figure 5. Raw material supply map for factories with electrolysis technology according to the output of the model.
Sustainability 15 16813 g005
Figure 6. Raw material supply map for factories with steam methane reforming technology according to the output of the model.
Sustainability 15 16813 g006
Figure 7. View of the transfer of hydrogen fuels from production sites to storage locations according to the output of the model: (a) liquid fuel transfer map and (b) gas fuel transfer map.
Sustainability 15 16813 g007
Figure 8. Map of the transfer of hydrogen fuels from the storage locations to the demand locations according to the output of the model: (a) liquid fuel transfer map and (b) gas fuel transfer map.
Sustainability 15 16813 g008
Figure 9. Sensitivity analysis diagram of the general model according to the type of parameters and outputs for 5% (a) decrease and (b) increase in parameters.
Sustainability 15 16813 g009
Figure 10. Sensitivity analysis diagram of the overall model according to scenarios and outputs.
Sustainability 15 16813 g010
Figure 11. Raw material (plastic waste) supply map for factories with gasification technology according to the output of the model.
Sustainability 15 16813 g011
Figure 12. Map of the transfer of hydrogen fuels produced with gasification technology from the storage locations to the demand locations according to the output of the case study model: (a) liquid fuel transfer map and (b) gas fuel transfer map.
Sustainability 15 16813 g012
Table 1. Comparison of recent research studies related to the supply chain of hydrogen energy production.
RefObjective FunctionMethodSolverTechnologyFeedstockStorageTransportCase Study
[7]Minimize cost and emission of greenhouse gas emissionsMILPGAMSSteam methane reforming, electrolysisNatural gas, solar, wind, electrical networkStorage facilityTanker truckRegion of Oceania and France
[8]Minimize total costMILPGAMSElectrolysis, methane pyrolysis, auto thermal reforming of methaneNatural gas, solar, air, water, wind, energyStorage facilityTrain, trucksTexas
[9]Minimize total costMIPPythonSteam methane reforming, electrolysis, gasificationNatural gas, coal, biomass, solar, wind, hydroelectric, geothermalStorage facilityTanker trucks, railways, tank carsTurkey
[10]Minimize total costMILPGAMS/IBM ILOG CPLEXElectrolysisWaterStorage facility for gas and liquidTransportation vesselsNational
[11]Minimize costMILPGAMSElectrolysisWaterCascade storageTube trailerCanada
[12]Maximize annual profit and minimize greenhouse gas emissionsMILPGenetic algorithm, TOPSISElectrolysisWaterSpherical tankTanker truckMexico
[13]Minimize total costMILPIBM ILOG CPLEXSteam methane reforming, gasification, electrolysisCoal, biomass, water, natural gas, wind, solarBulk tanks for liquid, compressed gasTruck, pipelineSouth Korea
[14]Minimize total costLPGAMSSteam methane reforming, electrolysisSolar, wind, electricity, fossil fuelBulk storage, cascade storageTruck, pipelineUnited Kingdom
[15]Minimize total cost and CO2 emissionsMILPLINDOSteam methane reforming, electrolysisWater, electricity, natural gas, and biomassStorage facility gas and liquidTruck, pipeline, ship vesselQatar
[16]Minimize size of the plantBlack box optimizationSimulation codeElectrolysisWater, solarStorage tank-National
[17]Minimize total cost and CO2 emissionsMIPRAD studio-11.3 softwareSteam methane reforming, gasification, electrolysisCoal, biomass, waterGround tank, salt cavernTrucks, tube trailers, pipelinesOman
This studyMinimize total costMIPGAMSSteam methane reforming, gasification, electrolysisCoal, biomass, water, natural gas, plastic wasteStorage facilityTrucks, tube trailers, pipelines, trainIran
Table 2. Indices and parameters.
Indices
iSet of type of feedstock resources: plastic waste, biomass, coal, water, natural gas/i1–i5
jSet of candidate locations for hydrogen production centers/j1–j30
sSet of suppliers for supplying feedstock/s1–s30
rSet of used technology methods for hydrogen production: gasification, steam methane reforming, electrolysis/r1–r3
nSet of transport method: truck, tube trailer, pipeline, train/n1–n4
pSet of hydrogen type: gas and liquid/p1–p2
eSet of candidate locations for hydrogen storage centers/e1–e30
lSet of volume of hydrogen production centers/l1–l3
kSet of hydrogen demand locations /k1–k30
Parameters
f r l j Fixed cost of opening hydrogen production center in location (j) with technology (r) and capacity (l)
f 1 p e Fixed cost of opening hydrogen storage center in location (e) with hydrogen type (p)
a i s j Cost of imported feedstock type (i) supplied by supply center (s) to hydrogen production center (j)
b p j r Unit production cost of hydrogen at hydrogen production center (j) with hydrogen type (p) and technology (r)
c p j n e Transportation cost of produced hydrogen from hydrogen production center (j) to hydrogen storage center (e) with transport method (n) and hydrogen type (p)
g p e n k Transportation cost of stored hydrogen from hydrogen storage center (e) to customer center (k) with transport method (n) and hydrogen type (p)
d p k Demand of hydrogen at customer center (k) with hydrogen type (p)
α i r p Conversion factor of produced hydrogen amount from feedstock amount and technology
C a i s Capacity of imported feedstock type (i) supplied by supply center (s)
C a 1 p j r l Capacity of produced hydrogen in hydrogen production center (j) with capacity (l) and technology (r) and hydrogen type (p)
C a 2 p j n e Capacity of produced hydrogen transported from production center (j) to hydrogen storage center (e) with hydrogen type (p) and transport method (n)
C a 3 p e n k Capacity of stored hydrogen transported from hydrogen storage center (e) to customer center (k) with hydrogen type (p) and transport method (n)
C a 4 p e Capacity of stored hydrogen in hydrogen storage center (e) with hydrogen type (p)
Binary decision variable
x r l j 1 if location (j) with capacity (l) and technology (r) is selected for opening hydrogen production center; otherwise, 0
x 1 p e 1 if location (e) with hydrogen type (p) is selected for opening hydrogen storage center; otherwise, 0
Continuous decision variable
y i s j Amount of transported feedstock type (i) supplied by supply center (s) to hydrogen production center (j)
u p j r Amount of produced hydrogen at hydrogen production center (j) with hydrogen type (p) and technology (r)
w p j n e Amount of produced hydrogen transported from production center (j) with hydrogen type (p) and transport method (n) to hydrogen storage center (e)
v p e n k Amount of stored hydrogen transported from hydrogen storage center (e) with hydrogen type (p) and transport method (n) to customer center (k)
Table 3. Summary of the output of the general model in GAMS software.
ObjectiveTotal Costs Minimize
ModelHydrogen supply chain
TypeMIP
Model statusInteger Solution
SolverCPLEX
Solver statusResource interrupt
Relative gap0.009
Total time50,400 s
Total costIRR 96,606,774,614,590 = USD 193,213,549.22
Construction costIRR 66,262,584,587,213 = USD 132,525,169.17
Demand capacity26364 ton
Price per kilogramIRR 3,664,344 = USD 7.32
Production9 Units
Storage17 Units
Table 4. Production and storage locations considered according to the model output.
Locations (Provinces)ProductionTechnologyCapacityProduction Size (Ton) for Gaseous StateProduction Size (Ton) for Liquid StateStorageStorage KindStored Size for Gaseous StateStored Size for Liquid State
1-----Gaseous955-
3GasificationLevel 316001400Both729986
5SMRLevel 220001600Both8801000
8-----Both10001000
9GasificationLevel 315721400Both700550
11ElectrolysisLevel 1800700Both8721000
14-----Gaseous923-
15GasificationLevel 1400380Both1000902
19-----Liquid-1000
21-----gaseous1000-
22GasificationLevel 316001400Both10001000
24-----Liquid-1000
25ElectrolysisLevel 328892625Both10001000
26GasificationLevel 316001400Both10001000
27-----Both10001000
29-----Gaseous1000-
30GasificationLevel 315981400Both1000867
Table 5. Scenarios considered for the supply chain.
Description
MainThe normal state of the problem
Scenario 1Inflation and increases in the cost of labor and construction materials and the cost of production in the next few years
Scenario 2Reducing the amount of fossil fuels and limiting them and reducing some raw petroleum materials and increasing the cost of raw materials, increasing the cost of transportation, land drought and water depletion, increasing the amount of plastics over time, increasing demand due to the reduction in fossil fuels
Scenario 3Advancements in technology and increase in production rate, discovery of production potentials and increases in production and storage
Scenario 4Obtaining and using a sustainable and renewable energy except for hydrogen energy and reducing the demand for hydrogen energy, increasing petroleum raw materials, and making transportation costs cheaper
Table 6. Summary of the output of the master case model in the GAMS software.
ObjectiveTotal Costs Minimization
ModelHydrogen gasification supply chain
TypeMIP
Model statusOptimal
SolverCPLEX
Solver statusNormal completion
Relative gap0
Objective valueIRR 92,276,300,287,500 = USD 184,552,600.575
BuildingIRR 66,191,215,085,674 = USD 132,382,430.17
Demand capacity22,074 Ton
Price per kilogramIRR 4,180,316.2 = USD 8.36
Number of production centers8 Units
Number of storage centers12 Units
Table 7. Amount of production in the selected production sites and how it is transferred to the storage locations according to the model output.
LocationsCapacityProduction Size (Ton) for Gaseous StateProduction Size (Ton) for Liquid StateGaseous State Sent to Storage Center and Method
Transportation
Liquid State Sent to Storage Center and Method
Transportation
Tube TrailerTruckTube TrailerTruck
3Level 316001250E3, E19, E24, E26E3, E24E3, E24, E26E3, E24
5Level 316001550E5, E19, E25E5, E19, E25E5, E19, E25E5, E19, E25
9Level 31379550E9, E11, E26, E30E9, E11E9E9
11Level 2800800E11, E26E11E11, E26E11, E26
22Level 316001550E8, E18, E22, E30E8, E22E8, E22, E30E8, E22, E330
25Level 316001600E5, E18, E19, E25E5, E18, E19, E25R5, E8, E19, E25, E26E5, E19, E25
26Level 316001554E3, E18, E24, E26E3, E18, E24, E26E3, E11, E24, E26E3, E11, E24, E26
30Level 316001441E8, E9, E18, E22, E25, E30E8, E22, E30E8, E9, E22, E30E8, E22, E30
Table 8. Amount of storage in the selected storage sites and kind of storage.
Locations35891118192224252630
Storage kindBothBothBothBothBothGaseousBothBothBothBothBothBoth
Stored size for gaseous state9911000100078810001000100010001000100010001000
Stored size for liquid state78810001000641866-100010001000100010001000
Disclaimer/Publisher’s Note: The statements, opinions and data contained in all publications are solely those of the individual author(s) and contributor(s) and not of MDPI and/or the editor(s). MDPI and/or the editor(s) disclaim responsibility for any injury to people or property resulting from any ideas, methods, instructions or products referred to in the content.

