1. Introduction
As a populous country with scarce per capita resources, China has spent nearly half a century endeavoring to make the growth rate of grain output eventually exceed that of its population. Since the end of the 20th century, when the problem of hunger was completely eradicated, China has entered a new era, with green agricultural development as its new mission. The National Green Development Initiative (NGDI) began at the turn of the century with the “Grain for Green” program, which aimed to convert sloped farmland to forest (grass) [
1]. The NGDI in agriculture has advanced since the mid-2010s, as evidenced by China’s Ministry of Agriculture and Rural Affairs (MARA), which released a zero-growth plan for chemical use by 2020 [
2] in 2015 and subsidy programs for farmland rotation, fallow conservation and the recovery of degraded land [
3] in 2016. The most significant movement was then the State Council’s call in 2017 to promote green agricultural development through the establishment of institutions and incentive systems [
4], which was followed by the release of the Technical Guidelines for Green Agricultural Development in 2018–2030 [
5]. Moving towards greener agriculture has now officially become a national strategy, with MARA and five other ministries releasing the 14th Five-Year Plan for Green Agricultural Development (2021–2025) [
6].
There appears to be a trade-off between green agriculture and grain productivity, as evidenced by the decelerating cereal yields in some European regions after moving to green agriculture [
7]. For China, with its large population and scarce per capita resources, greener agriculture should not come at the expense of grain productivity. In other words, ensuring the security of grain supply through sustained productivity growth, which has always been regarded as a cornerstone of political stability, takes precedence over a green agriculture strategy [
8]. Under the call “Chinese people’s rice bowls should be filled with Chinese-produced food”, the Chinese Government has instructed party committees and governments at all levels to share responsibility for increasing food productivity within their jurisdictions [
8], with policy priorities tilted towards staple food grains and the country’s major grain-producing areas. To this end, following the State Council’s release of a special plan to create an additional 100 billion jin (jin, the Chinese unit of measurement for the weight of agricultural products, with 1 jin = 0.5 kg) of grain production capacity in 2009, the No. 1 Document of the CPC Central Committee in 2023 proposed the implementation of a new round of action to enhance the grain production capacity by another 100 billion jin [
9]; as such, a core task involves increasing the yields of staple grains, especially in the main grain-producing regions. As a result, Chinese agriculture has long faced a dual mission: to enhance grain productivity as a mandatory task and then to strive for green development. While exploring win–win possibilities and measures able to achieve these dual objectives is an important topic in academic and policy circles [
10,
11,
12], there are few regional empirical studies that assess dual performance.
Considering the notion that “science and technology are the primary productive forces”, in the past, China witnessed government-led agricultural scientific and technological innovation (STI) to address the problem of hunger; for instance, owing to breakthroughs like hybrid rice varieties and their large-scale application among farmers, the nation still aspires to make agriculture greener by leveraging the power of STI. Given the much-criticized disconnect between the supply of technology and farmers’ needs, the so-called dichotomy of government-led STI in practice between research and development (R&D) and its application [
13], clear policy guidance indicators that demonstrate the respective roles of R&D and its application in STI systems when promoting green agriculture are required. The most popular tool for measuring economic growth, the DEA-based Total Factor Productivity (TFP) Index, can indicate performance changes and identify the sources related to production technology; these are technological change (TC) and technological efficiency change (EC) [
14,
15,
16], which roughly correspond to R&D and its application components, respectively. The tool has been extensively employed in regional empirical studies owing to its policy value [
17,
18]. There has been much academic and policy interest in exploring China’s agricultural growth in the context of market-led economic reforms via the introduction of this tool [
19,
20,
21], as well as the regional heterogeneity of agricultural productivity changes [
22,
23]. Green development in agriculture has attracted a new wave of research [
24,
25], with much of the research focusing on how Green Total Factor Productivity (GTFP) [
26,
27,
28] might be measured and its drivers explored [
29,
30,
31]. To date, few studies have investigated the sources of such green productivity growth from the perspective of an STI system with Chinese characteristics, which is the policy value of the tool.
This study aims to explore two major challenges facing Chinese agriculture: whether the two strategic tasks of green agriculture and grain security can be achieved in tandem; and how STI can drive greener agriculture under the mandatory task of increasing grain productivity. Given that an increasing per-hectare grain yield is the mandatory indicator for grain security in a densely populated country, this study introduces the GTFP Index and improves it into a Green Growth Rate indicator using its two completely decomposed terms, which allows the dual performance dynamics of the agricultural production system in one coordinate system to be juxtaposed and compared. In this way, we selected a major grain-producing province in the most economically developed region to monitor its agricultural progress in relation to the dual strategies. The study found that the provincial agriculture performance was generally good, but that there was significant regional heterogeneity between the main grain-producing and grain-marketing zones. For much of the study period, the movement of the green technology frontier, led by the best practitioners, was the main cause of fluctuations in green agriculture in most regions. Our study contributes to the existing literature in two ways: first, it refines the GTFP Index into a Green Growth Rate indicator and decomposes it completely into two technology-related factors. This allows the green growth system to be placed in a coordinate system alongside growth in grain productivity, so that the performance dynamics of the dual agricultural strategies can be visualized and compared, and so that the sources of green agricultural growth can be traced directly. Second, it presents analytical perspectives that incorporate China’s agricultural policy context, including understanding the technology-related factors that constitute green growth in light of China’s agricultural R&D and extension system, and explores the regional heterogeneity in agricultural productivity growth in terms of grain production and marketing zoning policies.
2. Methods and Materials
2.1. Study Region
Jiangsu Province is located in the northern part of the Yangtze River Delta (YRD), which is the most economically developed and populous region in China. It spans five latitudes from south to north, and its 13 municipalities are grouped into 3 subregions according to their proximity to the economic core of the YRD: southern Jiangsu, central Jiangsu and northern Jiangsu (
Figure 1). Its predominantly plain topography and dense population have made Jiangsu a nationally renowned region for intensive high-yield agriculture. With advancements in modernization, Jiangsu’s agriculture has experienced a shift in its production mode, with capital (including chemical fertilizer inputs) replacing labor; there was also once an unsustainable trend of intensive high yields [
32], exemplified by the fact that the intensity of fertilizer use in Jiangsu was once much greater than the national average [
2,
33].
As the only remaining grain-producing province in the developed southeastern coastal region of China, Jiangsu not only contributes financial resources but also grains to the nation. Higher grain yields have always been a main priority for Jiangsu’s agriculture, since there is no more room for the grain area to expand in such an economically developed region with limited arable land, where grain production itself does not have the advantage of comparative economic returns. In terms of the self-sufficiency balance of grain between production and consumption, Jiangsu’s status as a major grain-producing province relies mainly on the relatively arable land-rich areas of central and northern Jiangsu, while southern Jiangsu has become the main grain marketing area. With sufficient financial resources and advanced technological advantages, Jiangsu seeks to become a model for simultaneously achieving greener agriculture and higher grain yields. As such, Jiangsu is a good empirical region with which to demonstrate how a green transition might be achieved via technological innovation under the mandate of increasing grain productivity.
2.2. Calculation of Green Growth Rate in Agriculture and Its Decomposition Terms
Green growth in agriculture refers to the process of increasing green productivity by actively incorporating innovative elements, such as cutting-edge green technologies, that can minimize resource consumption and environmental damage while maximizing agricultural outputs. The most commonly used tool for calculating this productivity is the Total Factor Productivity (TFP) method, which is based on Data Envelopment Analysis (DEA) with the distance function [
14]. The DEA–Malmquist Productivity Index (MI) was designed to measure productivity growth over time, as well as its two production-technology-related terms, namely, technical change (TC) and technical efficiency change (EC). Changing TFP (TFPC) is the product of TC and EC, as shown in its well-known formula:
[
15].
The Malmquist–Luenberger Productivity index (MLI), upgraded from the MI, incorporates undesired environmental outputs into the Directional Distance Function (DDF) [
34], which makes it possible to monitor the dynamics of green TFP (GTFP). DDF represents a green production technology that maximizes the desired output while reducing the undesired output. The change in GTFP represented by the DEA-MLI also has two decompositions, which represent green technical change and green technical efficiency, respectively. The MLI measures the GTFP change between the previous year
t − 1 and the current year
t (
), but this study needs to measure it in a rate-of-change form as
to denote the dynamics of Agricultural Green Growth (AGG) in percentages.
When converting the TFPC to its rate-of-change form, the multiplication relationship between its two decomposition terms, TC and EC [
15], can be converted into a summation relationship between the rate-of-change forms of the two terms. Our derivation still begins with that famous multiplication formula:
One component of TFPC is TC (
), representing the green technological frontier transfer from the year
t − 1 to the year
t. A value greater than 1 indicates innovation between the two periods, i.e., green technological progress (innovation) led by best practitioners; this implies advances in agricultural R&D and the realization of cutting-edge technologies in demonstration sites. The other component, EC (
), reflects the proximity to the green production frontier; a value greater than 1 indicates that the production unit is catching up compared to the previous year (catch-up) [
15]; this is associated with the diffusion of green technologies, i.e., cutting-edge technologies are applied by production laggards.
Substituting Equations (3)–(5) into Equation (1) yields the following equation:
Thus, AGG consists of the rate-of-change forms of TC and EC, which are the two decomposition terms of TFPC. The last term on the right-hand side in Equation (6) is co-created by TC and EC, whose contributions to AGG are calculated as follows according to the “co-creation and equal sharing” rule [
35]:
AGG is therefore completely decomposed into two factors related to STI: the frontier movement effect (TCeffect) and the catch-up effect (ECeffect). The performance dynamics of the agricultural production system are then interpretated using the agricultural green growth rate (AGG, as a percentage) and its two contributing factors (TCeffect and ECeffect, also in percentages), along with the growth rate of grain yields (GYG, as a percentage) as a proxy variable for changes in grain productivity.
2.3. Design of Indicator Sets for Green Growth in Agriculture
AGG was originally calculated using MLI as a proxy variable for GTFPC, measured for agricultural production systems with well-defined input–output relationships. In this study, the boundary of the agricultural production system is defined as an arable cropping system with 8 inputs: (1) sown area of crops (103 hm2); (2) effective irrigated area (103 hm2); (3) labor force (103 persons); (4) mechanical power (103 kwh); (5) chemical fertilizer (t); (6) chemical pesticide (t); (7) agricultural film (t); and (8) diesel fuel (t).
Considering that low-carbon agriculture is a key strategy for green growth [
36], the three outputs include (1) the agricultural output value (10
6 CNY), as well as two carbon-related indicators: (2) carbon sink (10
4 t) and (3) carbon emissions (undesired) (10
4 t). Agricultural carbon sinks are measured according to the biomass production of regional crops and their corresponding carbon sequestration coefficients [
37]. Major crops that appear in the agricultural statistics include wheat, rice, maize, soya beans, potatoes, peanuts, canola, cotton, hemp, vegetables and melons. Carbon emissions in this study include the major carbon cost items (fertilizers, pesticides, plastic film and diesel fuel in tons, and electricity in kwh), as well as rice cultivation, irrigation and the ploughing of land, with the total emissions still measured using the respective inputs and their corresponding emission factors [
38,
39].
2.4. Data Sources and Preprocessing
This study took 13 municipalities of Jiangsu Province as the evaluation unit, and 2000–2020 were the sample years used for observations. The data of relevant indicators used for the calculation of grain yields and GTFP, including agricultural carbon sinks and carbon emissions, were all taken from the Rural Statistical Yearbook of Jiangsu Province for the corresponding years. Among them, the annual output value data were deflated according to the price index of relevant items based on the base year of 2000 for comparability.
The multi-year average AGG (as a percentage) across regions and time periods was calculated from the GTFPC in Equation (2), which was taken from the geometric mean of the MLI measurements for the relevant region and relevant year. In addition, MaxDEA 7.0 software was used in the linear programming solution [
40] and an output-oriented global MLI was chosen, owing to it being free from linear programming infeasibility, which plagues the sequential MLI [
41,
42].
The multi-year average GYG (as a percentage) was calculated with the power function in Microsoft Excel 2019, according to the general algorithm for the compound annual growth rate. To eliminate fluctuations in grain yields due to climatic and other factors, the values of grain yields for the base and end years were preprocessed as three-year averages. Missing values in the statistical yearbook were supplemented with data using trend extrapolation.
3. Result and Analysis
3.1. Overview of Trends in Agricultural Inputs and Outputs
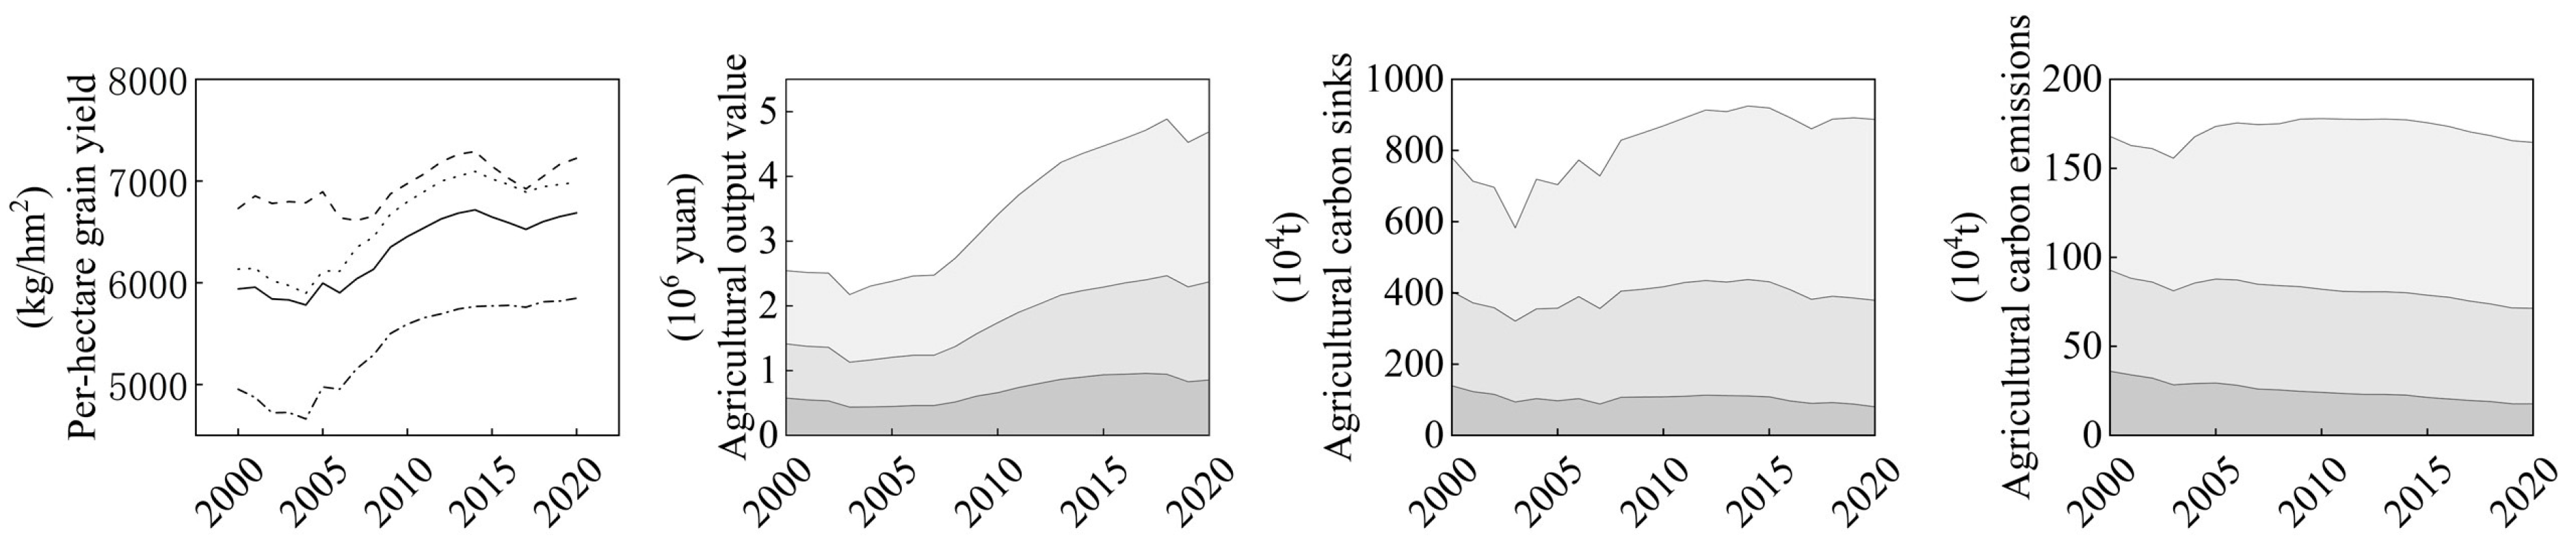
As a grain security mandatory indicator, the per-hectare grain yield is to some extent recognized as the desired output of agricultural production. From 2000 to 2020, the grain yields in Jiangsu exhibited a stable and then increasing trend, hovering at a high level after 2015 (
Figure 2). Southern Jiangsu had the highest level of grain yields but the lowest increase in yields, with a 20-year average growth rate of 0.34%; northern Jiangsu had the lowest average yields but the highest average growth rate of 0.70%. For the three output indicators of the agricultural system, significant increases in the economic output of the province’s plantation sector had recently stalled, with increases in the north appearing to be higher than those in the south. Agricultural carbon sinks, as another desired output, experienced a fluctuating upward and then relatively stable process, and the increase in northern Jiangsu still seemed to be more evident. Agricultural carbon emissions, as the only undesired output item in this study, first fluctuated and then stabilized, with an overall decline of 4.23% over the whole period and a more pronounced decrease in southern Jiangsu (
Figure 2).
In terms of agricultural inputs, the province’s crop sown area and effective irrigated area, which represent the inputs of arable land and water resources, were relatively stable during the study period, with a clear trend of expansion in the north and shrinkage in the south. The most notable change in agriculture during this period was the increasing machinery power, accompanied by a decreasing labor force. Regarding agrochemical usage, diesel fuel and agricultural film use generally increased and remained relatively stable after mid-2010, while fertilizer use continued to decline steadily from a high level; pesticide use declined overall, peaking in 2005 and continuing to decline (
Figure 3).
In short, since the beginning of the 21st century, Jiangsu’s agriculture has undergone at least two major changes while fulfilling the national grain security mandate: one is the advancement of large-scale production, manifested in a stable sown area, that has increased mechanical power but decreased manpower, implying the commencement of an era of “machine for labor”; the other is the green development tendency, which is evidenced by the reduced use of agricultural chemical inputs from a high level while maintaining a higher economic output.
3.2. Phasing of Provincial Agriculture towards “Green with Grain” Growth
The annual rates of AGG and GYG in Jiangsu showed common fluctuations in most years. Based on the magnitude and direction of the AGG and GYG fluctuations (
Figure 4), the entire study period can be divided into the following three phases, corresponding to different periods of agricultural policy:
Phase I (2000–2008) coincided with China’s transition from market-led to policy-supported agriculture. With China’s accession to the World Trade Organization (WTO) in 2001, a strategic restructuring of agriculture oriented towards market competitiveness was initiated at the turn of the century. This was followed by successive slumps in grain production from 2000 to 2003 [
43], resulting in a lack of self-sufficiency in grain. China then implemented a series of policies to support agriculture from 2004 onwards; it thus entered a new era of subsidizing farmers rather than taxing them as it had done in the past 2000 years. In this context, agricultural productivity in Jiangsu has been subject to large fluctuations and frequent anomalies, most notably in the period prior to the introduction of agricultural support policies, such as AGG backward and GYG forward (2000–2001), and double declines in AGG and GYG (2001–2002, 2002–2003). Taking the 2004 policy intervention as the cut-off point, GYG and AGG moved from a rare trend of downward or negative growth to both oscillating upward. During this stage, the annual rate of AGG transitioned from negative to positive, mainly due to the backward and upward movement effect of the green technology frontier in TC.
Phase II (2008–2015) was the period in which China continues to implement its agricultural support policies. The surge in international grain prices in 2007–2008 triggered concerns regarding a nationwide grain crisis [
44]; coupled with the 2008 international financial disaster, China further consolidated its agricultural support and protection system, and accelerated productivity-enhancing investments and producer subsidy programs. Jiangsu Province has strong financial and S&T resources to support agriculture, and AGG and GYG have shown successive years of growth, although the rate of green transition has gradually slowed down in later years. AGG in this stage mainly came from the advancing effect of the green technological frontier, and the effect of catching up with the technological frontier tended to stagnate, which in some years manifested itself as a constraint on green growth.
Phase III (2015–2020) is the period under China’s supply-side structural reform of agriculture. Market interventions to raise farmers’ incomes and yields resulted in a serious “structural problem” in supply and demand. Supply-side structural reform under the strategy of “Store Grains in Technology” and “ Store Grains in Land” was initiated in 2015. Agricultural environmental programs, such as zero growth in the usage of fertilizers and pesticides, are widely promoted across the region, and southern Jiangsu has taken the lead in promoting the reform of the cropping system in the rice–wheat rotation area, shifting to rice–green rotation [
45]. This phase also saw turbulence in AGG and GYG, such as a double dip in 2015–2016, while GYG rose and AGG fell in 2016–2017 and 2018–2019. The province’s AGG has not maintained a sustained upward trend, mainly due to upward and downward fluctuations in TC and EC.
3.3. Regional Heterogeneity in Agricultural Growth for “Green with Grain”
In terms of the annual rate of change, the AGG in Jiangsu is significantly more volatile than that of the GYG (
Figure 4), but in terms of the multi-year average rate during 2000–2020, the AGG is relatively stable (0.49%) and lower than the GYG (0.63%), as shown in
Table 1. During the whole period, AGG is mainly driven by technological progress (0.53%), and the effect of technical efficiency (−0.04%) is weak. The average rate of AGG during 2000–2020 in northern Jiangsu remained higher than that of southern Jiangsu. AGG in northern Jiangsu is mainly supported by both TC and EC, while that in southern Jiangsu is mainly supported by TC. Central Jiangsu has the weakest AGG, mainly because the forward effect of TC is attenuated by the backward effect of EC.
As evidenced by the phase-by-phase change, GYG in northern Jiangsu maintained a continuous upward trend, with the strongest growth in phase II. Over the same period, AGG shifted from a regression in phase I to a rebound in phase II; this was determined by the TC effect from regression to progress. AGG accelerated again in phase III, owing largely to the improvement in EC. It can be observed that northern Jiangsu, as the largest grain-producing area, also has the most outstanding performance with regard to green growth in subregional agriculture.
The phase changes in AGG and GYG in central Jiangsu, which is also a major grain-producing area, are roughly similar to those in northern Jiangsu, except that the magnitude of change is not as large as that in northern Jiangsu. The negative average growth of AGG in phase I was caused mainly by a relative decline in EC, while the growth in phase II was driven by TC, with EC still lagging relatively behind; in addition, the sustained growth in phase III was driven by a combined contribution of TC and EC.
Southern Jiangsu, as the main grain-marketing area incapable of grain self-sufficiency, has very different characteristics regarding agricultural growth. In the first stage of the structural–strategic adjustment period, the decline in GYG in the region was accompanied by a decline in AGG caused by the negative influence of TC, implying that the region abandoned agricultural growth at that time; however, in phase II, both AGG and GYG stabilized and reversed into a rising trend; this was particularly evident in the high-speed rise in AGG brought about by rapid advancements in the green technological frontiers. In phase III, although GYG continued to rise at an accelerated rate, AGG reversed to a downward trend, which mainly stemmed from the regression of both TC and EC.
3.4. Performance Changes in Municipal Agriculture for “Green with Grain” Growth
In terms of the average growth rate during 2000–2020, all 13 municipalities had a stable or rising GYG, implying a good performance with regard to the grain security mandate. Agriculture in 11 municipalities achieved green growth through the contribution of TC (
Figure 5), suggesting that they are on a synergistic track of grain and green co-growth.
Although the average AGG for the entire period in the southern Jiangsu region is relatively low (
Table 1), the municipalities in southern Jiangsu, except Changzhou, have an average AGG of more than 2%. The apparent decrease in AGG in Changzhou stems from its significant decline in EC, which implies that the technology laggards are not endeavoring to catch up with the green technological frontiers, despite the fact that the green technology frontiers continue to develop at a rapid pace. The AGG in northern Jiangsu shows an overall upward trend, with Xuzhou and Suqian showing higher rates; the former is mainly due to the contribution of TC, and the latter is due to the joint promotion of TC and EC. The AGG of all three municipalities in central Jiangsu is mediocre, with Yangzhou’s AGG stagnating due to the stagnation of both TC and EC.
In the recent phase (2015–2020), GYG mostly decelerated and exhibited a small decline, while AGG showed a clear north–south divergence. Northern Jiangsu is in a better situation for agricultural growth, with its GYG and AGG generally rising; except for Yancheng, agriculture at the municipal level was on an accelerated green growth trajectory. Yancheng’s weaker AGG mainly stems from the retreat of the greening technology frontier, but its catch-up effect remains strong. Suqian’s AGG is mainly supported by the catching-up effect, while the other three municipalities owe their AGG to the frontier movement effect, relative to the baseline of advanced technology in the region as a whole (
Figure 5). The situation of southern Jiangsu in this phase seems to be the most severe, with AGG in a state of general stagnation or even regression. Among them, Nanjing’s GYG and AGG were in full stagnation; Suzhou, Wuxi and Zhenjiang’s AGG were also declining due to the regression of the technological frontier; and Changzhou’s regression was the largest, with its AGG, TC and EC components in full decline, along with the decline in GYG. Central Jiangsu has a tendency to follow in the footsteps of southern Jiangsu, with Yangzhou and Taizhou stagnating in AGG and its two components while GYG rose; Nantong’s GYG declined while AGG tended to rise, which stems mainly from the combined advancement of EC and TC.
5. Conclusions and Research Limitations
5.1. Conclusions
This study uses productivity growth indicators to evaluate the performance of Chinese agriculture when implementing a green development strategy, with grain security as a mandatory goal. Along with the growth rate of grain yields, which is the core performance indicator for the grain security mandates, an improved green growth rate indicator based on the DEA-ML index is introduced to identify sources of green growth in agriculture. Jiangsu, a major grain-producing province in China’s economically developed region, was selected as the observation region. It was found that provincial agriculture has largely achieved grain–green co-growth during the 2000–2020 period. However, there were differences within the province; for northern Jiangsu, which is a major grain-producing zone, the average rate of agricultural green and grain growth was relatively high, and changes were relatively stable with the phased adjustment of agricultural policies. Meanwhile, for southern Jiangsu, which is the main grain-marketing zone, there have been phased fluctuations in the grain and green growth rate, and a generally negative green growth rate during the agricultural green movement. The advancements in the green technology frontier led by the best practitioners mainly contribute to agricultural green growth at various spatial levels.
Based on these findings, it is recommended that policies focus on the catch-up effect; this requires innovations in the government-led agricultural extension system and a market-oriented transformation in the agricultural STI system to enhance the diffusion of cutting-edge green technologies to the laggards. In response to the failure of certain agricultural green campaigns in southern Jiangsu to generate green growth, it is suggested that policies such as arable land fallow restoration, which may reduce production capacity, should be used with caution in high-quality agricultural zones; however, it is also proposed that green growth measurement tools such as GTFP still need to be enhanced.
5.2. Research Limitations
The limitations of this study are that the growth of green productivity in agriculture is only considered using the two main decompositions (TC and EC) of the GTFP index; EC can be further decomposed into pure technical efficiency and scale efficiency, but due to thematic constraints, these two decompositions are not analyzed in depth in this study. In addition, we only explored the internal factors related to production technology that cause fluctuations in the rate of green growth in agriculture, while the external policy context that leads to fluctuations has only been explored at the discursive level and has not been validated using modeling; other contextual factors that may affect green productivity, such as the construction of high-standard farmland, have also not been explored in this study. Finally, only one single-factor productivity indicator, namely, the per-hectare grain yield, was selected to evaluate the grain productivity, and the coupling between the two major productivity growth systems, “grain and green”, was not quantitatively analyzed. These are directions for further research.


