1. Introduction
Under the new situation of increasingly severe dual challenges in economic transformation and ecological environment protection, the synergistic development of digitalization and greenization has become an important trend in the economic development of countries around the world and plays an important role in innovation and leadership for high-quality and sustainable economic development. The development of digitalization provides powerful technical means for improving resource utilization efficiency and ecological environment supervision ability, predicting future environment and climate change, and realizing the intelligent measurement and control of energy, as well as optimizing scheduling; the development of green technology and green industries can provide renewable energy and clean production methods for digital development. The deep integration of digitalization and green low-carbon industries has brought a rare historical opportunity to accelerate traditional industries’ digitalization and green transformation.
In recent years, China has attached great importance to the digitalization and greenization development of its economy and society and has taken “deepening the construction of green, intelligent, and ecological civilization, and promoting the synergistic development of digitalization and greenization” as an important measure of its economic development strategy in the new era. In September 2020, China officially proposed at the 75th United Nations General Assembly that it would strive to achieve a carbon peak by 2030 and carbon neutrality by 2060. China promulgated the National Informatization Plan for the 14th Five-Year Plan in December 2021, which proposed that accelerating digitalization and the construction of a digital China is not only an intrinsic requirement for adapting to the new situation, grasping the new opportunities, and building a new advantage, but also an important measure for practicing the new concepts, advancing high-quality development, building a new pattern, and shaping the key initiatives and inevitable choice of a modernized economic system; the application of digitalization to empower the development of the green economy is an important direction for promoting the digitalization and greenization development of the economy and society [
1]. In July 2022, the China Academy of Information and Communication Technology (CAICT) released the “China’s Digital Economy Development Report (2022)”; China’s digital economy scale in 2021 reached CNY 45.5 trillion, the scale of digital industrialization reached CNY 8.4 trillion, and the scale of industrial digitalization reached CNY 37.2 trillion, accounting for 32.5% of GDP [
2]. From this, it can be seen that China’s digital industrialization and industrial digitalization are entering a stage of rapid development, and the green low-carbon economy and digital economy are becoming two new powerful engines to promote China’s economic and social development.
The synergistic development of digitalization and greenization is an important path to achieving high-quality and sustainable development, which can not only meet people’s needs for a good living environment but also help realize the consensus and goals of the international community on environmental sustainability. In practice, China has made the synergistic development of digitalization and greenization an important part of its national development strategy and has introduced a series of incentive policies and regulations, including tax breaks, subsidies, and incentive programs, to promote the integration of digitalization and greenization and to achieve a win–win situation for economic growth and environmental protection through the application of digital technology and the guidance of green development. Since January 2023, comprehensive experiments have been carried out in many regions to promote the collaborative transformation and development of digitalization and greenization, further promoting the accelerated development of digitalization and greenization synergistic development.
Against this backdrop, significant progress has been made in the current status of digitalization and green development in the eastern and central regions of China. As one of the most economically developed and open regions in China, the eastern regions have already achieved a high level of digital development. These regions have been equipped with an advanced ICT infrastructure, including high-speed Internet access, broadband coverage, and comprehensive intelligent urban management systems; in terms of the digital economy, the eastern region also has a large number of technological enterprises and innovative enterprises in the fields of e-commerce, artificial intelligence, big data, etc., which has promoted the rapid development and application of digital technology. During the same period, the central region also actively promoted digital construction and the development of the digital economy by encouraging enterprises to invest in information technology and digital industries, strengthening digital infrastructure construction and upgrading the development level of the digital economy. In terms of green development, China has realized the importance of environmental protection and sustainable development. Various regions have adopted a series of measures to reduce pollutant emissions, promote energy conservation and emission reduction, promote energy structure transformation and clean energy, and improve resource utilization efficiency. Many places have also implemented innovative green technologies and environmental management methods to reduce environmental pressure and improve ecological quality [
3].
Although the overall trend of the eastern and central regions is positively moving forward, there is still a big difference in the level of digitalization and greenization synergistic development between the eastern and central regions, which is extremely detrimental to the strategic goal of achieving balanced regional development in China. Obviously, what we need to analyze is what exactly are the reasons for this gap. In order to make a reasonable explanation for these questions, this paper first constructs a comprehensive evaluation system for the regional digitalization and greenization synergistic development level in line with the actual situation of China’s eastern and central regions and measures the synergistic development level of digitalization and greenization in China’s eastern and central regions by applying a coupling coordination degree model. The purpose of this research is to find out the actual situation of the digitalization and greenization development levels in Eastern and Central China, the characteristics of the differences between the eastern and central regions, as well as the main influencing factors of such differences, and on this basis, predict and analyze the future development trend of the digitalization and greenization development levels in Eastern and Central China. The strategies and methods suitable for the synergistic development of digitalization and greenization in various regions are further explored, so as to provide data and strategy support and inspiration for improving the level of digitalization and greenization development in each region and the realization of synergistic development between different regions.
2. Literature Review
2.1. The Connotation of Digitalization
The term “digitalization” first appeared in Negroponte’s book “Digital Survival” [
4]. He believes that digitalization is the process of converting physical information into virtual information [
4], which is a narrower definition of digitalization, and a broader definition was proposed by Gartner, a world-renowned IT consulting firm, which believes that digitalization is the optimization of a model by digital technology to create new revenues and realize new value, which is a gradual transition to digital business. Sambamurthy et al. (2003) [
5] and Chen et al. [
6] (2019) pointed out that the essence of digitalization is a process of transforming a data package that can ultimately be used for business marketing and distribution, enterprise organization, management, etc. Manyika et al. (2016) [
7] expanded the concept of digitalization by arguing that digitalization includes the use of digital technologies in addition to the transformation of analog information into digital information to carry out the process of creation and harvesting. Subsequently, scholars Chen et al. (2020) studied the characteristics of digitalization and concluded that digitalization has three major characteristics, such as self-interactivity, infinite convergence, and digital twinning [
8]. Alhassan et al. (2021) [
9] emphasized that information and communication technology (ICT) represented by the Internet is an important carrier of digitalization activities. This stage is known as networking, and its main feature is the flow of various information and data, achieving interconnection and interworking between different regions on the network [
10]. In summary, digitalization refers to the process of converting things, activities, or information into a digital form, which involves the use of digital technologies to collect, store, transmit, analyze, and present data, and to apply them to improve productivity and efficiency and to innovate, make decisions, and achieve other things. The development of digitalization has made it easier and more efficient to access, share, and use information, with wide-ranging impacts on all areas of the economy, society, and culture.
2.2. Measurement of Regional Digitalization Level
Regarding the measurement of the regional digitalization level, some scholars reflect the degree of digitalization development by measuring the level of regional informatization and the development level of the regional digital economy, and some scholars directly measure the level of regional digitalization, of which the representative studies are mainly as follows: Fan et al. (2020) constructed the digitalization index system from the aspects of production, consumption, circulation, and government [
11]; and Fan et al. (2021) focused on constructing the index system from the two aspects of the digitalization infrastructure level and application level [
12]. Zhou et al. (2020) [
13], Li et al. (2021) [
14], and Jia et al. (2022) [
15] selected representative indices from aspects of the digital access level, equipment level, application level, platform construction level, etc., to reflect the regional digital level. Lv et al. (2022) used the entropy method to measure the development level of Shanghai’s digital economy from three aspects: digital infrastructure construction, digital industry and integration, and digital government environment [
16]. Sheng et al. (2022) constructed an index system from three dimensions of the digital infrastructure, digital industry, and digital governance and used the variation coefficient weighting of the analytic hierarchy process to measure the development level of the provincial digital economy [
17]. Based on existing research results, this paper constructs a comprehensive evaluation index system of the digital development level from the three dimensions of digital infrastructure, digital industry development and application, and digital economic development potential. It measures the digitalization development level of various provinces in the eastern and central regions of China and conducts a comparative analysis, which is important for an in-depth understanding of the differences in the digitalization development level between eastern and central regions and the reasons for them. It is obviously novel and meaningful.
2.3. The Connotation of Greenization
Greenization originates from the concept of sustainable development; the American scholar Boulding (1966) published the theory of the spaceship, followed by Daley, Pearce, and others who put forward a series of steady-state economies, the green economy, the ecological economy, and other related discussions that are considered to be the ideological source and initial concept of green development theory [
18]. Pearce (1989) wrote in his book that economic activities should conform to natural laws and human survival, avoid resource depletion caused solely by economic development, establish a “sustainable economy”, and prevent serious ecological crises [
19]. Li Shu (2003) affirmed the importance of economic greenization, arguing that greenization is not only an inevitable process of civilization’s evolution but also an inevitable trend in the coordinated development of the market economy and ecological economy [
20]. The OECD (2009) and the World Bank (2010) coincided in their definitions of green growth, calling for the protection of the environment, the ecology, and living creatures while developing the economy, and the use of natural resources from a development perspective [
21,
22]. Ke Shuifa (2013), based on the five-in-one overall layout proposed by the 18th National Congress of the Communist Party of China, proposed that green development is a new development path under the five-in-one layout [
23]. In summary, this paper argues that greenization refers to the adoption of various measures and actions to achieve the goal of environmental friendliness and sustainable development. It aims to reduce negative impacts on the environment, including pollution and damage to the atmosphere, water resources, soil, and biodiversity. Greenization includes not only efforts to use clean energy, improve resource utilization efficiency, reduce the generation and release of waste and emissions, promote renewable energy development, and foster environmental education and awareness but also includes considering environmental factors in product design, manufacturing, and consumption, as well as emphasizing ecological balance and sustainability in urban planning and development processes.
2.4. Measurement of Regional Greenization Level
Regarding the measurement of the level of greenization, research has been carried out earlier abroad, and the main measurement methods include the index system method and data envelopment analysis method. In 1993, the United Nations Statistics Division published the “Handbook of National Economic Accounting”, which proposed the environmental-economic accounts and introduced the environmental stocks and flows in the traditional system of national accounts (SNA). It was subsequently widely applied in developing countries, such as Mexico and the Philippines, as well as developed countries, such as the United States and Germany [
24]. The Yale Center for Environmental Law and Policy and Columbia University Center for International Earth Science Information Network (CIESIN) jointly implemented the Environmental Performance Index (EPI) based on the Environmental Sustainability Index (ESI) in 2006, followed by the 2008 EPI and 2010 EPI, mainly focusing on reducing the pressure on human health caused by the environment, enhancing ecosystem vitality and promoting the good management of natural resources were two basic environmental protection goals [
25]. The OECD (2009) used resource utilization efficiency, natural ecology, dwelling quality, development opportunities, and policy responses as the first-level indices for evaluating the level of green development, which covered the three segments of the economy, environment, and human welfare [
26]. Scholars Chen et al. (2016) constructed an index system from industrial green production, industrial green efficiency, and industrial green policies and used an analytic hierarchy process to measure the level of provincial industrial greenization [
27]. Yu et al. (2020) used the entropy method to construct an index system from the three dimensions of the economic system, social system, and environmental system and measured the level of regional greenization [
28]. Tifang Ye et al. (2022) used the SBM super-efficiency model to measure ecological efficiency and, thus, reflect the level of provincial green development [
29].
When domestic scholars measure the level of greenization, most of the research tends to focus on green development and the green economy. In 2010, the “2010 China Green Development Index Annual Report” was published by the Beijing Normal University, Southwestern University of Finance and Economics, and China Economic Monitoring & Analysis Center of the National Bureau of Statistics, proposing the green development index, and the report was published annually thereafter [
30]. Liu (2013) used the equal weighting method to select six indices from economic growth, resource conservation, and environmental protection to calculate the green economy development level index [
31]. Sun et al. (2017) constructed an evaluation model based on information entropy and selected 25 indicators to measure the greenization level from the aspects of economic development, social development, pollution emissions, and environmental ecology [
32]. Gu et al. (2018) constructed a comprehensive index system to measure the level of provincial greenization from the aspects of the endowment, pressure, and governance of greenization [
33]. Li et al. (2021) evaluated the green development status of the Yangtze River Delta region from three main dimensions: economic development, the natural environment, and environmental problems governance [
34]. Zhang et al. (2022) constructed a green development level index system from four dimensions, namely economic development, social welfare, ecological construction, and institution supply, to measure the green development level of cities [
35]. Fan et al. (2022) first constructed the SE-SBM model to analyze the regional green development efficiency from a static perspective and then further used the GML index, as well as the decomposition index, to analyze the trend of the regional green development level from a dynamic perspective [
36].
Economic development is an important foundation for national development, and green development aims to achieve sustainable economic development and protect the natural environment, improving the quality of ecosystems and environmental health. However, traditional economic growth models are often accompanied by resource depletion and environmental damage, and green development aims to realize sustainable economic growth by improving resource utilization efficiency and promoting the development of environmentally friendly industries; natural resources and the ecological environment are the foundation for the survival and development of human society, which is also the key content of green development; at the same time, green development requires the joint efforts of the government, enterprises, and all sectors of society [
37]. Therefore, this paper establishes a greenization development level index system and measures the three dimensions of economic development, the natural and ecological environment, and environmental governance capacity, which can assess the greenization development level of the region more comprehensively and objectively and provide a scientific basis for formulating relevant policies and promoting environmental and sustainable development.
2.5. Research on Synergistic Development of Digitalization and Greenization
In recent years, as the Chinese Government has attached more and more importance to the synergistic development of digitalization and greenization, domestic scholars have carried out research on this, among which the representative research results mainly include the following: Zheng Xiaoyun (2021) and others used the entropy method to measure the digital economy index and the green economy index, respectively, and the coupling coordination degree between the two is calculated to measure the level of synergistic development of digitalization and greenization [
38]. Hu et al. (2022) constructed an index system for the synergistic development of the digital economy and green economy and used the Dagum Gini coefficient and decomposition, kernel density estimation, and spatial convergence model to analyze the regional differences and dynamic trends of the synergistic development level of China’s digital economy and green economy [
39]. Xu Junwei et al. (2022) used the PVAR model to empirically analyze the interactive relationship between the level of the digital economy and the level of the green economy [
40]. In summary, based on the existing research results and research methods in China, this paper applies the entropy method to determine the weights of data indices, calculates the comprehensive index of the level of digitalization development and the level of greenization development, and establishes a coupling coordination degree model to analyze the status of synergistic development of digitalization and greenization in the eastern and central regions of China.
3. Scope of Research
China is a geographically vast country, and the eastern and central regions were chosen for the study of the differences in the level of synergistic development of digitalization and greenization because they have different characteristics and economic foundations in China’s modernization and transformation. The eastern region has always been the main engine of China’s economic development, with a more developed industrial base, technological innovation capacities, and market scale, and its economic development is improving. Therefore, studying the level of synergistic development of digitalization and greenization in the eastern region can summarize its more successful practical experience that can be learned and referenced by other regions and promote the enhancement of the level of synergistic development of digitalization and greenization on a nationwide scale. The central region is in a stage of development and transformation, and as the central region of China’s economy, it has a good geographical location and rich resource advantages. Studying the level of synergistic development of digitalization and greenization in the central region will help provide insights into its development bottlenecks and problems and provide references for the formulation of specific policies and measures. Therefore, it is of great significance to conduct a study on two representative regions, the eastern region and the central region, in order to realize the dual transformation of China’s digital economy and green economy, not only to better understand the implementation effect of the synergistic development of digitalization and greenization that has actually landed in different types of regions but also to help comprehensively grasp the paths and modes of China’s sustainable development, and to provide practical guidance for geographic differentiation, economic development pressures, and policy formulation.
4. Research Methods
High-quality and sustainable economic development is the driving force of greenization development while greenization development is an important prerequisite for realizing sustainable development; good natural and ecological environmental conditions are one of the important symbols for assessing greenization development, as well as the objective material basis of greenization development; environmental governance capacity is a key element in promoting greenization development. This dimension mainly examines the performance of regions in waste governance efficiency, wastewater treatment capacity, domestic waste disposal capacity, etc., which is a direct influence factor on the development of greenization. Thus, it can be seen that economic development, natural and ecological environment conditions, and environmental governance capacity have constraints and important impacts on greenization development from three different aspects. Therefore, this paper constructs a comprehensive evaluation index system of the greenization development level mainly from these three dimensions (see
Table 1 for details).
The digital infrastructure is the technical foundation of digitalization development, which includes indicators on mobile phone penetration rate, optical cable line density, and Internet broadband access density, which examine the investment and construction of the network infrastructure in a region and judge the basic conditions and support capacity of digital development. The development and application of the digital industry reflect the innovation and application capacity of a region in the process of digital transformation. The development potential of the digital economy is an important index to measure the prospects of digitalization development. Therefore, this paper constructs a comprehensive evaluation index system for the level of digitalization development by selecting 12 indicators from the three aspects of the digital infrastructure, digital industry development and application, and development potential of the digital economy (see
Table 1 for details).
These indicators help to understand the synergistic development of digitalization and greenization as they cover multiple aspects of the digitalization and greenization fields and provide a comprehensive analytical framework. First, by collecting and comparing these data, it is possible to intuitively understand the level and progress of digitalization and greenization in a region. Second, these indices provide a basis for assessing the degree of synergistic development. Digitalization and greenization are mutually promoting and supporting development paths. Their synergistic development implies that the application of digital technology and environmental protection can be combined to achieve economic growth and improve resource utilization efficiency. By analyzing these indicators, it is possible to understand the relationship between digitalization and greenization and the degree of synergistic development. Finally, these indices provide a reference and evaluation basis for policy-makers and decision-makers. Therefore, these indices contribute to the understanding of digitalization and greenization synergistic development, providing a comprehensive and objective analytical framework that can reveal the present status and trend of synergistic development and provide guidance and reference for decision-making and practice.
This paper adopts the quantitative evaluation method—the entropy method to calculate the weight of the indices. Firstly, it is necessary to standardize each index. If there is an extreme value of “0” after standardization, the standardized value must be translated by 0.001, that is, d = 0.001. Finally, the comprehensive index of the greenization development level and digitalization development level is calculated by the linear weighting method. The calculation formula is as follows:
where
= 1, 2, 3, ……n represents the year,
= 1, 2, 3, ……m represents the number of indicators,
represents the comprehensive exponent of the evaluation index,
represents the weight of the indices, and
represents the dimensionless value.
In the measurement of the synergistic development of digitalization and greenization, we apply a coupling coordination degree model that can help us analyze the interaction between digitalization and greenization, as well as understand the connection and synergistic development between them [
41,
42]. Based on system theory and the principle of synergistic development, the coupling coordination degree model regards digitalization and greenization as a whole system. Its advantage is that it can comprehensively consider the complex relationship between digitalization and greenization, quantitatively analyze the synergistic effect and mechanism of the two, help us to understand the interaction between digitalization and greenization, and find the optimal path and strategy to promote the synergistic development of the two [
43]. In terms of specific methods, this paper will calculate the values of the coupling degree and coordination degree of digitalization and greenization development, respectively. The coupling degree mainly examines the process of transformation from a disordered state to an ordered state between the two subsystems, while the coordination degree is used as a quantitative index to measure the coordination status or quality degree between the systems or elements.
where
is the coupling degree, the range of
values is [0, 1], T is the coordination coefficient,
is the coupling coordination degree,
stands for the comprehensive evaluation score of the greenization development level subsystem index, and
stands for the comprehensive evaluation score of the digitalization development level subsystem index;
+
= 1, where
and
are coefficients to be determined, and the importance of greenization development level and digitalization development level in the text is the same; therefore, take
=
= 0.5. Drawing on the basis of existing research results, this paper adopts the research results of scholar Liao (1999) [
44], and the evaluation criteria and specific level division of the coupling coordination are shown in
Table 2.
5. Data Results and Analysis
This part first applies the entropy value method to determine the weights of the evaluation indicators of the greenization development level and digitalization development level for provinces in the eastern region and provinces in the central region, respectively. Secondly, the total scores of the greenization development level and digitalization development level of the eastern region and each province, as well as the central region and each province, from 2012 to 2021 are calculated, respectively, according to the weights of the comprehensive evaluation indices (see
Table 3 for details), which is conducive to comparing, evaluating, and analyzing the greenization development level and the digitalization development level of the eastern region and the central region. Again, the coupling degree, coordination index, and coupling coordination degree of the greenization development level and digitalization development level in Eastern and Central China are calculated by the coupling coordination degree model (see for details) to evaluate the coupling coordination status between the two subsystems from 2012 to 2021. Finally, in order to further analyze the trend of digitalization and greenization synergistic development in the eastern and central regions of China, based on the measurement results from 2012 to 2021, this paper adopts the gray prediction method and establishes a gray prediction model to predict and evaluate the level of digitalization development and the level of greenization development in the eastern and central regions of China from 2022 to 2028.
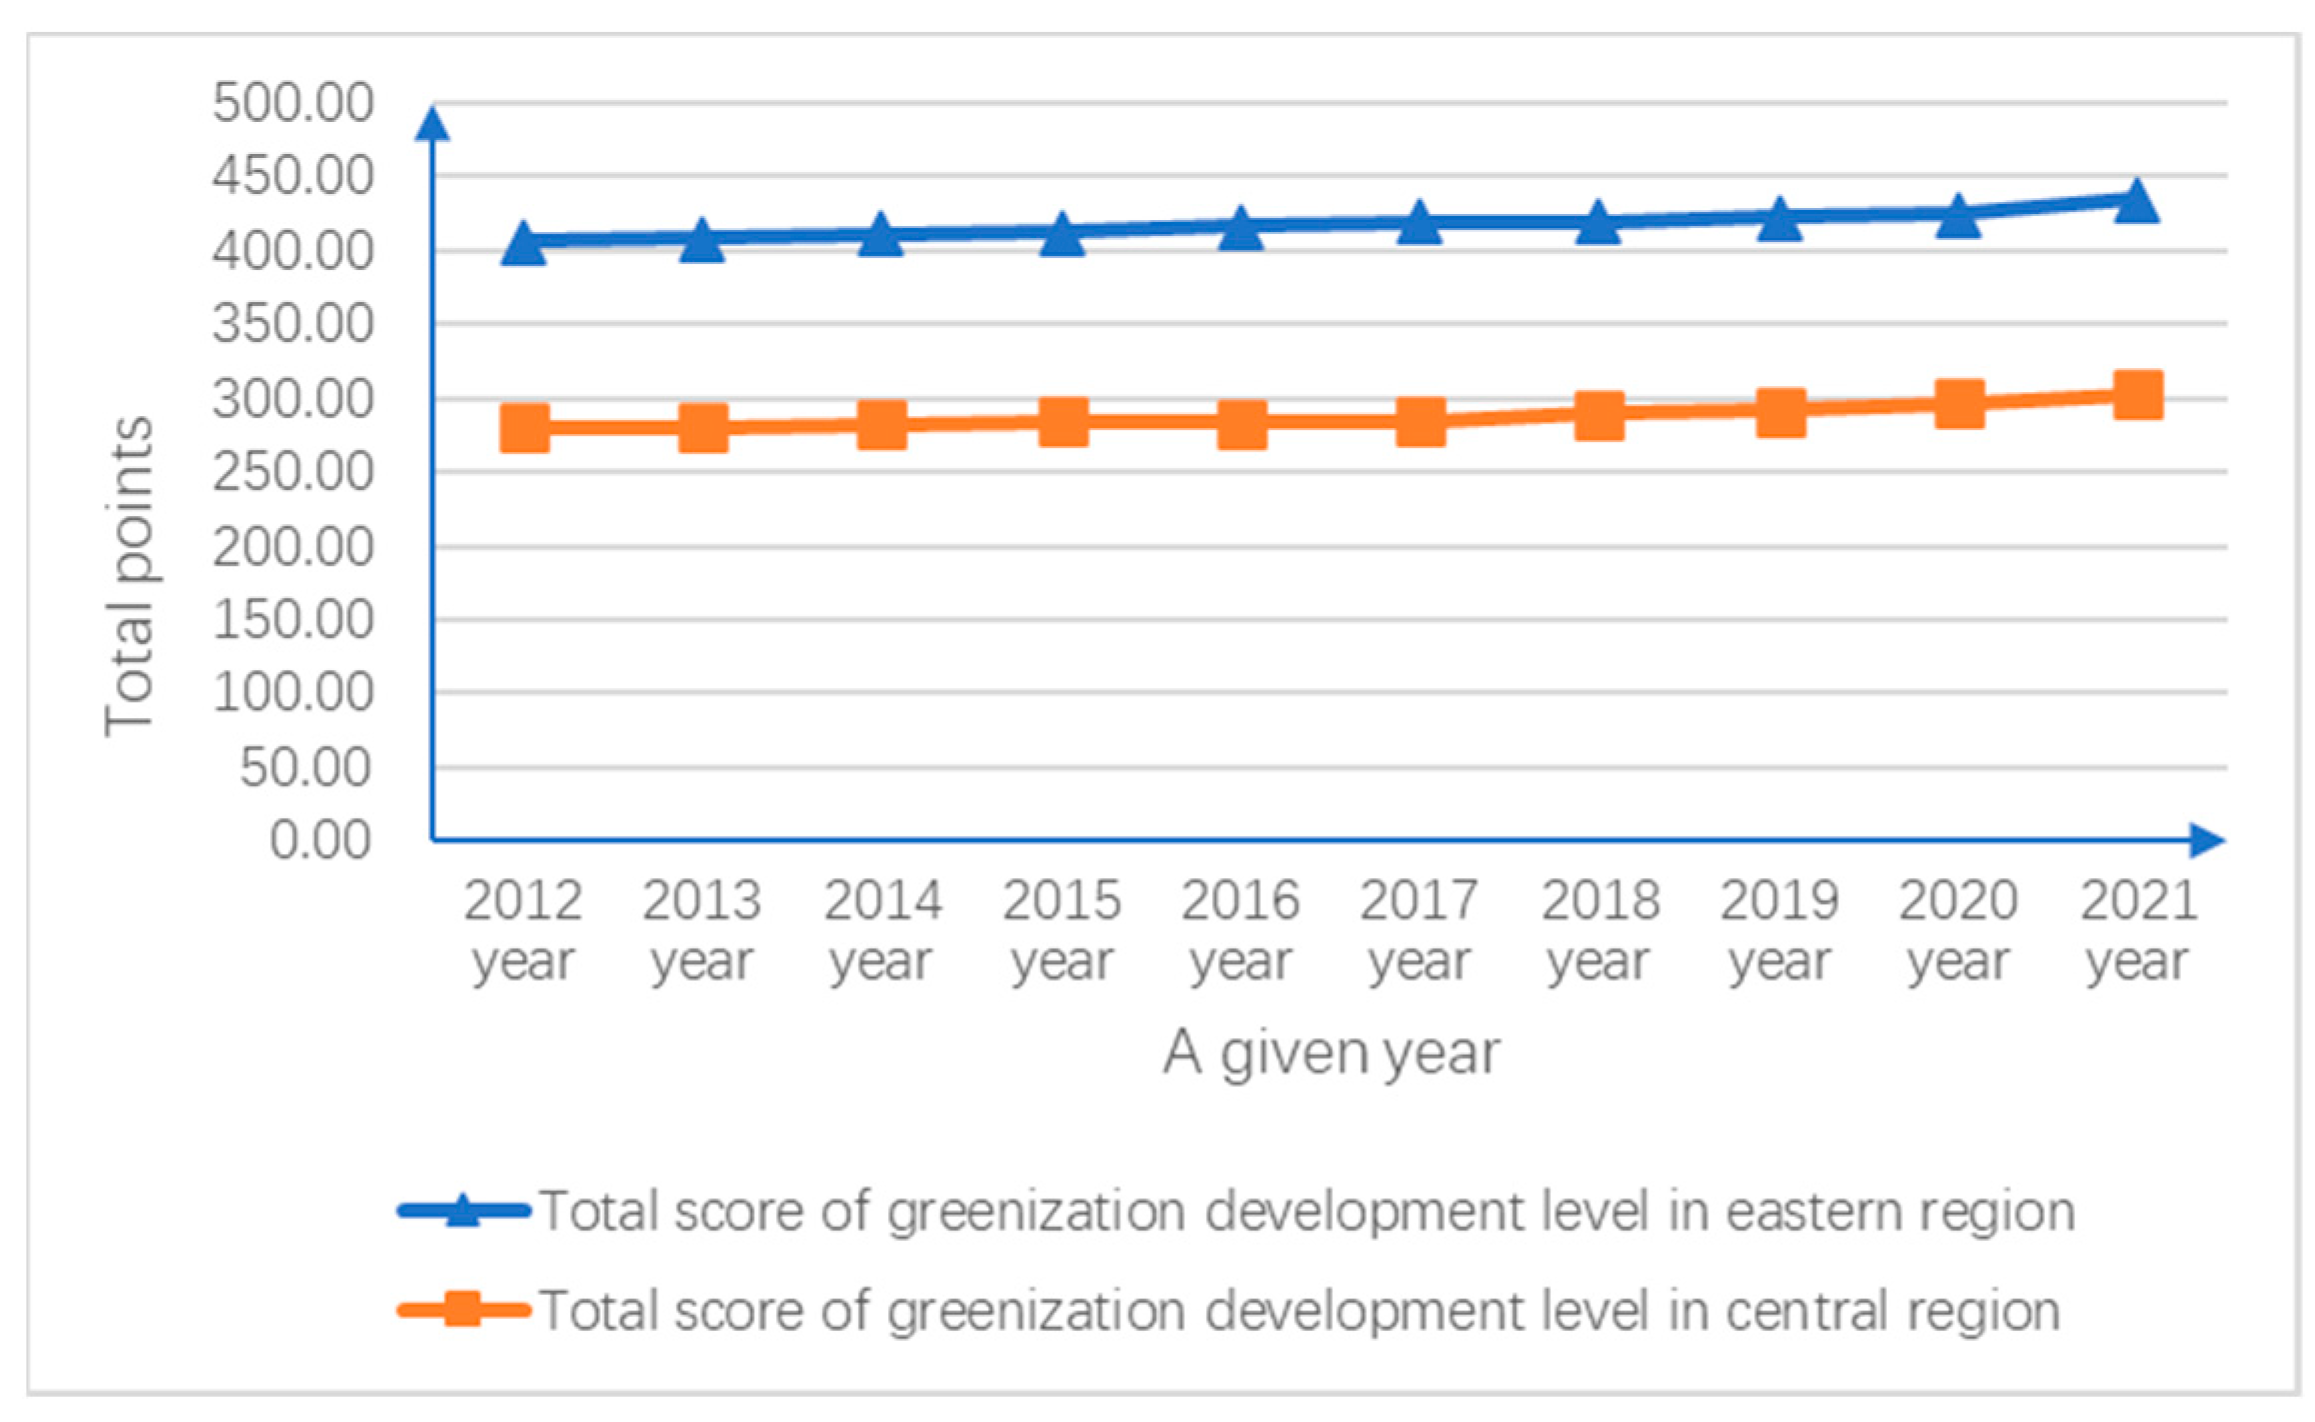
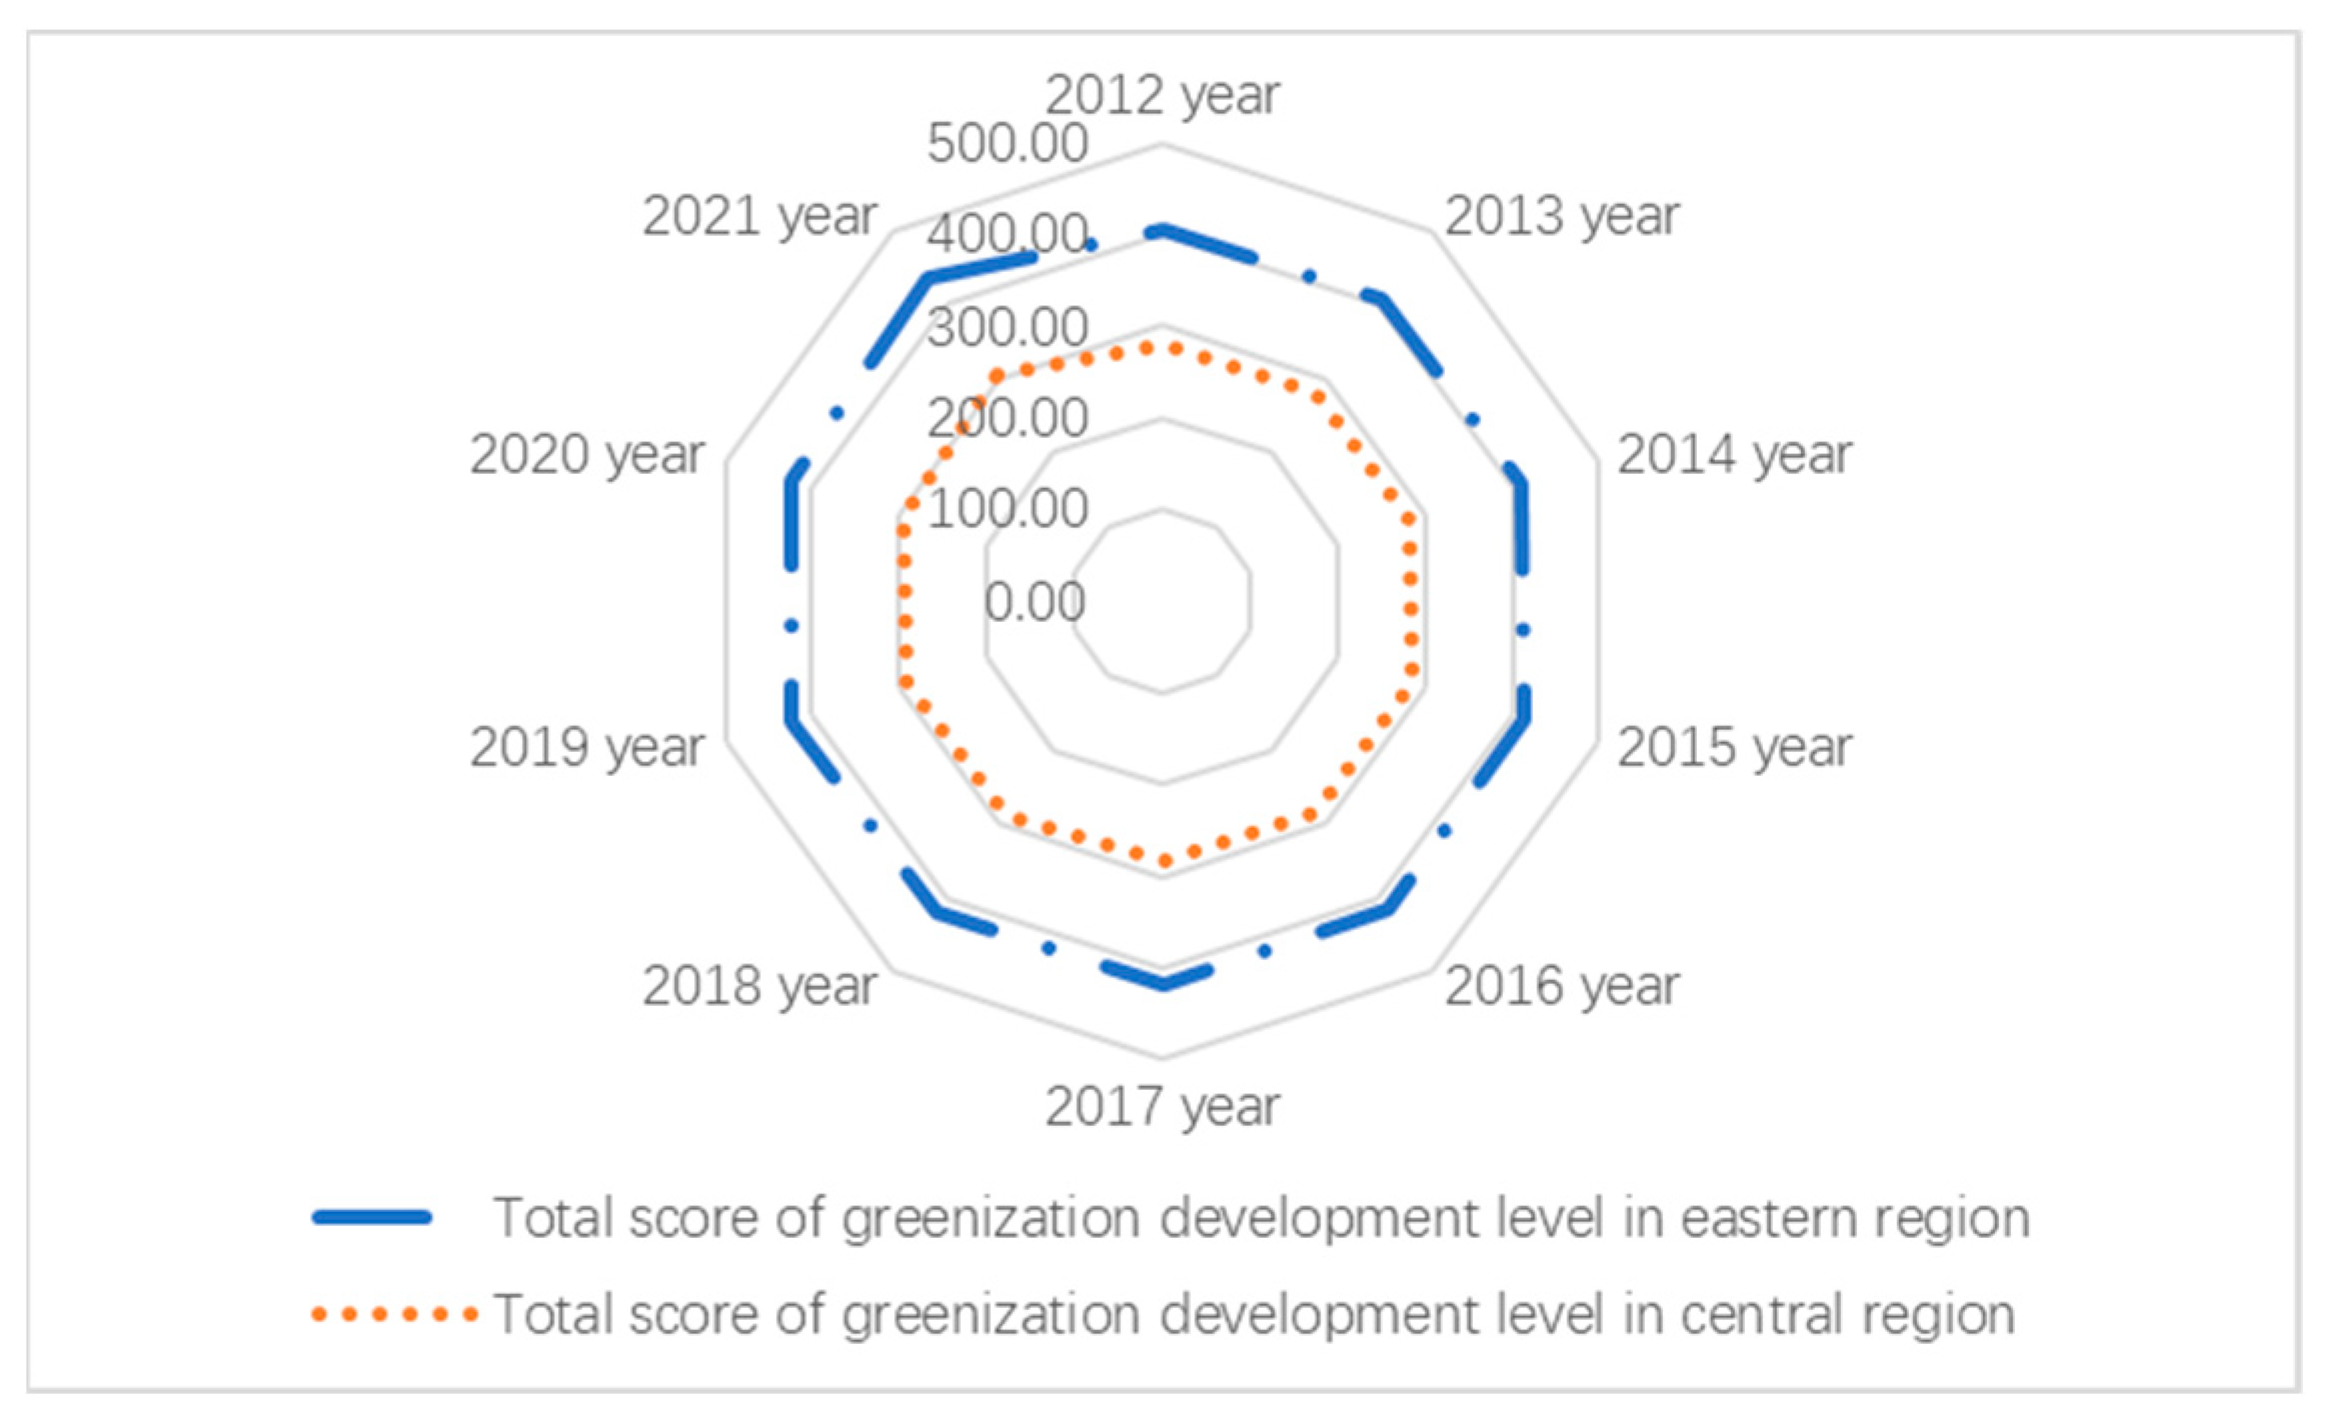
From
Figure 1, it can be seen that the greenization development level in both the eastern and central regions of China showed a gradual upward trend from 2012 to 2021. As can be seen from
Table 3, Jiangsu Province and Zhejiang Province, respectively, ranked first and second in the total score of the greenization development level in the eastern region, while Anhui Province had the highest total score in the total score of greenization development in the central region; from
Figure 2, it can be seen that the digitalization development level in the eastern and central regions showed a gradual upward trend from 2012 to 2021. As can be seen from
Table 3, the two provinces with the highest total score of the digitalization development level in the eastern region were Beijing and Guangdong Province, and the province with the highest total score of digital development level in the central region was Hubei Province. From , it can be seen that the total score of the greenization development level and digitalization development level in the eastern region exceed those in the central region. There is a large gap between the digitalization development level in the central region and the eastern region. As can be seen in
Table 3, the digitalization development level in the eastern region has shown a substantial growth trend since 2019.
In order to further study the coupling and coordinated development status of digitalization and greenization in the eastern and central regions of China, the coupling model was used to calculate the coupling degree, coordination index, and coupling coordination degree of the two systems, and the calculation results are shown in .
As can be seen from
Table 4, the degree of coupling coordination between digitalization and greenization development in the eastern region has shifted from severe dysregulation to high-quality coordination from 2012 to 2021, with the value of the coupling coordination degree D showing an increasing trend year by year. As can be seen from
Table 5, the degree of coupling coordination between digitalization and greenization development in the central region has gradually shifted from severe dysregulation to mild dysregulation, toward intermediate coordination, good coordination, and high-quality coordination from 2012 to 2021. The D value of the coupling coordination degree showed a growing trend except for 2016. On the whole, the degree of coupling coordination between the greenization and digitalization development levels in the eastern region is slightly better than that in the central region.
Based on the data analysis results of the greenization development level and digitalization development level in the eastern and central regions from 2012 to 2021, this paper adopts the gray prediction method to predict the trend of digitalization and greenization synergistic development in the eastern and central regions of China in the period of 2022–2028.
5.1. Grade Ratio Inspection Results
The gray prediction method is based on historical period data to predict future period data. Before establishing the gray prediction model GM (1,1), it is necessary to perform a grade ratio test on the time series. If all the level ratio values are located in the interval (e
(−2/(n + 1)), e
(2/n + 1)), it indicates that the sequence is suitable for the construction of a gray model through the grade ratio test. If it does not pass the grade ratio test, then the sequence of “level transformation” is adopted, so as to make the new sequence meet the grade ratio test, and the specific results are shown in
Table 6.
From the analysis in the above table, it can be obtained that all the grade ratios of the original sequence of the greenization development level and digitalization development level in the eastern and central regions are located in the interval (0.834, 1.199), indicating that the original sequence is suitable for constructing a gray prediction model.
5.2. GM (1,1) Model Construction
The first step is to construct a gray differential equation model for GM (1,1).
where
is the development factor,
is the gray volume, and
= 2, 3, ……n.
The original sequence (non-negative) is as follows:
Generate a sequence of numbers by one accumulation:
wherein
.
Introducing matrix notation, we have the following:
Then, the matrix form of the GM (1,1) model is .
The second step is to use SPSPRO software to calculate the accuracy and fitted values of the gray prediction model, as shown in
Table 7.
As can be seen from the results of the model condition test in the above table, the a posteriori difference ratio C value of the greenization development level and digitalization development level in the eastern region and central region are 0.061, 0.118, 0.009, and 0.008, respectively, which are all less than 0.35, indicating the high accuracy of this model.
From the fitting results in the below table (
Table 8), it can be seen that the average relative errors of greenization development and digitalization development in the eastern region and central region are 0.338%, 0.718%, 1.743%, and 1.298%, respectively. If the average relative error is less than 20%, it means that the model-fitting effect is good.
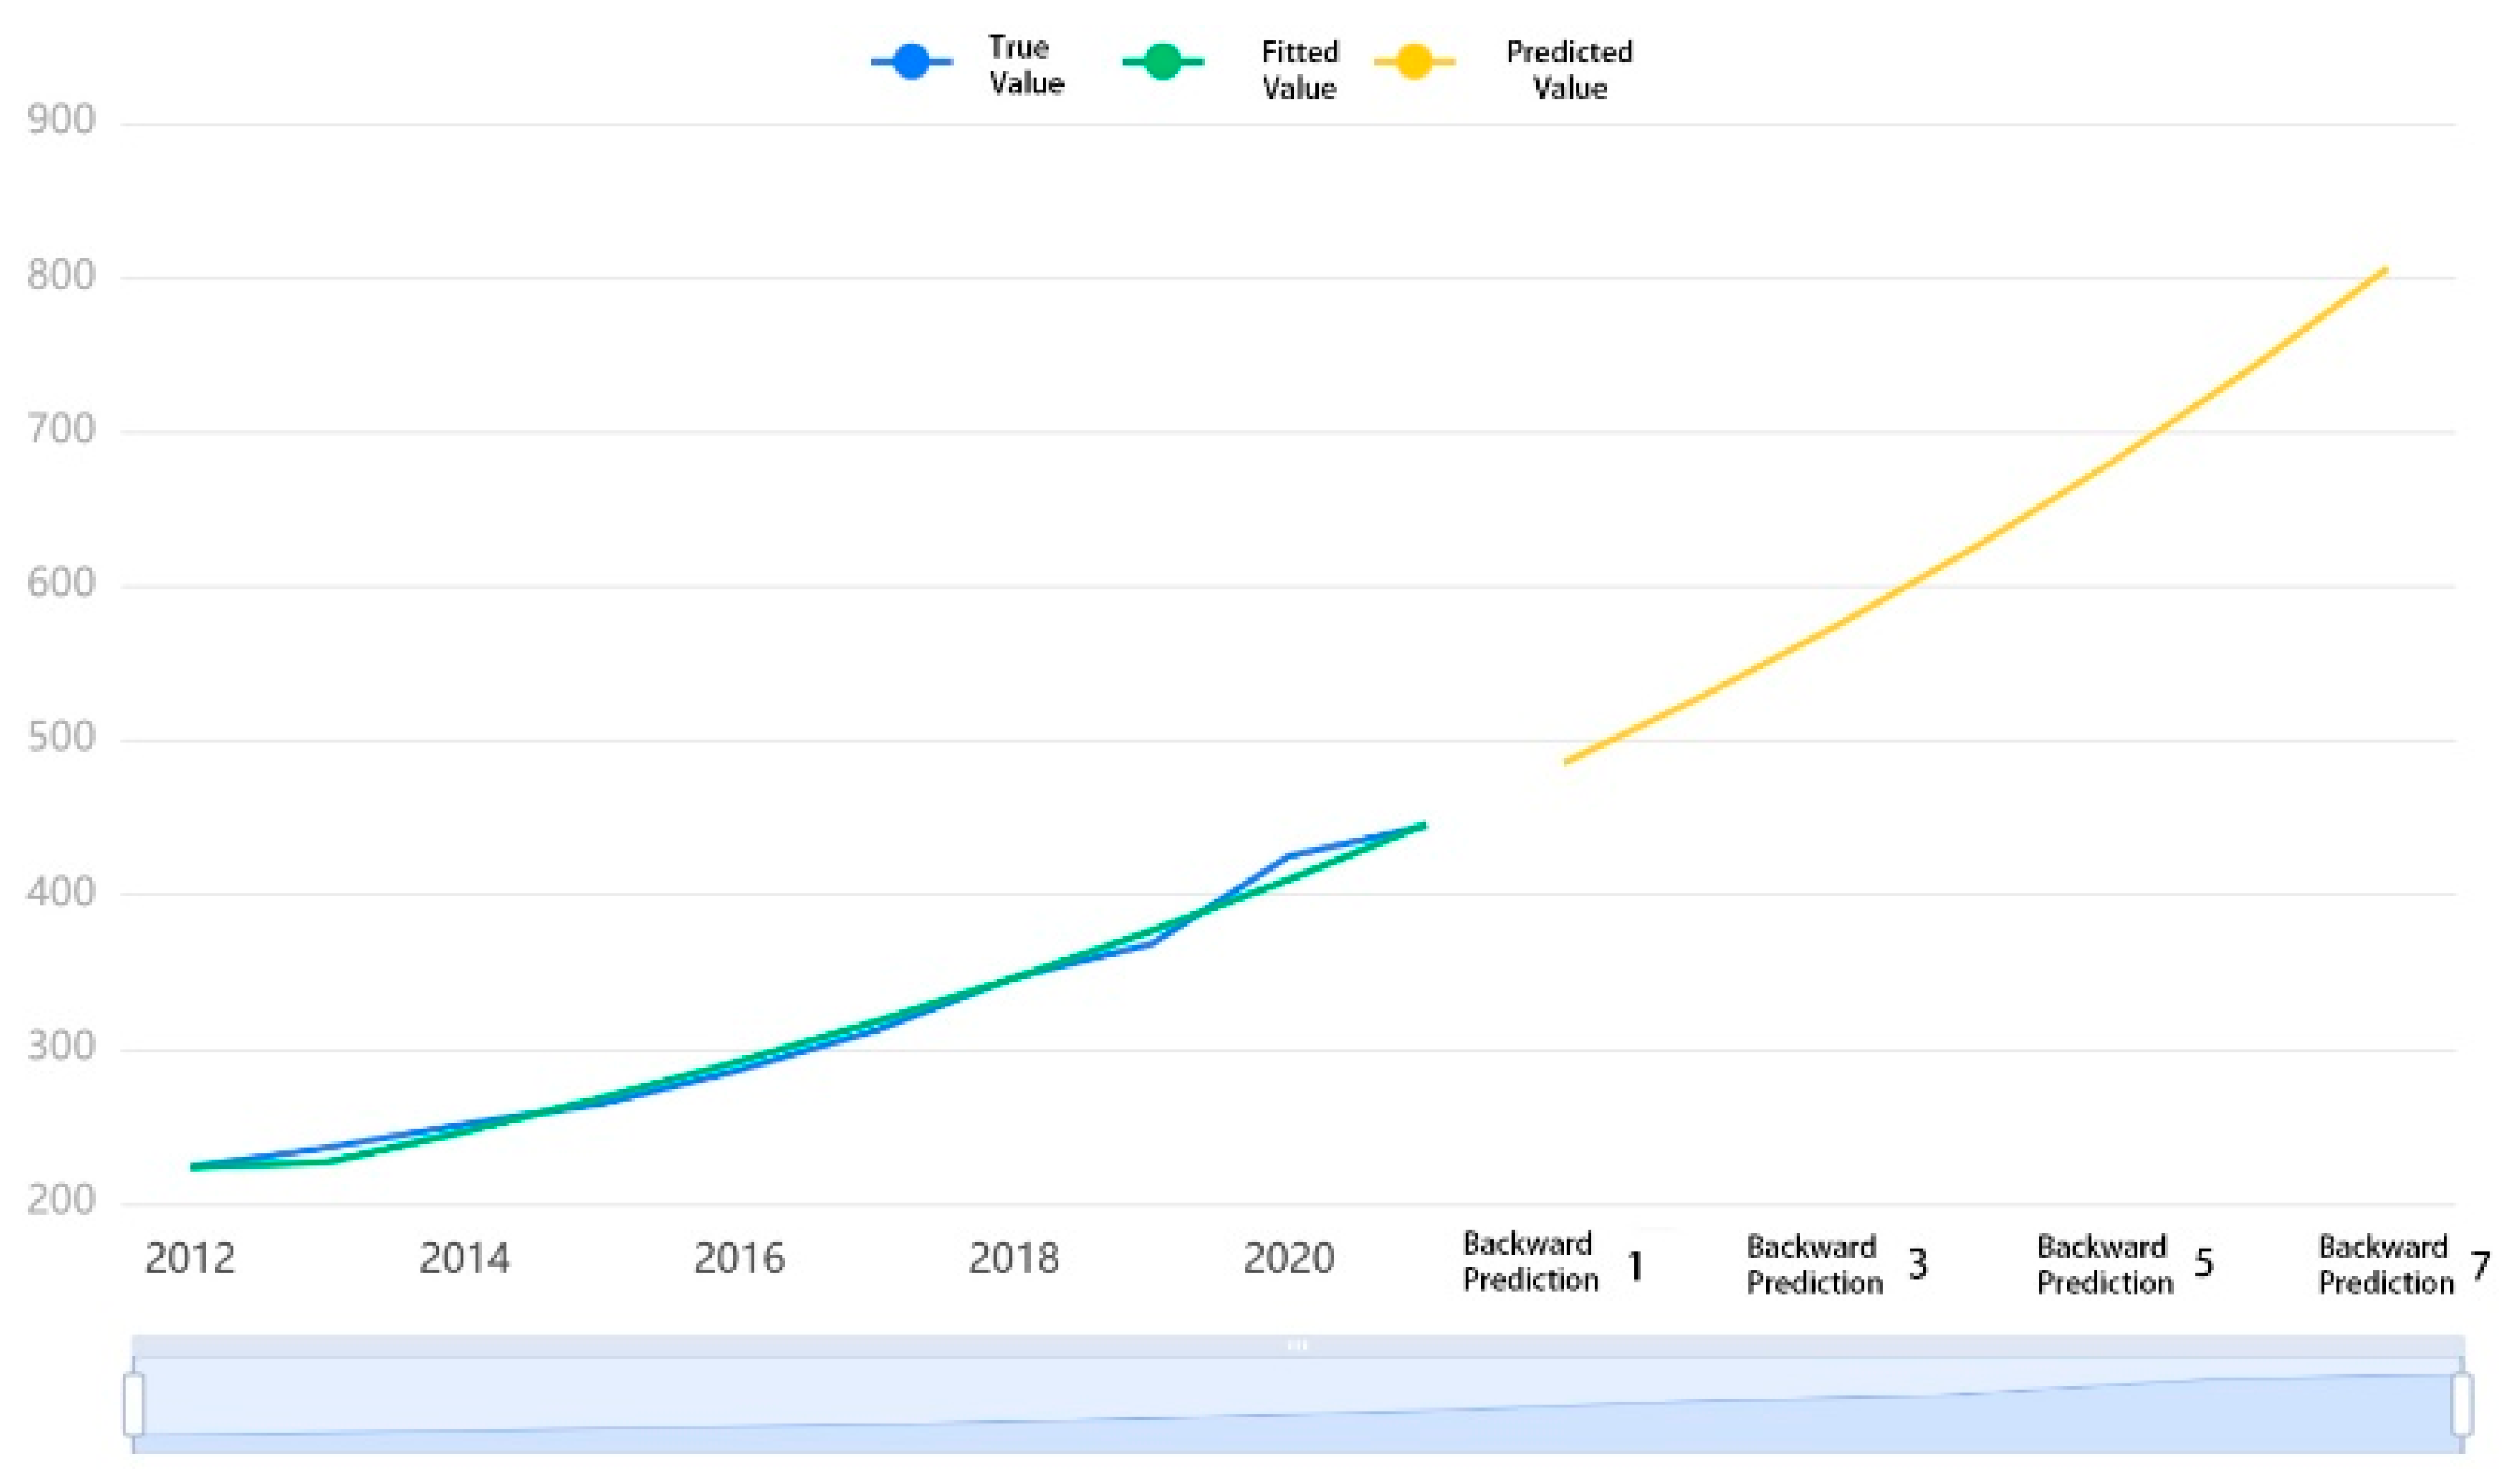
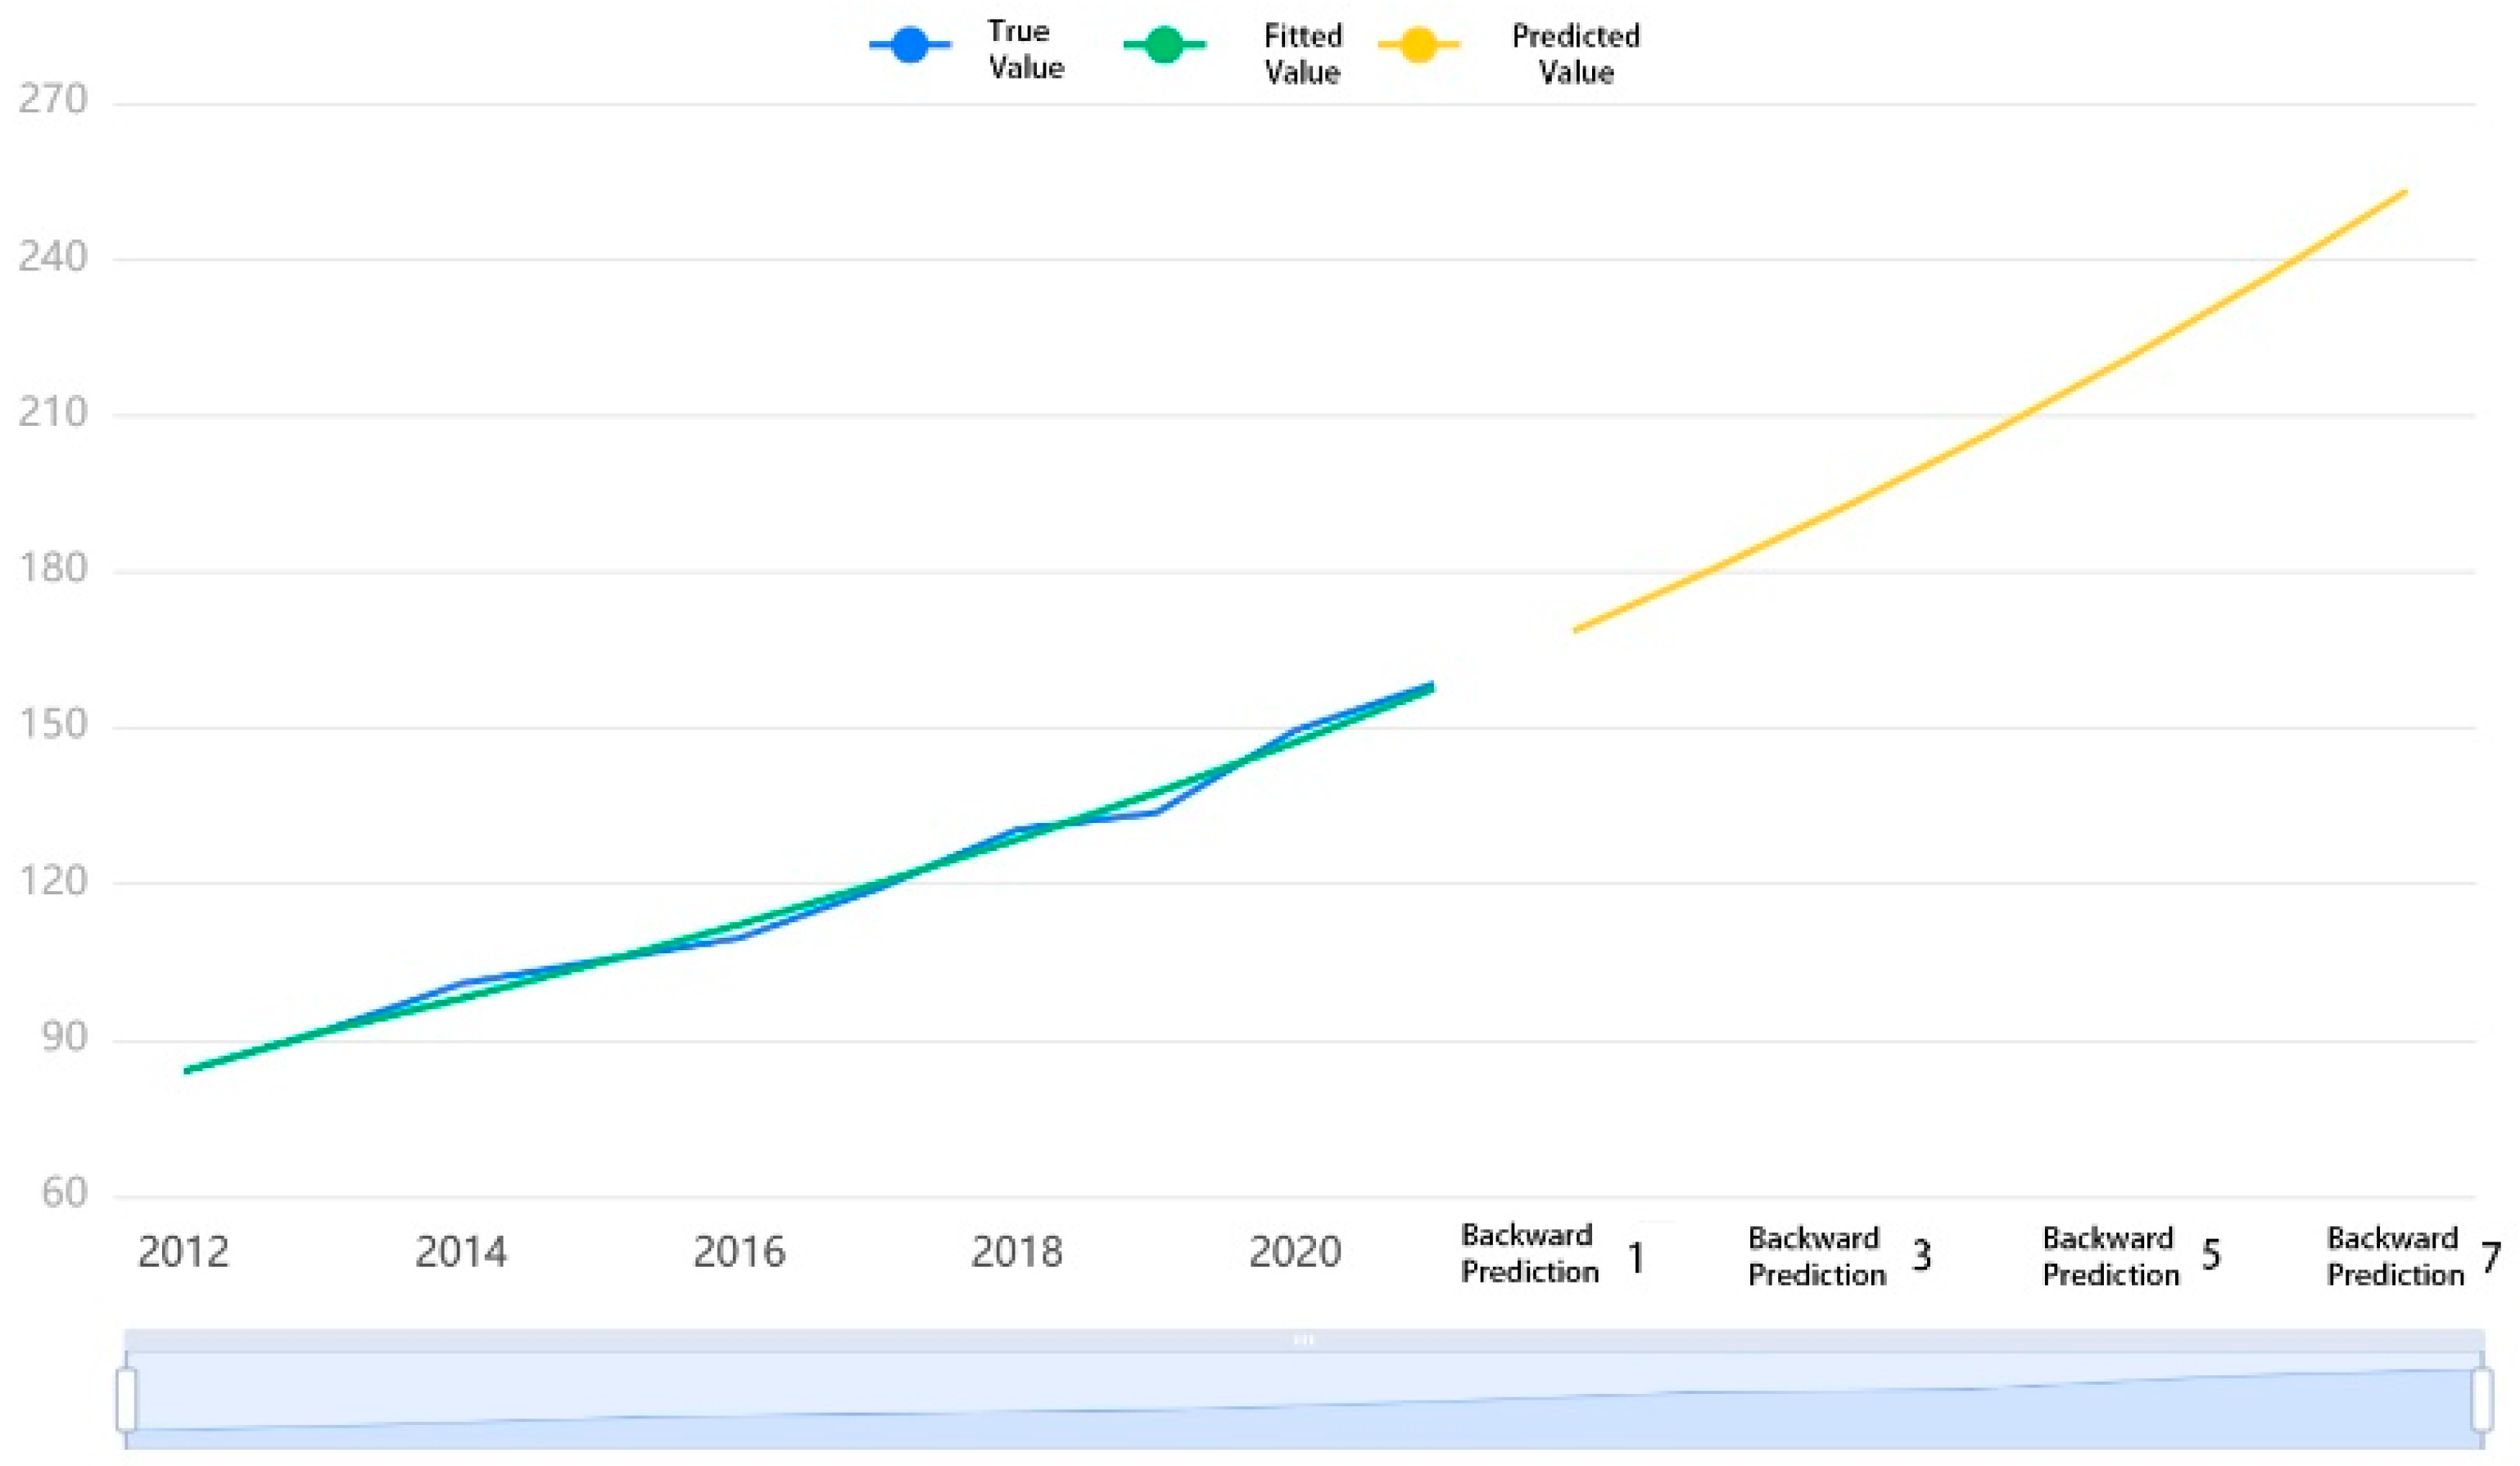
The third step is to use SPSSRPRO software to calculate and fit the predicted levels of greenization and digitalization development in the eastern and central regions of China from 2022 to 2028, as shown in
Figure 5,
Figure 6,
Figure 7 and
Figure 8.
From
Figure 5 and
Figure 6, it can be seen that the level of greenization and digitalization development in the eastern region will show an increasing trend in the coming period of time; the level of greenization presents a straight-line upward trend and the level of digitalization development shows an exponential increase. From
Figure 7 and
Figure 8, it can be seen that the level of greenization development and digitalization development in the central region will both show a growth trend in the coming period of time; the level of greenization development shows a straight-line upward trend and the level of digitalization development shows a relatively gentle upward trend.
6. Discussion
From the above analysis, when we use the gray prediction model to predict the development trend of digitalization and greenization in the eastern and central regions of China in the coming period of time, so as to make a prediction on the future direction of digitalization and greenization development, it can be seen that the level of digitalization and greenization development in the eastern region is higher than that in the central region. This shows that the better the degree of digitalization and greenization, the better the economic development. This is because digitalization has promoted the transformation and upgrading of economic development. The application of digital technology can improve production efficiency, optimize resource allocation, accelerate innovation speed, and promote industrial upgrading and economic structural adjustment [
45]. The application and development of digital technology provides technical support for greenization and promotes the popularization of green production and consumption. At the same time, greenization promotes the realization of sustainable development, which can reduce environmental pollution and resource waste and lower carbon emissions and energy consumption. Green transformation not only promotes the development of digital technology but also provides greater market demand for digital technology, promoting innovation and breakthroughs in digital technology. That is to say, the synergistic development of digitalization and greenization can promote high-quality economic development, facilitate the optimization and upgrading of the industrial structure, protect the environment and ecosystem, and improve social welfare and sustainable development levels.
However, the key to the synergistic development of digitalization and greenization lies in the organic integration of digital technology and greenization development, making full use of data-driven and innovative cooperation to achieve the unity of high economic quality and sustainable development goals. Obviously, this process requires the aggregation of many elements in accordance with certain methods and approaches to transform into the economic goals required by society. The aggregation between these elements is not spontaneous but needs to be realized and accomplished through corresponding organizational and management activities. The effectiveness of organizational management varies depending on the way, method, and efficiency. Therefore, factors of production, market demand, infrastructure, natural resources, cultural resources, and science and technology, education, finance, and technology are all indispensable and important elements in the process of digitalization and greenization synergistic development. In other words, the development level and coupling coordination level of digitalization and greenization are not only determined by the quality of elements in the system but also by the methods, approaches, and efficiency of organizational management, as well as by the thinking mode, decision-making mode, and behavioral mode of various economic subjects. The synergistic development of digitalization and greenization not only involves the relationship between human beings and nature but also people’s behavioral modes and social relations, as well as the thinking process of various economic subjects. Therefore, to realize the synergistic development of digitalization and greenization, it is necessary to comprehensively and continuously innovate the large technology system composed of natural technology, social technology, and thinking technology [
46].
7. Conclusions
From the above, it can be seen that the level of digitalization and greenization development in the eastern and central regions of China has shown gradual growth, and the level of digitalization and greenization development in the coming period of time also shows a rising trend. This paper analyzes the future trend of digitalization and greenization development in eastern and central regions, which is conducive to objectively understanding the prospects of digitalization and greenization development. It has theoretical and practical significance for further in-depth research on the synergistic development of digitalization and greenization in China and for achieving balanced development between different regions.
According to the data calculation results, it can be seen that the level of digitalization and greenization development in the eastern region is higher than that in the central region. On the whole, the degree of coupling and coordination of greenization and digitalization development in the eastern region is better than that in the central region. In the eastern region, Jiangsu Province, Zhejiang Province, and Guangdong Province rank high in both greenization and digitalization development levels, and these provinces also have better economic development status in the eastern region. Anhui Province, Hubei Province, and Hunan Province rank high in both greenization and digitalization development levels in the central region, and these provinces also have better economic development status in the central region. The data analysis results of this paper verify the important conclusion that the synergistic development of digitalization and greenization is an effective path to achieve the goal of high-quality and sustainable economic development at present.
Based on the results of this paper, we believe that the following aspects should be paid attention to in the practice of implementing the synergetic development of digitalization and greenization in the future:
We will continue to promote technological innovation and provide new tools and solutions for the synergistic development of digitalization and greenization. For example, the development of new technologies, such as big data and cloud computing, has provided highly efficient digital infrastructure and tools. Technological innovation can also address issues such as environmental pollution and resource scarcity and develop more environmentally friendly and energy-efficient production technologies and products.
Comprehensive policy measures and means such as policy support, cross-border cooperation, and talent cultivation should be utilized to safeguard the synergistic development of digitalization and greenization. For example, social technological innovation through the provision of policy support, tax reduction, and exemption, and the establishment of an incentive system is conducive to encouraging and supporting the development of industries related to greenization, digitalization, and sustainable development. The government, enterprises, and academia have strengthened cross-border cooperation, established partnerships, and promoted collaborative development. By providing funding, equipment, talent, and other support, we have provided a platform for cooperation and innovation between scientific research institutes and enterprises, encouraging technological innovation and research and development, especially in the fields of digitalization and greenization, through the establishment of technological innovation bases, research institutes, innovation incubators, etc.; strengthening cooperation with other countries and international organizations to jointly research, develop, and apply technological innovations with a global impact is also extremely beneficial for promoting the synergistic development of digitalization and greenization.
We should promote the innovation of thinking mode, promote the transformation of traditional development models and concepts, enhance the understanding of the connotation and scope of the synergistic development of digitalization and greenization, encourage creative thinking and imagination, break through the traditional thinking framework and constraints, find new innovation points and possibilities, and explore effective methods and paths to better promote the synergistic development of digitalization and greenization in practice, so as to promptly identify and seize new development opportunities.


