Article

Application of Biofilm Water Conservation and Emission Reduction Technology in the Pond Culture of Largemouth Bass and Japanese Eel

1
Fisheries College, Jimei University, Xiamen 361021, China
2
Engineering Research Center of the Modern Technology for Eel Industry, Ministry of Education, Jimei University, Xiamen 361021, China
*
Author to whom correspondence should be addressed.
Sustainability 2023, 15(24), 16663; https://doi.org/10.3390/su152416663
Submission received: 26 September 2023 / Revised: 24 November 2023 / Accepted: 1 December 2023 / Published: 8 December 2023
(This article belongs to the Special Issue Sustainable Water Resources Management and Water Supply)

Abstract

:
This study investigates the water-saving and emission-reduction effects of biofilm technology on the pond culture of largemouth bass (Micropterus pallidus) and Japanese eel (Anguilla japonica) using a combination of biofilm water purification grids and a complex microbial preparation. The results show that during the 150-day largemouth bass aquaculture trial, the TN, TAN, TP, nitrite, and LP in the treatment group were significantly lower than those in the control group by 26.2%, 74.7%, 53.9%, 30.7%, and 59.1% (p < 0.01), respectively. During the 145-day aquaculture trial of Japanese eel, the TN, TAN, and TP levels in the treatment group were significantly lower than those in the control group by 30.1%, 68.6%, and 18.7% (p < 0.01), respectively. The nitrite and COD levels were also significantly lower in the treatment group than in the control group by 18.3% and 16.0% (p < 0.05). In addition, largemouth bass and Japanese eel tailwater nitrogen and phosphorus discharges were significantly reduced and culture yields were significantly increased. This biofilm pond culture technology has advantages such as low cost, water saving and emission reduction, increased production, ease of operation, and a wide range of applications.

1. Introduction

With the growth of the global population and economy, aquaculture has developed rapidly worldwide [1]. Pond culture is a widely used method in aquaculture. Largemouth bass (Micropterus salmoides) and Japanese eel (Anguilla japonica) are important economic and consumer species [2]. However, traditional methods often lead to significant water resource consumption and wastewater discharge, causing severe pollution and ecological problems for the aquatic environment [3,4]. Therefore, seeking sustainable farming techniques that can reduce water resource consumption while minimizing wastewater contamination has become an urgent issue in the aquaculture industry today.
Biofilm technology is an emerging water treatment technology with broad application prospects. Biofilm technology refers to the formation of biofilms by microorganisms attached to porous media. Through metabolic activities, biofilms can remove and transform organic substances and nutrients such as nitrogen and phosphorus in wastewater, effectively reducing pond pollution and non-point source pollution to neighboring waters, realizing secondary utilization of feed protein, and exhibiting significant water saving, emission reduction, energy conservation, low carbon, increased yield, and income generation effects [5,6]. Compared with traditional farming methods, biofilm technology has advantages such as a small land occupation area, high space utilization rate, long biological retention time, high purification efficiency, strong equipment resistance, less sludge generation, and easy automation management in water saving and emission reduction [7]. The application of composite microbial preparations can optimize water quality by introducing specific beneficial microorganisms. These microorganisms can convert ammonia nitrogen and nitrite nitrogen into nitrogen gas, reduce the concentration of ammonia nitrogen and nitrite in water, and absorb and degrade organic substances and inorganic salts in water, thus improving water quality [8]. Through the application of composite microbial preparations, the water quality improvement efficiency of biofilm technology can be further improved, the dependence on water resources can be reduced, and environmental pollution can be mitigated.
This study aims to explore the combination of biofilm technology and composite microbial preparations in achieving water saving and emission reduction during the pond culture of largemouth bass and Japanese eel. The effects of the combination on improving water quality, reducing nitrogen and phosphorus emissions, and improving farm efficiency were assessed by comparing it with traditional farming methods. The findings of this study will provide a feasible water-saving and emission-reducing cultivation technology for largemouth bass and Japanese eel farming industries, promoting sustainable development of the industry, and realizing effective utilization of water resources and environmental protection.

2. Materials and Methods

2.1. Materials

The biofilm water purification grid used for the test was a patented product developed by our team; the base material is polyamide elastic filler. The length of each group of biofilm water purification grids is about 20 m and the height is about 0.7 m. The bacterial fluids of the composite microbial preparation were selected by our team, including the nitrifying bacteria NB-1 strain (the bacterial density of the bacterial fluids was 1.60 × 10⁹ cfu/mL), denitrifying bacteria DB-1 strain (the bacterial density of the bacterial fluids was 1.16 × 10⁹ cfu/mL), and denitrifying-phosphorus-removing-bacteria PP-1 strain (the bacterial density of the bacterial fluids was 2.53 × 10⁹ cfu/mL); the supplemental carbon source was glucose. The culture objects were largemouth bass and Japanese eel.

2.2. Experimental Design

The largemouth bass culture trial was conducted at the largemouth bass culture demonstration area of Huang Hao Aquaculture Farm (22.81′ N, 113.15′ E), Xingtan Town, Shunde District, Guangdong Province, China, from 28 May 2022 to 25 October 2022, for a total of 150 days. The average size of the six culture ponds was about 0.67 ha and the average fish casting density was about 164,179 ind/ha (Table 1).
The Japanese eel culture trial was conducted at the earthen pond eel farm owned by Yuanhong Group Co. located in Taishan City, Guangdong Province, China (22.81′ N, 113.15′ E), from 4 June 2022 to 26 October 2022, for a total of 145 days. The average size of the six culture ponds was about 0.84 ha and the average fish casting density was about 42,752 ind/ha (Table 1).
The controlled experiment method was used to select six ponds with a similar stocking density, stocking specification, and pond area. Three randomly selected ponds were the treatment group ponds and the combined water treatment technology of “biofilm water purification grids + complex microbial preparation (nitrifying bacteria NB-1 strain, denitrifying bacteria DB-1 strain, and denitrifying-phosphorus-removing-bacteria PP-1 strain)” was applied. The water quality improvement in pond culture was carried out by installing biofilm water purification grids and applying composite microbial preparation in the pond water. The remaining three ponds were control group ponds and did not adopt experimental treatment technology or products. Each pond is equipped with four 3kW impeller aerators.
The treatment group ponds were arranged with 4 groups of biofilm purification grids per mu (each group with a length of 20 m and a height of 0.7 m), the setting density was about 3% of the water volume, and the biofilm water purification grids were suspended in the water below 20 cm. Prior to installation, the biofilm water purification grids were soaked in a solution of pool water mixed with glucose and microbial preparation for more than 30 min. During the experiment, the microbial preparation and glucose were added once a month at a concentration of 21 mL/m3 for nitrifying bacteria NB-1 strain, 84 mL/m3 for denitrifying bacteria DB-1 strain, 84 mL/m3 for denitrifying-phosphorus-removing-bacteria PP-1 strain, and 50 mg/L for glucose.
During the experiment, the tracking and monitoring of the main factors of pond water quality and the effect of aquaculture were carried out to assess the effectiveness of improving the water quality in pond culture and the actual effect of discharging the aquaculture effluent up to the standard. The main factors of water quality included pH, water temperature (WT), dissolved oxygen (DO), total nitrogen (TN), total ammonia nitrogen (TAN), nitrite, total phosphorus (TP), live orthophosphate (LP), chemical oxygen demand (COD), and suspended solids (SS).

2.3. Farming Management

During the experiment, standardized aquaculture management was carried out. The feeding time for largemouth bass was 8:00 and 16:00 daily, with a daily feed rate of about 5% of the body weight of largemouth bass. The daily feeds were compound feeds produced by Fujian Tianma Technology Group Co., Ltd. (Fuzhou, China), with a crude protein (mass fraction) of the feed not less than 48.0. The feeding time for Japanese eel was 5:00 and 16:00 daily, with a daily feed rate of about 2% of the body weight of Japanese eel. The daily feeds were compound feeds produced by Guangdong Yuanhong Group Co., Ltd. (Taishan, China), with a crude protein (mass fraction) of the feed not less than 48.0. During the experiment, the amount of feed fed and the occurrence of fish diseases and deaths were recorded daily. At the end of the experiment, the number and weight of largemouth bass and Japanese eel in each pond were recorded; feed feeding was counted and the specific growth rate, weight gain rate, and feed conversion rate of largemouth bass and Japanese eel were calculated. No water was changed during the experimental period and the pond water volume came mainly from evaporation during the day, with rainwater as a supplementary water.

2.4. Method for Water Sampling and Measurement of Water Quality Factors

Water sampling: three sampling points were collected in each pond, including the water inlet, outlet, and bait feeding platform. During sampling, a transparent glass sampler was used to collect water samples from 50 cm below the surface of the culture pond and mix them uniformly, which were then transferred into 1000 mL polyvinyl alcohol bottles. This water sample was used for the determination of TN, TAN, TP, LP, nitrite, COD, and SS. Prior to the installation of the biofilm purification grid in the pond, surface water (0.5 m below the surface) was collected as a background water sample from each pond. After completion of installation of the biofilm purification grid in the pond, water samples were collected every 5 days until the end of the tracking and monitoring period.
Water quality measurement method: the dissolved oxygen, pH, and water temperature in each pond’s water body were measured on-site using portable detectors at 8 am. The determination of water quality factors such as TN, TAN, nitrite, TP, LP, COD, and SS used national standard methods: TN was determined by the alkaline potassium digestion UV spectrophotometry method; TAN was determined by Nessler’s reagent spectrophotometry; nitrite was determined by a spectrophotometric method; TP and LP were determined by the ammonium molybdate spectrophotometric method; COD was determined by a dichromate method; and SS were determined by the gravimetric method.

2.5. Data Statistics and Analysis

The breeding effectiveness indicators used in this study include the survival rate, specific growth rate, absolute weight gain rate, and feed conversion rate. The calculation formulas for these indicators are as follows:
S = 100% × b/a,
FCR = Tc/(We − Ws),
WGR (%) = (Wt − W0)/W0 × 100%.
SGR (%)/d = (lnWt − lnW0)/t × 100%
where
S—survival rate; a—number of stocked tails; b—number of tails at the end of the experiment. FCR—feed conversion rate, the mass of feed consumed to increase one unit of mass of the culture object; Tc—total intake in the experimental stage, kg; We, Ws—total mass of the breeding subjects at the end of the experiment and the beginning of the experiment, kg; WGR—weight gain rate, the ratio of the weight gain of the breeding subjects per unit of time to the initial body weight, %; SGR—Specific growth rate, the ratio of the growth rate to the number of days of growth, %; W0, Wt—average tail weight of breeding subjects at the initial and end of the experiment, g/ind. T—experimental time, d.
All statistical analyses were performed using the application SPSS 22.0 statistical analysis software. The Shapiro–Wilk test was used to test the normality and homogeneity of variance in all data. Normally distributed data were expressed as the mean and standard deviation and the t-test was used to test the level of significance between treatment and control groups; for non-normally distributed data, they were expressed as median and interquartile spacing and the Mann–Whitney non-parametric test was used to test the level of significance between treatment and control groups. p < 0.05 was taken as a significant difference and p < 0.01 as a highly significant difference.

3. Results

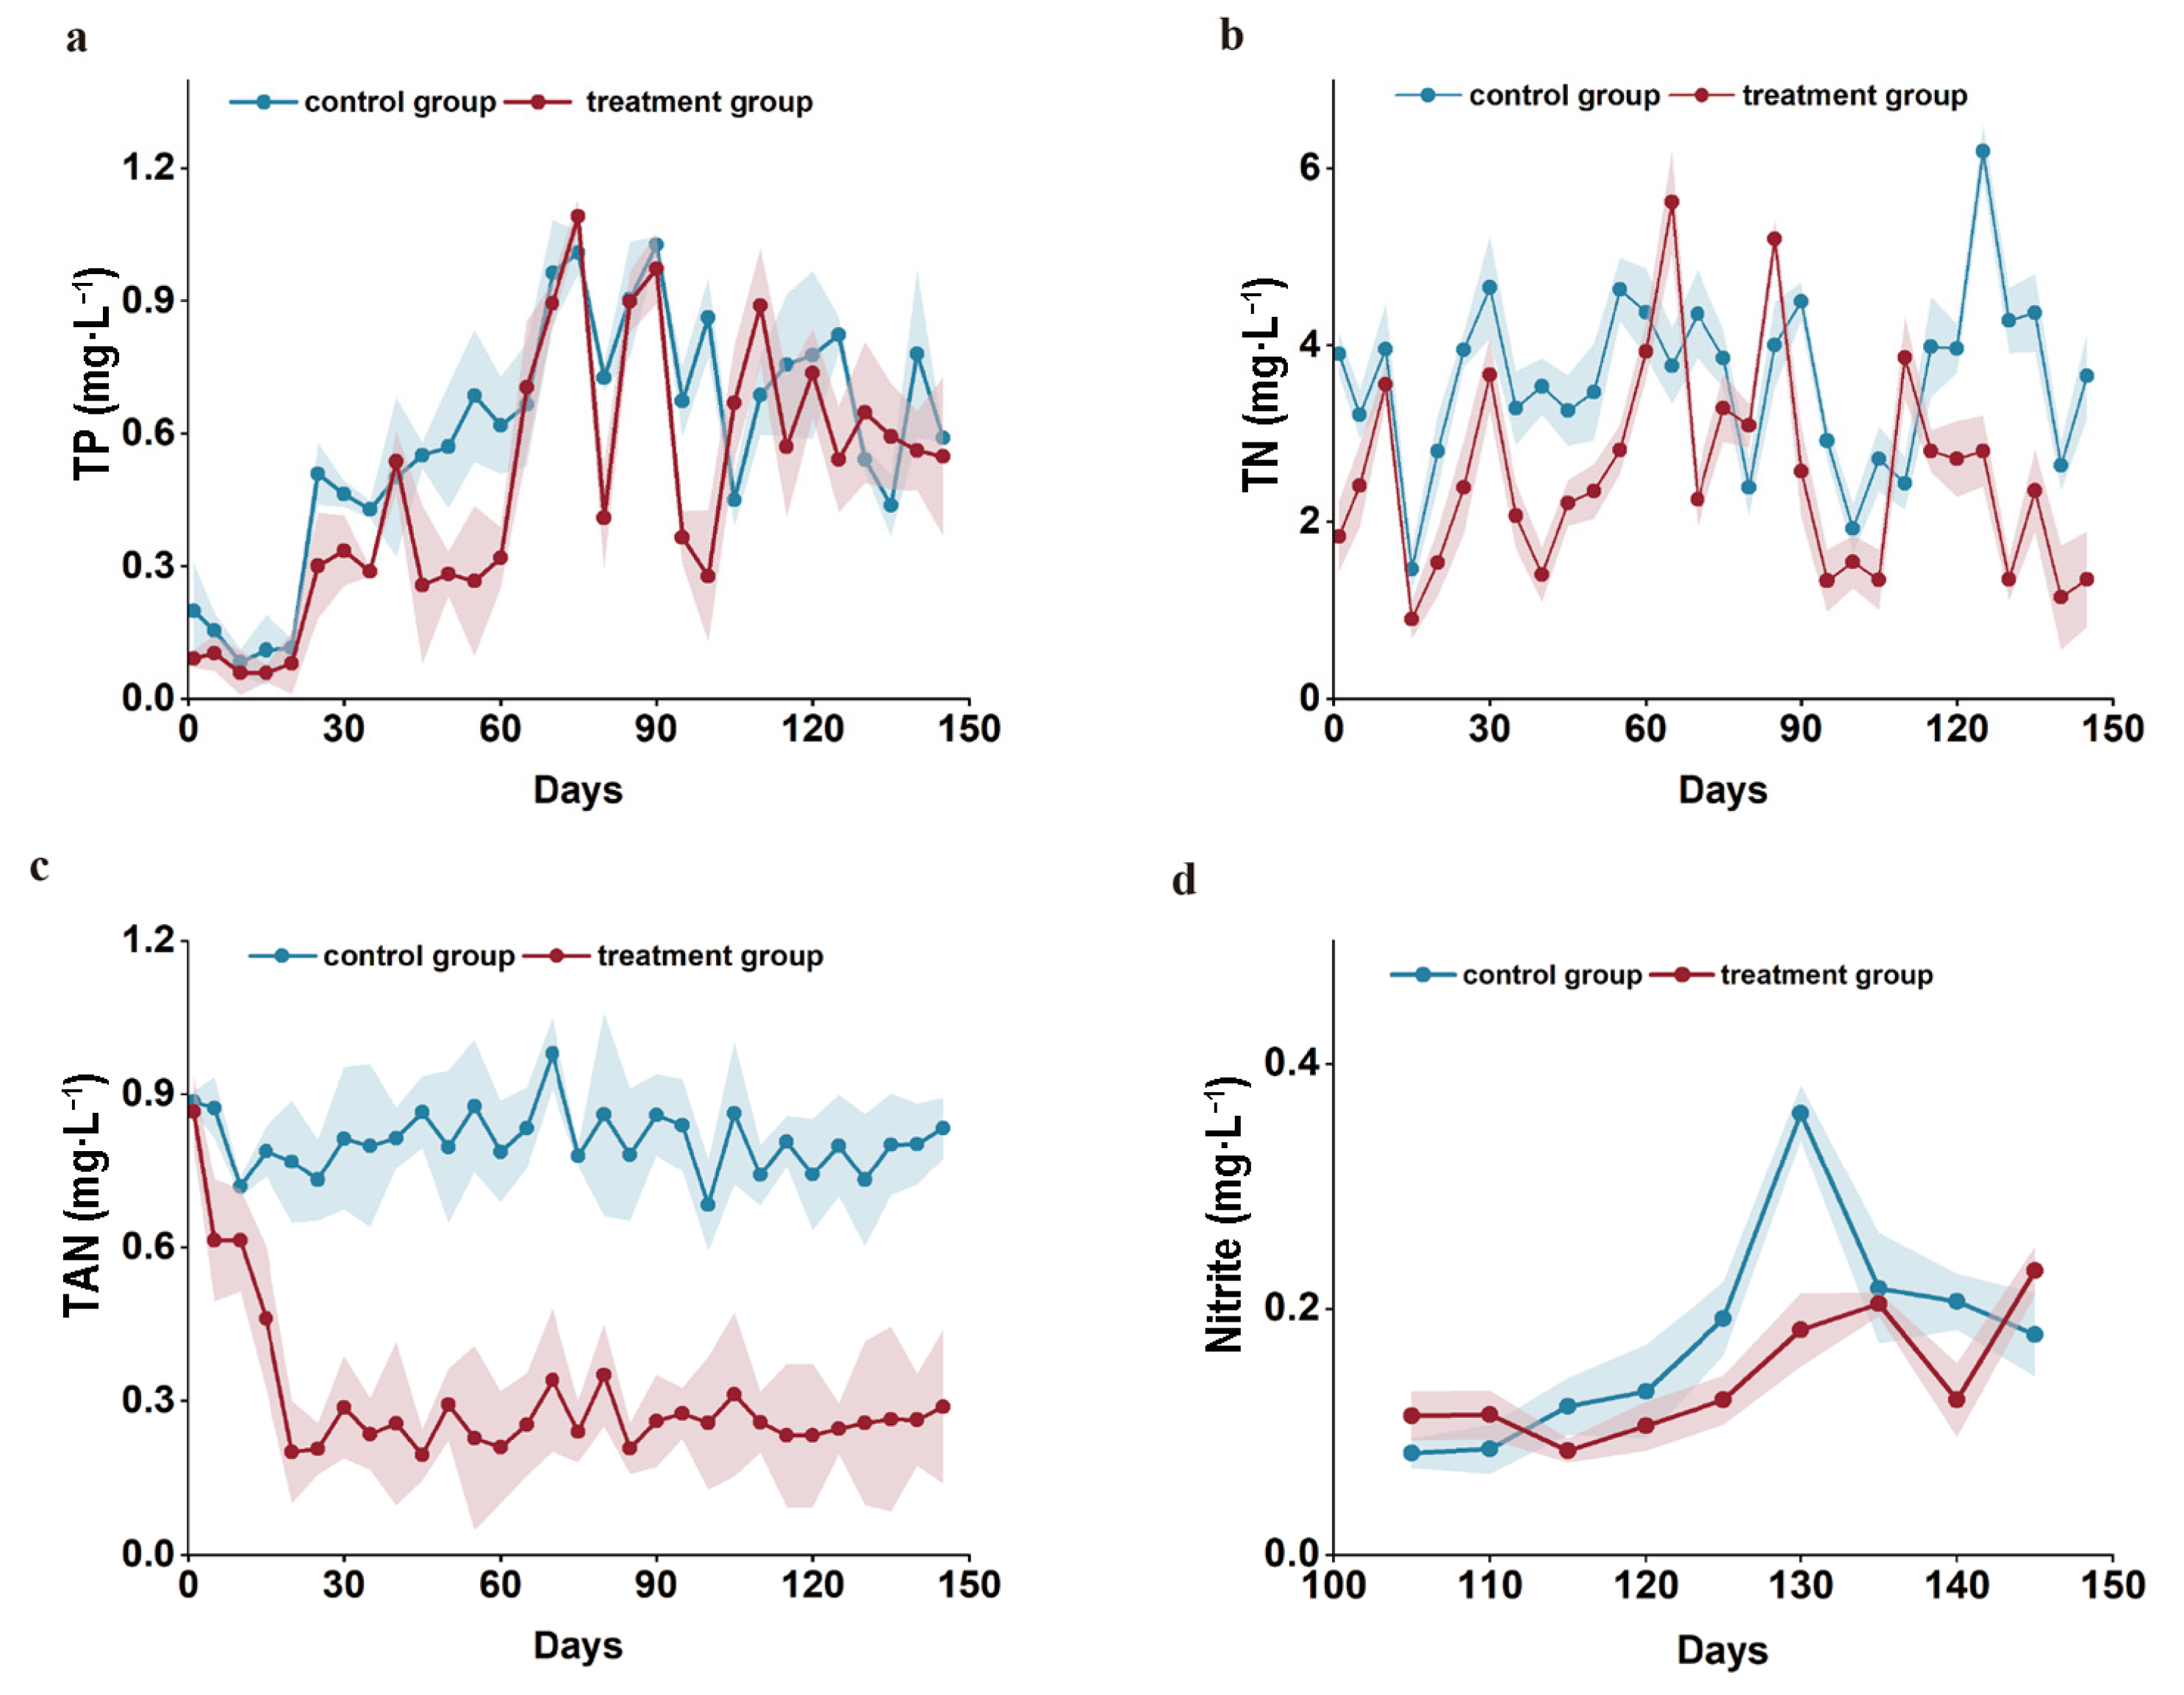
3.1. Effect of Water Quality Improvement in Largemouth Bass Pond Cultures

As shown in Table 2, background concentrations of major water quality factors in largemouth bass ponds before the start of the experiment were not significantly different (p > 0.05) between the treatment group and control group. During the experiment, no significant differences (p > 0.05) were observed in the pH, WT, DO, COD, and SS between the treatment group and the control group. The average TN, TAN, TP, nitrite, and LP levels in the treatment group were significantly lower than those in the control group by 26.2%, 74.7%, 53.9%, 30.7%, and 59.1% (p < 0.01), respectively. These results indicate that the water quality of the largemouth bass ponds cultured using the water treatment technology developed in this study was greatly improved.
Figure 1 illustrates the dynamic changes in major water quality factors in the largemouth bass culture pond during the experiment. The TN concentration in the treatment group fluctuated between 2.652 and 4.237 mg/L, while that in the control group ranged from 2.513 to 5.748 mg/L. The TN fluctuation in the treatment group was lower and, overall, it was lower than that in the control group (Figure 1a). The TAN concentration in the treatment group fluctuated between 0.211 and 0.563 mg/L, while that in the control group ranged from 0.262 to 1.897 mg/L. The TAN fluctuation in the treatment group was lower and showed a downward trend (Figure 1b). The TP concentration in the treatment group fluctuated between 0.279 and 0.873 mg/L, while that in the control group ranged from 0.264 to 1.564 mg/L. The TP fluctuation in the treatment group was lower and showed a downward trend (Figure 1c). The nitrite concentration in the treatment group fluctuated between 0.127 and 0.531 mg/L, while that in the control group ranged from 0.146 to 0.781 mg/L. The nitrite fluctuation in the treatment group was lower (Figure 1d).
Table 3 shows the condition of water quality factors in the tailwater of the culture pond for largemouth bass. Prior to the experiment, there were no significant differences in TN and TP concentrations between the experimental group and the control group (p > 0.05) in the tailwater of the culture pond for largemouth bass. During the experiment, the treatment group showed significantly lower levels of TN and TP compared to the control group by 43.1% and 63.4%, respectively (p < 0.01). The numerical values of TP and TN met the first-level standards specified in the “Requirement for Water Discharge from Freshwater Aquaculture Pond” (SC/T9101-2007) standard, which stipulate that the TP should be ≤0.5 mg/L and the TN should be ≤3.0 mg/L [9]. This indicates that the application of the water treatment technology in this study led to a significant reduction in the TN and TP discharged from the tailwater of the pond for largemouth black bass culture.
Figure 2 illustrates the dynamic changes in major water quality factors in the tailwater of the culture pond for largemouth bass during the experiment. The TN concentration in the treatment group fluctuated between 2.143 and 3.512 mg/L, while that in the control group ranged from 3.379 to 6.119 mg/L. The TN fluctuation in the treatment group was lower and, overall, it showed a downward trend (Figure 2a). The TP concentration in the treatment group fluctuated between 0.315 and 0.513 mg/L, while that in the control group ranged from 0.332 to 1.378 mg/L. The TP fluctuation in the treatment group was lower and, overall, it showed a downward trend (Figure 2b).

3.2. Effect of Water Quality Improvement in Japanese Eel Pond Culture

As shown in Table 4, background concentrations of major water quality factors in Japanese eel ponds before the start of the experiment were not significantly different (p > 0.05) between the treatment group and the control group. During the experiment, there were no significant differences in pH, WT, DO, LP, and SS between the treatment group and the control group (p > 0.05). The average TN, TAN, and TP levels in the treatment group were significantly lower than those in the control group by 30.1%, 62.1%, and 18.7%, respectively (p < 0.01). The average nitrite and COD in the treatment group were significantly lower than those in the control group by 18.3% and 16.0%, respectively (p < 0.05). These results indicate that the water quality of Japanese eel culture ponds improved significantly using the water treatment technology developed in this study.
Figure 3 illustrates the dynamic changes in major water quality factors in the culture pond for Japanese eel during the experiment. The TN concentration in the treatment group fluctuated between 0.901 and 5.623 mg/L, while that in the control group ranged from 1.470 to 6.195 mg/L. The TN fluctuation in the treatment group was lower and, overall, it showed a downward trend (Figure 3a). The TAN concentration in the treatment group fluctuated between 0.195 and 0.867 mg/L, while that in the control group ranged from 0.719 to 0.887 mg/L. The TAN in the treatment group showed a downward trend (Figure 3b). The TP concentration in the treatment group fluctuated between 0.059 and 1.093 mg/L, while that in the control group ranged from 0.083 to 1.010 mg/L. The TP concentration in both treatment groups showed an upward trend overall but the concentration in the treatment group was generally lower than that in the control group (Figure 3c). The nitrite concentration in the treatment group fluctuated between 0.085 and 0.231 mg/L, while that in the control group ranged from 0.083 to 0.360 mg/L. The nitrite concentration in the treatment group showed a downward trend with a smaller increase than that in the control group (Figure 3d). These results indicate that the water quality of Japanese eel culture ponds improved significantly using the water treatment technology developed in this study.
Table 5 shows the water quality factors of the tailwater in Japanese eel culture ponds. There were no significant differences in TN and TP concentrations between the treatment group and the control group before the experiment (p > 0.05). During the experiment, the TN and TP concentrations in the treatment group were significantly lower than those in the control group by 37.1% and 48.0%, respectively (p < 0.01), which met the first-grade standard of TP ≤ 0.5 mg/L and TN ≤ 3.0 mg/L specified in the “Requirement for Water Discharge from Freshwater Aquaculture Pond” (SC/T9101-2007) standard. These results indicate that the TN and TP emissions from Japanese eel culture tailwater in ponds with water treatment technology developed in this study were significantly reduced.
Figure 4 illustrates the dynamic changes in major water quality factors in the tailwater of the Japanese eel pond during the experiment. The TN concentration in the treatment group fluctuated between 0.324 and 6.880 mg/L, while that in the control group ranged from 4.018 to 6.623 mg/L. The TN fluctuation in the treatment group was lower and, overall, it showed a downward trend (Figure 4a). The TP concentration in the treatment group fluctuated between 0.047 and 1.163 mg/L, while that in the control group ranged from 0.547 to 0.988 mg/L. Overall, it showed an upward trend and the TP fluctuation in the treatment group was lower, showing a fluctuating downward trend (Figure 4b).

3.3. Effectiveness of Largemouth Bass Culture in Increasing Production

Table 6 shows that the culture effects of largemouth bass treatment groups were all better than those of the control group. The yield of largemouth bass per hectare in the ponds of the treatment group was about 80,226.37 kg and the survival rate, catching specification, and WGR were significantly higher in the treatment group than in the control group by 16.6%, 10.3%, and 32.1% (p < 0.05), respectively, while the FCR was significantly lower in the treatment group than in the control group by 17.8% (p < 0.05). The data indicated that the combined water quality treatment technology of biofilm water purification grid and compound microbial preparation applied in the experimental breeding ponds could significantly promote the growth of largemouth bass, improve the feed conversion efficiency, and enhance the breeding efficiency.

3.4. Effectiveness of Japanese Eel Culture in Increasing Production

Table 7 shows that the culture effects of the Japanese eel treatment groups were all better than those of the control group, that the yield of Japanese eel per hectare in the treatment group ponds was about 8642.02 kg, and that the catching specification, WGR, and SGR were significantly higher than those of the control group by 26.7%, 60.8%, and 43.2%, respectively (p < 0.05). The FCR was significantly lower than that of the control group by 15.6% (p < 0.05). The data indicated that the combined water quality treatment technology of biofilm water purification grid and compound microbial preparation applied in the experimental breeding ponds could significantly promote the growth of Japanese eel, improve the feed conversion efficiency, and enhance the breeding efficiency.

4. Discussion

4.1. Effect of Water Quality Improvement

The pond culture of largemouth bass and Japanese eel typically adopts the culture mode of high culture density and high feeding quantities. The decomposition of residual bait and excreta by microorganisms within the aquatic environment results in the generation of significant quantities of ammonia nitrogen and nitrite nitrogen, among other substances, which contribute to the degradation of water quality. Water quality is a crucial factor influencing the profitability of aquaculture. Deterioration of water quality not only incurs high management costs but may also lead to mass mortality of cultured organisms [10]. The traditional solution is to improve water quality through extensive water changes, which can consume a lot of water. The surface of the biofilm water purification grid has a microporous structure, which gives it a larger surface area and can provide large attachment sites for bacteria and other microorganisms to form a large number of biofilms. Advanced soaking and the regular addition of a complex microbial preparation to provide advantageous ecological niches for functional microbiota is conducive to promoting the growth and reproduction of functional microbiota and promoting the maturation of the biofilm film [11]. Through the addition of a complex microbial preparation, the excess organic matter in the water body as microbial metabolism of nutrients in order to reduce the content of harmful substances in aquaculture wastewater is an effective way to solve the problem of excessive baiting in the current pond aquaculture of a large number of pollutants [12]. Water conservation and emission reduction can be achieved by improving water quality and reducing water changes. The complex microbial preparations used in this study were the nitrifying bacteria strain NB-1, denitrifying bacteria strain DB-1, and denitrifying-phosphorus-removing-bacteria strain PP-1, which were screened by our team; these beneficial bacterial strains effectively convert ammonia nitrogen and nitrite nitrogen into nitrogen gas through assimilation, absorption of nitrogen and phosphorus, nitrification, and denitrification processes. Nitrification is the process of converting NH4+ to NO2 and NO3 by nitrosation and nitrifying bacteria under aerobic conditions, while denitrification is the process of converting NO2 and NO3 to N2 by denitrifying bacteria under anoxic or anaerobic conditions [13]. Denitrification is an alkaline reaction; each consumption of 1 mol nitrate produces 1 mol alkalinity and denitrification occurs, resulting in a rise in pH [14]. The occurrence of nitrification and degradation of organic matter will make the pH decrease and their combined effect will affect the pH value of the water body. During the test period, the pH value of the largemouth bass treatment group was 0.1% higher than that of the control group and the pH value of the Japanese eel treatment group was 8.4% higher than that of the control group, which was considered to be the result of the combined effect of the lower density of algae, greater degradation of organic matter, and stronger nitrification and denitrification in the treatment group than that of the control group. In addition, heterotrophic bacteria will absorb and degrade a large amount of organic matter and inorganic salts in the water to complete their own metabolism and reproduction and can decompose a large amount of phosphorus-containing organic matter, assimilating it into their own substances or turning it into inorganic phosphorus present in the water body. A decrease in COD leads to increases in DO. It has the functions of improving water quality, inhibiting the growth of pathogenic bacteria, and maintaining the ecological balance of the water environment. In this study, the combination of biofilm technology and complex microbial preparation was applied to the pond culture of largemouth bass and Japanese eel and the TN, TAN, nitrite, and TP of the treatment group were significantly lower than those of the control group. The results of the experiment were basically similar to the biofilm low-carbon aquaculture trial in ponds of shrimp (Litopenaeus vannamei) by Jiang Xinglong et al. [6]. However, the removal of phosphorus from the water body in their experiment mainly depended on the algae in the water body. The functional flora of the composite microbial preparation in this experiment inhibited the algal bloom to a certain extent through ecological niche competition. Phosphorus may primarily depend on bacterial assimilation and uptake of phosphorus storage by polyphosphate accumulating bacteria (PAOs) to reduce its mass concentration. Under aerobic conditions, PAOs are capable of assimilating and utilizing phosphate (HPO42−) present in their environment. The oxidation of intracellular polyhydroxyalkanoates (PHA) can provide energy for the PAO’s metabolic activities, with the resulting oxidized products being stored as polyphosphates (Poly-P) within the cells. Under anaerobic conditions, PAOs can degrade Poly-P stored within the cells and release it as orthophosphate (HPO42-) outside the cells, while simultaneously consuming organic matter to obtain energy. The PAOs exhibit a higher uptake of phosphorus under aerobic conditions than they release in anaerobic environments, thus achieving phosphorus removal efficiency [15,16,17].

4.2. Reduction Effect of Aquaculture Tail Water

Generally, farmed fish can only digest and absorb 20–25% of the protein in the fed bait and the rest exists in the aquatic environment in the form of ammonia nitrogen, bait residues, and feces. With the increase in the amount of culture and baiting, the accumulation of harmful substances such as nitrogen, phosphorus, and sulfide, which are harmful to fish organisms, is accelerating. When aquaculture water bodies are incapable of self-purification from these harmful substances, the growth and survival of aquaculture entities are impeded due to hypoxia and harmful metabolic wastes [18]. When there is a large accumulation of harmful substances in the aquaculture water body, the traditional solution is to discharge these harmful substances through a large number of water changes but this method will not only cause a waste of water and electricity resources; the discharge of untreated aquaculture wastewater may also cause secondary pollution of the water body. Biofilm water purification technology is a popular technology developed in recent years for freshwater aquaculture pond tailwater treatment type [19]. Compared with the traditional method, the biofilm method has the advantages of high efficiency and low economic cost in the process of water body remediation. Biofilm attached to the carrier is mainly composed of microorganisms and their extracellular polymers mixed together and the microorganisms play an important role in the process of nitrogen cycling in the water body. Studies have shown that biofilms influence the presence and transfer of pollutants and significantly degrade harmful substances such as ammonia nitrogen, nitrite, and nitrate in aquaculture water through mechanisms such as adsorption, accumulation, and degradation, thus realizing in situ denitrification of aquaculture tailwater for remediation and achieving the purpose of improving aquaculture water quality [20,21]. González et al. and Godos et al. cultured a bacterial–algal symbiotic biofilm formed by Chlorella activated sludge in a closed tubular reactor and investigated its efficacy in treating swine farm wastewater; the results showed that the reactor achieved more than 94% of TN and 70% to 90% of TP removal [22,23]. In this study, the combined use of biofilm water purification grids and complex microbial preparation generated a large biofilm of beneficial bacteria on the surface of the biofilm water purification grates, accelerating the removal efficiency of nitrogen and phosphorus pollutants. No water changed during the breeding period, reducing effluent discharge saves costs. From the experimental results, it can be seen that by applying the water treatment technology of combining biofilm water purification grids and complex microbial preparation to largemouth bass and Japanese eel breeding ponds, the TN and TP contents in the tail water of the breeding ponds of the largemouth bass and Japanese eel treatment groups were significantly lower than those of the control group. The values of TP and TN are in line with the primary standard of TP ≤ 0.5 mg/L and TN ≤ 3.0 mg/L as stipulated in the standard value of “Requirement for Water Discharge from Freshwater Aquaculture Pond” (SC/T9101-2007). It shows that the application of the water treatment technology of the combination of biofilm water purification grid and composite microbial agents in this study can significantly reduce the discharge of nitrogen and phosphorus pollutants in the tail water of largemouth bass and Japanese eel in ponds, which has a good effect of water conservation and emission reduction, saves the water resources for aquaculture and energy consumed in pumping water, and reduces the discharge of aquaculture wastewater, which is of great significance in reducing the surface pollution of aquaculture, saving the cost of production, and increasing the efficiency of aquaculture.

4.3. Effectiveness of Breeding to Increase Production

Microbiological preparation refers to biological preparations made of microorganisms and their metabolites that are beneficial to the host, as well as substances that promote the growth and reproduction of these beneficial microorganisms through a special process. Microbial agents are non-toxic and free of residue and secondary pollution. By inhibiting pathogenic microorganisms, the incidence of disease is thereby reduced. It has the effect of preventing diseases, improving growth performance, and improving the breeding environment [24]. The use of microbial agents can significantly reduce the morbidity of pond cultured fish, reduce farming losses, and increase production. The molecular ammonia in the water body is toxic to aquatic animals and when its mass concentration reaches a certain value in the water body, it will have a negative impact on the growth and development of aquicnimals until they die. The toxic effect of nitrite on fish is mainly the oxidation of ferrous hemoglobin into methemoglobin in the blood of fish, inhibiting the oxygen-carrying capacity of the blood and, in severe cases, making the fish hypoxic and thus making them suffocate to death. Improvement in the pond water environment can reduce the morbidity rate, which is conducive to improving the survival rate of breeding. Kozasa first applied a strain of Bacillus isolated from soil to the culture of Japanese eels in 1986 and found that the addition of Bacillus reduced the death of eels caused by pathogenic bacterial infections, which was the first time that probiotics were used in aquaculture [25]. Fish stress and mortality have been reduced by improving water quality, reducing water changes, avoiding invasion by exotic pathogenic microorganisms, and reducing disease outbreaks [26]. On the one hand, biofilm aquaculture technology can provide shade for aquaculture objects, reduce their stress and swimming, and reduce energy consumption; on the other hand, microorganisms on the biofilm can be formed into biofilm bioflocs through bioflocculation combined with organic debris and suspended matter in the aquaculture pond, which can be ingested by aquaculture objects, thus realizing the secondary utilization of feed protein and greatly improving feed utilization [27,28]. In this experiment, both largemouth bass and Japanese eel treatment groups were better than the control group. The survival rate of largemouth bass treatment group was significantly higher than that of the control group by 16.6%, the yield per hectare was higher than that of the control group by 19,483.42 kg, and the FCR was significantly lower than that of the control group by 17.8%. The survival rate of the Japanese eel treatment group was 1.3% higher than that of the control group, the yield per hectare was 1913.06 kg higher than that of the control group, and the FCR was significantly lower than that of the control group by 15.6%, which significantly increased the survival rate and the yield and, at the same time, improved the feed utilization and lowered the cost so that the comprehensive benefits were very obvious.

5. Conclusions

In this study, the combination of biofilm technology and complex microbial preparation was applied to the pond culture of largemouth bass and Japanese eel, which effectively improved the water quality and realized water saving, emission reduction, and yield increase. During the largemouth bass culture experiment, TN, TAN, TP, nitrite, and LP in the treatment group were extremely and significantly lower than those in the control group by 26.2%, 74.8%, 53.9%, 30.7%, and 59.0%, respectively (p < 0.01). There was no significant difference between the treatment group and the control group in terms of the pH, WT, DO, COD, and SS (p > 0.05). The TN and TP in the culture tail water were significantly lower than those in the control group by 43.1% and 63.4% (p < 0.05). The survival rate, catching specification, unit yield, and WGR were significantly higher than those in the control group by 16.6%, 10.3%, 32.1%, and 10.5% (p < 0.05) and the FCR was significantly lower than those in the control group by 17.8% (p < 0.05). During the Japanese eel culture experiment, TN, TAN, and TP in the treatment group were very significantly lower than those in the control group by 30.1%, 68.6%, and 18.7% (p < 0.01); nitrite and COD were significantly lower than those in the control group by 18.3% and 16.0% (p < 0.05); and there were no significant differences between the treatment group and the control group for pH, WT, DO, LP and SS (p > 0.05). The TN and TP in the culture tail water were significantly lower than those in the control group by 37.1% and 48.0% (p < 0.05); the starting specification, unit yield, WGR, and SGR were significantly higher than those in the control group by 26.7%, 28.4%, 60.8%, and 43.2% (p < 0.05) and the FCR was significantly lower than those in the control group by 15.6% (p < 0.05). The combined application of biofilm technology and complex microbial preparation can significantly reduce the pollution of pond farming itself and the surface pollution of neighboring waters and realize the secondary use of feed protein, with significant water saving, emission reduction, energy saving, low carbon, yield, and income effects, to promote the aquaculture industry to the direction of sustainable development and to achieve the effective use of water resources and the protection of the environment.
The current understanding of the tolerance mechanism of biofilm to toxic substances remains at the macro level and it is necessary to reasonably utilize genomics, metabolomics, and other research means to analyze the tolerance mechanism and removal mechanism of biofilm in different environments from a microscopic point of view. There are many research reports on biofilm treatment of general domestic wastewater with some engineering applications; biofilm also shows great potential in the removal of toxic substances in aquaculture wastewater but it is mostly in the laboratory research state. Therefore, the adaptability of biofilm in special wastewater treatment can be improved through strain screening and domestication, microbial enrichment, targeted addition of bacteria and algae, and the development of appropriate reactor configurations according to the characteristics of microorganisms and wastewater so as to further promote the engineering application of biofilm in special wastewater.

Author Contributions

Methodology, X.J.; software, Z.W.; validation, Z.W. and Y.W.; formal analysis, Z.W.; investigation, Z.W. and Y.W.; resources, X.J.; data curation, Z.W.; writing—original draft preparation, Z.W. and Y.W.; writing—review and editing, X.J.; visualization, Z.W.; supervision, X.J.; project administration, X.J.; funding acquisition, X.J. All authors have read and agreed to the published version of the manuscript.

Funding

This work was sponsored by the National Key Research and Development Program of China “Integration and Demonstration of Key Technologies for Precision and Efficient Aquaculture of Specialty Fishes” (2020YFD0900102) and Fujian Provincial Science and Technology Department University-Industry Cooperation Program (2020N5009). The Scientific Research Fund of Engineeing Research Center of the Modern Industry Technology for Eel Ministry of Education (Project No. RE202306; No. RE202204; No. RE202203).

Institutional Review Board Statement

Not applicable.

Informed Consent Statement

Not applicable.

Data Availability Statement

Data are contained within the article.

Conflicts of Interest

The authors declare no conflict of interest.

References

  1. Garlock, T.; Asche, F.; Anderson, J.; Ceballos-Concha, A.; Love, D.C.; Osmundsen, T.C.; Pincinato, R.B.M. Aquaculture: The missing contributor in the food security agenda. Glob. Food Secur. 2022, 32, 100620. [Google Scholar] [CrossRef]
  2. Little, D.C.; Newton, R.W.; Beveridge, M. Aquaculture: A rapidly growing and significant source of sustainable food? Status, transitions and potential. Proc. Nutr. Soc. 2016, 75, 274–286. [Google Scholar] [CrossRef]
  3. Alvarado-Ramírez, L.; Santiesteban-Romero, B.; Poss, G.; Sosa-Hernández, J.E.; Iqbal, H.; Parra-Saldívar, R.; Bonaccorso, A.D.; Melchor-Martínez, E.M. Sustainable production of biofuels and bioderivatives from aquaculture and marine waste. Front. Chem. Eng. 2023, 4, 1072761. [Google Scholar] [CrossRef]
  4. Piedrahita, R.H. Reducing the potential environmental impact of tank aquaculture effluents through intensification and recirculation. Aquaculture 2003, 226, 35–44. [Google Scholar] [CrossRef]
  5. Jiang, X.; Deng, L. Water and sediment quality improvement in freshwater ponds in biofilm bacteria-algae system. Oceanol. Limnol. Sin. Hai Yang Yu Hu Chao 2015, 46, 603–610. [Google Scholar]
  6. Jiang, X.; Deng, L. Technique of pond aquaculture with biofilm low-carbon for white shrimp Litopenaeus vannamei. Oceanol. Limnol. Sin. Hai Yang Yu Hu Chao 2013, 44, 1536–1543. [Google Scholar]
  7. Moreno Osorio, J.H.; Pollio, A.; Frunzo, L.; Lens, P.N.L.; Esposito, G. A review of microalgal biofilm technologies: Definition, applications, settings and analysis. Front. Chem. Eng. 2021, 3, 737710. [Google Scholar] [CrossRef]
  8. Chen, C.; Wang, Y.; Liu, S.; Feng, R.; Gu, X.; Qiao, C. Research on the application of compound microorganism preparation in reusing urban reclaimed water in circulating cooling water system. Water Sci. Technol. 2019, 80, 1763–1773. [Google Scholar] [CrossRef] [PubMed]
  9. SC/T9101-2007; Requirement for Water Discharge from Freshwater Aquaculture Pond. China Agriculture Press: Beijing, China, 2007.
  10. Nugegoda, D.; Kibria, G. Effects of environmental chemicals on fish thyroid function: Implications for fisheries and aquaculture in Australia. Gen. Comp. Endocrinol. 2017, 244, 40–53. [Google Scholar] [CrossRef]
  11. Lariyah, M.S.; Mohiyaden, H.A.; Hayder, G.; Hayder, G.; Hussein, A.; Basri, H.; Sabri, A.F.; Noh, M.N. Application of Moving Bed Biofilm Reactor (MBBR) and Integrated Fixed Activated Sludge (IFAS) for Biological River Water Purification System: A Short Review. IOP Conf. Ser. Earth Environ. Sci. 2016, 32, 12005. [Google Scholar] [CrossRef]
  12. Wang, Q.; Wu, S.; Chu, G.; Zhang, Z.; She, Z.; Zhao, Y.; Guo, L.; Jin, C.; Gao, M. Metagenomic analysis and microbial activity shifts reveal the effect of the carbon/nitrogen ratio on the nitrogen removal performance of a moving bed biofilm reactor treating mariculture wastewater. J. Water Process Eng. 2023, 51, 103363. [Google Scholar] [CrossRef]
  13. Wu, S.; Lv, N.; Zhou, Y.; Li, X. Simultaneous nitrogen removal via heterotrophic nitrification and aerobic denitrification by a novel Lysinibacillus fusiformis B301. Water Environ. Res 2023, 95, e10850. [Google Scholar] [CrossRef] [PubMed]
  14. Boyd, C.E. Water quality in ponds for aquaculture. J. Fish. Board Can. 1990, 10, 1799–1809. [Google Scholar]
  15. Kuba, T.; Smolders, G.; van Loosdrecht, M.C.M.; Heijnen, J.J. Biological Phosphorus Removal from Wastewater by Anaerobic-Anoxic Sequencing Batch Reactor. Water Sci. Technol. 1993, 27, 241–252. [Google Scholar] [CrossRef]
  16. Gerber, A.; De Villiers, R.H.; Mostert, E.S.; Van Riet, C. The phenomenon of simultaneous phosphate uptake and release, and its importance in biological nutrient removal. In Biological Phosphate Removal from Wastewaters; Elsevier: Amsterdam, The Netherlands, 1987; pp. 123–134. [Google Scholar]
  17. Hascoet, M.C.; Florentz, M. Influence of nitrates on biological phosphorus removal from wastewater. SA Waterbull. 1985, 11, 1–8. [Google Scholar]
  18. Kong, W.; Huang, S.; Shi, F.; Yang, Z.; Feng, Y.; Khatoon, Z.; Zhou, J.; Xiao, Y. Study on release kinetics of nitrogen and phosphorus from fish feed. Aquac. Res. 2020, 51, 3216–3229. [Google Scholar] [CrossRef]
  19. Luan, Y.; Qiu, C.; Li, Y.; Kang, W.; Zhang, J.; Liao, Z.; Bi, X. A highly packed biofilm reactor with cycle cleaning for the efficient treatment of rural wastewater. Water 2021, 13, 369. [Google Scholar] [CrossRef]
  20. Rava, E.; Chirwa, E. Effect of carrier fill ratio on biofilm properties and performance of a hybrid fixed-film bioreactor treating coal gasification wastewater for the removal of COD, phenols and ammonia-nitrogen. Water Sci. Technol. 2016, 73, 2461–2467. [Google Scholar] [CrossRef]
  21. Xiao, Y.; Wu, M.; Liu, H.; Xu, J. Removal of NH4 (+)-N from polluted water resources by bioremediation of biofilm process with elastic packing & micropore aerator. Huan Jing Ke Xue Huanjing Kexue 2001, 22, 40–43. [Google Scholar]
  22. González, C.; Marciniak, J.; Villaverde, S.; Leon, C.; García, P.A.; Munoz, R. Efficient nutrient removal from swine manure in a tubular biofilm photo-bioreactor using algae-bacteria consortia. Water Sci. Technol. 2008, 58, 95–102. [Google Scholar] [CrossRef]
  23. De Godos, I.; González, C.; Becares, E.; García-Encina, P.A.; Muñoz, R. Simultaneous nutrients and carbon removal during pretreated swine slurry degradation in a tubular biofilm photobioreactor. Appl. Microbiol. Biot. 2009, 82, 187–194. [Google Scholar] [CrossRef] [PubMed]
  24. Lukwambe, B.; Qiuqian, L.; Wu, J.; Zhang, D.; Wang, K.; Zheng, Z. The effects of commercial microbial agents (probiotics) on phytoplankton community structure in intensive white shrimp (Litopenaeus vannamei) aquaculture ponds. Aquacult. Int. 2015, 23, 1443–1455. [Google Scholar] [CrossRef]
  25. Kozasa, M. Probiotics for animal use in Japan. Rev. Sci. Tech. 1989, 8, 517–531. [Google Scholar] [CrossRef]
  26. Durigon, E.G.; Schneider, T.L.S.; Marasca, S.; Hermes, L.B.; Uczay, J.; Peixoto, N.C.; Lazzari, R. Compensatory gain and oxidative response of tilapia rearing at high densities in a biofloc system and transferred to clear water system. Aquaculture 2023, 577, 739984. [Google Scholar] [CrossRef]
  27. McCusker, S.; Warberg, M.B.; Davies, S.J.; Valente, C.D.S.; Johnson, M.P.; Cooney, R.; Wan, A.H.L. Biofloc technology as part of a sustainable aquaculture system: A review on the status and innovations for its expansion. Aquac. Fish Fish. 2023, 3, 331–352. [Google Scholar] [CrossRef]
  28. Luo, G.; Li, J.; Xu, J.; Liu, W.; Tan, H. Effects of dissolved organic carbon and total ammonia nitrogen concentrations with the same DOC/TAN on biofloc performance. Aquaculture 2023, 574, 739713. [Google Scholar] [CrossRef]
Figure 1. The dynamic change trend of pond water quality factors during largemouth bass culture (a) is the dynamic change trend of TP in largemouth bass culture ponds, (b) is the dynamic change trend of TN in largemouth bass culture ponds, (c) is the dynamic change trend of TAN in largemouth bass culture ponds, and (d) a is the dynamic change trend of nitrite in largemouth bass culture ponds. The shaded part of the figure shows the continuity error.
Sustainability 15 16663 g001
Figure 2. The dynamic change trend of water quality factors in the tailwater of largemouth bass culture during the experiment (a) is the dynamic change trend of TN in largemouth bass culture and (b) is the dynamic change trend of TP in largemouth bass culture. The shaded part of the figure shows the continuity error.
Sustainability 15 16663 g002
Figure 3. The dynamic change in the trend of pond water quality factors during Japanese eel culture (a) is the dynamic change trend of TP in Japanese eel culture ponds, (b) is the dynamic change trend of TN in Japanese eel culture ponds, (c) is the dynamic change trend of TAN in Japanese eel culture ponds, and (d) a is the dynamic change trend of Nitrite in Japanese eel culture ponds. The shaded part of the figure shows the continuity error.
Sustainability 15 16663 g003
Figure 4. The dynamic change trend of water quality factors in the tailwater of Japanese eel culture during the experiment (a) is the dynamic change trend of TN in Japanese eel culture and (b) is the dynamic change trend of TP in Japanese eel culture. The shaded part of the figure shows the continuity error.
Sustainability 15 16663 g004
Table 1. Introduction of breeding seedlings.
EventLargemouth BassJapanese Eel
Treatment GroupControl GroupTreatment GroupControl Group
Pond area (ha)0.647 ± 0.0030.653 ± 0.0080.849 ± 0.030.843 ± 0.08
Breeding density (ind/ha)158,207 ± 6795154,176 ± 526542,750 ± 244942,753 ± 2245
Tail weight (g/ind)9.0 ± 1.09.0 ± 1.096 ± 0.3395 ± 0.38
Table 2. Water quality indicators of cultured ponds during largemouth bass experiments.
FactorBackground ConcentrationConcentration during Culture
Treatment GroupControl GroupTreatment GroupControl GroupIncrease or Decrease %
pH7.03 ± 0.017.02 ± 0.217.09 ± 0.02 a7.08 ± 0.03 a+0.1
WT (°C)28.72 ± 0.1629.11 ± 0.1331.17 ± 0.35 a31.45 ± 0.23 a−0.9
DO (mg/L)4.27 ± 0.124.28 ± 0.244.90 ± 0.35 a4.60 ± 0.19 a+6.5
TN (mg/L)2.743 ± 0.1412.843 ± 0.4043.636 ± 0.359 a4.926 ± 0.355 b−26.2
TAN (mg/L)0.211 ± 0.0140.262 ± 0.0280.324 ± 0.035 a1.282 ± 0.226 b−74.7
TP (mg/L)0.279 ± 0.0250.264 ± 0.0440.597 ± 0.187 a1.295 ± 0.271 b−53.9
LP (mg/L)0.177 ± 0.0170.175 ± 0.0270.330 ± 0.051 a0.807 ± 0.232 b−59.1
COD (mg/L)9.6 ± 0.910.4 ± 0.67.8 ± 0.9 a9.6 ± 1.3 a−18.8
SS (mg/L)75 ± 674 ± 1042 ± 3 a58 ± 5 a−27.6
Nitrite (mg/L)0.127 ± 0.0140.146 ± 0.0320.356 ± 0.055 a0.514 ± 0.194 b−30.7
Note: in the same line, different superscript letters indicate significant differences between values (p < 0.05), while the same superscript letters indicate no significant differences (p > 0.05).
Table 3. Water quality indicators of pond aquaculture tail water during the largemouth bass experiment.
FactorBackground ConcentrationConcentration during Culture
Treatment GroupControl GroupTreatment GroupControl GroupIncrease or Decrease %
TN (mg/L)3.326 ± 0.2743.379 ± 0.2322.977 ± 0.194 a5.232 ± 0.649 b−43.1
TP (mg/L)0.315 ± 0.0510.332 ± 0.0380.405 ± 0.129 a1.106 ± 0.271 b−63.4
Note: in the same line, different superscript letters indicate significant differences between values (p < 0.05), while the same superscript letters indicate no significant differences (p > 0.05).
Table 4. Water quality indicators of cultured ponds during Japanese eel experiments.
FactorBackground ConcentrationConcentration during Culture
Treatment GroupControl GroupTreatment GroupControl GroupIncrease or Decrease %
pH7.17 ± 0.017.37 ± 0.217.64 ± 0.43 a7.05 ± 0.43 a+8.4
WT (°C)25.5 ± 0.125.3 ± 0.427.0 ± 1.6 a28.6 ± 1.1 a−5.6
DO (mg/L)7.76 ± 0.077.81 ± 0.18.28 ± 0.31 a8.06 ± 0.25 a+2.7
TN (mg/L)1.841 ± 0.0293.906 ± 0.4042.526 ± 1.148 a3.616 ± 0.933 b−30.1
TAN (mg/L)0.867 ± 0.0090.887 ± 0.0190.307 ± 0.039 a0.809 ± 0.060 b−62.1
TP (mg/L)0.091 ± 0.0250.199 ± 0.0140.479 ± 0.292 a0.589 ± 0.261 b−18.7
LP (mg/L)0.043 ± 0.0090.095 ± 0.0090.315 ± 0.207 a0.364 ± 0.171 a−13.5
COD (mg/L)8.8 ± 0.38.4 ± 0.26.3 ± 3.0 a7.5 ± 3.2 b−16.0
SS (mg/L)42 ± 346 ± 936 ± 14 a47 ± 19 a−15.8
Nitrite (mg/L)0.113 ± 0.0030.083 ± 0.0030.143 ± 017 a0.175 ± 0.022 b−18.3
Note: in the same line, different superscript letters indicate significant differences between values (p < 0.05), while the same superscript letters indicate no significant differences (p > 0.05).
Table 5. Water quality indicators of pond aquaculture tail water during the Japanese eel experiment.
FactorBackground ConcentrationConcentration during Culture
Treatment GroupControl GroupTreatment GroupControl GroupIncrease or Decrease %
TN (mg/L)4.076 ± 0.0194.231 ± 0.0102.935 ± 0.053 a4.664 ± 1.633 b−37.1
TP (mg/L)0.426 ± 0.0200.569 ± 0.0120.445 ± 0.133 a0.855 ± 0.364 b−48.0
Note: in the same line, different superscript letters indicate significant differences between values (p < 0.05), while the same superscript letters indicate no significant differences (p > 0.05).
Table 6. Statistical table of largemouth bass culture results.
EventTreatment GroupControl GroupIncrease or Decrease %
Survival rate (%)74.3 ± 3.2 a63.7 ± 3.9 b16.6
Capture specifications (g/ind)682.5 ± 74.4 a618.5 ± 54.3 b10.3
Unit production (kg/ha)80,226.37 ± 874.56 a60,742.95 ± 533.28 b32.1
WGR (%)74.83 ± 7.2 a67.72 ± 5.03 b10.5
SGR (%/d)2.89 ± 0.31 a2.82 ± 0.24 a2.5
FCR1.34 ± 0.05 a1.63 ± 0.13 b−17.8
Note: in the same line, different superscript letters indicate significant differences between values (p < 0.05), while the same superscript letters indicate no significant differences (p > 0.05).
Table 7. Statistical table of Japanese eel culture results.
EventTreatment GroupControl GroupIncrease or
Decrease %
Survival rate (%)97.8 ± 1.4 a96.5 ± 1.5 a1.3
Capture specifications (g/ind)206.7 ± 13.63 a163.1 ± 1.12 b26.7
Unit production (kg/ha)8642.02 ± 208.53 a6728.96 ± 66.8 b28.4
WGR (%)115.3 ± 6.17 a71.7 ± 6.52 b60.8
SGR (%/d)0.53 ± 0.05 a0.37 ± 0.03 b43.2
FCR1.41 ± 0.08 a1.67 ± 0.11 b−15.6
Note: in the same line, different superscript letters indicate significant differences between values (p < 0.05), while the same superscript letters indicate no significant differences (p > 0.05).
Disclaimer/Publisher’s Note: The statements, opinions and data contained in all publications are solely those of the individual author(s) and contributor(s) and not of MDPI and/or the editor(s). MDPI and/or the editor(s) disclaim responsibility for any injury to people or property resulting from any ideas, methods, instructions or products referred to in the content.

