

Criteria for and Policy Implications of Setting Recovery Priorities of National Functions during Disruptions by Disasters


Abstract
:1. Introduction
2. Materials and Methods
3. Survey Implementation and Statistical Analysis
3.1. Classification of Functions Using the Business Reference Model
3.2. Survey Structure and Maximum Acceptable Outage
3.3. Analysis of the Survey Result Consistency through Cronbach’s Alpha
3.4. Analysis of the Association between Regional Differences and National Function Criticality Using Cramer’s V
4. Establishment of Criteria for Priority of Recovering National Functions
4.1. Results
4.2. Potential Implications of National Function Priorities in Emergency Situations
5. Conclusions
Author Contributions
Funding
Institutional Review Board Statement
Informed Consent Statement
Data Availability Statement
Conflicts of Interest
References
- Ter-Mkrtchyan, A.V.; Franklin, A.L. Stakeholder Analysis in the Context of Natural Disaster Mitigation: The Case of Flooding in Three U.S. Cities. Sustainability 2023, 15, 14945. [Google Scholar] [CrossRef]
- Bruneau, M.; Chang, S.E.; Eguchi, R.T.; Lee, G.C.; O’Rourke, T.D.; Reinhorn, A.M.; Shinozuka, M.; Tierney, K.; Wallace, W.A.; Von Winterfeldt, D. A framework to quantitatively assess and enhance the seismic resilience of communities. Earthq. Spectra 2003, 19, 733–752. [Google Scholar] [CrossRef]
- Ryu, S.-I. Analysis of Priorities among Functions of Disaster Response in South Korea. Korean J. Natl. Crisis Emerg. Manag. 2007, 1, 128–145. [Google Scholar]
- Kim, J.; Park, C. A comparative study on the importance of the components of the community disaster resilience on disaster response. J. Soc. Disaster Inf. 2019, 15, 339–346. [Google Scholar]
- Miyama, E. Regional Agriculture and Social Capital after Massive Natural Disasters: The Case of Miyagi Prefecture after the Great East Japan Earthquake. Sustainability 2023, 15, 11725. [Google Scholar] [CrossRef]
- Nam, S.-J.; Yim, J.-H. A Case Study for the Reorganization of the Standard of Government Function Classification (BRM): Focusing on the’Cultural Heritage’Policy Area. J. Korean Soc. Arch. Rec. Manag. 2017, 17, 129–163. [Google Scholar] [CrossRef]
- Lee, S.-J.; Kim, H.-K. A Case Study on Improvement of Records Management Reference Table by Reorganizing BRM: The case of Reorganization of Seoul’s BRM and Records Management Reference Table. Korean J. Arch. Stud. 2016, 50, 273–309. [Google Scholar]
- Noh, Y.; Park, Y.-H. A Study on the Improvement of the BRM Classification System for Policy Information Service. J. Korean Soc. Libr. Inf. Sci. 2014, 48, 135–171. [Google Scholar]
- Jung, K. Sources of Organizational Resilience for Sustainable Communities: An Institutional Collective Action Perspective. Sustainability 2017, 9, 1141. [Google Scholar] [CrossRef]
- Haavik, T.K. Societal resilience–Clarifying the concept and upscaling the scope. Saf. Sci. 2020, 132, 104964. [Google Scholar] [CrossRef]
- Chester, M.; El Asmar, M.; Hayes, S.; Desha, C. Post-Disaster Infrastructure Delivery for Resilience. Sustainability 2021, 13, 3458. [Google Scholar] [CrossRef]
- Charlesworth, E.; Fien, J. Design and Disaster Resilience: Toward a Role for Design in Disaster Mitigation and Recovery. Architecture 2022, 2, 292–306. [Google Scholar] [CrossRef]
- Sigmund, Z.; Radujković, M.; Atalić, J. The Role of Disaster Risk Governance for Effective Post-Disaster Risk Management—Case of Croatia. Buildings 2022, 12, 420. [Google Scholar] [CrossRef]
- Kalogiannidis, S.; Kalfas, D.; Chatzitheodoridis, F.; Lekkas, E. Role of Governance in Developing Disaster Resiliency and Its Impact on Economic Sustainability. J. Risk Financ. Manag. 2023, 16, 151. [Google Scholar] [CrossRef]
- Iuchi, K.; Mutter, J. Governing community relocation after major disasters: An analysis of three different approaches and its outcomes in Asia. Prog. Disaster Sci. 2020, 6, 100071. [Google Scholar] [CrossRef]
- Perney, M.E.P.; D’Angelo, G. Local Governance Support Tools for Disaster Risk Reduction and Climate Adaptation Strategies: The EU Contribution in the Case Study of the Municipality of Naples. Sustainability 2023, 15, 11716. [Google Scholar] [CrossRef]
- Smith, J.C.; Whiley, H.; Ross, K.E. Climate Change and Health: Local Government Capacity for Health Protection in Australia. Int. J. Environ. Res. Public Health 2023, 20, 1750. [Google Scholar] [CrossRef]
- Zhao, J.; Lee, J.Y.; Camenzind, D.; Wolcott, M.; Lewis, K.; Gillham, O. Multi-Component Resilience Assessment Framework for a Supply Chain System. Sustainability 2023, 15, 6197. [Google Scholar] [CrossRef]
- Wang, T.; Liu, Y.; Li, Q.; Du, P.; Zheng, X.; Gao, Q. State-of-the-Art Review of the Resilience of Urban Bridge Networks. Sustainability 2023, 15, 989. [Google Scholar] [CrossRef]
- Hofmann, S.Z. Build Back Better and Long-Term Housing Recovery: Assessing Community Housing Resilience and the Role of Insurance Post Disaster. Sustainability 2022, 14, 5623. [Google Scholar] [CrossRef]
- Patel, R.K.; Pamidimukkala, A.; Kermanshachi, S.; Etminani-Ghasrodashti, R. Disaster Preparedness and Awareness among University Students: A Structural Equation Analysis. Int. J. Environ. Res. Public Health 2023, 20, 4447. [Google Scholar] [CrossRef]
- Zhai, L.; Lee, J.E. Analyzing the Disaster Preparedness Capability of Local Government Using AHP: Zhengzhou 7.20 Rainstorm Disaster. Int. J. Environ. Res. Public Health 2023, 20, 952. [Google Scholar] [CrossRef] [PubMed]
- Izumi, T.; Shaw, R.; Djalante, R.; Ishiwatari, M.; Komino, T. Disaster risk reduction and innovations. Prog. Disaster Sci. 2019, 2, 100033. [Google Scholar] [CrossRef]
- Kelman, I. Axioms and actions for preventing disasters. Prog. Disaster Sci. 2019, 2, 100008. [Google Scholar] [CrossRef]
- Sakurai, M.; Murayama, Y. Information technologies and disaster management—Benefits and issues. Prog. Disaster Sci. 2019, 2, 100012. [Google Scholar] [CrossRef]
- Skipper, J.B.; Hanna, J.B. Minimizing supply chain disruption risk through enhanced flexibility. Int. J. Phys. Distrib. Logist. Manag. 2009, 39, 404–427. [Google Scholar] [CrossRef]
- Lindström, J.; Samuelsson, S.; Hägerfors, A. Business continuity planning methodology. Disaster Prev. Manag. Int. J. 2010, 19, 243–255. [Google Scholar] [CrossRef]
- Kato, M.; Charoenrat, T. Business continuity management of small and medium sized enterprises: Evidence from Thailand. Int. J. Disaster Risk Reduct. 2018, 27, 577–587. [Google Scholar] [CrossRef]
- Torabi, S.A.; Giahi, R.; Sahebjamnia, N. An enhanced risk assessment framework for business continuity management systems. Saf. Sci. 2016, 89, 201–218. [Google Scholar] [CrossRef]
- De Felice, F.; Baffo, I.; Petrillo, A. Critical Infrastructures Overview: Past, Present and Future. Sustainability 2022, 14, 2233. [Google Scholar] [CrossRef]
- Cabinet Office of Japan. Guide to Business Continuity for Local Public Entities During Earthquake Occurrence and Its Commentary, 1st ed.; Cabinet Office of Japan Government: Tokyo, Japan, 2010; pp. 24–36.
- Shin, J.; Yun, H.; Kwon, J.; Yang, S. A study on policy for introduction of continuity of operation plan of local government: Focus on functional classification and recovery time objectives. J. Korean Soc. Hazard Mitig. 2018, 18, 147–153. [Google Scholar] [CrossRef]
- Estall, H. Business Continuity Management Systems: Implementation and Certification to ISO 22301; BCS, The Chartered Institute: London, UK, 2012. [Google Scholar]
- Kwon, H.; Shin, Y.; Jeong, J.; Kim, K.; Shin, D. Measures to Ensure the Sustainability of Information Systems in the COVID-19 Environment. Sustainability 2023, 15, 35. [Google Scholar] [CrossRef]
- Wong, W.N.Z.Z.; Shi, J. Business Continuity Management System: A Complete Guide to Implementing ISO 22301; Kogan Page Publishers: London, UK, 2014; pp. 1–273. [Google Scholar]
- Dasgupta, R.; Basu, M.; Kumar, P.; Johnson, B.A.; Mitra, B.K.; Avtar, R.; Shaw, R. A rapid indicator-based assessment of foreign resident preparedness in Japan during Typhoon Hagibis. Int. J. Disaster Risk Reduct. 2020, 51, 101849. [Google Scholar] [CrossRef]
- Yun, H.S. Final Report on the Development of a Disaster Risk Reduction Activity Management System Support Program and Management Technology; MPSS-Nature-2015-80; Ministry of the Interior and Safety: Seoul, Republic of Korea, 2018; p. 931. [Google Scholar]
- CISA. National Critical Functions Set. Available online: https://www.cisa.gov/national-critical-functions-set (accessed on 21 October 2023).
- Juseong, H.; Wontae, L.; Sunhee, C.; Dongi, S.; Woogi, L. Research on Architecture Policy for Knowledge Informatization—A Study on the Development Strategy of a Government Integrated Computer Center Based on EA (Enterprise Architecture); Information and Communication Policy Institute: Gwacheon, Republic of Korea, 2008; p. 188. ISBN 9788982424205. [Google Scholar]
- Gøtze, J. European Interoperability Reference Architecture. Available online: https://eavoices.com/2015/07/24/european-interoperability-reference-architecture/ (accessed on 21 October 2023).
- Fenxia, Z. The community resilience measurement throughout the COVID-19 pandemic and beyond-an empirical study based on data from Shanghai, Wuhan and Chengdu. Int. J. Disaster Risk Reduct. 2022, 67, 102664. [Google Scholar] [CrossRef] [PubMed]
- Lin, S.-H.; Tang, W.-J.; Miao, J.-Y.; Wang, Z.-M.; Wang, P.-X. Safety climate measurement at workplace in China: A validity and reliability assessment. Saf. Sci. 2008, 46, 1037–1046. [Google Scholar] [CrossRef]
- Trizano-Hermosilla, I.; Alvarado, J.M. Best alternatives to Cronbach’s alpha reliability in realistic conditions: Congeneric and asymmetrical measurements. Front. Psychol. 2016, 7, 769. [Google Scholar] [CrossRef]
- Bujang, M.A.; Omar, E.D.; Baharum, N.A. A review on sample size determination for Cronbach’s alpha test: A simple guide for researchers. Malays. J. Med. Sci. MJMS 2018, 25, 85. [Google Scholar] [CrossRef]
- Wikipedia. Cronbach’s Alpha. Available online: https://en.wikipedia.org/wiki/Cronbach%27s_alpha (accessed on 23 November 2023).
- Manzoor, F.; Wei, L.; Hussain, A.; Asif, M.; Shah, S.I.A. Patient satisfaction with health care services; An application of physician’s behavior as a moderator. Int. J. Environ. Res. Public Health 2019, 16, 3318. [Google Scholar] [CrossRef]
- Behm, M. Linking construction fatalities to the design for construction safety concept. Saf. Sci. 2005, 43, 589–611. [Google Scholar] [CrossRef]
- Wikipedia. Cramér’s V. Available online: https://en.wikipedia.org/wiki/Cram%C3%A9r%27s_V (accessed on 23 November 2023).
- Santos-Reyes, J. How useful are earthquake early warnings? The case of the 2017 earthquakes in Mexico city. Int. J. Disaster Risk Reduct. 2019, 40, 101148. [Google Scholar] [CrossRef]


| Survey No. | National Functions | Details | Class | |
|---|---|---|---|---|
| Q1 | Disaster Safety | Recovery | Operation of disaster recovery funds, support for recovery activities, etc. | Primary Function |
| Q2 | Response | Disaster firefighting, rescue, medical treatment activities, etc. | Primary Function | |
| Q3 | Preparation | Regular safety policy, disaster safety education, disaster situation management, etc. | Primary Function | |
| Q4 | Prevention | Development of disaster safety technology, preventive management, etc. | Primary Function | |
| Q5 | Public Order and Safety | Police, legal affairs, prosecution, and societal public order and safety maintenance | Policy Sector | |
| Q6 | Science and Technology | Creation of a scientific and technological research environment and technological development | Policy Sector | |
| Q7 | Education | Compulsory education for infants/elementary/middle school, higher education, lifelong/vocational education, etc. | Policy Sector | |
| Q8 | National Defence | Military conscription, mobilisation, military administration, etc. | Policy Sector | |
| Q9 | Agriculture, Forestry, Marine, and Fisheries | Agriculture, livestock, food farmland repair, rural development, and distribution of agricultural and marine products | Policy Sector | |
| Q10 | Culture, Sports, and Tourism | Promotion of culture, sports, and tourism, and preservation of cultural heritage | Policy Sector | |
| Q11 | Health Services | Health, sanitation, disease prevention, food and drug safety management, and operation of emergency medical systems | Policy Sector | |
| Q12 | Social Welfare | Social security, social services, and promotion of social welfare | Policy Sector | |
| Q13 | Industry and SMEs | Industrial technology support, trade and investment attraction for industrial promotion, energy and resource development | Policy Sector | |
| Q14 | Transportation and Logistics | Management of transportation logistics systems (roads, railways, aviation, ports, maritime, logistics) | Policy Sector | |
| Q15 | Public Administration | General administration, finance, taxation, and financial management | Policy Sector | |
| Q16 | Regional Development | Development of industrial zones and regional development | Policy Sector | |
| Q17 | Telecommunications | Information communication, broadcasting, and post-office management | Policy Sector | |
| Q18 | Unification and Diplomacy | Diplomacy, trade negotiations, treaties, other international agreements, international situation investigation, immigration, and unification management | Policy Sector | |
| Q19 | Environmental Protection | Air, water quality, waste, natural environment, and environmental pollution management | Policy Sector | |
| Survey No. | Republic of Korea | USA | Japan | EU | |
|---|---|---|---|---|---|
| Q1 | Disaster Safety | Recovery | Prepare for and Manage Emergencies | Disaster Management | Disaster Management |
| Q2 | Response | ||||
| Q3 | Preparation | ||||
| Q4 | Prevention | ||||
| Q5 | Public Order and Safety | Provide Public Safety | Public Safety and Social Order | Law and Justice | |
| Q6 | Science and Technology | Manufacture Equipment | Development and Science | Energy and Technology | |
| Q7 | Education | Educate and Train | Education and Training | Education and Workforce | |
| Q8 | National Defence | Provide Materiel and Operational Support to Defence | Defence | Defence and Security | |
| Q9 | Agriculture, Forestry, Marine, and Fisheries | Produce and Provide Agricultural Products and Services | Agriculture, Forestry, and Fisheries | Agricultural Affairs | |
| Q10 | Culture, Sports, and Tourism | Provide and Maintain Infrastructure | Promotion and Public Relations | - | |
| Q11 | Health Services | Provide Medical Care | Public Health | Health and Well-Being | |
| Q12 | Social Welfare | Provide Insurance Services | Social Activity Support | Employment, Social Affairs, and Inclusion | |
| Q13 | Industry and SMEs | Produce Chemicals | Industrial Support | Internal Market, Industry, Entrepreneurship, and SMEs | |
| Q14 | Transportation and Logistics | Transport Cargo and Passengers | Transportation | Transport and Space | |
| Q15 | Public Administration | Develop and Maintain Public Works and Services | Public Asset Management | General Government | |
| Q16 | Regional Development | Provide Housing | - | Economic and Financial | |
| Q17 | Telecommunications | Maintain Supply Chains | Energy/Resource Management | Communications | |
| Q18 | Unification and Diplomacy | Enforce Law | Diplomacy | Diplomacy and Trade | |
| Q19 | Environmental Protection | Manage Hazardous Materials | Environmental Management | Environment and Natural Resources | |
| Importance | Maximum Acceptable Outage | |
|---|---|---|
| Stage 1 | Minor | Recovery required within one month |
| Stage 2 | Little | Recovery required within two weeks |
| Stage 3 | Medium | Recovery required within three days |
| Stage 4 | Great | Recovery required within one day |
| Stage 5 | Enormous | Recovery required within three hours |
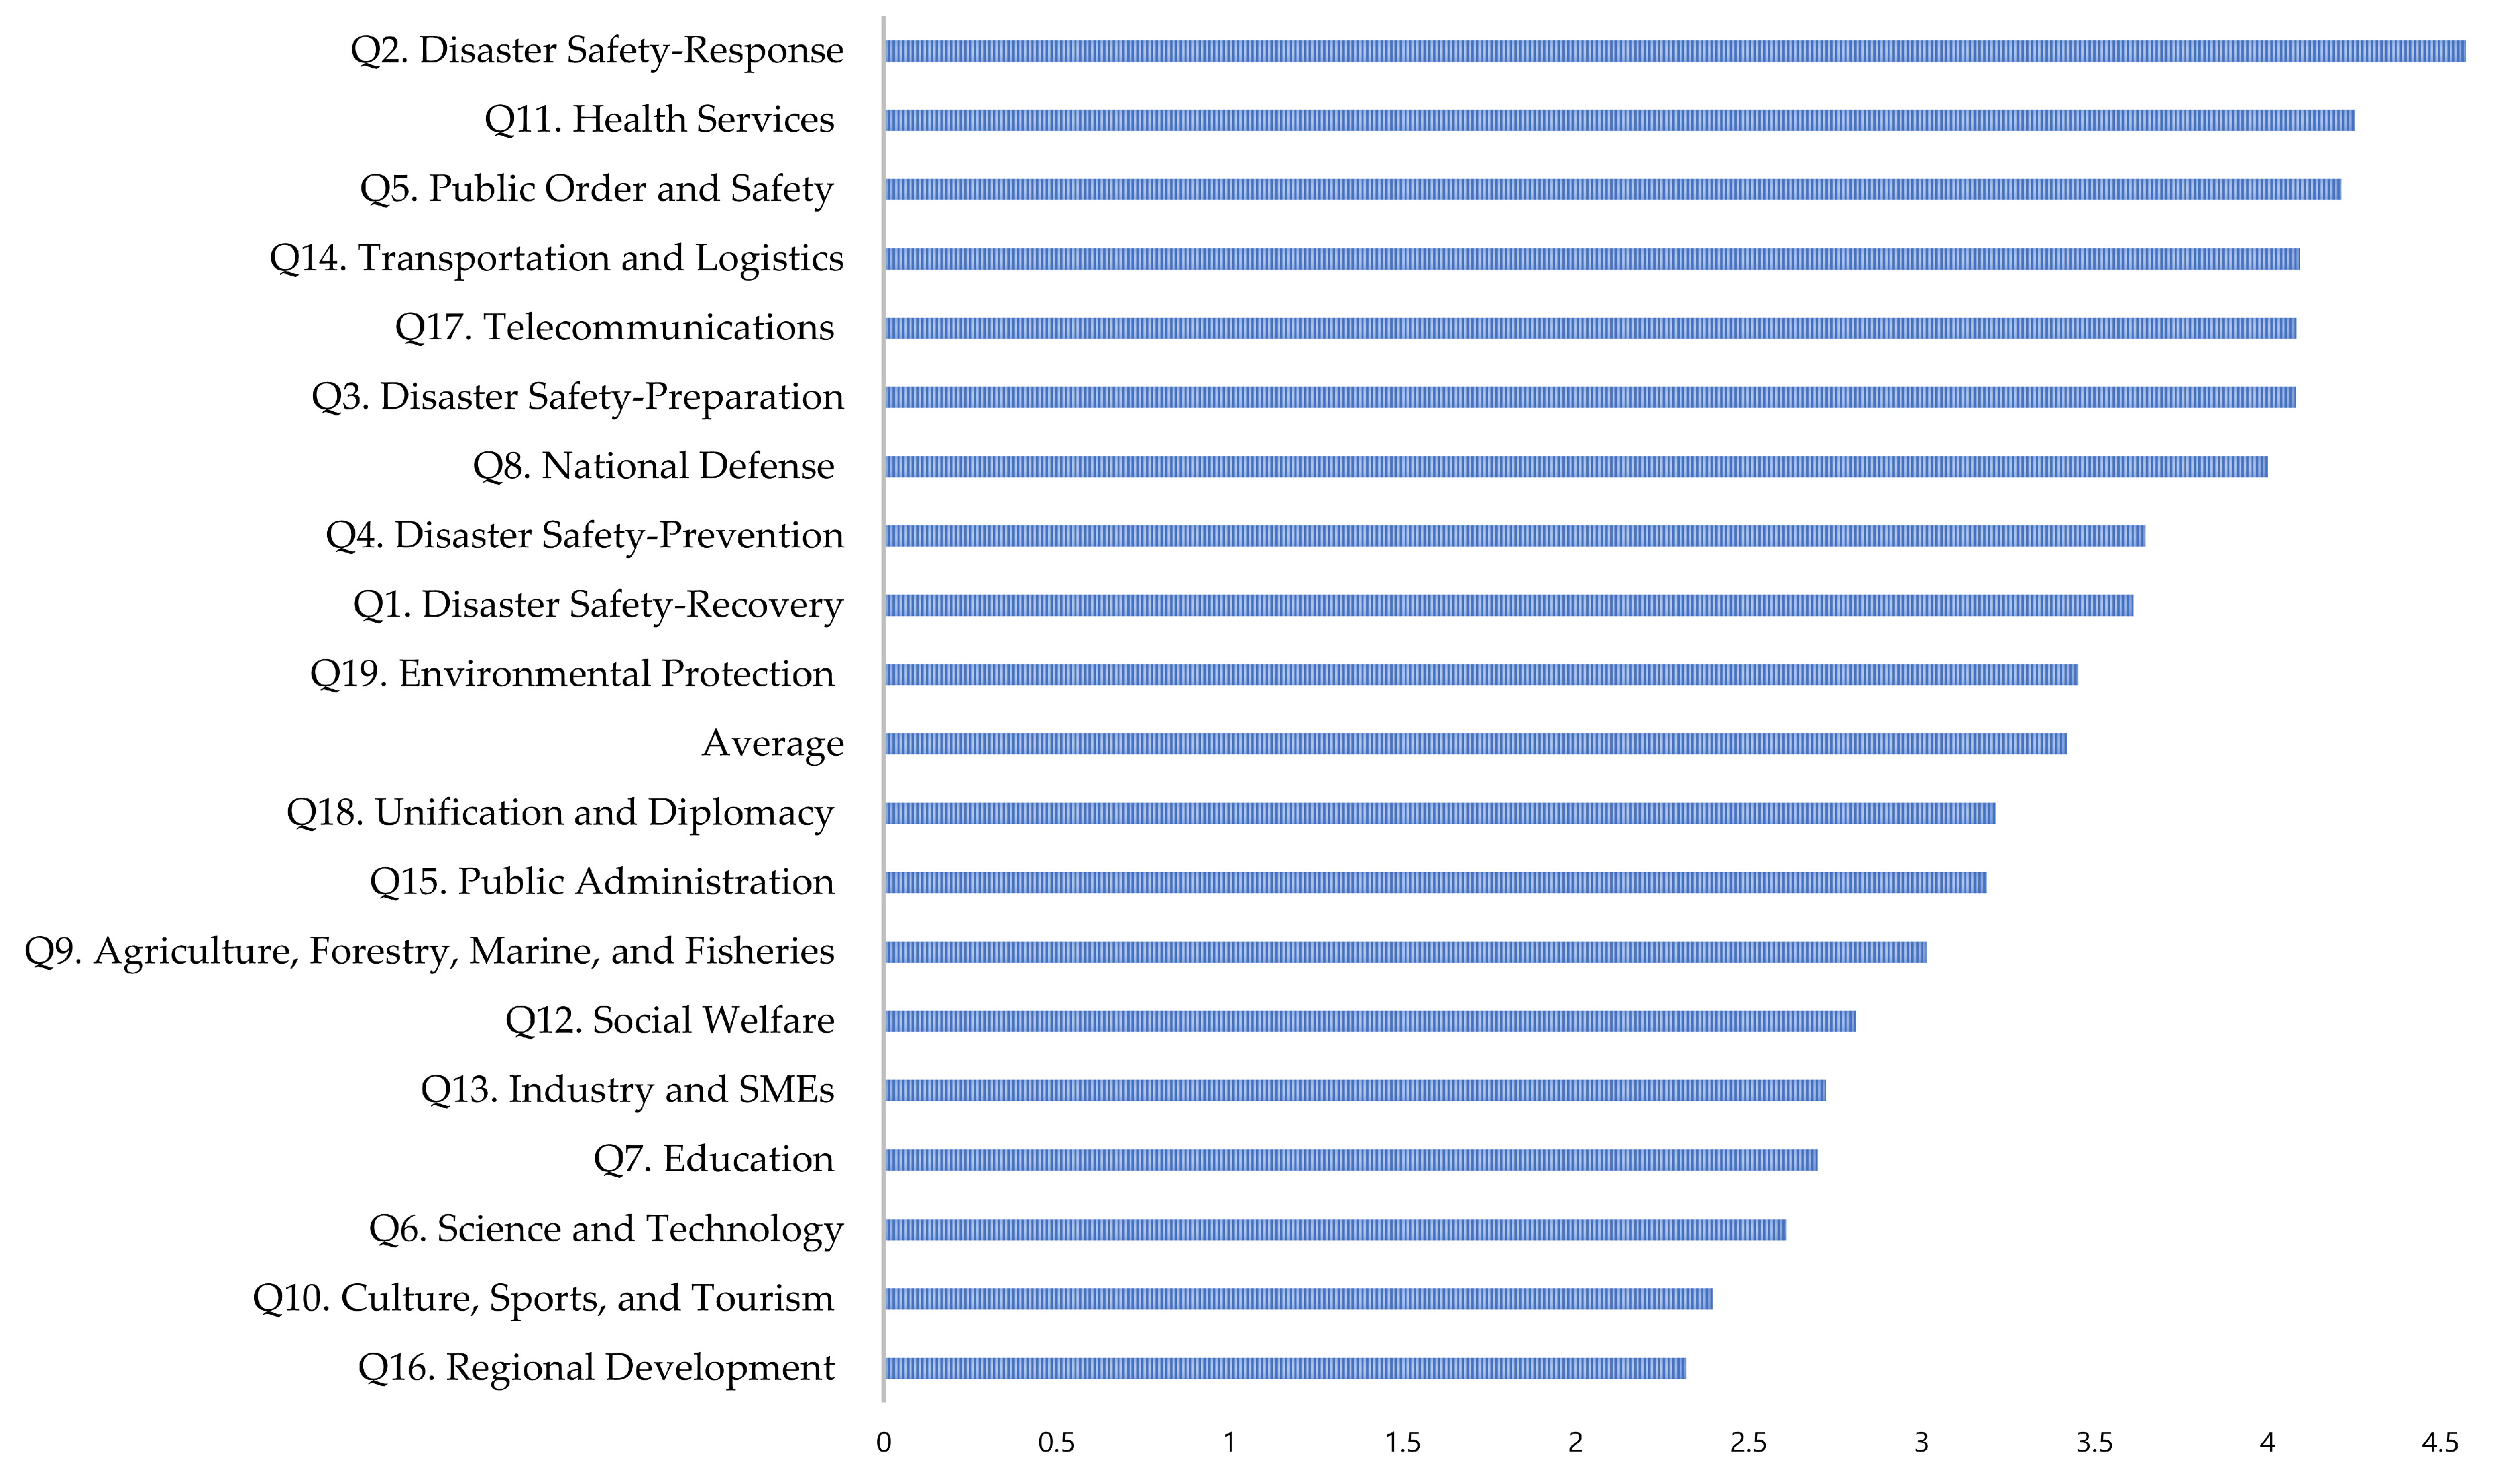
| Survey No. | National Functions | Average (N = 1506) | Standard Deviation (N = 1506) | Cronbach’s Alpha (Q = 19 Items) | Cronbach’s Alpha upon Removal of the Question (Q) | |
|---|---|---|---|---|---|---|
| Q1 | Disaster Safety | Recovery | 3.61 | 1.112 | 0.860 | 0.853 (≤0.860) |
| Q2 | Response | 4.57 | 0.754 | 0.860 (≤0.860) | ||
| Q3 | Preparation | 4.08 | 1.013 | 0.856 (≤0.860) | ||
| Q4 | Prevention | 3.65 | 1.083 | 0.852 (≤0.860) | ||
| Q5 | Public Order and Safety | 4.21 | 0.898 | 0.857 (≤0.860) | ||
| Q6 | Science and Technology | 2.61 | 1.083 | 0.851 (≤0.860) | ||
| Q7 | Education | 2.70 | 1.066 | 0.854 (≤0.860) | ||
| Q8 | National Defence | 4.00 | 0.998 | 0.856 (≤0.860) | ||
| Q9 | Agriculture, Forestry, Marine, and Fisheries | 3.01 | 0.996 | 0.851 (≤0.860) | ||
| Q10 | Culture, Sports, and Tourism | 2.40 | 1.085 | 0.855 (≤0.860) | ||
| Q11 | Health Services | 4.25 | 0.843 | 0.855 (≤0.860) | ||
| Q12 | Social Welfare | 2.81 | 1.029 | 0.850 (≤0.860) | ||
| Q13 | Industry and SMEs | 2.72 | 1.078 | 0.850 (≤0.860) | ||
| Q14 | Transportation and Logistics | 4.09 | 0.900 | 0.854 (≤0.860) | ||
| Q15 | Public Administration | 3.19 | 1.077 | 0.850 (≤0.860) | ||
| Q16 | Regional Development | 2.32 | 1.092 | 0.854 (≤0.860) | ||
| Q17 | Telecommunications | 4.08 | 0.929 | 0.857 (≤0.860) | ||
| Q18 | Unification and Diplomacy | 3.21 | 1.081 | 0.851 (≤0.860) | ||
| Q19 | Environmental Protection | 3.45 | 1.054 | 0.852 (≤0.860) | ||
| Independent Variable | Survey No. | National Functions | Cramer’s V | p-Value | Accepted Hypothesis | |
|---|---|---|---|---|---|---|
| Residential Area | Q1 | Disaster Safety | Recovery | 0.107 | 0.319 | H0 |
| Q2 | Response | 0.097 | 0.744 | H0 | ||
| Q3 | Preparation | 0.098 | 0.700 | H0 | ||
| Q4 | Prevention | 0.107 | 0.327 | H0 | ||
| Q5 | Public Order and Safety | 0.104 | 0.446 | H0 | ||
| Q6 | Science and Technology | 0.117 | 0.057 | H0 | ||
| Q7 | Education | 0.126 | 0.007 | H0 | ||
| Q8 | National Defence | 0.090 | 0.925 | H0 | ||
| Q9 | Agriculture, Forestry, Marine, and Fisheries | 0.099 | 0.641 | H0 | ||
| Q10 | Culture, Sports, and Tourism | 0.107 | 0.320 | H0 | ||
| Q11 | Health Services | 0.105 | 0.410 | H0 | ||
| Q12 | Social Welfare | 0.121 | 0.027 | H0 | ||
| Q13 | Industry and SMEs | 0.102 | 0.541 | H0 | ||
| Q14 | Transportation and Logistics | 0.127 | 0.005 | H0 | ||
| Q15 | Public Administration | 0.107 | 0.331 | H0 | ||
| Q16 | Regional Development | 0.100 | 0.594 | H0 | ||
| Q17 | Telecommunications | 0.111 | 0.166 | H0 | ||
| Q18 | Unification and Diplomacy | 0.114 | 0.113 | H0 | ||
| Q19 | Environmental Protection | 0.096 | 0.774 | H0 | ||
| Survey No. | National Function | Criticality Scoring (Out of 5 Points) | Consistency | Regional Cramer’s V | Regional p-Value | Criticality Rank | |
|---|---|---|---|---|---|---|---|
| Q1 | Disaster Safety | Recovery | 3.6 | 0.860 | 0.107 | 0.319 | 9 |
| Q2 | Response | 4.6 | 0.097 | 0.744 | 1 | ||
| Q3 | Preparation | 4.1 | 0.098 | 0.700 | 6 | ||
| Q4 | Prevention | 3.6 | 0.107 | 0.327 | 8 | ||
| Q5 | Public Order and Safety | 4.2 | 0.104 | 0.446 | 3 | ||
| Q6 | Science and Technology | 2.6 | 0.117 | 0.057 | 17 | ||
| Q7 | Education | 2.7 | 0.126 | 0.007 | 16 | ||
| Q8 | National Defence | 4.0 | 0.090 | 0.925 | 7 | ||
| Q9 | Agriculture, Forestry, Marine, and Fisheries | 3.0 | 0.099 | 0.641 | 13 | ||
| Q10 | Culture, Sports, and Tourism | 2.4 | 0.107 | 0.320 | 18 | ||
| Q11 | Health Services | 4.3 | 0.105 | 0.410 | 2 | ||
| Q12 | Social Welfare | 2.8 | 0.121 | 0.027 | 14 | ||
| Q13 | Industry and SMEs | 2.7 | 0.102 | 0.541 | 15 | ||
| Q14 | Transportation and Logistics | 4.1 | 0.127 | 0.005 | 4 | ||
| Q15 | Public Administration | 3.2 | 0.107 | 0.331 | 12 | ||
| Q16 | Regional Development | 2.3 | 0.100 | 0.594 | 19 | ||
| Q17 | Telecommunications | 4.1 | 0.111 | 0.166 | 5 | ||
| Q18 | Unification and Diplomacy | 3.2 | 0.114 | 0.113 | 11 | ||
| Q19 | Environmental Protection | 3.5 | 0.096 | 0.774 | 10 | ||
| Average | 3.4 | 0.860 | 0.107 | 0.392 | - | ||
Disclaimer/Publisher’s Note: The statements, opinions and data contained in all publications are solely those of the individual author(s) and contributor(s) and not of MDPI and/or the editor(s). MDPI and/or the editor(s) disclaim responsibility for any injury to people or property resulting from any ideas, methods, instructions or products referred to in the content. |
© 2023 by the authors. Licensee MDPI, Basel, Switzerland. This article is an open access article distributed under the terms and conditions of the Creative Commons Attribution (CC BY) license (https://creativecommons.org/licenses/by/4.0/).
Share and Cite
Hong, S.B.; Lee, J.B.; Shin, J.H.; Yun, H.S. Criteria for and Policy Implications of Setting Recovery Priorities of National Functions during Disruptions by Disasters. Sustainability 2023, 15, 16615. https://doi.org/10.3390/su152416615
Hong SB, Lee JB, Shin JH, Yun HS. Criteria for and Policy Implications of Setting Recovery Priorities of National Functions during Disruptions by Disasters. Sustainability. 2023; 15(24):16615. https://doi.org/10.3390/su152416615
Chicago/Turabian StyleHong, Seok Bum, Jin Byeong Lee, Jeong Hoon Shin, and Hong Sik Yun. 2023. "Criteria for and Policy Implications of Setting Recovery Priorities of National Functions during Disruptions by Disasters" Sustainability 15, no. 24: 16615. https://doi.org/10.3390/su152416615