1. Introduction
In the United States, buildings account for 20–40% of total energy consumption [
1,
2]. Building operations and maintenance consume nearly 80% of such a large amount of energy during their life cycle [
3,
4]. The bulk of energy used in the U.S. is generated by non-renewable sources (e.g., coal, oil, and natural gas). The negative effects of these energy types are partially to blame for global warming, air pollution and energy shortages. To reduce building energy consumption and its associated problems, sustainable development, especially sustainability in building construction, is a concern of more and more official and unofficial organizations e.g., government and environmental protection organizations.
A recent study in the realm of LEED certification and its relation to energy consumption in sustainable buildings is “Energy Performance of LEED-Certified Buildings: A Review of Case Studies and Related Energy Simulation Studies”. The authors of this study delved into an extensive analysis, reviewing 50 case studies and 25 energy simulation studies pertaining to LEED-certified buildings, with the primary aim of assessing their energy performance.
The findings of this research indicate that, on the whole, LEED-certified buildings tend to exhibit superior energy performance when compared with their non-certified counterparts. Nevertheless, there remains room for enhancement in this domain. The study also identified various factors that exert influence over the energy performance of LEED-certified buildings, including considerations such as building type, location, and design features [
5]. The authors of the study put forth a recommendation for future research endeavors to concentrate on the development of more precise energy simulation models and the evaluation of the long-term energy performance of LEED-certified structures.
The conditions governing LEED certification maintain a degree of uniformity: LEED buildings do not consistently outperform non-LEED buildings and, in certain instances, may even underperform. A notable concern arises from the implementation of recommended actions, particularly those selected by users, which sometimes yield negligible effects. This predicament can lead to the installation of superfluous facilities solely to accrue certification points. An illustrative example is the provision of extensive bicycle parking facilities or an abundance of windows in the vicinity of military installations where security considerations take precedence. In government buildings, there is often a need to streamline or reduce facilities to optimize space utilization and simplify movement routes [
6,
7]. Furthermore, a deficiency exists in the number of standards that are outcome-oriented and provide substantial returns on investment beyond environmental management. This situation underscores a potential disconnect between LEED certification and actual energy savings. In response, the author seeks to uncover and efficiently address these discrepancies in a more visible manner by identifying problem areas and implementing solutions that bridge the gap between certification criteria and genuine energy efficiency.
In 1998, the United States Green Building Council (USGBC) introduced its building evaluation system, known as Leadership in Energy and Environmental Design (LEED). LEED swiftly gained traction in the building evaluation market and has since been widely embraced, including by various agencies such as the U.S. government. Subsequently, in 2007, Executive Order (EO) 13423 was issued by the U.S. Army, advocating for the adoption of the “Federal Leadership in High Performance and Sustainable Buildings” initiative [
8]. EO13423 places a strong emphasis on reducing the life-cycle costs associated with the environmental and energy attributes of federally owned building facilities by implementing the overarching principles outlined in the Energy Policy Act (EPA) of 2005 [
9]. Enhancing energy efficiency and mitigating greenhouse gas emissions stand as paramount priorities within this policy framework. In response to Executive Order 13423 (EO13423), the Naval Facilities Engineering Command (NAVFAC) made revisions to the policy in 2008. These changes mandated LEED Silver certification for all new military construction projects and significant renovation endeavors undertaken within the United States Navy and Marine Corps infrastructure.
In 2010 a team from the University of Wisconsin—Madison (UW) compared the energy consumption of US Navy LEED-certified buildings and a military non-LEED comparable building, to investigate EO13423’s mandate to meet a thirty percent energy consumption reduction [
10]. Additionally, the study compared the LEED-certified buildings against the national average from the 2003 Commercial Building Energy Consumption Survey (CBECS). The research findings suggest that achieving the mandated thirty percent savings in electricity and water consumption, as stipulated by EO13423, cannot be solely ensured through LEED certification. Furthermore, the data show that energy savings were not closely related to the number of points received in the “Energy and Atmosphere” category of the LEED certification process. On the aspect of cost, it was found that, although some of the buildings had satisfactory results, half would not be considered economically feasible when looking at either the total cost of construction or the costs associated with the LEED scoring category “Energy and Atmosphere” [
11,
12].
Most previous research has ignored the spatial distribution information of buildings in its various energy consumption analyses [
13,
14,
15,
16]. Using a spatial regression model, it has been found that the distribution of LEED-certified buildings show a clear shift from an original concentration in major coastal cities to a more even distribution across the US [
17]. Additionally, LEED-accredited professionals, accredited by the USGBC to oversee the certification process, have shown a similar shift. Another study found that the adoption of energy-efficient residential heating, ventilating, and air conditioning (HVAC) systems in a neighborhood has contagious effects and will spill over into adjacent neighborhoods’ HVAC adoptions [
18]. Spatial distribution-related factors include not only information related to location, but also refers to the economic situation (e.g., average monthly income) of residents, weather history records (e.g., temperature), the dominant population (e.g., ethnicity), average education level, local LEED organizations, and available construction materials. Energy consumption, in a large sense, is quite connected to the local social network.
This research is an extension of a 2010 UW study [
10] and focuses on the influence of both endogenous variables (e.g., temperature) and exogenous variables (e.g., distance) on the energy consumption of LEED-certified military buildings. Specifically, this study is expected to answer the following questions: (1) is there some linear relationship between the energy consumption of U.S Navy buildings and the aforementioned endogenous variables? (2) Do the energy consumptions of LEED-certified buildings have any connection with each other in terms of spatial distribution?
2. Previous Studies
A comprehensive literature review was undertaken to understand further the relationships between energy consumption and factors such as temperature, spatial relationships, and building function in LEED-certified buildings.
The energy consumption of US Navy buildings with LEED-certified and non-LEED-certified counterparts. According to EO13423, all government departments must reduce energy consumption by 30% by 2015 [
19]. Additionally, the Department of the Navy has required that all new buildings constructed for the US Navy and US Marine Corps obtain a LEED Silver certification issued by the USGBC. To find any possible relationship between LEED-certified buildings and the reduction of energy consumption, the authors studied 11 LEED-certified buildings of the US Navy and their non-LEED-certified counterparts in the US Navy. The authors found that 9 of 11 LEED buildings did not achieve a 30% savings in electricity consumption. In addition, this research concluded that the majority of the USN LEED-certified buildings showed more electricity consumption than the national average.
The modeled and actual energy performance of 21 LEED-certified buildings were explored between December 2001 and August 2005. The authors collected utility billing data from 2003 to 2005 and compared the billed energy consumption with the modeled energy use. The authors found that 18 out of the total 21 buildings have an energy saving of 26% compared with the baseline buildings [
20]. The authors were also aware of the limitations of their study and took caution against extending the conclusion too broadly. The limitations of the study include: (1) sample amount; (2) as-built and as-designed discrepancies; (3) changing of occupancy patterns and densities.
Another study re-analyzed data supplied by the New Buildings Institute and the USGBC on measured energy use data from 100 LEED-certified commercial and institutional buildings [
12]. The authors found that, on average, LEED-certified buildings used 18–39% less energy per floor area than comparable non-LEED buildings. However, 28–35% of LEED buildings used more energy than comparable non-LEED buildings. Further, the measured energy performance of LEED buildings had little correlation with the certification level of the building, or the number of energy credits achieved by the building at design time.
One hundred twenty-one LEED-certified buildings were studied through 2006. The authors used three different comparison baselines to quantify the energy performance of those LEED-certified buildings [
14]. First, an energy use intensity (EUI) comparison of LEED and national building stock was completed. It was found that the median measured EUI was 69 kBtu/sf, 24% below the CBECS national average for all of the commercial building stock. Additionally, statistics show that the median performance of gold and platinum buildings is very close to achieving the interim goals of Architecture 2030. Secondly, the authors calculated the average Energy Star rating of these LEED buildings and found that the rating number was 68 (meaning a better energy performance than 68% of similar buildings) compared with a median rating of 50 for the complete national building stock. Additionally, nearly half of LEED buildings had Energy Star ratings of at least 75, meeting the qualification level for an EPA-certified Energy Star building. Thirdly, the authors modeled the energy consumption of those LEED buildings. Results show that nearly half of them had an energy performance worse than the simulated energy consumption.
The geography was studied based on the distribution of LEED-certified buildings and professionals [
17]. The author found that the number of LEED-certified buildings across the United States is not distributed evenly across space. Additionally, the author rejected a previous conclusion that stated that the increases in income, educational attainment, and percentage of service-sector employment all correlate with more green buildings, criticizing suggestions that these are only for the rich.
The literature reviewed above focuses on a comparison of the energy consumption of LEED-certified buildings with that of similar non-LEED-certified buildings. As highlighted in the literature, LEED-certified buildings generally exhibit energy-saving benefits; however, a substantial variation in energy consumption among different buildings is evident. This prompts a natural question: what factors contribute to this variation, and which elements influence the energy consumption of both LEED and non-LEED-certified buildings?
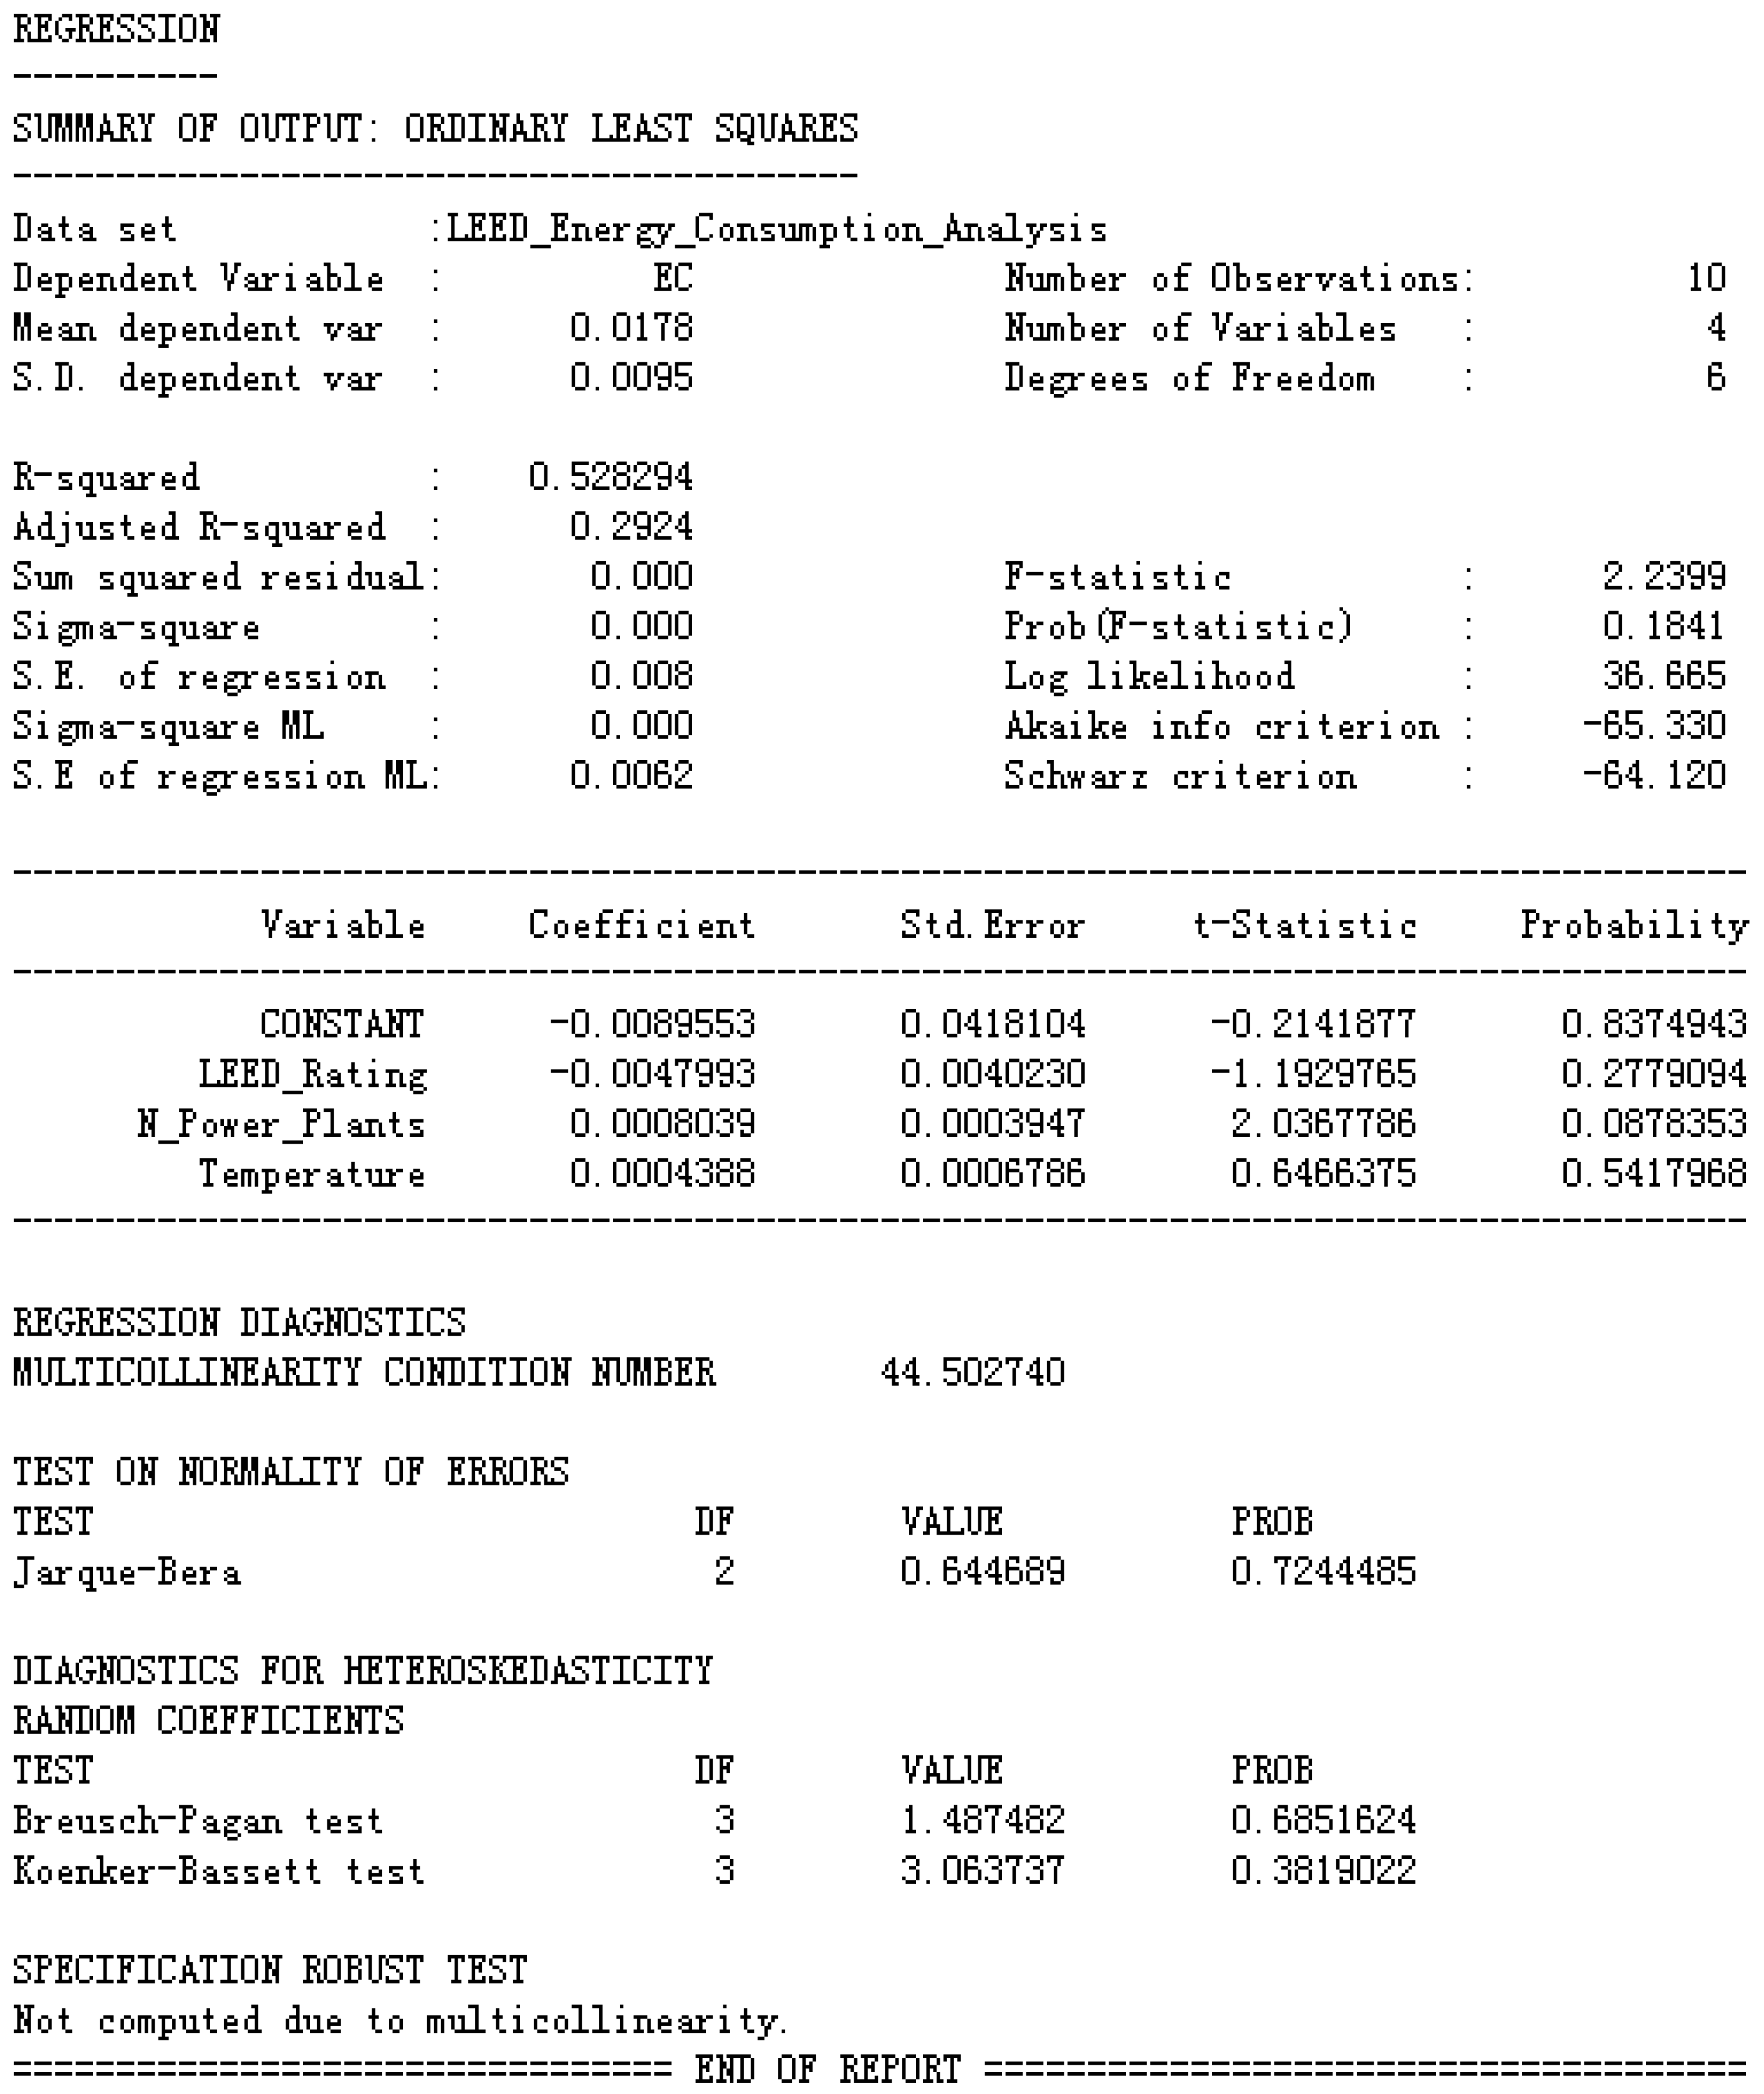
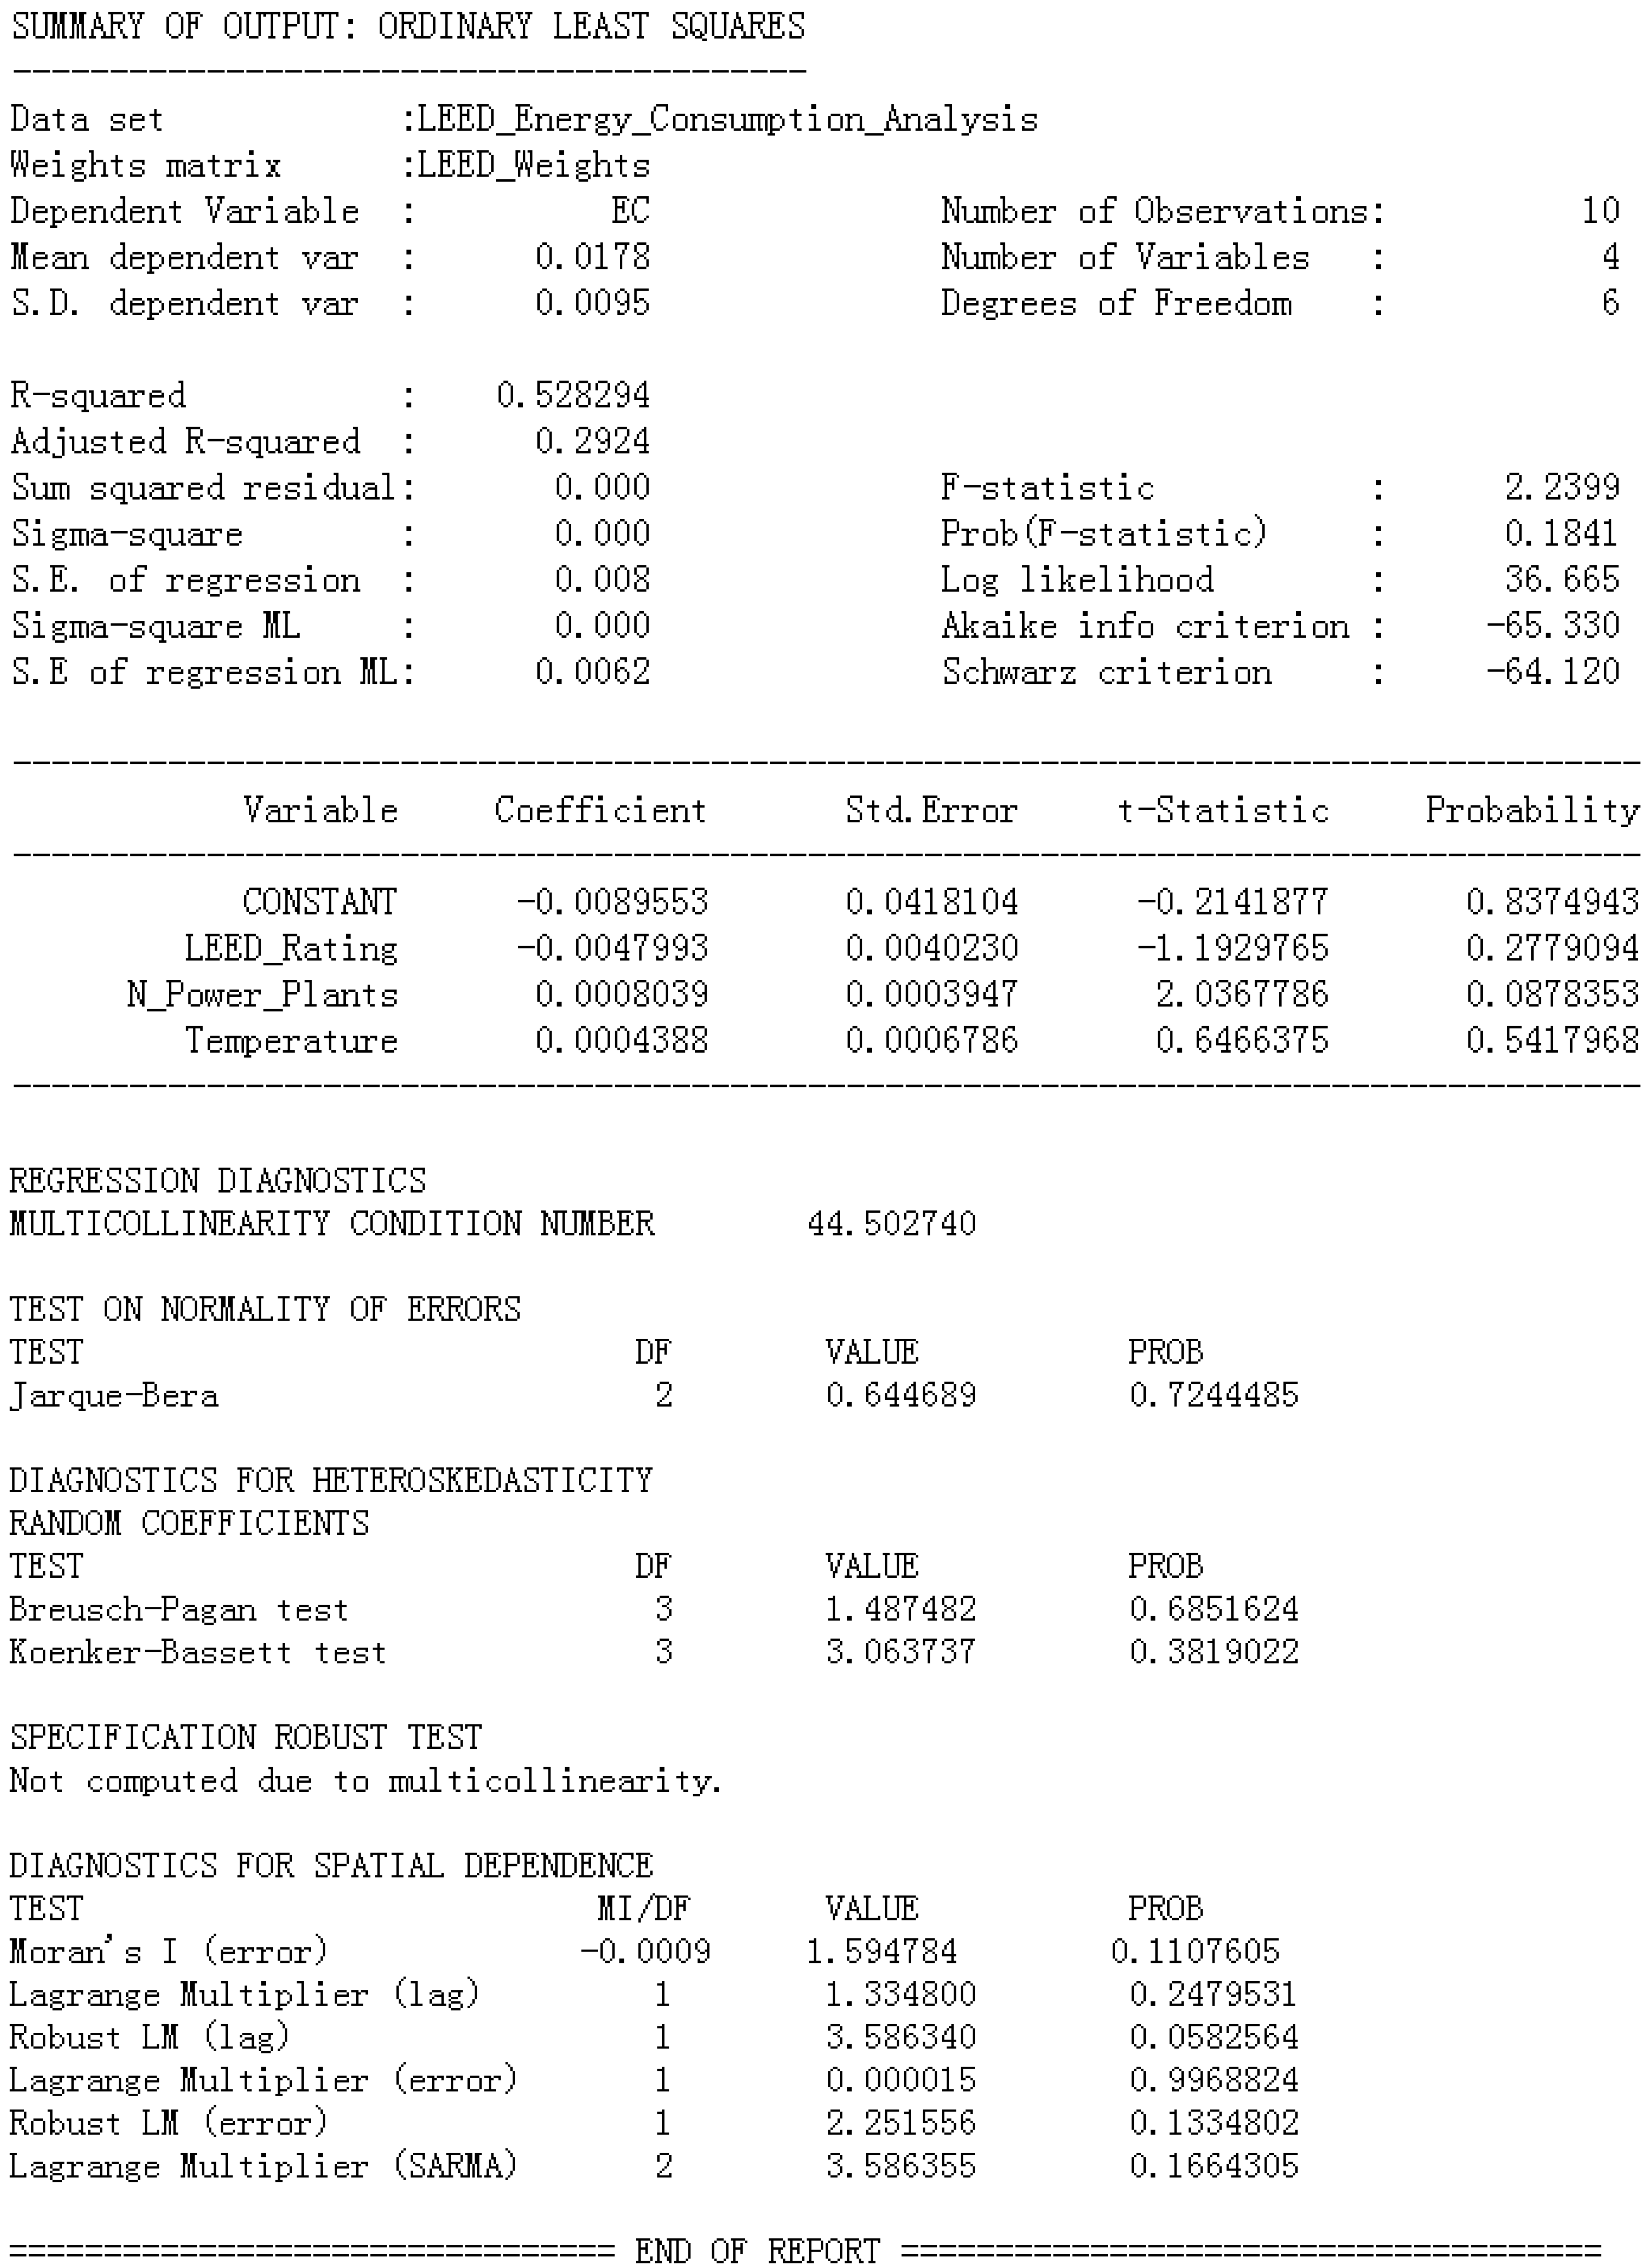
In this research endeavor, the authors delve into the influence of spatial factors on the energy consumption of LEED-certified buildings. Specifically, they employ both an ordinary linear regression model and a spatial lag model to assess the significance of selected exogenous variables and spatial factors. By scrutinizing the significance values through techniques like t-tests and spatial tests such as the robust Lagrange multiplier, we aim to offer valuable insights for future research based on the outcomes of this study.
The author identifies the current trends in LEED certification and determines the suitability and efficiency of certification points. The points of LEED certification have been gradually adding and detailing items from V2.2 to the current V4.1. Although this certification is quite consistent with the ideology of saving energy consumption in LEED-certified buildings, there is a uniformity in its items and a narrowness in its judgment. Most of the entries in this table are based on quantitative criteria without analysis [
21,
22].
After LEED was introduced, the number of certified buildings increased by more than 1000% in the 10 years from 2000, and by 110% in the following 10 years. However, recent trends show that the registration rate is slowing to less than 5%. This can be seen as a decrease in overall investment due to the economic downturn since 2019 and following the pandemic; however, the registration rate is decreasing due to LEED’s registration system, excessive costs, low efficiency compared with value, registration procedures and time, and the appropriateness of registered academic subjects [
22].
3. Methodology
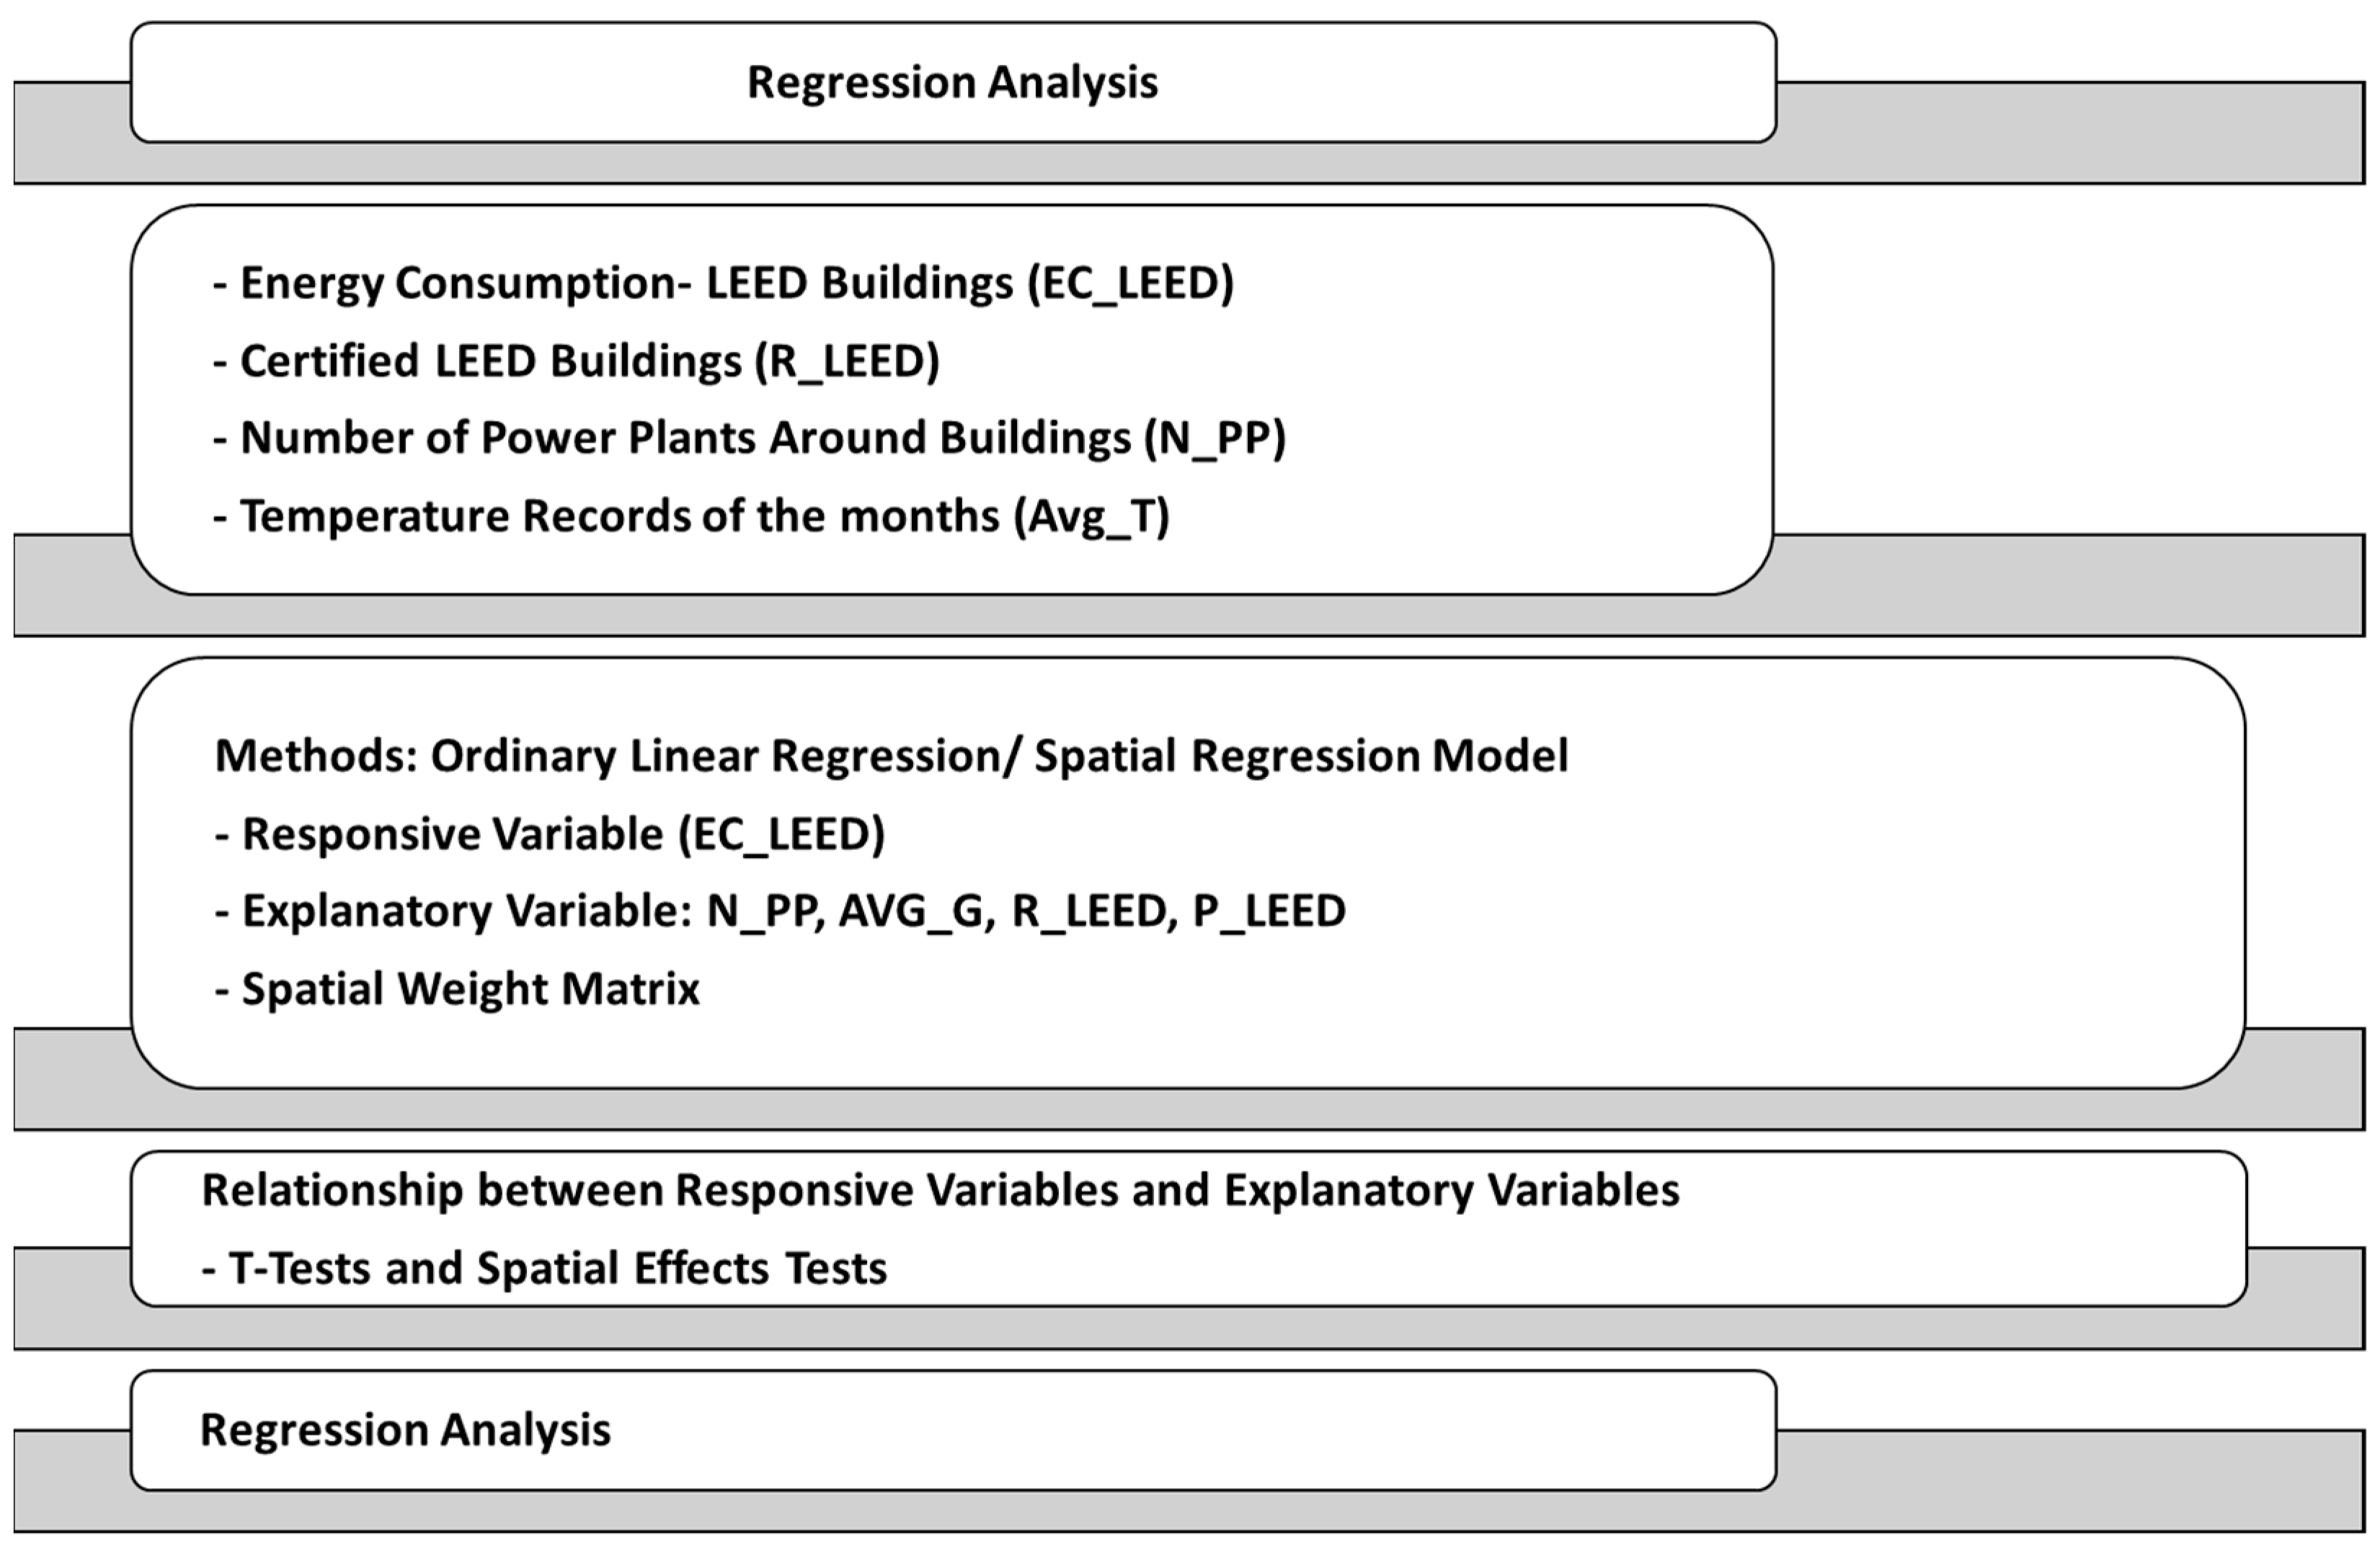
The research methodology comprises three key components: (1) data collection and characterization; (2) data analysis, encompassing ordinary linear regression (OLR), spatial linear regression, and specifications for the LEED energy case study; and (3) presentation of results and subsequent discussion.
Figure 1 provides an overview of the methodology employed in this project.
To elaborate further, the initial step involves the utilization of an OLR model to examine the linear relationships between selected exogenous variables (e.g., temperature) and the dependent variable. Following this, we employ a spatial lag regression model to simulate the influence of both endogenous and exogenous variables. The inputs for this model include: (1) the energy consumption of LEED-certified buildings; (2) the amount of power plants within a 50 mile radius of each building; (3) the LEED rating level (e.g., Gold, Silver, Platinum); and (4) the temperature records for each year.
4. Data Collection and Characteristics
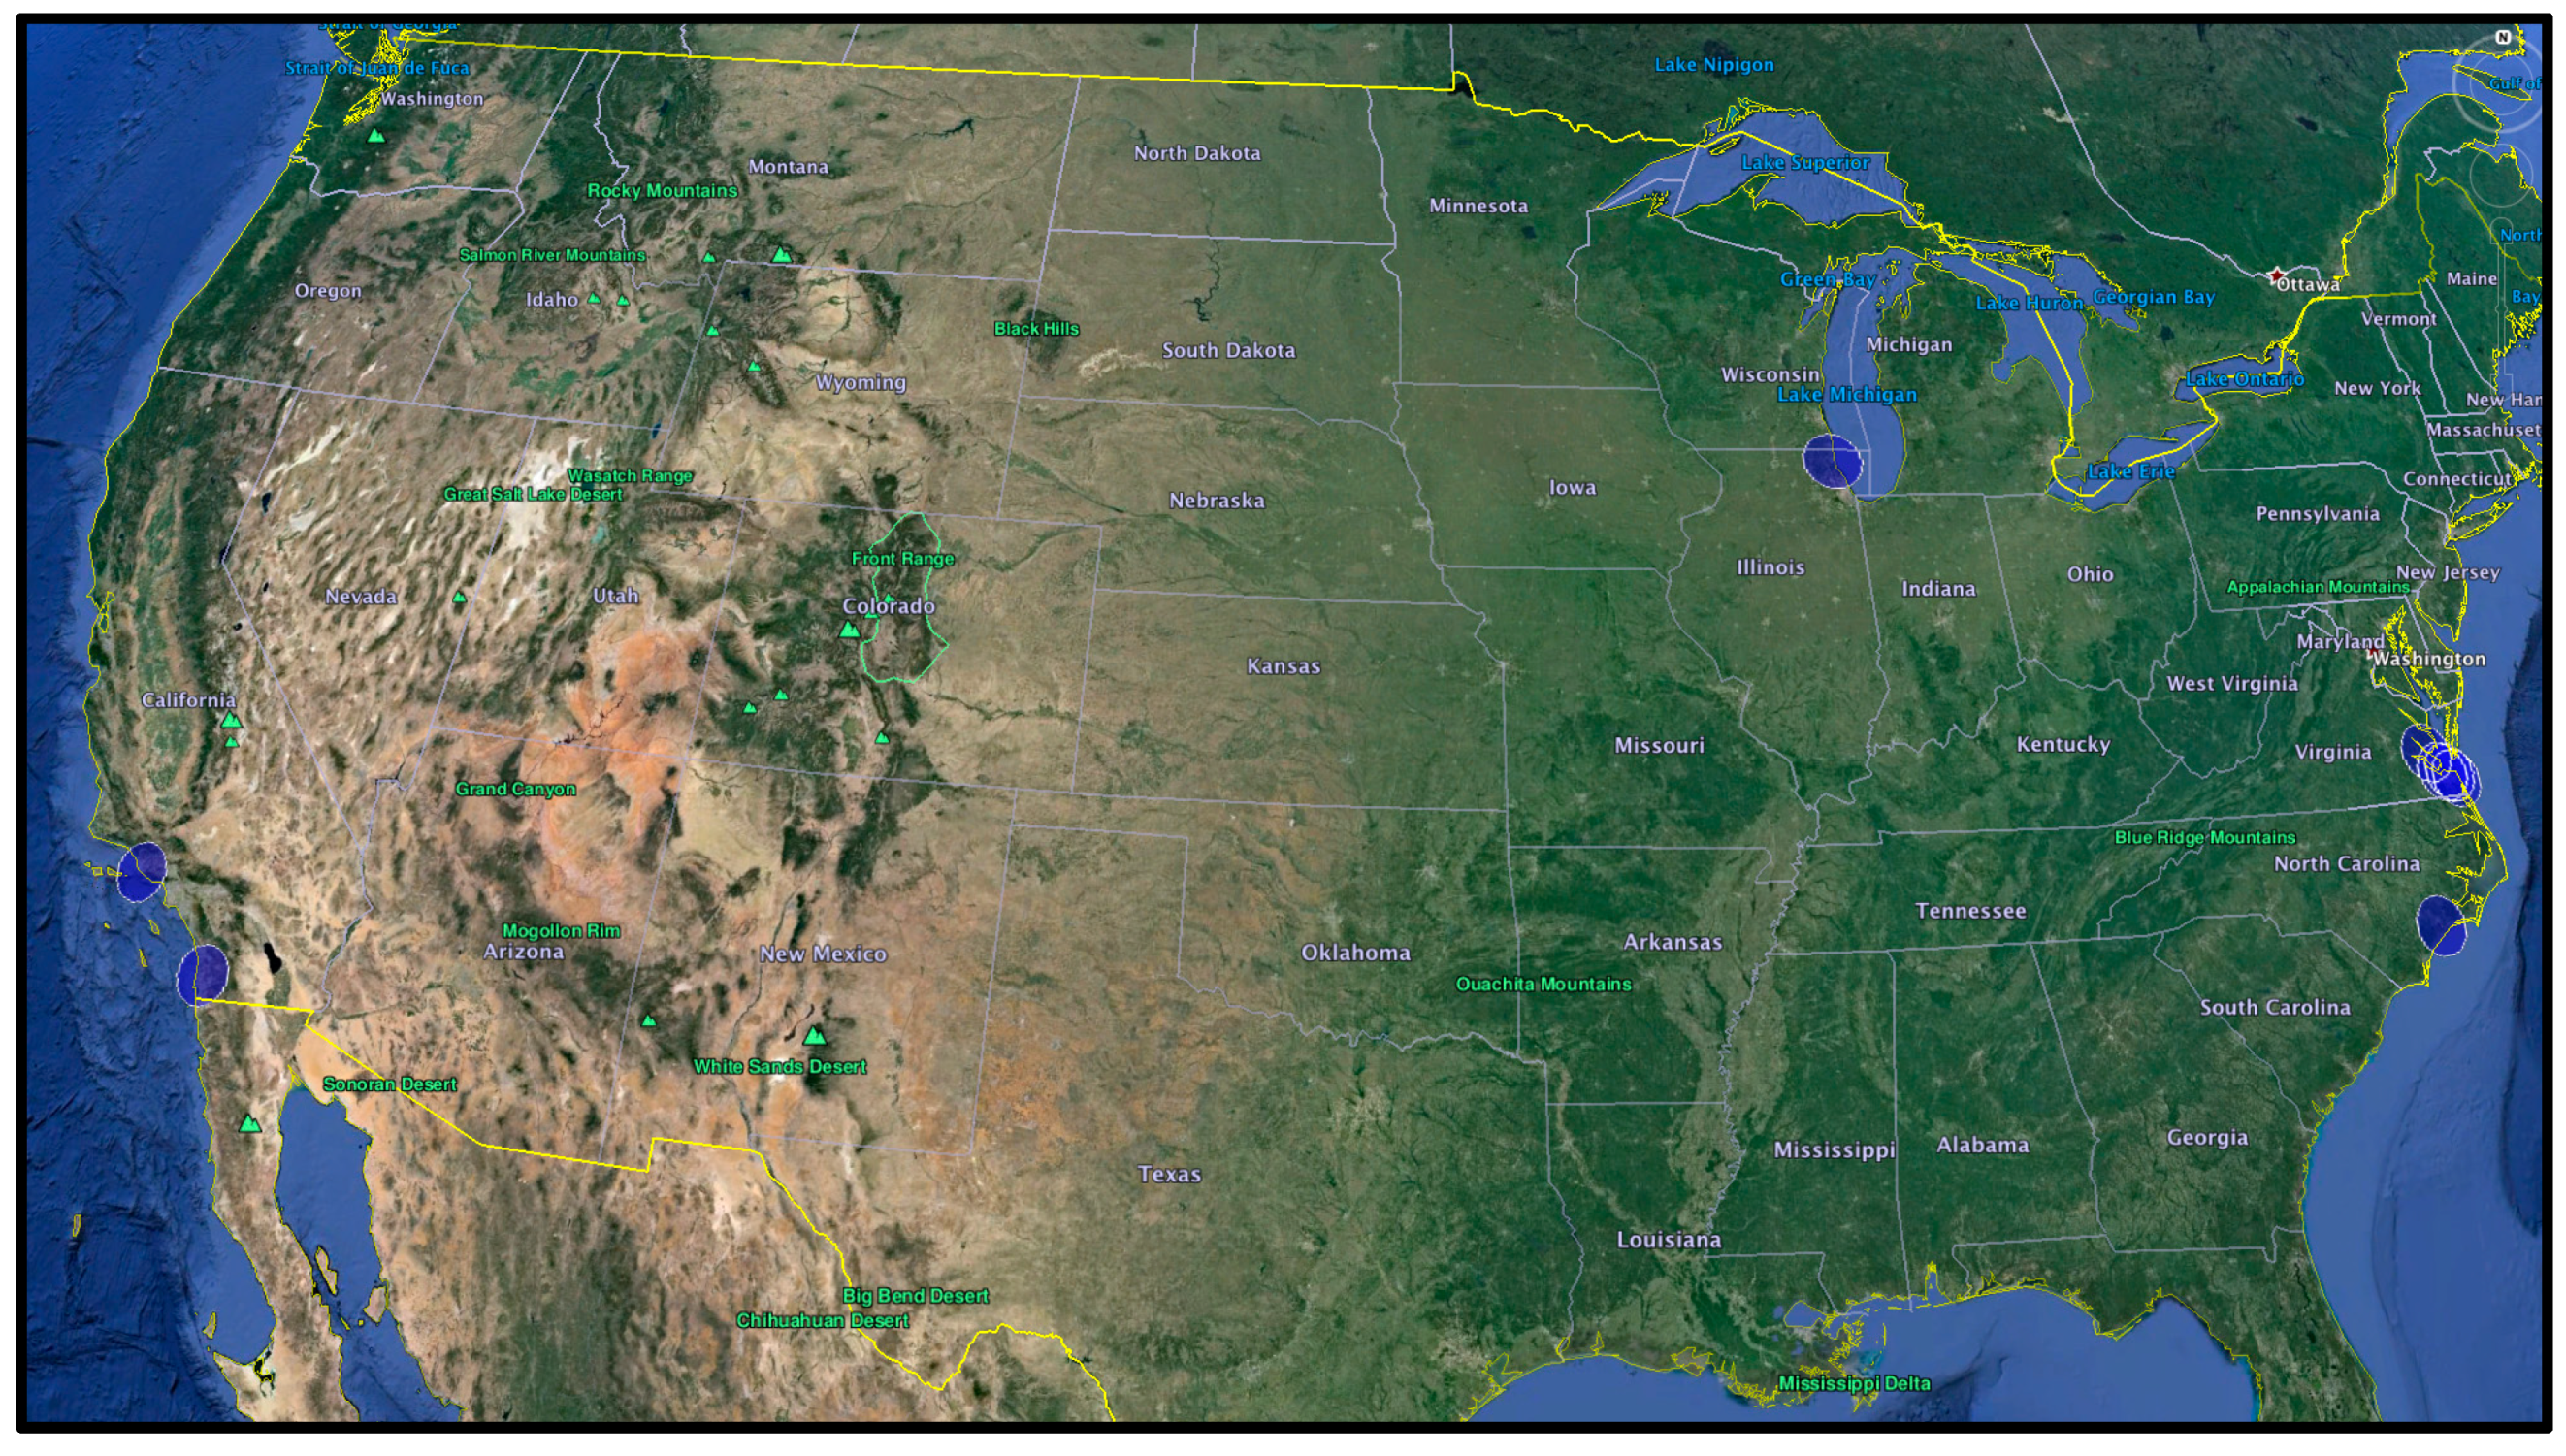
For this project, the authors utilized energy consumption data of LEED-certified buildings used in the previous study that was provided for further study. After obtaining these data, the authors collected the temperature data of each month for those areas where the studied buildings were located, shown in
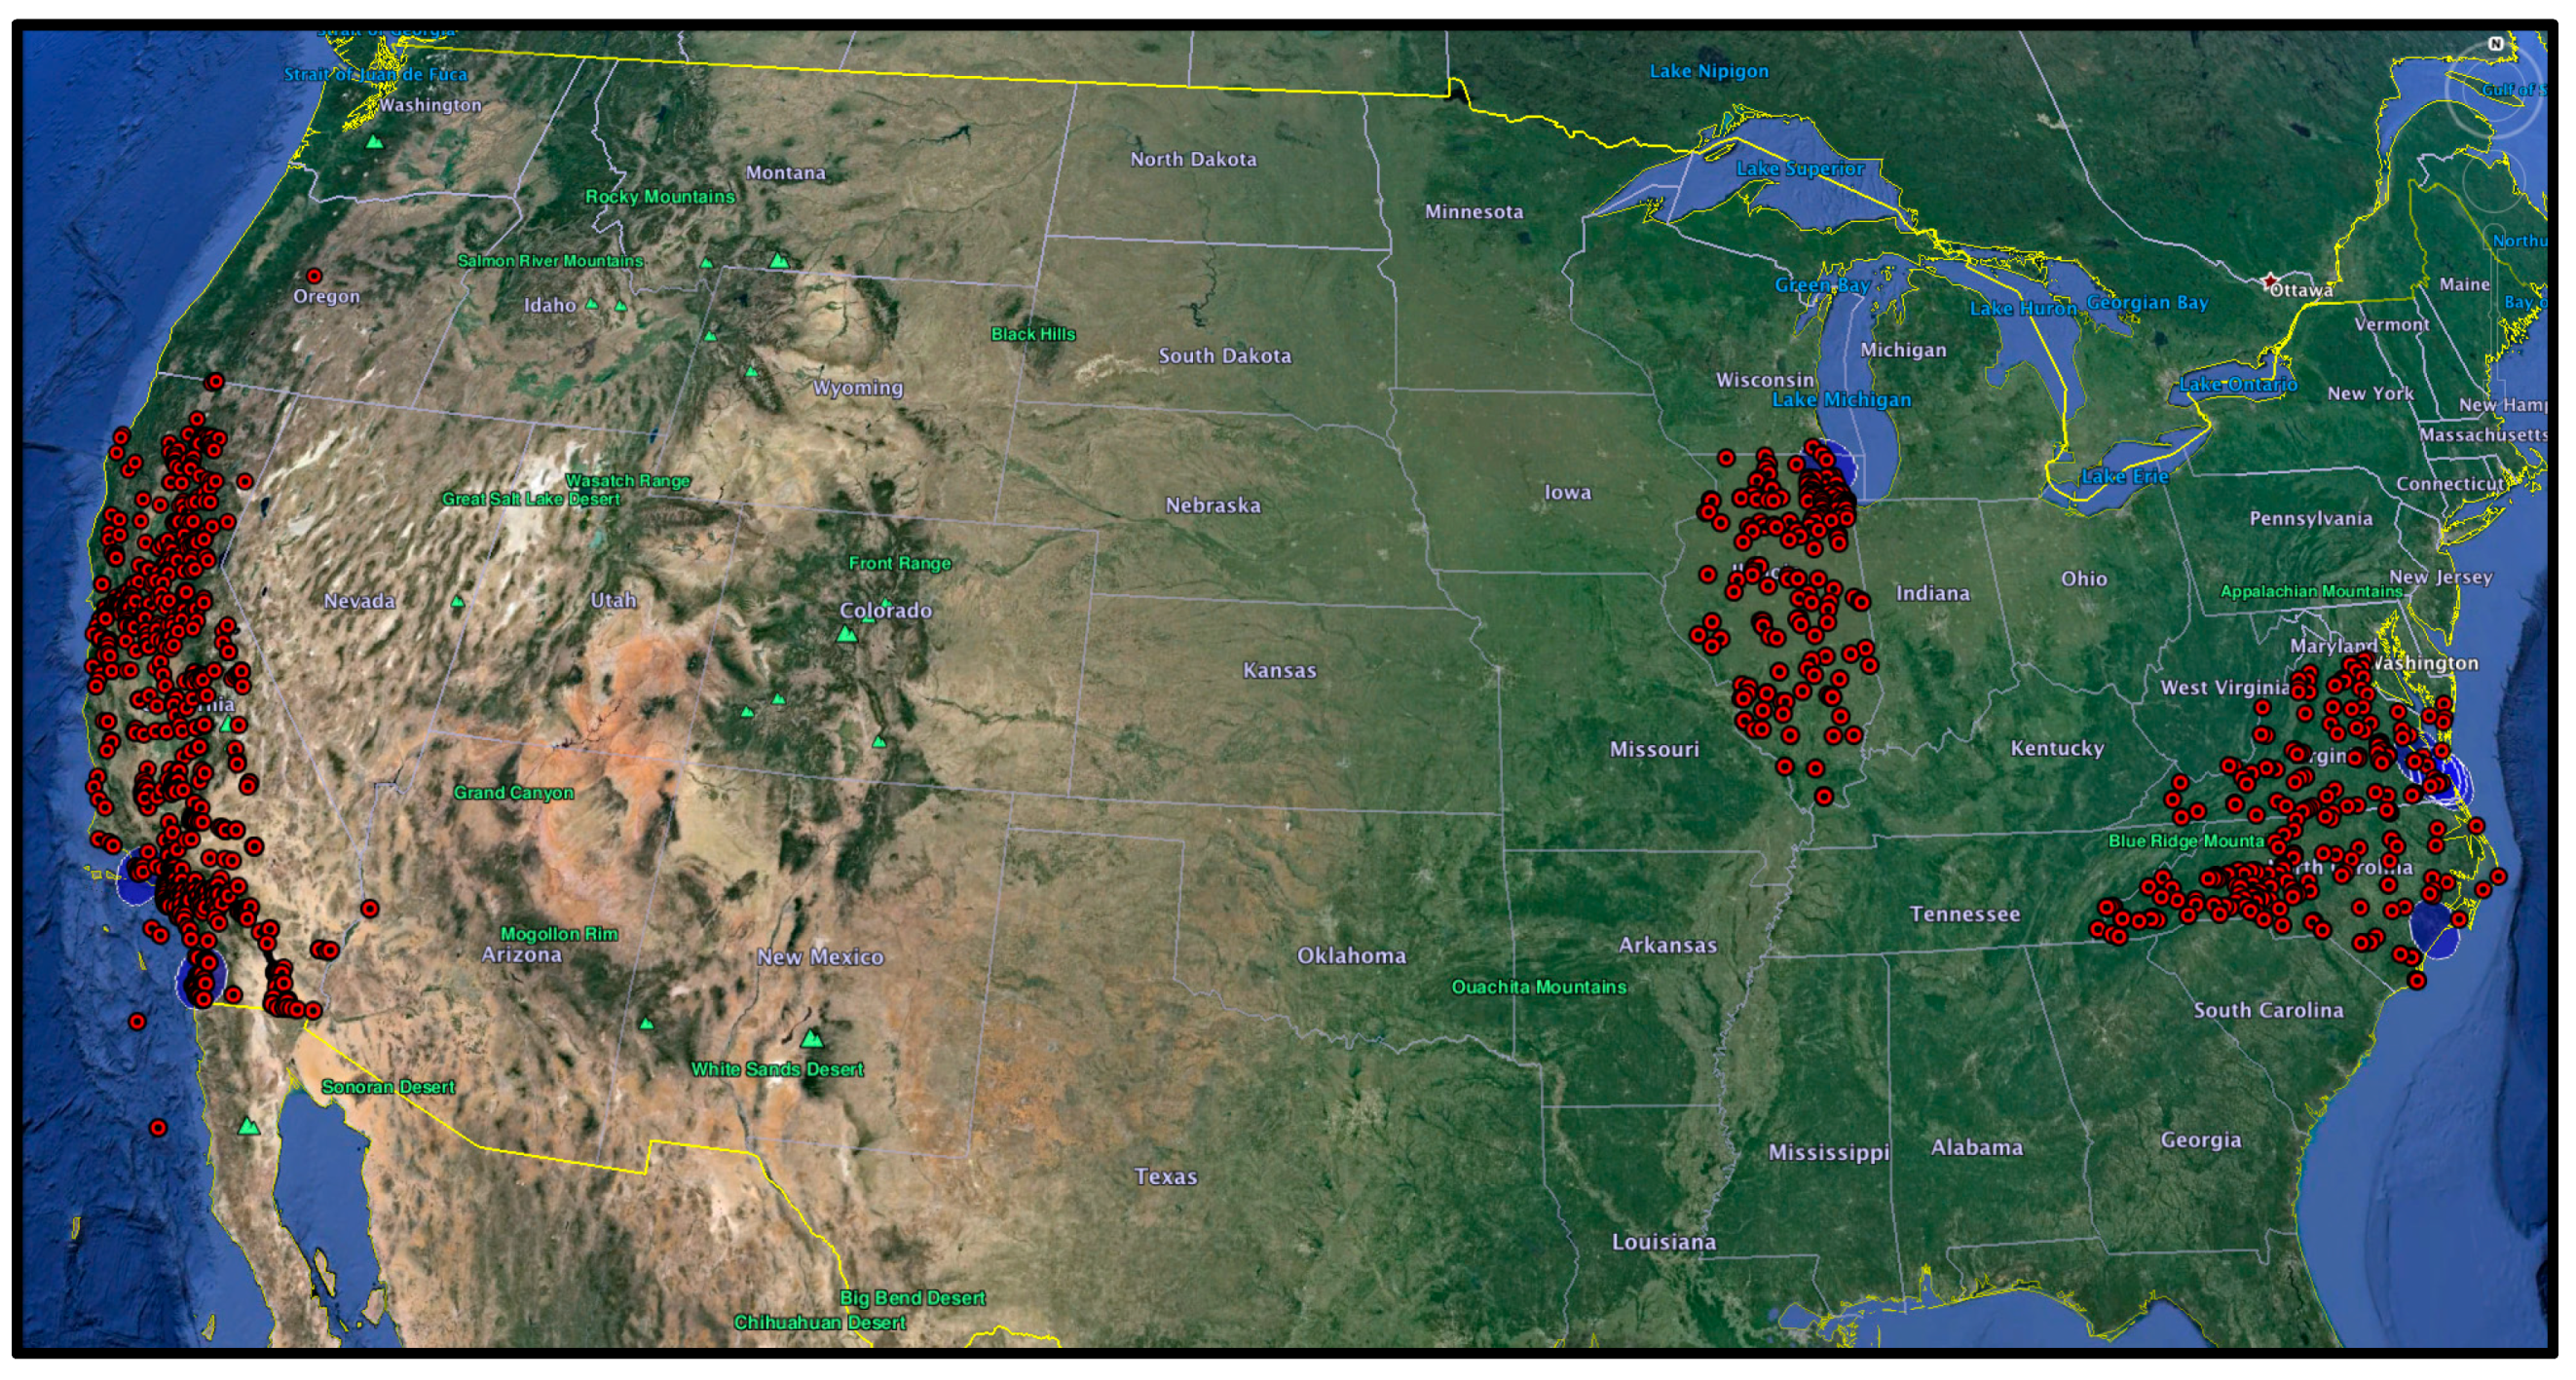
Figure 2, and also information regarding the number of power plants in a 50 mile radius from each building, as shown in
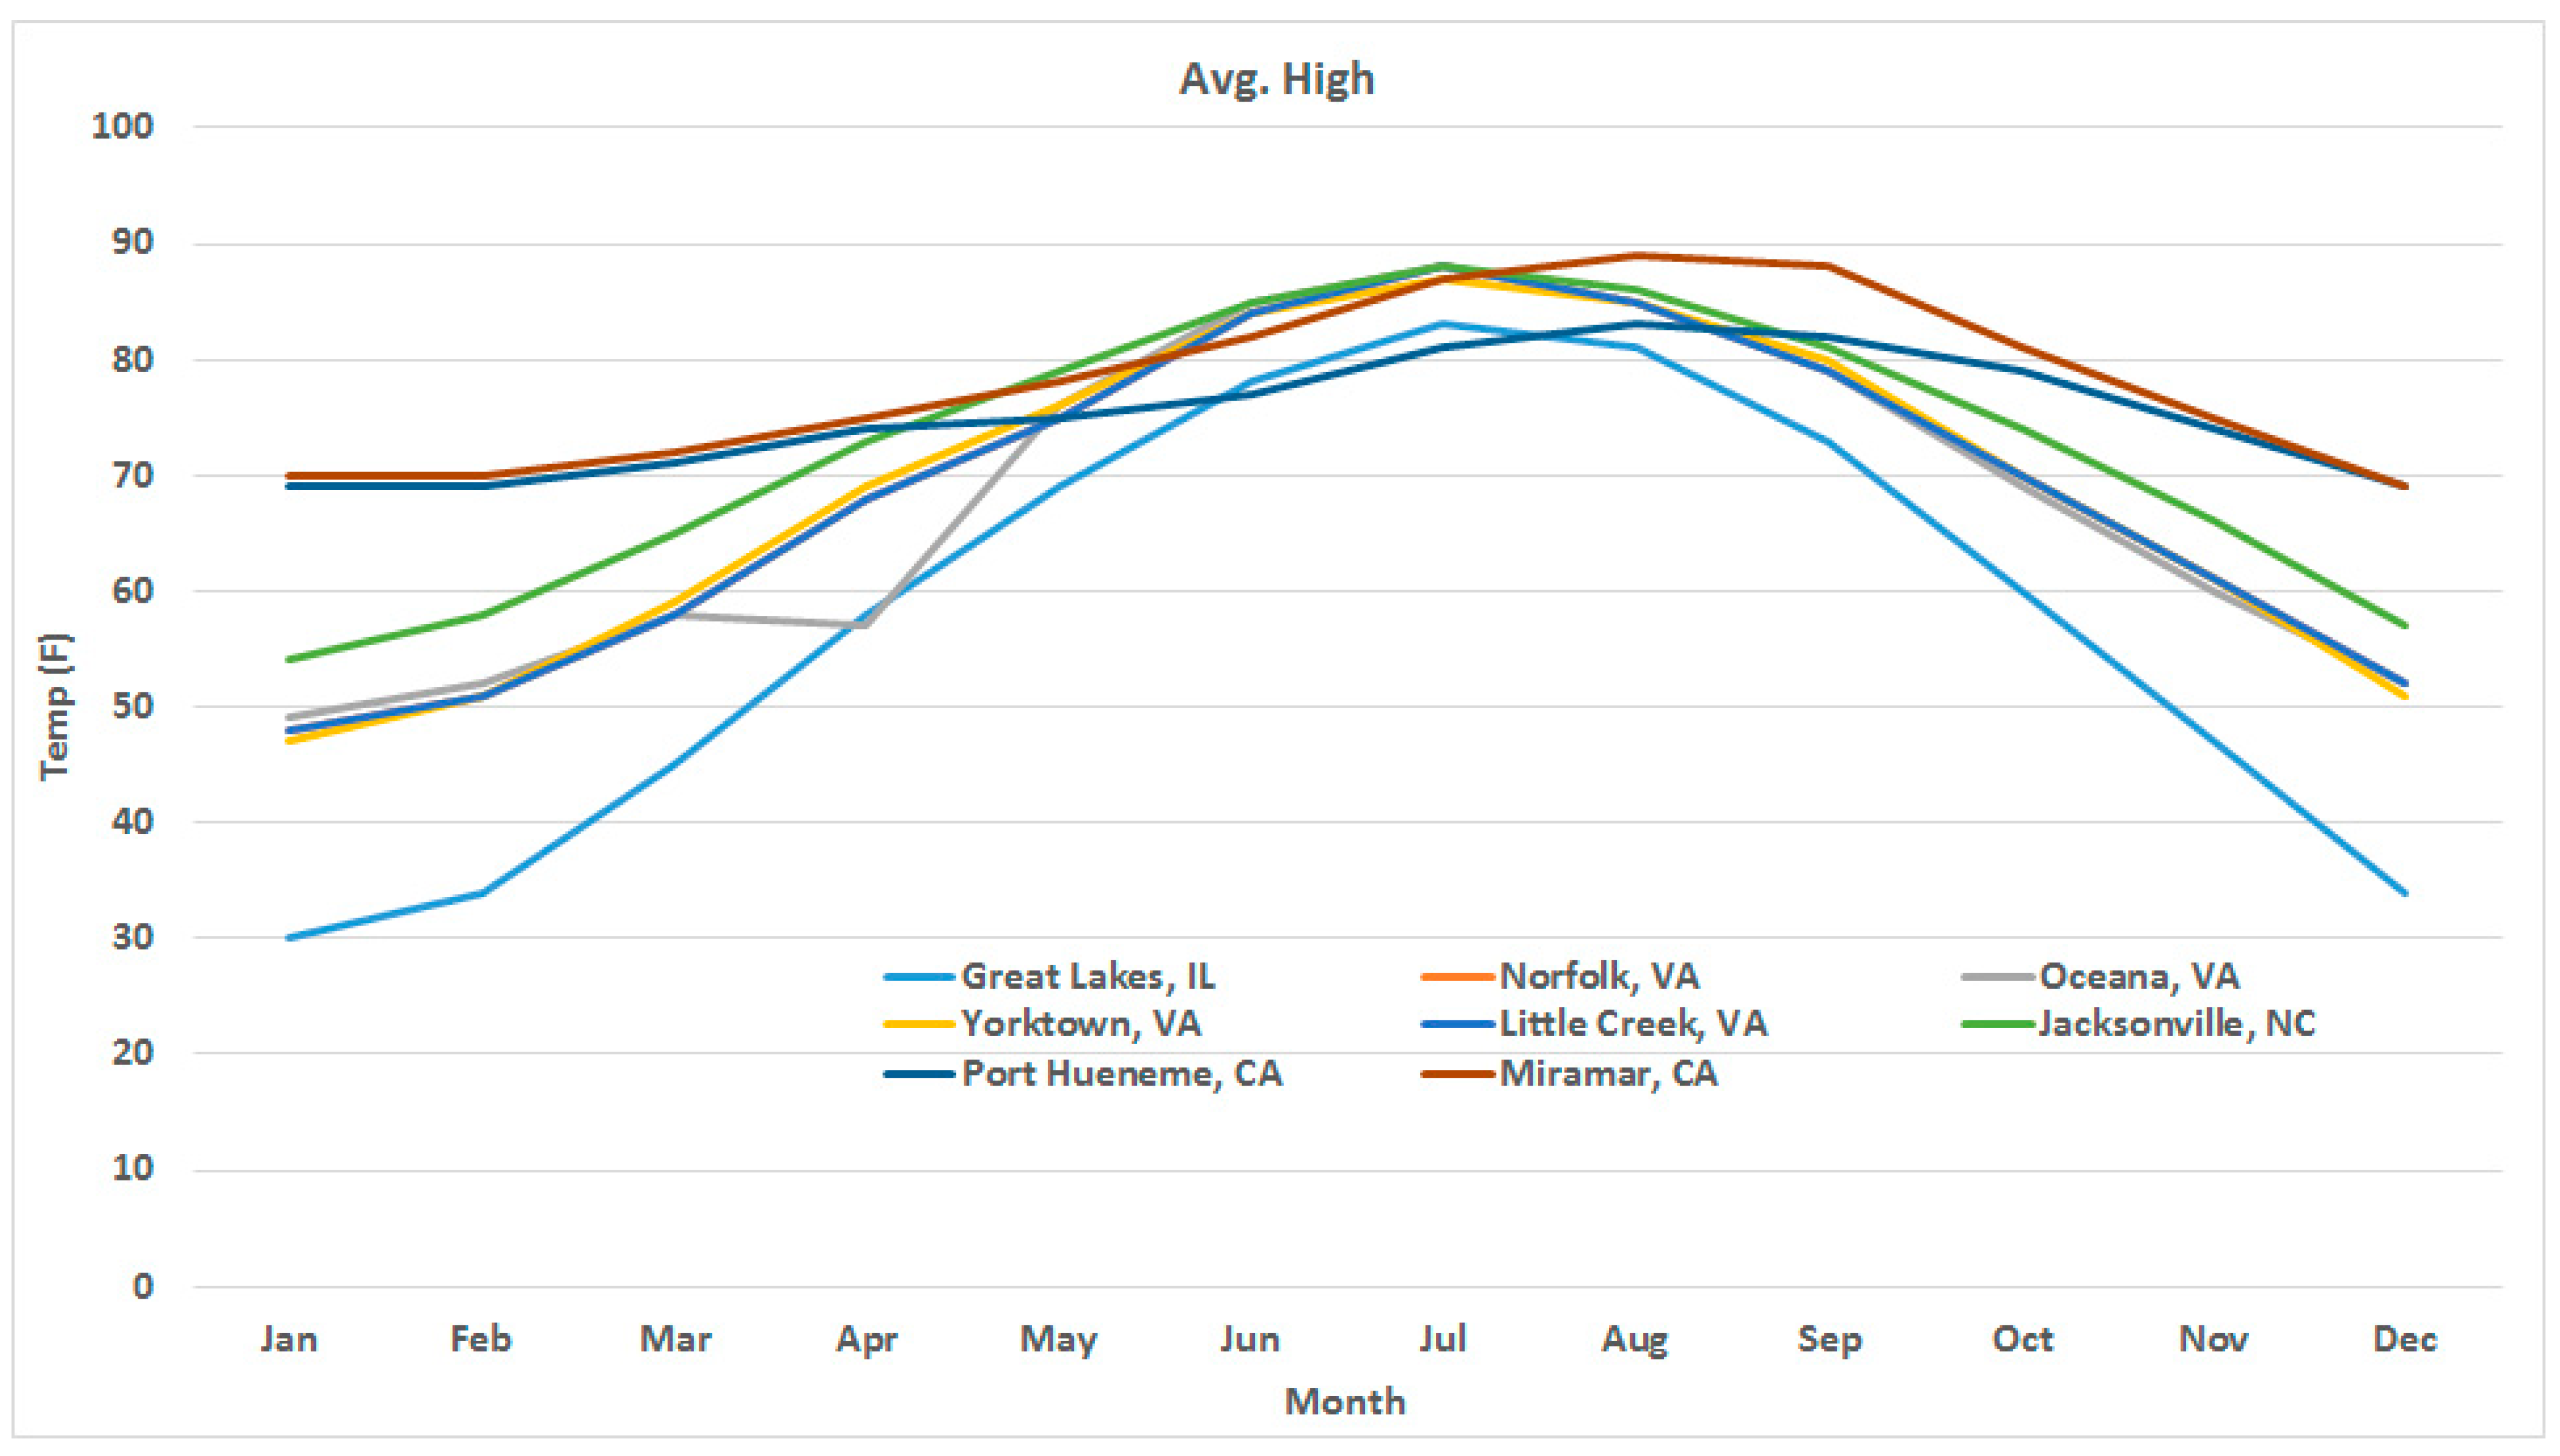
Figure 3. Furthermore, the authors searched the historical temperature records database and prepared monthly temperature data for the study areas, as shown in
Figure 4. Among the study areas, the peak temperatures, which happened in July, did not differ much, but the minimum temperatures varied greatly. In this project, monthly temperature data were used to calculate the yearly average temperature. This transformation has the unfortunate potential to mask the temperature differences from region to region.
Table 1 lists the information related to buildings in this project, which includes location, function, LEED certification level, total electricity consumption in one year, and size. The column for the LEED certification level is not suitable for quantitative analysis because it refers to a qualitative metric. Therefore, in order to quantify the LEED certification ratings, each certification level was given a scaled value, shown in
Table 2. For instance, we use 3 to represent the buildings that were certified LEED Gold. Specifically, this number will quantify the influence of LEED ratings in the regression models.
Table 1.
Location, functionality, and energy consumption of LEED-certified buildings.
Table 1.
Location, functionality, and energy consumption of LEED-certified buildings.
| Locations | Function | LEED
Certification Level | Electricity
Usage
(MWH) | Size () |
|---|
| Naval Station Great Lakes, IL | Training and instruction | Gold | 533.44 | 58,000 |
| Naval Air Station Oceana, VA | Childcare | Silver | 489.99 | 29,000 |
| Naval Station, Norfolk, VA | Maintenance of aircraft | Certified | 513.7 | 40,376 |
| Naval Station, Norfolk, VA | Maintenance of aircraft | Certified | 838.2 | 28,379 |
| Naval Weapons Station, Yorktown, VA | Housing | Certified | 770.8 | 48,700 |
| Naval Amphibious Base Little Creek (NABLC), VA | Administration | Silver | 737.9 | 37,800 |
| Naval Amphibious Base Little Creek (NABLC), VA | Police and security | Silver | 559.7 | 25,000 |
| Naval Vase Ventura County, Port Hueneme, CA | Public works office and maintenance shops | Gold | 144.9 | 16,443 |
| Naval Vase Ventura County, Port Hueneme, CA | Research and engineering (includes offices and Labs) | Silver | 1288.5 | 192,028 |
| Naval Corps Air Station (MCAS) Miramar, CA | Golf course clubhouse | Gold | 487.4 | 13,437 |
5. Data Analysis
The LEED energy case study was verified precisely using general linear regression and spatial linear regression analyses for various reasons. In the case of general linear regression, this statistical technique permits the examination of the relationship between two continuous (quantitative) variables. One variable, denoted as x, serves as the independent variable, while other variables denoted as y are the dependent variables. Given that the LEED energy case study involves a continuous dependent variable (energy consumption), the use of general linear regression is deemed suitable.
Spatial linear regression, on the other hand, factors in the spatial location of observations. In the context of an LEED energy case study, a building’s energy consumption may be influenced by its geographical location due to factors such as local climate conditions and building codes. Spatial linear regression assists in capturing these spatial effects.
The process of model specification entails the determination of which independent variables to include or exclude from the regression equation. In the context of an LEED energy case study, there exists a multitude of potential predictors for a building’s energy consumption, such as building size, building age, and heating system type. Model specification techniques aid in identifying the most significant variables.
Collectively, these methods establish a robust framework for the examination of energy consumption in LEED-certified buildings. They enable the incorporation of multiple predictors, account for spatial influences, and offer flexibility in model formulation.
5.1. Spatial Regression Model
The spatial regression model evolves from the familiar specification of a linear regression model [
23,
24,
25].
where
is an
vector of observations on the dependent variable,
is an
matrix of observations on the explanatory variables, with an associated
regression coefficient vector
, and
is a vector of random error terms. In ordinary linear regression (OLR), the items in
are independent from each other.
Spatial regression [
23] deals with the specification, estimation and diagnostic checking of regression models that incorporate spatial effects. Spatial dependence is introduced into the ordinary linear regression (OLR) model in two major ways, one of which is referred to as spatial lag dependence and the other as spatial error dependence. While the former pertains to the spatial correlation in the dependent variable, the latter refers to the error term. In this project, a spatial lag model was used and takes on the form:
where
is an
spatial weights matrix that formalizes the network structure of LEED-certified buildings and
is the spatial autoregressive parameter.
After some matrix algebra, this follows as:
The best-known test statistic against spatial autocorrelation is the application of Moran’s statistic for spatial autocorrelation to regression residuals. This statistic corrects the well-known Moran’s I for the fact that the random variable under consideration is a regression residual.
Moran’s I for the regression residual is then:
where
is an
vector of OLS residuals
, and
is a normalizing factor.
5.2. Model Specification for LEED Energy Case Study
As denoted in Equation (2), the establishment of a weight matrix is necessary for a spatial regression model of this nature. Previous conducted research has examined the spatial distribution of HVAC system adoption in new or renovated buildings and contended that the incorporation of energy-efficient HVAC systems exhibited a pronounced spatial distribution pattern [
26,
27]. However, as observed in our project, the adoption of HVAC systems represents just one of several factors characterized by spatial distribution. Building construction materials and architectural styles also share this spatial attribute. Furthermore, the year in which buildings were constructed exerts an influence on their energy performance, as the availability of new construction technologies varies across different time periods.
Nonetheless, quantifying the energy consumption stemming from external loads (e.g., computers) presents a challenging task. In this regard, it is important to acknowledge that a weight matrix can only serve as an approximation of the true situation, as the exact quantification of such factors may remain elusive. For simplicity, the effects of distance () between buildings in the same state, and the function of those buildings e.g., military training (), are considered in the weights matrix. The underlying reasons for the authors’ consideration of these two parameters in the weights matrix are:
Evaluating the influence of buildings on each other is naturally linked to the distance between them. A shorter distance implies greater similarities between two buildings. For example, within the same neighborhood, individuals with similar income and education levels tend to reside together. These factors significantly impact their preferences for buildings with similar functions. Additionally, local policies play a direct role in determining the types of buildings adopted within a neighborhood.
In the context of the U.S. Navy buildings examined in this research, distance also holds relevance as these structures are typically situated within close proximity to one another. Furthermore, in terms of energy consumption, people’s habits can exert an effect. For instance, individuals sharing similar consumption patterns and cultural traditions tend to exhibit a comparable propensity for energy conservation. All of these factors can be effectively simplified and evaluated using distance as a scale of measurement.
The function of a building plays a pivotal role in the assessment of its energy consumption. Beyond meeting fundamental requirements (e.g., suitability for habitation), military buildings must also fulfill specific and unique mandates. For instance, a building dedicated to weapon manufacturing primarily consumes energy in the production of weapons. Consequently, variations in functional attributes are expected to result in differing energy consumption patterns.
However, the authors recognized that directly quantifying the impact of such functional properties for each building can be challenging. To circumvent this challenge, the concept of weights was employed. These weights establish connections between buildings with similar functions. For example, two military training facilities with comparable energy consumption patterns are assigned a weight of 0.5 each when analyzing their energy consumption.
Shown below is the way in which the weights matrix that was used in this project was generated.
Example: assuming buildings A, B, C, D are in the same state (e.g., VA). A and B are used for military training, while C and D are used for administration. The distance between them are dAB = 50 miles, dAC = 30 miles, dAD = 60 miles, dBC = 70 miles, dBD = 60 miles, and dCD = 100 miles.
We assume the weight for distance is generated by Equation (4).
Then, the generated weight for building A and B will be:
As specified above, we have the weights matrix as:
7. Conclusions
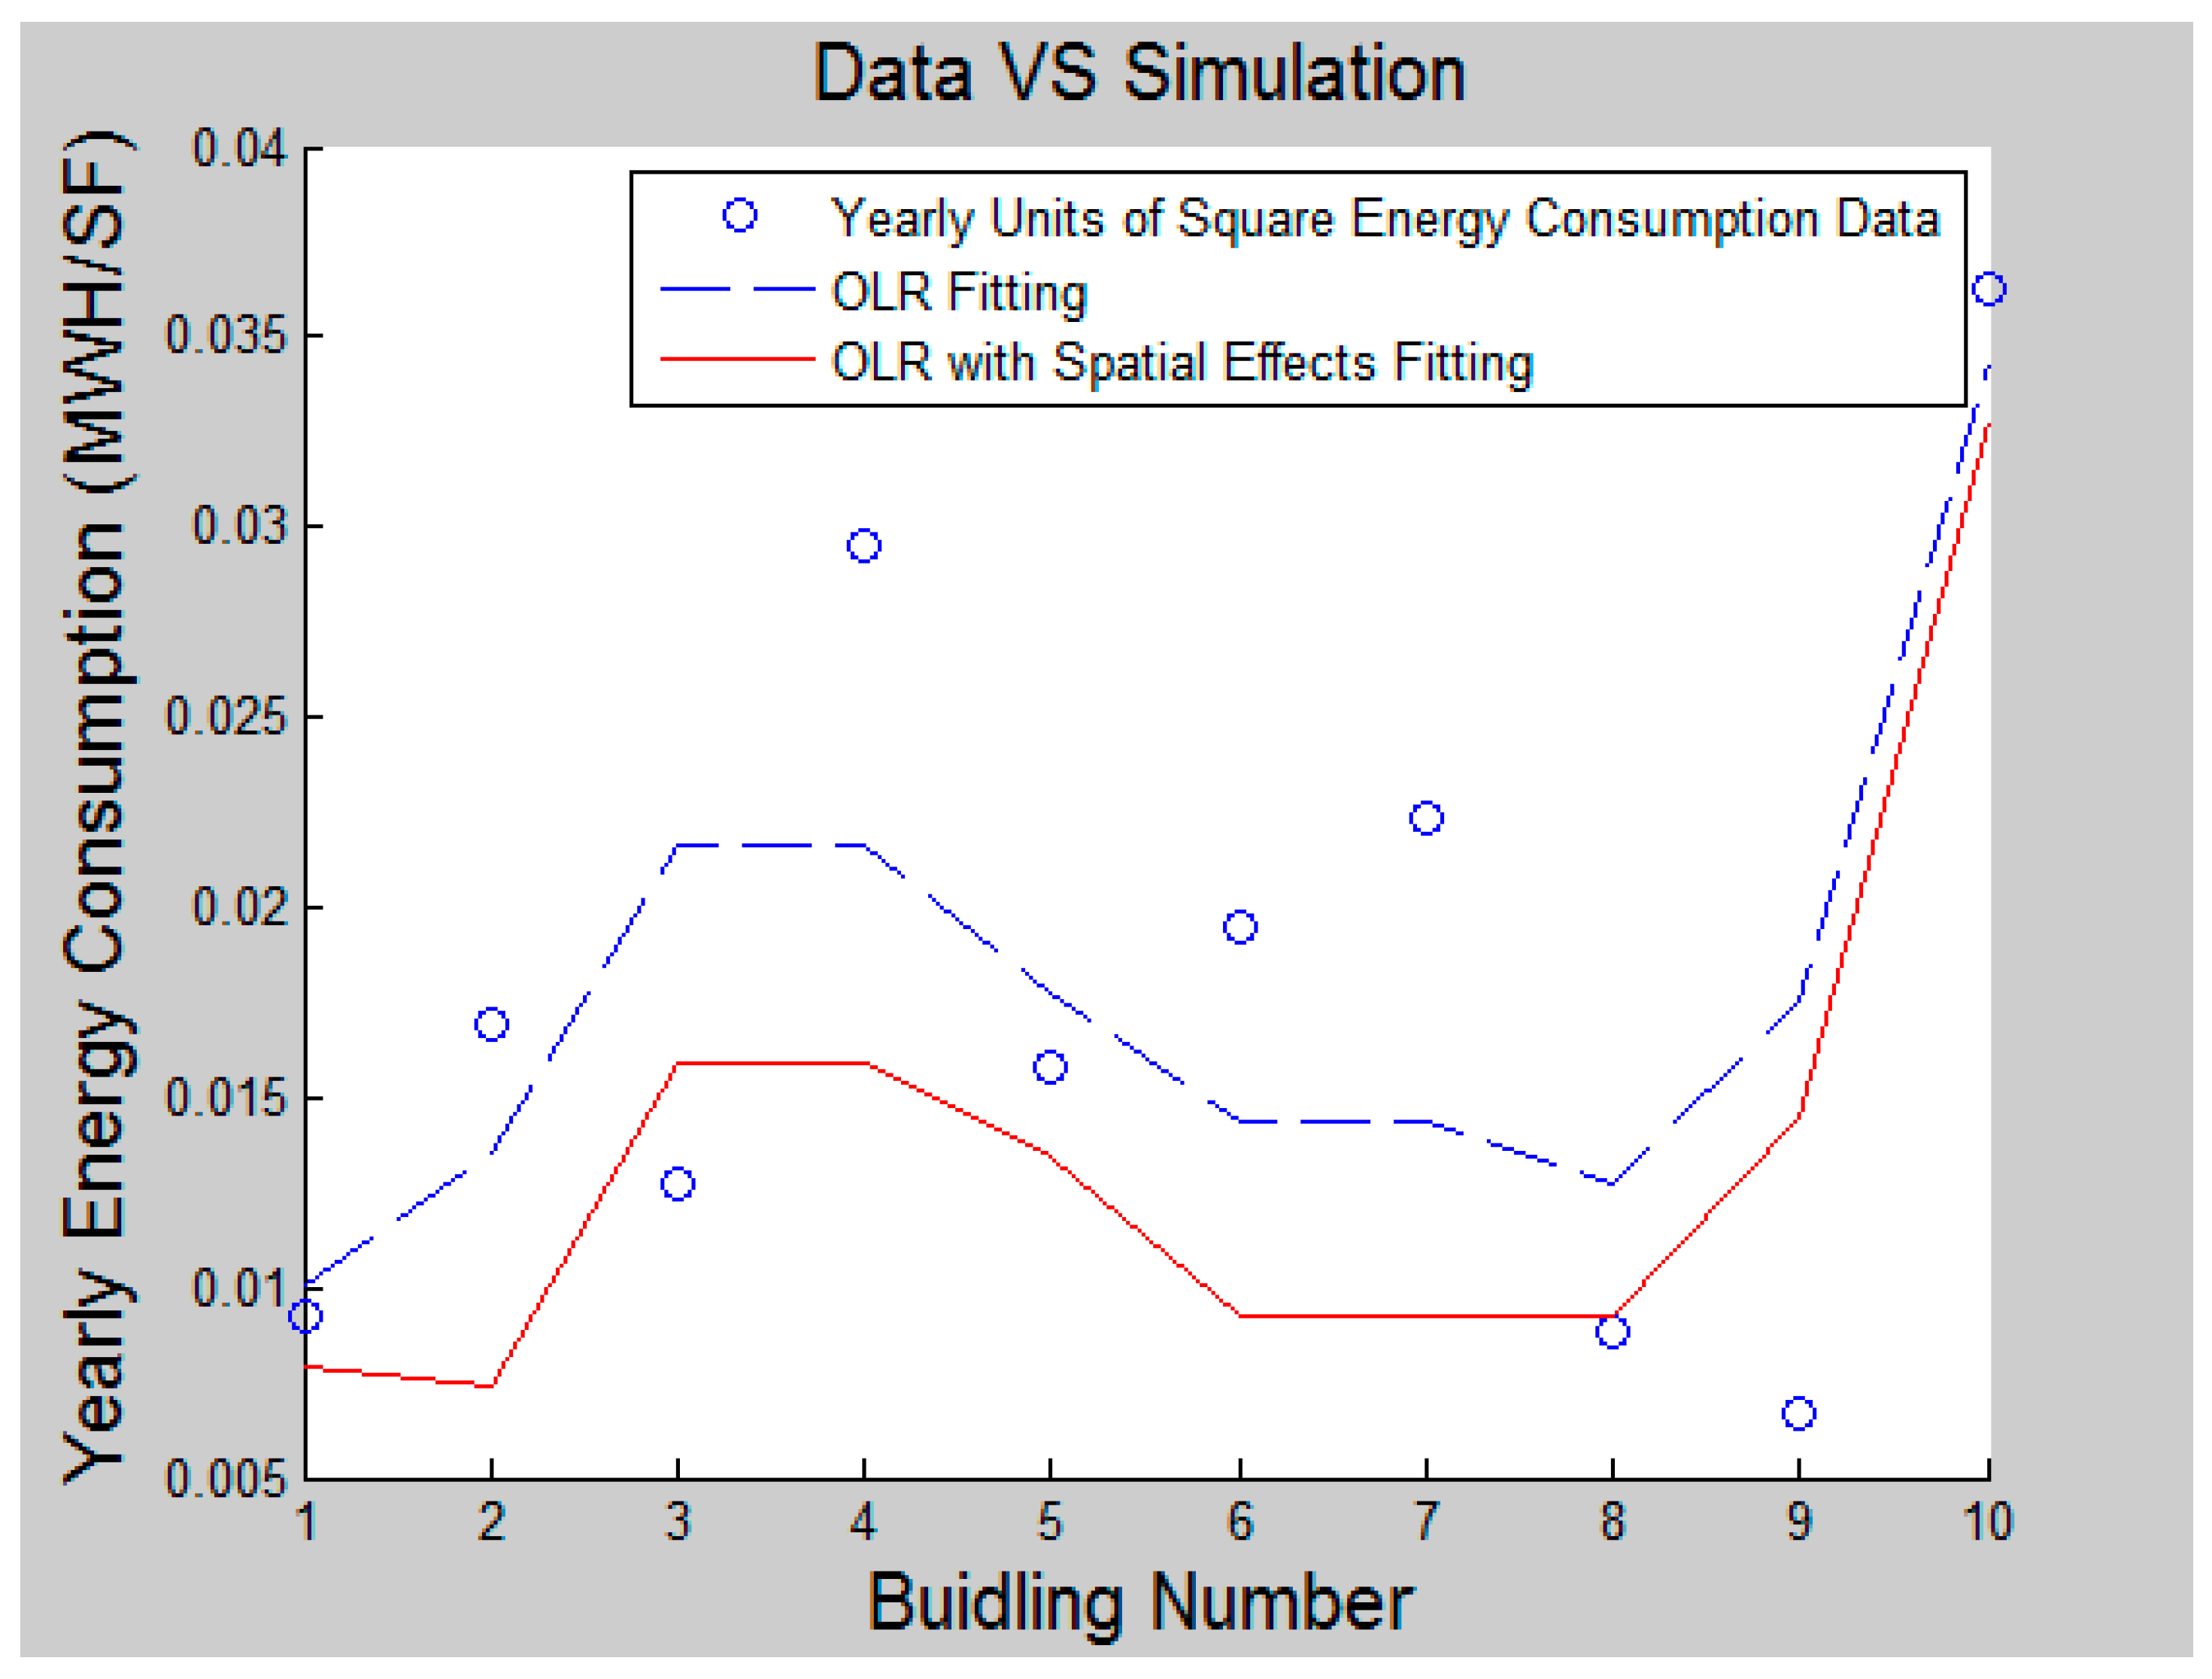
The primary objective of this research was to investigate the multifaceted factors influencing energy consumption within LEED-certified military buildings. The study systematically examined both endogenous factors, like temperature, and exogenous factors, such as proximity to power plants, to discern their impact on energy usage. While the study did not reveal a strong linear relationship between energy consumption and variables, such as annual average temperature, the number of power plants within a 50 mile radius, and the LEED rating, a spatial regression model unveiled noteworthy insights into the geographical distribution and functional diversity of various LEED buildings, highlighting their role in shaping energy consumption patterns. This substantiates existing assumptions in the literature that energy usage varies significantly among buildings located in different geographical regions and serving distinct purposes.
The utilization of spatial regression in this study stands out as a potent analytical tool, opening up the potential to unearth intricate correlations between energy consumption and a diverse array of contributing factors. This research thus contributes significantly to our understanding of how energy is consumed within LEED-certified military buildings and sheds light on the interplay between architectural features, geographical context, and energy efficiency.
The significance of future US LEED-certified buildings for energy managers/utility directors is underscored by several key points to consider:
Energy Efficiency: LEED-certified buildings are intentionally designed to surpass conventional buildings in terms of energy efficiency. This results in reduced energy consumption for heating, cooling, lighting, and other operational aspects. Lower utility costs and a diminished carbon footprint are anticipated as a result of these buildings.
Performance Monitoring: Vigilant and continuous monitoring of the performance of LEED-certified buildings is imperative to ensure they consistently meet their energy efficiency objectives. This entails regular assessments of energy consumption and comparisons with similar non-LEED-certified facilities. Energy managers/utility directors should adopt a proactive approach to track and analyze these data.
Climate Strategy: The release of Climate Action 2030 by the U.S. Navy and Marine Corps sets forth a commitment to achieving net-zero greenhouse gas emissions by 2050. This strategy will inherently influence the design, construction, and operation of forthcoming LEED-certified buildings.
Training and Education: Remaining updated on the latest best practices for managing LEED-certified buildings is essential for energy managers/utility directors. This may entail participation in training sessions or workshops, reading industry publications, or engaging in networking opportunities with fellow professionals in the field.
Stakeholder Engagement: Energy managers/utility directors assume a pivotal role in engaging with various stakeholders, including building occupants, maintenance personnel, and senior leadership. They are instrumental in educating these groups about the advantages of LEED certification and illustrating how each stakeholder can contribute to a building’s energy efficiency goals.
Although LEED-certified buildings come with a multitude of advantages, it is imperative to emphasize that they demand meticulous and diligent management in order to fully realize their potential for enhanced energy efficiency and sustainability. Proper oversight and strategic decision-making are essential to ensure that these buildings continue to uphold their commitment to environmentally responsible and energy-efficient operations over time.


