
Alternative Integrated Ethanol, Urea, and Acetic Acid Processing Routes Employing CCU: A Prospective Study through a Life Cycle Perspective

 , , and
Abstract
:1. Introduction
2. Background
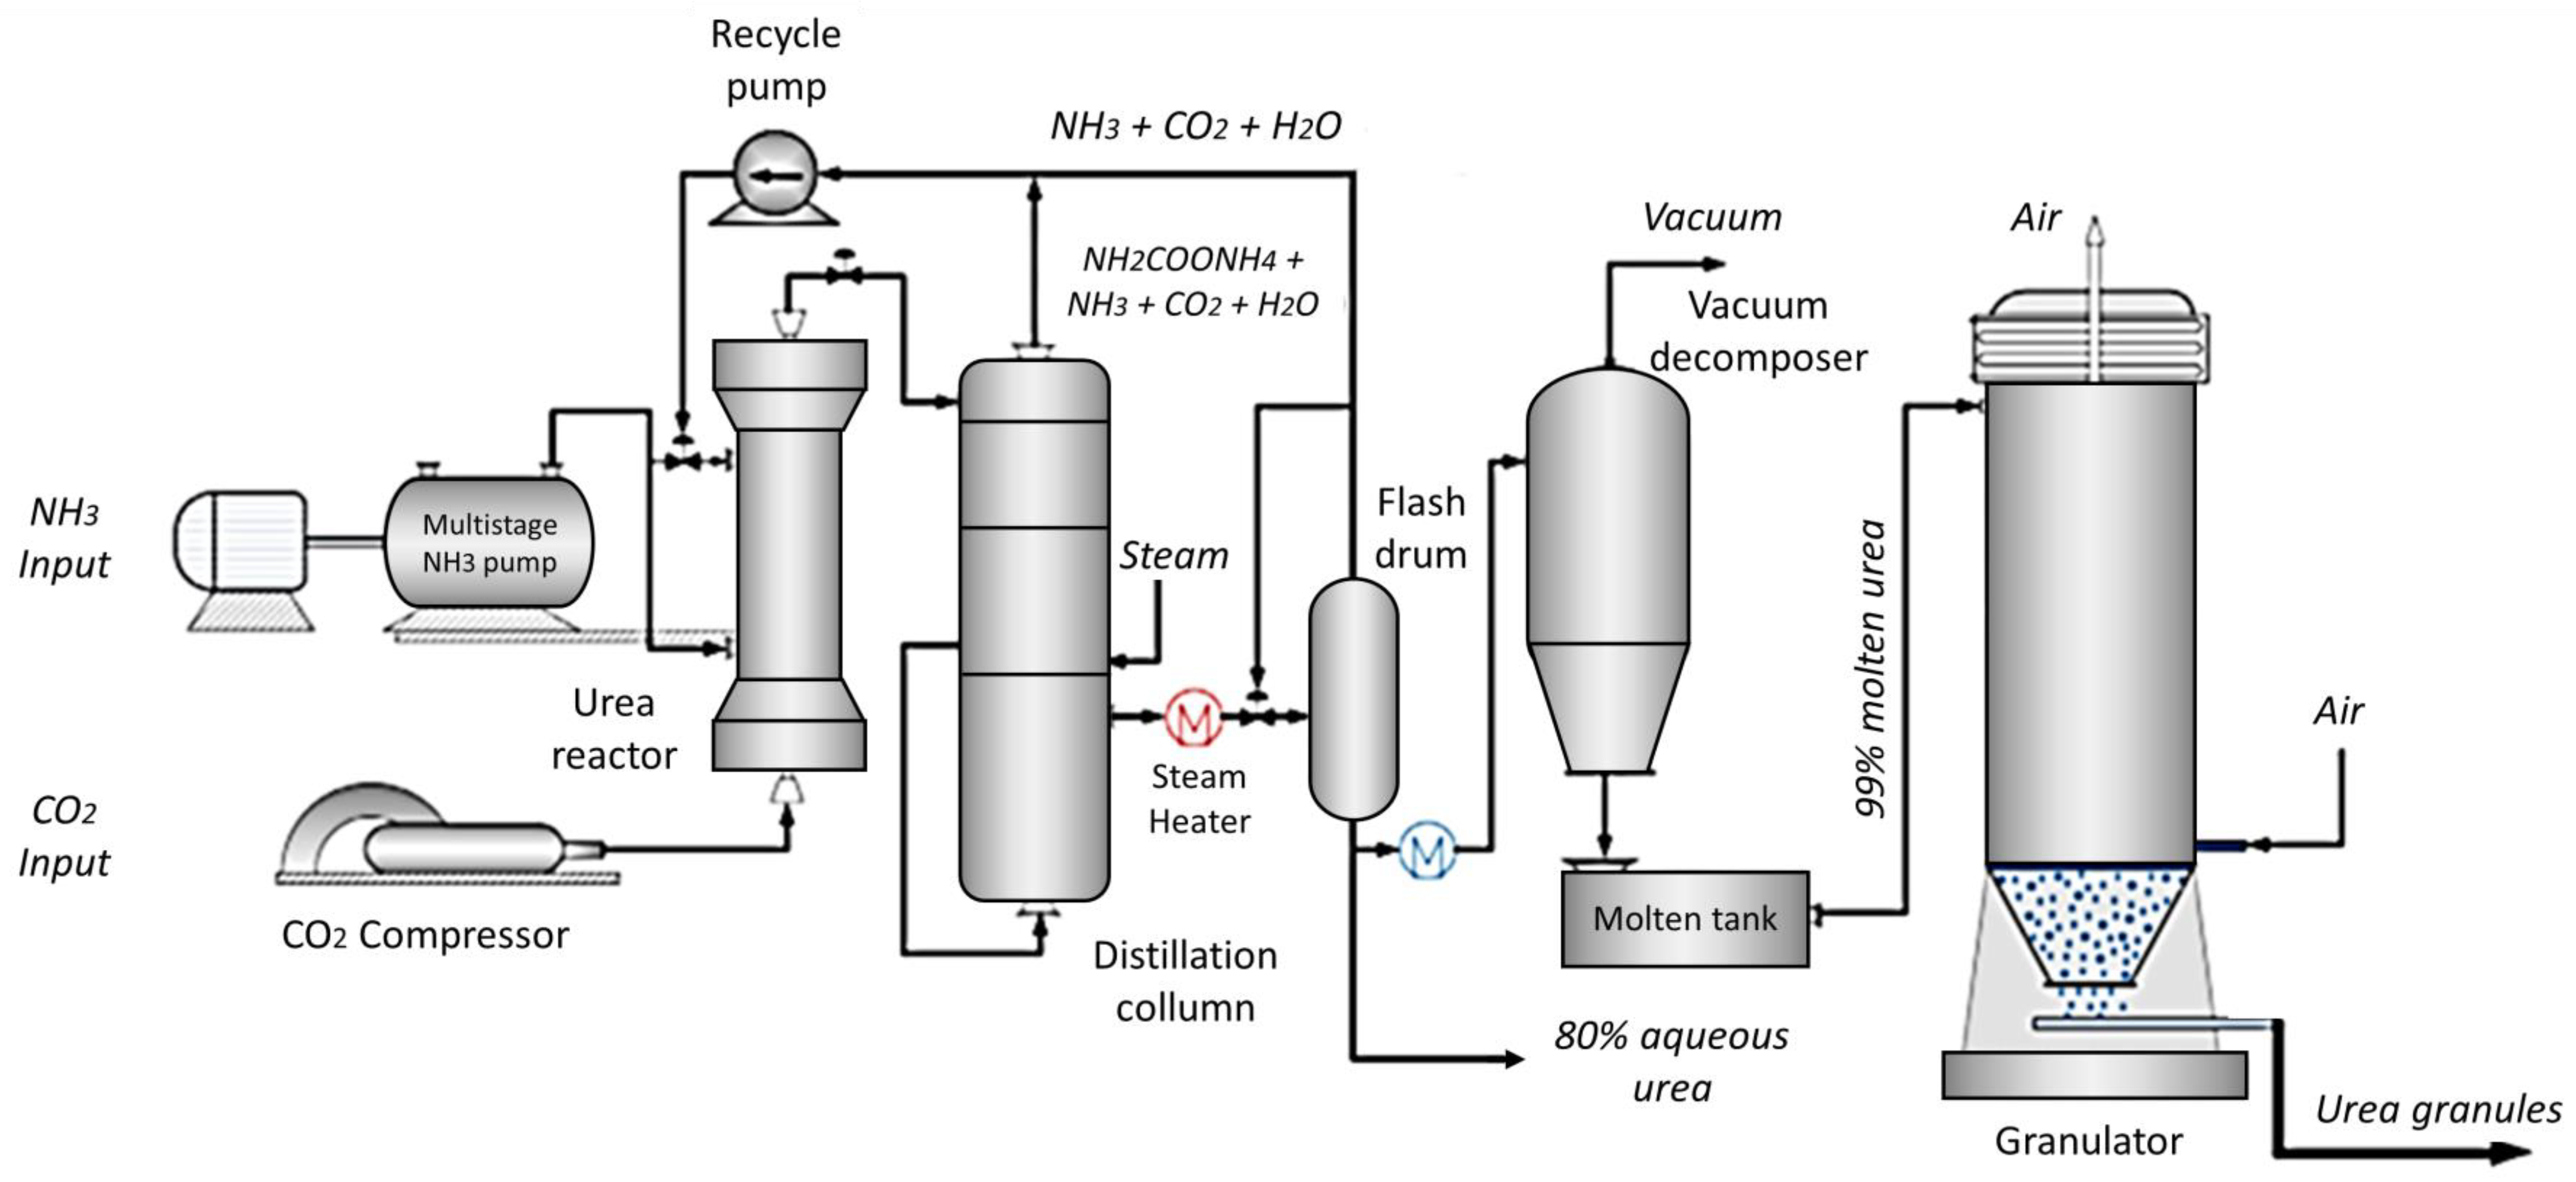
2.1. Urea
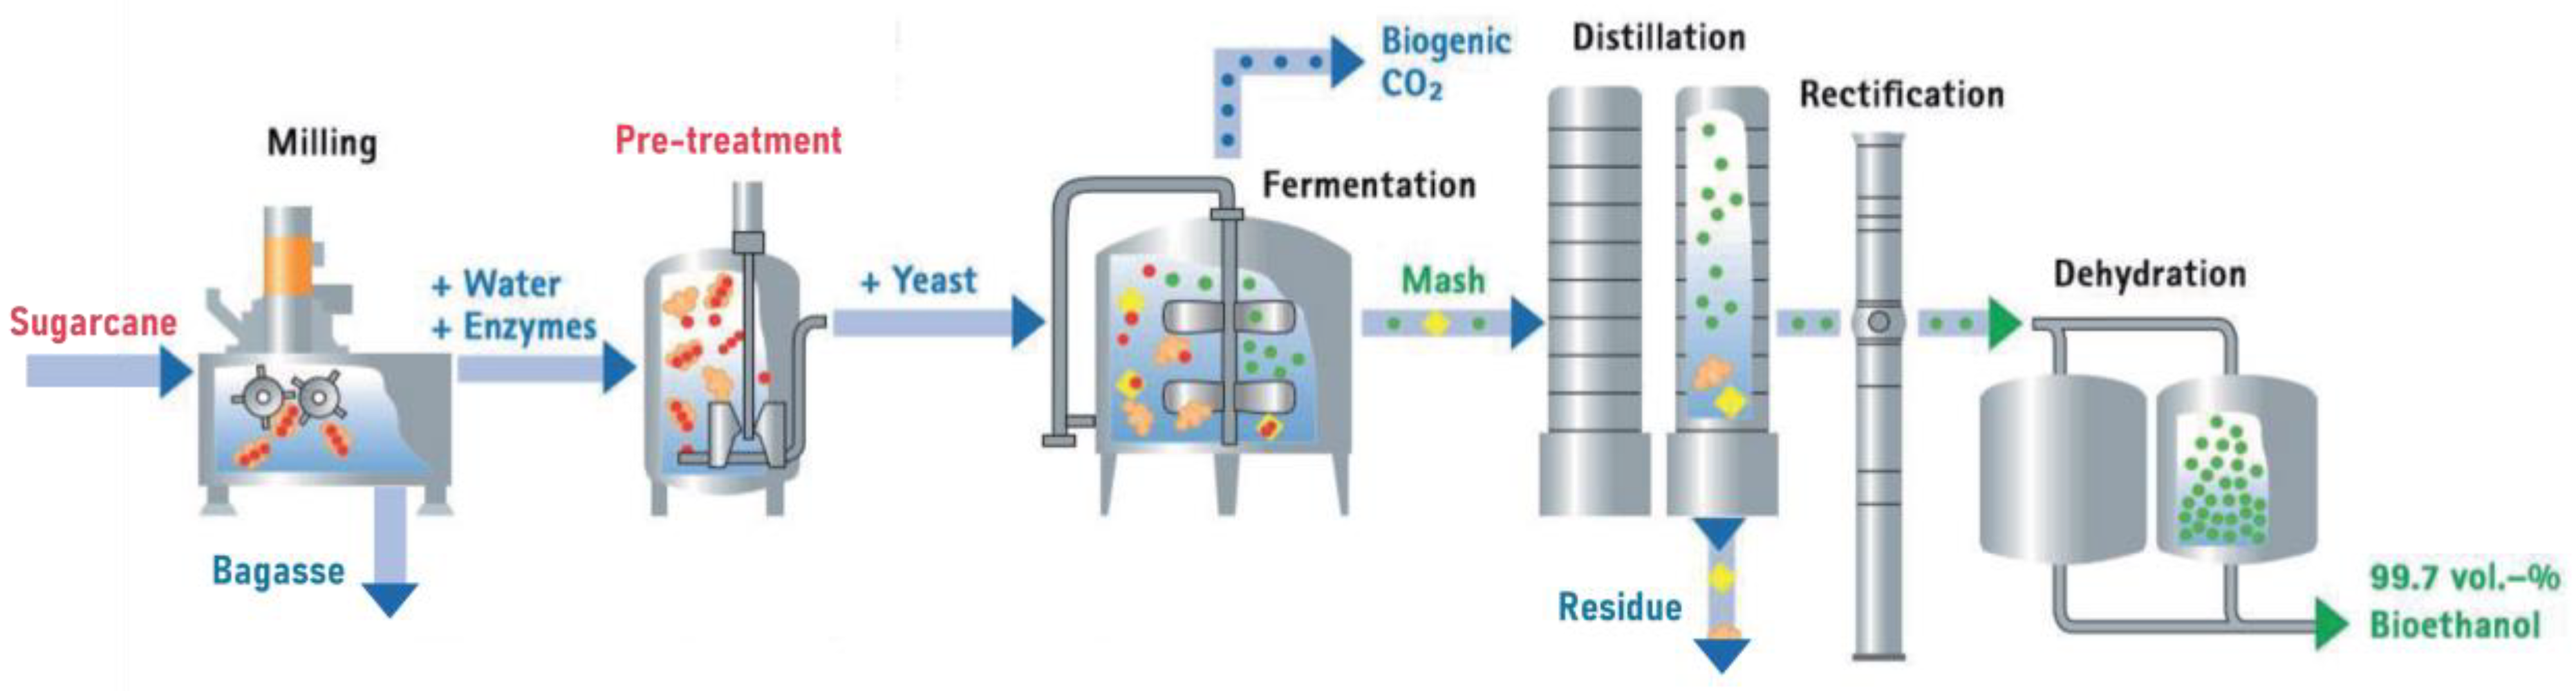
2.2. Ethanol
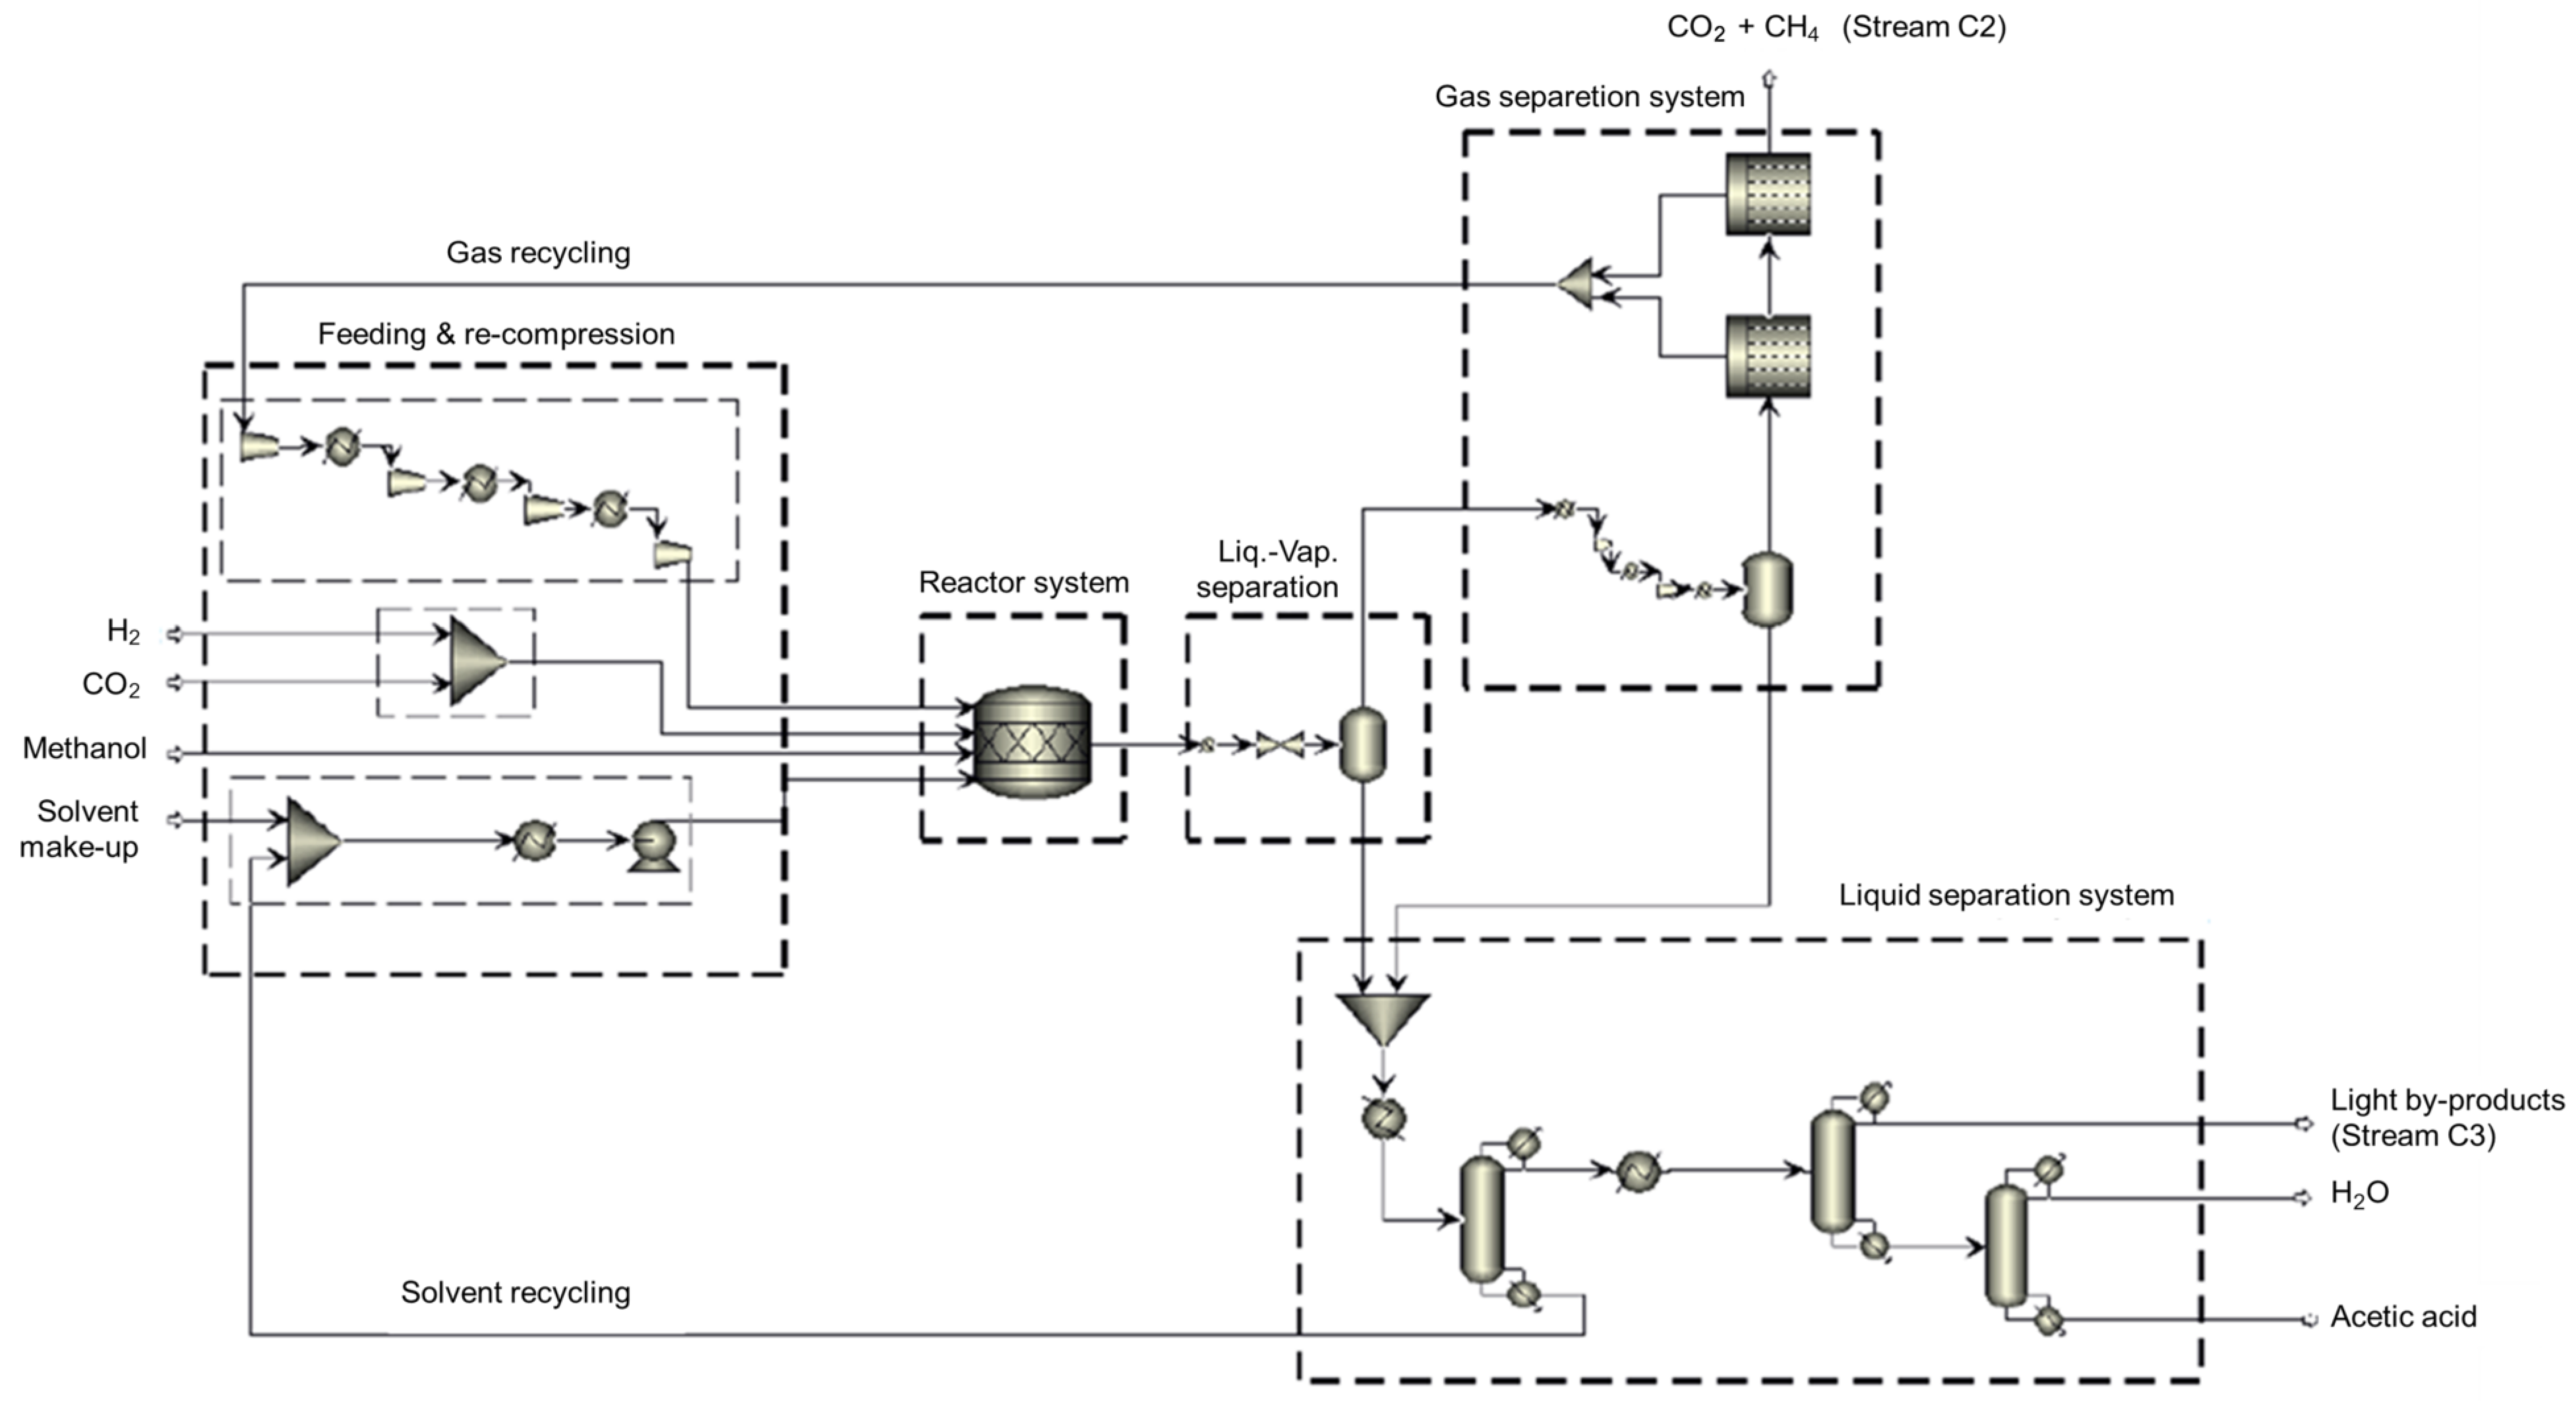
2.3. Acetic Acid
2.4. Industrial Ecology
3. Methodology
3.1. Literature Review
3.2. Technological Arrangement Formulation and Specification
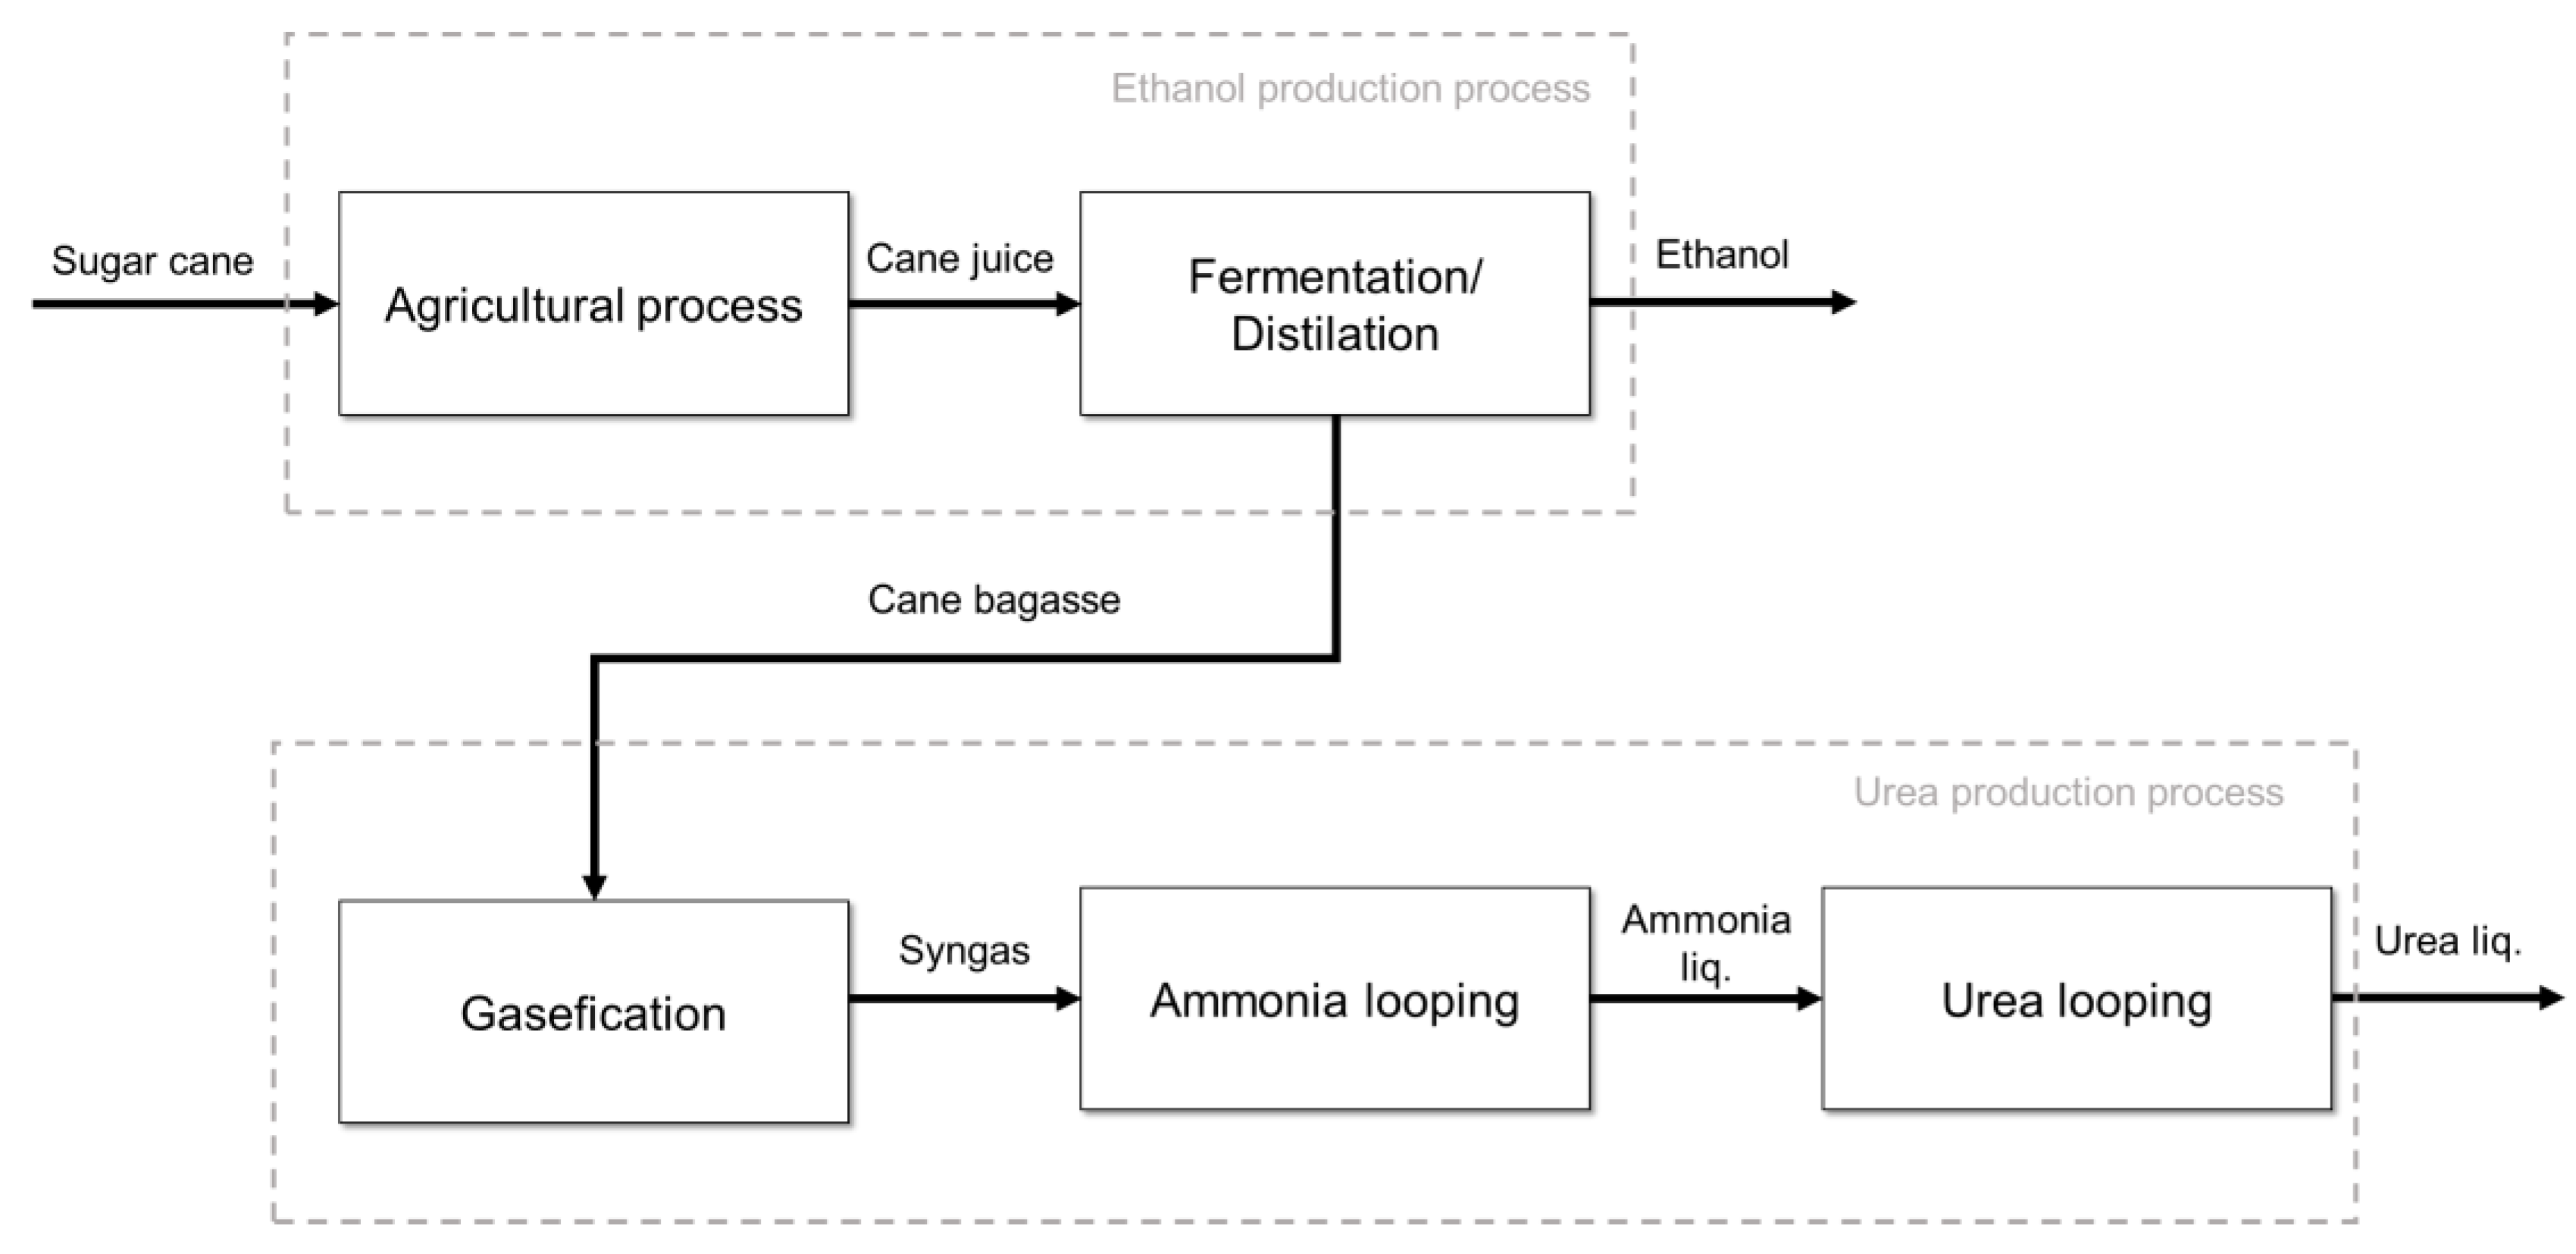
3.3. Model Integration from a CCU Perspective
3.4. Environmental Assessment Scenario Development
3.5. Life Cycle Modeling
3.6. Life Cycle Inventory (LCI)
4. Environmental Results
5. Results Discussion and Recommendations
5.1. Scenario Analysis
5.2. LCA of Ethanol, Urea, and Acetic Acid Production Previous Studies
5.3. CCU Perspective
5.4. Process Integration Perspective
6. Conclusions
- -
- The integration of industrial processes has the potential to considerably reduce the contributions to Global Warming Potential (GWP) and Primary Energy Demand (PED) from the manufacture of those essential inputs;
- -
- CCU technologies based on the use of Pressure Swing Adsorption (PSA) are viable alternatives for reducing environmental impacts in the chemical industry due to their low electrical operating demand, as well as for regions where electricity is mainly generated from renewable sources, as in the case of Brazil;
- -
- The recovery of emissions in industrial processes generates significant environmental benefits and should always be encouraged.
Author Contributions
Funding
Institutional Review Board Statement
Informed Consent Statement
Data Availability Statement
Acknowledgments
Conflicts of Interest
References
- IHS Markit—Urea. S&P. Available online: https://my.ihsmarkit.com/urea (accessed on 12 February 2021).
- Lin, X.; Lu, K.; Hardison, A.K.; Liu, Z.; Xu, X.; Gao, D.; Gong, J.; Gardner, W.S. Membrane inlet mass spectrometry method (REOX/MIMS) to measure 15N-nitrate in isotope-enrichment experiments. Ecol. Indic. 2021, 126, 107639. [Google Scholar] [CrossRef]
- Driver, G.J.; Owen, E.R.; Makanyire, T.; Lake, A.J.; Mcgregor, J.; Styring, P. Blue Urea: Fertilizer with Reduced Environmental Impact. Front. Energy Res. 2019, 7, 88. [Google Scholar] [CrossRef]
- Ayres, U.R.; Ayres, W.L. A Handbook of Industrial Ecology; Edward Elgar Publishing: Cheltenham, UK, 2002. [Google Scholar]
- Wang, D.; Montané, D.; Chornet, E. Catalytic steam reforming of biomass-derived oxygenates: Acetic acid and hydroxyacetaldehyde. Appl. Catal. A Gen. 1996, 143, 245–270. [Google Scholar] [CrossRef]
- Baena-Moreno, F.M.; Rodríguez-Galán, M.; Vega, F.; Alonso-Fariñas, B.; Vilches Arenas, L.F.; Navarrete, B. Carbon capture and utilization technologies: A literature review and recent advances. Energy Sources Part A Recovery Util. Environ. Eff. 2019, 41, 1403–1433. [Google Scholar] [CrossRef]
- Thambimuthu, K.; Soltanieh, M.; Abanades, J.C. Chapter 3: Capture of CO2. In IPCC, 2005: IPCC Special Report on Carbon Dioxide Capture and Storage; Working Group III of the Intergovernmental Panel on Climate Change, Metz, B., Davidson, O., de Coninck, H.C., Loos, M., Meyer, L.A., Eds.; Cambridge University Press: Cambridge, UK; New York, NY, USA,, 2005; 442p. [Google Scholar]
- Cardoso, F.H. Desempenho Ambiental e Energético da Gaseificação de Biomassa de Cana- de-Açúcar Como Rota Alternativa de Produção de Amônia. Master’s Thesis, University of São Paulo, São Paulo, Brazil, 2019. [Google Scholar]
- Aissani, L.; Lacassagne, A.; Bahers, J.; Le Féon, S. Life cycle assessment of industrial symbiosis: A critical review of relevant reference scenarios. J. Ind. Ecol. 2019, 23, 972–985. [Google Scholar] [CrossRef]
- Ashton, W.S. The Structure, Function, and Evolution of a Regional Industrial Ecosystem. J. Ind. Ecol. 2009, 13, 228–246. [Google Scholar] [CrossRef]
- Sokka, L.; Lehtoranta, S.; Nissinen, A.; Melanen, M. Analyzing the Environmental Benefits of Industrial Symbiosis. J. Ind. Ecol. 2011, 15, 137–155. [Google Scholar] [CrossRef]
- Kaufman, S.M. Quantifying sustainability: InDustrial ecology, materials flow and life cycle analysis. In Metropolitan Sustainability; Elsevier: Amsterdam, The Netherlands, 2012; pp. 40–54. [Google Scholar] [CrossRef]
- El-Halwagi, M.M.; Chouinard-Dussault, P.; Bradt, L.; Ponce-Ortega, J.M. Incorporation of process integration into life cycle analysis for the production of biofuels. Clean Technol. Environ. Policy 2011, 13, 673–685. [Google Scholar] [CrossRef]
- Singh, A.; Lou, H.H.; Yaws, C.L.; Hopper, J.R.; Pike, R.W. Environmental impact assessment of different design schemes of an industrial ecosystem. Resour. Conserv. Recycl. 2007, 51, 294–313. [Google Scholar] [CrossRef]
- ISO 14044; Environmental Management—Life Cycle Assessment—Requirements and Guidelines, 1st ed. ISO—International Organization for Standardization: Genève, Switzerland, 2006.
- Fang, Y.-K.; Wang, H.-C.; Fang, P.-H.; Liang, B.; Zheng, K.; Sun, Q.; Li, X.-Q.; Zeng, R.; Wang, A.-J. Life cycle assessment of integrated bioelectrochemical-constructed wetland system: Environmental sustainability and economic feasibility evaluation. Resour. Conserv. Recycl. 2023, 189, 106740. [Google Scholar] [CrossRef]
- Sakamoto, H.; Bruschi, L.; Kulay, L.; Yamakami, A. Using the Life Cycle Approach for Multiobjective Optimization in the Context of the Green Supply Chain: A Case Study of Brazilian Coffee. Sustainability 2023, 15, 13987. [Google Scholar] [CrossRef]
- Meessen, J. Urea synthesis. Chem. Ing. Tech. 2014, 86, 2180–2189. [Google Scholar] [CrossRef]
- Milani, D.; Kiani, A.; Haque, N.; Giddey, S.; Feron, P. Green pathways for urea synthesis: A review from Australia’s perspective. Sustain. Chem. Clim. Action 2022, 1, 100008. [Google Scholar] [CrossRef]
- Domingos, A.P. Produção de Ureia: Avaliação Técnica e Econômica; Course Completion Project; Chemical Engineering Department, The University of Uberlandia: Uberlandia, Brazil, 2018. [Google Scholar]
- IHS Markit—Ethanol. CEH. Available online: https://connect.ihsmarkit.com/document/show/phoenix/100474?connectPath=ChemicalMarketReportsandAnalysis&searchSessionId=ff296bd5-f0ff-44d8-aa8b-685704ce8bdb (accessed on 12 February 2021).
- NOVACANA. Available online: https://www.novacana.com/etanol/fabricacao (accessed on 17 February 2021).
- Shinnosuke, O.; Koziel, J.A.; Van Leeuwen, J.; Jenks, W.S.; Grewell, D.; Lingshuang, C. Ethanol Production, Purification, and Analysis Techniques: A Review; ASABE Annual International Meeting; ASABE: St. Joseph, MI, USA, 2008. [Google Scholar]
- Basu, P. Biomass Gasification. In Pyrolysis and Torrefaction—Practical Design and Theory, 2nd ed.; Elsevier Inc.: San Diego, CA, USA, 2013. [Google Scholar]
- Yun, Y. Alcohol Fuels: Current Status and Future Direction. In Alcohol Fuels—Current Technologies and Future Prospect; IntechOpen: London, UK, 2020. [Google Scholar] [CrossRef]
- FAPESP. Propriedades do Bagaço da Cana- de-Açúcar. 1998. Available online: https://revistapesquisa.fapesp.br/propriedades-do-bagaco-da-cana-de-acucar (accessed on 16 February 2021).
- Goldemberg, J.; Coelho, S.T.; Guardabassi, P. The sustainability of ethanol production from sugarcane. J. Elsevier Energy Policy 2008, 36, 2086–2097. [Google Scholar] [CrossRef]
- EPE—Energy Research Company. Brazilian Energy Balance—Yearbook. 2022. Available online: https://www.epe.gov.br/sites-pt/publicacoes-dados-abertos/publicacoes/PublicacoesArquivos/publicacao-748/topico-687/BEN2023.pdf (accessed on 19 October 2023).
- IHS Markit—Acetic Acid—CEH. Available online: https://connect.ihsmarkit.com/document/show/phoenix/113058?connectPath=ChemicalMarketReportsandAnalysis&searchSessionId=8f993840-24ca-405b-aa56-bcaa151f6bd8 (accessed on 10 January 2021).
- Kutepow, N.V.; Himmele, W.; Hohenschutz, H. Die Synthese von Essigsäure aus Methanol und Kohlenoxyd. Chem. Ing. Tech. 1965, 37, 383–388. [Google Scholar] [CrossRef]
- Paulik, F.E.; Roth, J.F. Novel Catalysts for the Low-Pressure Carbonylation of Methanol to Acetic Acid. Chem. Commun. 1968, 11, 1578. [Google Scholar] [CrossRef]
- Qian, Q.; Zhang, J.; Cui, M.; Han, B. Synthesis of acetic acid via methanol hydrocarboxylation with CO2 and H2. Nat. Commun. 2016, 7, 11481. [Google Scholar] [CrossRef]
- Cardenas-Gonzalez, O.D.; Santos-Lopez, I.A.; Handy, B.E.; Cano-Gomez, J.J.; Ojeda-Galvan, H.J.; De Haro-Del Rio, D.A.; Bustos-Martinez, D.; Flores-Escamilla, G.A. Hydrocarboxylation of methanol to methyl acetate using rhodium and ruthenium nanoparticles supported on titanate nanotubes as catalysts: Infrared spectroscopy study. Catal. Sci. Technol. 2023, 13, 726–736. [Google Scholar] [CrossRef]
- Budsberg, E.; Vera, M.R.; Crawford, T.J.; Bura, R.; Gustafson, R. Production routes to bio-acetic acid: Life cycle assessment. Biotechnol. Biofuels Bioprod. 2020, 13, 154. [Google Scholar] [CrossRef] [PubMed]
- Wietschel, L.; Messmann, L.; Thorenz, A.; Tuma, A. Environmental benefits of large-scale second-generation bioethanol production in the EU: An integrated supply chain network optimization and life cycle assessment approach. J. Ind. Ecol. 2021, 25, 677–692. [Google Scholar] [CrossRef]
- Messmann, L.; Wietschel, L.; Thorenz, A.; Tuma, A. Assessing the social dimension in strategic network optimization for sustainable development: The case of bioethanol production in the EU. J. Ind. Ecol. 2022, 27, 760–776. [Google Scholar] [CrossRef]
- Pacheco, K.A.; Bresciani, A.E.; Nascimento, C.A.O.; Alves, R.M.B. CO2-based Acetic Acid Production Assessment. In Proceedings of the 30th European Symposium on Computer Aided Process Engineering (ESCAPE30), Milan, Italy, 31 August–2 September 2020. [Google Scholar]
- Lee, D.; Elgowainy, A. By-product hydrogen from steam cracking of natural gas liquids (NGLs): Potential for large-scale hydrogen fuel production, life-cycle air emissions reduction, and economic benefit. Int. J. Hydrogen Energy 2018, 43, 20143–20160. [Google Scholar] [CrossRef]
- Luo, L.; Van Der Voet, E.; Huppes, G.; Udo De Haes, H.A. Allocation Issues in LCA Methodology: A case study of corn stover-based fuel ethanol. Int. J. Life Cycle Assess. 2009, 14, 529–539. [Google Scholar] [CrossRef]
- Sakamoto, H.; Maciel, M.; Cardoso, F.H.; Kulay, L. Energy and Environmental Contributions for Future Natural Gas Supply Planning in Brazil. Energy Technol. 2019, 8, 1900976. [Google Scholar] [CrossRef]
- Sakamoto, H.; Ronquim, F.M.; Seckler, M.M.; Kulay, L. Environmental performance of effluent conditioning systems for reuse in oil refining plants: A case study in Brazil. Energies 2019, 12, 326. [Google Scholar] [CrossRef]
- Moore, C.C.S.; Kulay, L. Effect of the implementation of carbon capture systems on the environmental, energy, and economic performance of the Brazilian electricity matrix. Energies 2019, 12, 331. [Google Scholar] [CrossRef]
- Morita, A.M.; Moore, C.C.S.; Nogueira, A.R.; Kulay, L.; Ravagnani, M.A.A.S. Assessment of potential alternatives for improving environmental trouser jeans manufacturing performance in Brazil. J. Clean. Prod. 2020, 247, 119156. [Google Scholar] [CrossRef]
- Miranda, D.S.; Kulay, L. A prospective study on the environmental feasibility of supplying electricity to the Brazilian Amazon through biogas power generation. Sustain. Energy Technol. Assess. 2023, 55, 102962. [Google Scholar] [CrossRef]
- Hodnebrog, Ø.; Etminan, M.; Fuglestvedt, J.S.; Marston, G.; Myhre, G.; Nielsen, C.J.; Shine, K.P.; Wallington, T.J. Global warming potentials and radiative efficiencies of halocarbons and related compounds: A comprehensive review. Rev. Geophys. 2013, 51, 300–378. [Google Scholar] [CrossRef]
- Frischknecht, R.; Jungbluth, N.; Althaus, H.-J.; Bauer, C.; Doka, G.; Dones, R.; Hischier, R.; Hellweg, S.; Humbert, S.; Köllner, T.; et al. Implementation of Life Cycle Impact Assessment Methods; Ecoinvent Report No. 3, v2.0; Swiss Centre for Life Cycle Inventories: Dübendorf, Switzerland, 2007; Available online: https://inis.iaea.org/collection/NCLCollectionStore/_Public/41/028/41028089.pdf (accessed on 10 November 2023).
- Jungbluth, N.; Chudacoff, M.; Dauriat, A.; Dinkel, F.; Doka, G.; Faist Emmenegger, M.; Gnansounou, E.; Kljun, N.; Schleiss, K.; Spielmann, M.; et al. Life Cycle Inventories of Bioenergy; Ecoinvent Report No. 17, v2.0; ESU-Services: Uster, Switzerland, 2007; Available online: www.ecoinvent.org (accessed on 20 February 2023).
- Althaus, H.J.; Chudacoff, M.; Hischier, R.; Jungbluth, N.; Osses, M.; Primas, A. Life Cycle Inventories of Chemicals; Ecoinvent Report No. 8, v2.0. EMPA; Swiss Centre for Life Cycle Inventories: Dübendorf, Switzerland, 2007; Available online: www.ecoinvent.org (accessed on 20 February 2023).
- Donke, A.C.G.; Novaes, R.M.L.; Pazianotto, R.A.A.; Moreno-Ruiz, E.; Reinhard, J.; Picoli, J.F.; Matsuura, M.I.S.F. Integrating regionalized Brazilian land use change datasets into the Ecoinvent database: New data, premises, and uncertainties have large effects in the results. Int. J. Life Cycle Assess. 2020, 25, 1027–1042. [Google Scholar] [CrossRef]
- Barizon, R.R.M.; Matsuura, M.I.S.F.; Scachetti, M.T.; Bayma, G.; Costa, M.P.; Garofalo, D.F.T.; de Lanes, V.F.; Picoli, G.; Pighinelli, A.L.M.T.; Morandi, M.A.B. PestLCI Model: Parameterization for Scenarios of Brazilian Agricultural Production; Embrapa Environment: Jaguariúna, Brazil, 2021; Available online: https://www.infoteca.cnptia.embrapa.br/infoteca/bitstream/doc/1137347/1/Barizon-PestLCI-model-2021.pdf (accessed on 20 February 2023).
- Fertilizers Europe (2016): Average Emissions Year 2014. Fertilizers Europe Environmental Report (Internal). Used for Updated Energy and GHG Emission in Carbon Footprint Calculator. Available online: https://www.fertilizerseurope.com/initiatives/carbon-footprint-calculator/ (accessed on 16 January 2023).
- Bussa, M.; Jungbluth, N.; Meili, C. Life Cycle Inventories for Long-Distance Transport and Distribution of Natural Gas; ESU-services Ltd.: Schaffhausen, Switzerland, 2022; Available online: http://esu-services.ch/data/public-lci-reports/ (accessed on 20 February 2023).
- Muñoz, I.; Flury, K.; Jungbluth, N.; Rigarlsford, G.; Canals, L.M.; King, H. Life cycle assessment of bio-based ethanol produced from different agricultural feedstocks. Int. J. Life Cycle Assess. 2014, 19, 109–119. [Google Scholar] [CrossRef]
- Cavalett, O.; Chagas, M.F.; Seabra, J.E.A.; Bonomi, A. Comparative LCA of ethanol versus gasoline in Brazil using different LCIA methods. Int. J. Life Cycle Assess. 2013, 18, 647–658. [Google Scholar] [CrossRef]
- Caldeira-Pires, A.; Benoist, A.; da Luz, S.M.; Silverio, V.C.; Silveira, C.M.; Machado, F.S. Implications of removing straw from soil for bioenergy: An LCA of ethanol production using total sugarcane biomass. J. Clean. Prod. 2018, 181, 249–259. [Google Scholar] [CrossRef]
- Tsiropoulos, I.; Faaij, A.P.C.; Seabra, J.E.A.; Lundquist, L.; Schenker, U.; Briois, J.F.; Patel, M.K. Life cycle assessment of sugarcane ethanol production in India in comparison to Brazil. Int. J. Life Cycle Assess. 2014, 19, 1049–1067. [Google Scholar] [CrossRef]
- Shirmohammadi, R.; Aslani, A.; Batuecas, E.; Ghasempour, R.; Romeo, L.M.; Petrakopoulou, F. A comparative life cycle assessment for solar integration in CO2 capture utilized in a downstream urea synthesis plant. J. CO2 Util. 2023, 74, 102534. [Google Scholar] [CrossRef]
- Kumar, P.; Verma, S.; Gupta, A.; Ranjan Paul, A.; Jain, A.; Haque, N. Life Cycle Analysis for the Production of Urea through Syngas. IOP Conf. Ser. Earth Environ. Sci. 2021, 795, 012031. [Google Scholar] [CrossRef]
- Galusnyak, S.C.; Petrescu, L.; Sandu, V.C.; Cormos, C.C. Environmental impact assessment of green ammonia coupled with urea and ammonium nitrate production. J. Environ. Manag. 2023, 343, 118215. [Google Scholar] [CrossRef]
- Wu, H.; MacDonald, G.K.; Galloway, J.N.; Zhang, L.; Gao, L.; Yang, L.; Yang, J.; Li, X.; Li, H.; Yang, T. The influence of crop and chemical fertilizer combinations on greenhouse gas emissions: A partial life-cycle assessment of fertilizer production and use in China. Resour. Conserv. Recycl. 2021, 168, 105303. [Google Scholar] [CrossRef]
- Petrescu, L.; Cormos, C.M. Classical and Process Intensification Methods for Acetic Acid Concentration: Technical and Environmental Assessment. Energies 2022, 15, 8119. [Google Scholar] [CrossRef]
- Lyu, Y.; Yan, K.; Tian, J.; Chen, L. High cost of waste treatment calls for systematic rethinking: A case study for a chemical industrial park in China. J. Ind. Ecol. 2023, 27, 362–375. [Google Scholar] [CrossRef]
- Liu, K.; Wang, X.; Yan, Y. Network Analysis of Industrial Symbiosis in Chemical Industrial Parks: A Case Study of Nanjing Jiangbei New Materials High-Tech Park. Sustainability 2023, 14, 1381. [Google Scholar] [CrossRef]
- Tsvetkova, A.; Gustafsson, M. Business models for industrial ecosystems: A modular approach. J. Clean. Prod. 2012, 29–30, 246–254. [Google Scholar] [CrossRef]
- Burström, T.; Parida, V.; Lahti, T.; Wincent, J. AI-enabled business-model innovation and transformation in industrial ecosystems: A framework, model and outline for further research. J. Bus. Res. 2021, 127, 85–95. [Google Scholar] [CrossRef]
- Fan, J.; Hu, S.; Chen, D.; Zhou, Y. Study the construction and optimization of a resource-based industrial ecosystem. Resour. Conserv. Recycl. 2017, 119, 97–108. [Google Scholar] [CrossRef]
- Chen, S.; Liu, J.; Zhang, Q.; Teng, F.; McLellan, B.C. A critical review on deployment planning and risk analysis of carbon capture, utilization, and storage (CCUS) toward carbon neutrality. Renew. Sustain. Energy Rev. 2022, 167, 112537. [Google Scholar] [CrossRef]


| Component | Mass Flow Rate | Unit | Concentration (%) v/v |
|---|---|---|---|
| CO | 2.00 | mg/h | 0.00 |
| CO2 | 76.4 | g/h | 98.0 |
| CH4 | 1.45 | g/h | 1.90 |
| N2O | 1.00 | mg/h | 0.01 |
| Flue gas | 77.8 | g/h | 100 |
| Streams | Composition (% m/m) | ||||
|---|---|---|---|---|---|
| CH4 | CO2 | CH3COOH | H2 | H2O | |
| C2 stream | 21.0 | 66.3 | 0.29 | 12.3 | 0.17 |
| CO2 PSA 2 | 1.89 | 98.1 | 0.00 | 0.00 | 0.00 |
| C4 stream | 51.1 | 16.2 | 0.75 | 31.5 | 0.43 |
| C3 stream | 8.27 | 91.4 | 0.06 | 0.00 | 0.23 |
| CO2 PSA 3 | 1.89 | 98.1 | 0.00 | 0.00 | 0.00 |
| C5 stream | 42.6 | 55.5 | 0.42 | 0.00 | 1.47 |
| Scenarios | S3 | S4 | S5 |
|---|---|---|---|
| Allocation criteria | Mass flow | CO2 content | Energy Content |
| (relative values, %) | |||
| CO2 PSA 2 | 61.1 | 90.5 | 0.00 |
| C4 | 38.9 | 9.50 | 100 |
| Component | Mass Flow Rate (kg/h) | Composition (% w/w) |
|---|---|---|
| CO2 | 4954 | 28.3 |
| H2O | 12,549 | 71.7 |
| Scenario | Description |
|---|---|
| Baseline | Conventional ethanol + urea + acetic acid route with no integration |
| S1 | No allocation. C4 is considered an emission to air |
| S2 | Hypothetical scenario, without allocation, but with by-product recognition |
| S3 | Mass Allocation in the C4 stream |
| S4 | Allocation by CO2 content in the C4 stream |
| S5 | Energy Allocation in the C4 stream |
| S6 | No allocation. C4 is burned in flare before being emitted (variation of S1) |
| Environmental Performance (/RF) | ||||
|---|---|---|---|---|
| Route | Impact Category | |||
| GWP | GWP Relativized to BS | PED | PED Relativized to BS | |
| (t. CO2eq) | (%) | (TJ) | (%) | |
| BS | 71.1 | 100% | 4.54 | 100% |
| S1 | 118 | 166% | 2.47 | 54% |
| S2 | 68.1 | 96% | 2.47 | 54% |
| S3 | 50.1 | 70% | 1.96 | 43% |
| S4 | 61.8 | 87% | 2.29 | 50% |
| S5 | 39.5 | 56% | 1.67 | 37% |
| S6 | 73.0 | 103% | 2.47 | 54% |
| References | Ethanol Manufacturing | |
|---|---|---|
| GWP (t CO2eq/t) | GWP (t CO2eq/35.6 t Ethanol) | |
| (Muñoz et al., 2014) [53] | 1.60 | 56.9 |
| (Cavalett et al., 2013) [54] | 0.60 | 21.3 |
| (Caldeira-Pires et al., 2018) [55] | 1.63 | 57.8 |
| (Tsiropoulos et al., 2014) [56] | 0.60 | 21.4 |
| References | Urea Manufacturing | |
| GWP (t CO2eq/t) | GWP (t CO2eq/35.6 t Ethanol) | |
| (Shirmohammadi et al., 2023) [57] | 1.54 | 25.9 |
| (Kumar et al., 2021) [58] | 0.71 | 12.0 |
| (Galusnyak et al., 2023) [59] | 0.68 | 11.4 |
| (Wu et al., 2021) [60] | 5.60 | 94.1 |
| References | Acetic Acid Manufacturing | |
| GWP (t CO2eq/t) | GWP (t CO2eq/35.6 t Ethanol) | |
| (Budsberg et al., 2020) [34] | 1.00 | 25.1 |
| (Petrescu and Cormos, 2022) [61] | 4.41 | 111 |
Disclaimer/Publisher’s Note: The statements, opinions and data contained in all publications are solely those of the individual author(s) and contributor(s) and not of MDPI and/or the editor(s). MDPI and/or the editor(s) disclaim responsibility for any injury to people or property resulting from any ideas, methods, instructions or products referred to in the content. |
© 2023 by the authors. Licensee MDPI, Basel, Switzerland. This article is an open access article distributed under the terms and conditions of the Creative Commons Attribution (CC BY) license (https://creativecommons.org/licenses/by/4.0/).
Share and Cite
Miranda, D.d.S.; Martins, L.P.; Teles, B.A.d.S.; Cunha, I.L.C.; Menezes, N.d.A.; Sakamoto, H.; Kulay, L. Alternative Integrated Ethanol, Urea, and Acetic Acid Processing Routes Employing CCU: A Prospective Study through a Life Cycle Perspective. Sustainability 2023, 15, 15937. https://doi.org/10.3390/su152215937
Miranda DdS, Martins LP, Teles BAdS, Cunha ILC, Menezes NdA, Sakamoto H, Kulay L. Alternative Integrated Ethanol, Urea, and Acetic Acid Processing Routes Employing CCU: A Prospective Study through a Life Cycle Perspective. Sustainability. 2023; 15(22):15937. https://doi.org/10.3390/su152215937
Chicago/Turabian StyleMiranda, Denis da Silva, Luise Prado Martins, Beatriz Arioli de Sá Teles, Isadora L. C. Cunha, Natália de Almeida Menezes, Hugo Sakamoto, and Luiz Kulay. 2023. "Alternative Integrated Ethanol, Urea, and Acetic Acid Processing Routes Employing CCU: A Prospective Study through a Life Cycle Perspective" Sustainability 15, no. 22: 15937. https://doi.org/10.3390/su152215937