Article

Healthcare Sustainability: Hospitalization Rate Forecasting with Transfer Learning and Location-Aware News Analysis

Stevens Institute of Technology, Hoboken, NJ 07030, USA
*
Author to whom correspondence should be addressed.
Sustainability 2023, 15(22), 15840; https://doi.org/10.3390/su152215840
Submission received: 2 May 2023 / Revised: 28 September 2023 / Accepted: 16 October 2023 / Published: 10 November 2023
(This article belongs to the Special Issue Navigating the Evolving Sustainability Landscape in Healthcare)

Abstract

:
Monitoring and forecasting hospitalization rates are of essential significance to public health systems in understanding and managing overall healthcare deliveries and strategizing long-term sustainability. Early-stage prediction of hospitalization rates is crucial to meet the medical needs of numerous patients during emerging epidemic diseases such as COVID-19. Nevertheless, this is a challenging task due to insufficient data and experience. In addition, relevant existing work neglects or fails to exploit the extensive contribution of external factors such as news, policies, and geolocations. In this paper, we demonstrate the significant relationship between hospitalization rates and COVID-19 infection cases. We then adapt a transfer learning architecture with dynamic location-aware sentiment and semantic analysis (TLSS) to a new application scenario: hospitalization rate prediction during COVID-19. This architecture learns and transfers general transmission patterns of existing epidemic diseases to predict hospitalization rates during COVID-19. We combine the learned knowledge with time series features and news sentiment and semantic features in a dynamic propagation process. We conduct extensive experiments to compare the proposed approach with several state-of-the-art machine learning methods with different lead times of ground truth. Our results show that TLSS exhibits outstanding predictive performance for hospitalization rates. Thus, it provides advanced artificial intelligence (AI) techniques for supporting decision-making in healthcare sustainability.

1. Introduction

Healthcare systems strive to tackle severe pressure and sustainability challenges due to changing priorities in widespread pandemics, such as COVID-19 [1,2,3]. In 2019, the Coronavirus (COVID-19) outbreak in Wuhan, China, rapidly spread to over 228 countries [4,5,6]. This emerging infectious disease has become a pandemic with alarming scales in a short period. In January 2020, it was declared as a public health emergency of international concern by WHO [7]. The Centers for Disease Control and Prevention (CDC) announced that more than 98 million confirmed cases and more than 1 million deaths have been recorded in the United States [8]. This public health issue has forced the world to reconsider the existing sustainable strategy in healthcare, especially for responding to crises rapidly when a new pandemic breaks out [9]. Despite the intense growth of research in COVID-19 and the current situation of various requests for healthcare services, relatively little progress has been made to improve healthcare sustainability [10]. Healthcare sustainability refers to the ability of healthcare systems to meet present and future healthcare needs while simultaneously considering social, economic, and environmental factors [11]. It involves the provision of high-quality healthcare services, efficient resource allocation, and the promotion of positive health outcomes [12,13,14]. The current context requires effective and accurate AI technical support on big data analysis to derive meaningful information for decision-making to achieve the above purposes [15].
Early monitoring and forecasting of hospitalization rates provide valuable opportunities for health organizations and public authorities to adjust sustainability strategies. We aim to design an analytic framework using machine learning methods to accurately and effectively predict hospitalization rates during emerging pandemics (e.g., COVID-19). Existing research on healthcare analytics and forecasting has made great progress in various aspects. Mathematical methods, such as stochastic processes, Markov decision processes, and compartmental models, show great success in the theoretical analysis of macroscopic regularities of epidemic transmission, like the epidemic threshold and epidemic infection scale [16]. Yet, the homogeneous assumption of data and minor groups of variables are insufficient to acquire the variety of factors related to epidemic transmission processes [17]. Other statistical models such as autoregressive (AR), autoregressive moving average (ARMA), and seasonal auto-regressive integrated moving average with exogenous factors (SARIMAX) are convenient and straightforward for obtaining exact results in short-term time series analysis [18,19,20]. Nevertheless, their performance decreases with relatively long-term forecasting because of the evolution of COVID-19 and the impact of multiple complex factors over time. Although deep learning approaches, such as deep neural networks (DNN), recurrent neural networks (RNN), and temporal fusion transformers (TFT), are burgeoning methods to learn temporal patterns from different perspectives [21], these models must include or should be expanded to include social factors to predict healthcare performance indicators.
In general, several grand challenges lie in hospitalization rate forecasting, especially with sparse data and deficient historical experience. First, most existing mathematical and statistical methods are isolated and cannot exploit the previous experience from existing diseases in the relevant forecasting problems of an emerging disease. For instance, they fail to transfer and utilize the learned knowledge of existing diseases (e.g., flu) to predict hospitalization rates during new epidemics (e.g., COVID-19). Second, most studies cannot directly and accurately capture the temporal dependencies of cultural/social factors during an emerging epidemic, such as the growing hospitalizations rates caused by large-scale epidemic outbreaks after holidays and festivals in November and December 2021. Third, existing research in healthcare sustainability ignores the prime importance of forecasting techniques for a long-term development strategy. Accurate and effective analysis results can provide reliable and intelligent decisions to benefit health system management.
In this paper, we propose a novel analytical framework from the perspective of data science to provide more accurate monitoring and forecasting results for hospitalization. Given the delay in data monitoring and collection, we initially tackle the issue of hospitalization rate forecasting based on CDC track data of 50 US states with a lead time from 1 to 14 days. (Lead time is the time-span that the model forecasts in advance. For instance, if the input is X T and lead time = 14, the expected output is X T + 14 , where T is the window size.) Some studies indicate similar evolving patterns within the existing contagious diseases and new emerging diseases [22]. It is intuitive to conduct research in the initial phase of pandemics, based on the critical information and clues hidden in epidemic emergence and persistence mechanisms [23]. In this work, we aim to exploit the experience of existing infectious diseases, such as influenza (flu), to forecast hospitalization rates during an emerging pandemic, such as COVID-19. Due to data scarcity, learning and transferring knowledge directly from historical hospitalization data of existing diseases (e.g., flu) is hard. We use non-linear correlation tests to demonstrate the significant relationship between infection cases and hospitalization rates [24]. Based on discovered significant correlations, we apply a Heterogeneous Transfer Learning (HTL) approach to learn common characteristics from rich infection case data of flu, and transfer the learned knowledge to predict hospitalization rates during COVID-19. Several prior studies have demonstrated the association of social factors with healthcare problems, such as the mediating impact of human awareness and behavior change [25,26]. Despite the potentially valuable information in text data, it is under-utilized in time series prediction. In our work, we analyze the effect of social factors on hospitalization rates during COVID-19 from two aspects: sentiment and semantic features of COVID-19 related news articles. Specifically, we address three motivating questions: (1) Will public sentiments and attitudes (e.g., pessimistic or optimistic) affect hospitalization rates? (2) Will public policies (e.g., lockdown and quarantine) affect hospitalization rates? (3) Will the news information from different locations affect local health situations (e.g., COVID-19 rates and hospitalization rates)?
This paper proposes an analytical framework using machine learning techniques to provide AI technical support for healthcare sustainability. We formulate the problem as predicting hospitalization rates during emerging epidemics (e.g., COVID-19) using limited historical time series data and epidemic-related news articles. Our key contributions can be summarized as follows: (1) We apply the transfer learning architecture with dynamic location-aware sentiment and semantic analysis (TLSS) [27], which is initially designed for emerging epidemic forecasting. We extend TLSS into a new application scenario: hospitalization rate prediction during the outbreak of an emerging pandemic. (2) We leverage non-linear correlation tests to demonstrate the significant correlation between COVID-19 infection cases and hospitalization rates. Therefore, we realize utilizing the rich infection data of existing diseases for hospitalization rate forecasting during an emerging disease outbreak. (3) We use sentiment and semantic analysis methods to extract relevant features from news articles. We apply multimodal data learning within TLSS to learn the impact of news sentiment and semantic information on hospitalization to interpret non-traditional variation patterns. (4) We then concatenate the learned information from the infection records of existing disease (e.g., flu), COVID-19 news semantic/sentiment features, and temporal dependencies in local time series data to forecast hospitalization rates during COVID-19 in a dynamic propagation process. (5) We conduct state- and country-level experiments on real-world hospitalization data during COVID-19 with different time settings. We evaluate the performance of various state-of-the-art methods with exogenous variables to demonstrate the efficacy and flexibility of TLSS in different application scenarios (e.g., hospitalization rate forecasting).
Overall, our research provides valuable statistical evidence and support that can enhance the sustainability of healthcare systems. We have developed and optimized an early-stage forecasting method for hospitalization rates during emerging epidemics, which can help predict the expected volume of patients in advance. By knowing the future possible hospitalizations in advance, health systems can manage costs accordingly, primarily to keep health costs under control and sustainable over the long term during pandemics. Furthermore, our method offers healthcare providers the opportunity to anticipate future demand, adjust medical resource allocation and staffing levels, and prevent hospitals from becoming overburdened. By forecasting hospitalization rates, our proposed method also helps public health institutions in enhancing patient care planning and coordination, improving service quality, and achieving overall healthcare sustainability.

2. Related Work

2.1. Sustainable Development in Healthcare

Sustainability is a widely controversial subject that is hard to define and apply to real tasks, especially in the complex scenario of the healthcare perspective [28]. Some studies stress that environmental, social, and economic development in healthcare institutes are the essential factors to realize sustainability over long-term development [29,30]. A sustainable strategy should focus on optimizing resource utilization, delivering high-quality healthcare service, and managing clinical system and financial aspects [31,32]. However, the application of theories into practical scenarios in a structured manner requires additional efforts to ensure the provision of professional support. Thus, despite the increasing interest in the sustainability of healthcare, COVID-19 demonstrates it is still a continuing challenge to improve healthcare services and optimize medical systems in terms of accessibility and outcomes [33].
Lennox et al. [11] followed Preferred Reporting Items for Systematic Reviews and Meta-Analysis guidelines to provide a systematic review of sustainability methods in healthcare. It provides enlightening insights and suggests exploring this topic to improve valuable resource allocation and patient outcomes. Capolongo et al. [34] constructed an innovative assessment system to provide a strategy for realizing sustainability. It indicates when involving medical facilities and resources, sustainability should be capable of delivering high quality and high efficiency in changing circumstances. Brambilla et al. [35] tested a multicriteria assessment tool and systematically analyzed the quality of operating hospitals in Germany, considering social, environmental, and organizational aspects. They assessed and analyzed the sustainability of existing operative health systems, but did not provide a specific improvement scheme to address the weakness shown in the assessment. Lennox et al. [10] explored how identified sustainability factors act on the improvement projects. They designed a sustainability work Long Term Success Tool to improve initiatives and investigated its critical features in real-world healthcare applications. However, they do not provide quantitative analysis to evaluate the improvement.
In general, most existing research emphasizes the significance of healthcare sustainability and provides valuable insights into this subject. However, there is a lack of extensive research that focuses on its practical implementation, especially in terms of utilizing AI technical support and employing robust quantitative analysis for health system optimization in sustainable development.

2.2. Time Series Forecasting in Healthcare

In healthcare analysis, many approaches focus on understanding epidemic spread patterns and forecasting hospital admissions [36,37,38]. Time series regression is one of the main attempts of the problem formulation to model and simulate hospitalization rates. Several statistical data-driven approaches are designed and widely used for time series forecasting [39], such as AR, ARMA, and SARIMAX [40,41,42]. Perone [20] applied several time series forecasting methods to predict the second wave of COVID-19 hospital admissions in Italy, including ARIMA, innovations state space models for exponential smoothing, neural network autoregression model, and all of their feasible hybrid combinations. Hybrid models achieve outstanding performance in short-term prediction, which can facilitate the decision-making of public health authorities. Cheng et al. [19] implemented the SARIMAX model to predict emergency department occupancy and demonstrated outstanding forecasting performance in real-time tasks. The latest advance in deep learning technologies demonstrated excellent learning capacity in time series analysis and provided innovative paradigms to capture temporal dependencies from complex data [43,44,45]. Cheng et al. [46] proposed a novel bidirectional long short-term memory model to predict medical visits. The model performance was significantly improved by adopting the attention mechanism and time adjustment factors to learn the hidden states. Kaushik et al. [47] designed an ensemble model to predict patients’ weekly spending on two pain medications at an average level. Despite these methods’ impressive performance, their limitations are apparent, such as the unsatisfactory prediction for a more considerable lead time. Moreover, they do not consider the impact of exogenous factors, such as environment, geolocation, and social aspects.

2.3. Social Factor Impact on Healthcare

With the development of natural language processing (NLP), the information can be extracted more accurately and effectively from unstructured textual data [48,49]. Textual data such as tweets, surveys, and news become practicable auxiliary features in healthcare forecasting and analysis [50,51,52]. This observation inspired extensive experiments to utilize relevant features from textual documents in different ways and leverage them for analyzing real-world tasks [53]. Sentiment analysis approaches, such as latent dirichlet allocation (LDA) [54], BERT-based sentiment classifier (BERTsent) [55], VADER [56], and semantic analysis approaches, such as Doc2vec [57], global vectors for word representation (GloVe) [58], bidirectional encoder representations from transformers (BERT) [59], and sentence embeddings using siamese BERT-network (Sentence-BERT) [60] are crucial and widely used in various healthcare-related tasks [61,62]. For more details about VADER and Sentence-BERT, see Section 3.2.2.
To explore the application of sentiment analysis in healthcare and extract the significant finding from the literature, Alamoodi et al. [63], Gohil et al. [64] conducted a comprehensive review for the existing work of textual data analysis. They provide precious inspiration and a meaningful context for future work in sentiment analysis within the healthcare domain. Some studies applied the National Research Council Canada (NRC) Word-Emotion Lexicon for sentiment analysis on textual datasets (e.g., news articles and tweets) to explore insight into the communication patterns and public sentiments during COVID-19 [65,66]. Mourad et al. [67] adopted a lexicon-based data analytics methodology for analyzing social network users and content by utilizing NLP techniques. They provided valuable insights by discussing computing and non-computing implications for prospective solutions and social network management strategies during crisis periods. Mahdikhani [68] designed novel frameworks to detect public situations during different stages of the pandemic using text embedding methods. Their experiments demonstrated the influence of public situations on the retweetability of posted tweets during COVID-19. Zeng et al. [69] proposed an ensemble learning method to classify eligibility text criteria, which can choose suitable candidates for clinical trials based on their records. Gourisaria et al. [70] analyzed Twitter users’ psychological reactions and discourse regarding COVID-19 using data-mining methodologies such as semantic analysis and topic modeling. They provide valuable insights about selecting the most suitable methods for different healthcare tasks. Despite existing work demonstrating the impact of textual resources, it is possible to improve the application of sentiment and semantic data for healthcare forecasting. In addition, most studies fail to capture temporal dependencies from complex text data precisely.

3. Materials and Methods

3.1. Problem Formulation

In this paper, we explore the association of hospitalization rates with the following factors: infection cases, geolocation, and news articles. We then apply and optimize a machine learning method for hospitalization rate forecasting.
To exploit the learned knowledge from infection case data in hospitalization rate forecasting, we apply non-linear correlation tests to demonstrate the significant relationship between hospitalization rates and infection cases. We then introduce a model TLSS with three modules: transfer learning, multimodal data learning, and prediction. In the transfer learning module of TLSS, we learn the general characteristics of existing infectious diseases (e.g., flu) from a source model Cola-GNN and transfer the knowledge to the target model for fine-tuning in hospitalization rate prediction during a new pandemic (e.g., COVID-19). In the multimodal data learning module, we collect temporal dependencies of hospitalization rates and encode news sentiment and semantic features in a dynamic propagation process. The prediction module is to concatenate the transfer learning knowledge, temporal dependencies, and sentiment and semantic features for future hospitalization rate forecasting.
Given current time k, we aim to forecast the future hospitalization rate at time k + h using time series data of past time window [ k T : k ] , where h is the lead time of the prediction and T is the historical window size (lag). We have daily historical data of hospitalization rates Y R N × T , where N is the number of locations. We also have daily data of exogenous variables: COVID-19 infection cases X R N × T , pre-trained news sentiment feature V R N × T and semantic feature S R N × T × 50 . The sentiment feature V R N × T and semantic feature S R N × T × 50 are extracted from the pre-trained news data, where V i , t R and S i , t R 1 × 50 are the average emotion score and semantic vector of day t’s news for location i (see Table 1 for major notations and descriptions).

3.2. Methodological Approach

This section introduces our experiments’ main methods, algorithms, and evaluation metrics. We apply them in model performance improvement and comparison of forecasting of hospitalization rates during COVID-19, which provide potentially valuable AI technical support in healthcare sustainability.

3.2.1. Non-Linear Correlation Test

Non-linear correlation tests are used to measure the non-constant ratio of variations between two given variables changes. By exploring the potential non-linear relationships between variables, we determine whether to employ more sophisticated approaches for data analysis instead of using linear models directly. In this work, we apply White, Granger causality, and Brownian distance correlation tests to explore the relationship between hospitalization rates and infection cases during COVID-19 at the country and state levels, respectively.
  • White Test
    White test [71,72] is based on a neural network for neglected non-linearity, which uses hidden layers to detect the relationship between time series vectors. The network is defined as
    Y k = x θ + j = 1 q β j ϕ ( x α j ) ,
    where x θ is a linear component, j = 1 q β j ϕ ( x α j ) includes nonlinear components, θ is a parameter vector, β j is the weight of the neural network model from the hidden layer to the output layer, α j is the weight of the neural network model from the input layer to the hidden layer, ϕ is the activation function, q is the number of hidden layers, and j is the index of hidden layers. Given historical COVID-19 cases data x = X [ k T , k ] and hospitalization rate data Y k , we test non-linearity between them, where k is the current time stamp and T is the historical window size. The null hypothesis can be defined as
    H 0 : β 1 = = β q = 0 o r H 0 : α 1 = = α q = 0 .
    There is a nonlinear correlation between COVID-19 infection cases and hospitalization rates if we reject the null hypothesis according to the chi-square and F distribution.
  • Granger Causality Test
    Granger causality is a statistical hypothesis test that evaluates the causal relationship between multiple time series. It is widely used in economics, financial econometrics, and business [73,74]. Given the time series variables X and Y, X [ k T : k ] Granger causes Y k when X [ k T : k ] happens prior to its effect, and X [ k T : k ] has unique information about the prediction of the future value Y k , where k is the current time stamp and T is the historical window size. The Granger causality is typically calculated with the following bivariate linear autoregressive model:
    Y k = T = 1 L α T Y [ k T : k ] + ϵ 1 ,
    Y k = T = 1 L α T Y [ k T : k ] + T = 1 L β T X [ k T : k ] + ϵ 1 ,
    where L is the largest historical window size (lag value), the residual ϵ 1 N ( 0 , σ ) is a white noise series and X [ k T : k ] Granger causes Y k if the null hypothesis H 0 : β T = 0 is rejected according to the F-test.
  • Brownian Distance Correlation
    Székely and Rizzo [75] proposed Brownian distance correlation and distance covariance to measure the nonlinear dependence and test the joint independence of random vectors in multiple dimensions. Given the random variables X and Y, the distance covariance v ( X , Y ) measures the distance between f X f Y and f X , Y :
    v 2 ( X , Y ) = | | f X , Y ( t , s ) f X ( t ) f Y ( s ) | | 2 ,
    where | | . | | is the L 2 norm, t and s are vectors, f X and f Y are the characteristic functions of X and Y, and f X , Y is their joint characteristic function. In an empirical version, v ( X , Y ) is designed to test the independence hypothesis:
    H 0 : f X , Y = f X , f Y v s H A : f X , Y f X , f Y .
    The distance correlation R ( X , Y ) is defined as
    R 2 v 2 ( X , Y ) v 2 ( X ) v 2 ( Y ) v 2 ( X ) v 2 ( Y ) > 0 0 v 2 ( X ) v 2 ( Y ) = 0
    where v 2 = | | f X , X ( t , s ) f X ( t ) f X ( s ) | | 2 . In this paper, we aim to use the Brownian distance correlation R ( X [ k T : k ] , Y k ) for testing the non-linear dependence of hospitalization rates Y k in the current time k on the COVID-19 infection cases X [ k T : k ] with window size T. If R ( X [ k T : k ] , Y k ) 0 and T > 0 , there is a correlation between X [ k T : k ] and Y k .

3.2.2. Sentiment and Semantic Analysis

In this paper, we apply VADER and SBERT to extract the sentiment and semantic features from COVID-19-related news articles at the country level and state level, respectively.
  • Valence Aware Dictionary for sEntiment Reasoning (VADER)
    VADER [56] is a text analysis method that can be used to measure the word vector’s emotions, sentiments, and attitudes. It is an unsupervised analysis that can leverage the sentiment lexicon to annotate the emotion polarity score for each word of unlabeled data. The range of polarities is [−1, 1], where 1 indicates an extremely positive attitude, 0 indicates a neutral attitude, and −1 indicates an extremely negative attitude. VADER is able to aggregate the polarity scores from individual words in a sentence to represent overall sentence sentiment. Each sentence produces a vector of sentiment scores with negative, neutral, positive, and compound polarities. The compound polarity represents an aggregate measure of all the other sentiments.
  • Sentence-BERT (SBERT)
    BERT [59] is a transformer-based machine learning technique for natural language processing. SBERT [60] is a derivation of the pre-trained BERT network that leverages siamese and triplet network structures to generate semantic embeddings that can be compared using cosine similarity. Given sentences A and B with varying lengths, SBERT creates fixed-size embeddings u and v using BERT and a pooling layer. These pairs of sentences are identical down to every parameter.

3.2.3. TLSS: Transfer Learning Architecture with Dynamic Location-Aware Sentiment and Semantic Analysis

TLSS is a neural transfer learning architecture for learning and transferring general characteristics from existing epidemic diseases to predict a new pandemic. It also learns the impact of exogenous variables geolocation and news articles on epidemic transmission. In this work, we extend this algorithm into a new application scenario to predict the hospitalization rates during COVID-19, based on the demonstrated relationship between hospitalization rates and infection cases using nonlinear correlation tests. TLSS has the following modules:
  • Heterogeneous Transfer Learning (HTL)
    HTL [76] focuses on transferring knowledge from the source domain to a different but related target domain, in which data are heterogeneous in both feature and label spaces (see Appendix A). The HTL module of TLSS aims to learn the general patterns of existing epidemics (e.g., flu) and transfer the learned knowledge to forecast the hospitalization rates during the new pandemic (e.g., COVID-19). The base model is a cross-location attention-based graph neural network (Cola-GNN) [77], which is designed to combine the temporal dependencies and geolocation correlation for predicting long-term influenza-like illnesses (ILI). We pre-train the source model and share part of the parameters with the target model as initializations: W G W G . Then, we fine-tune the target model TLSS on hospitalization rate data during COVID-19 and collect its hidden states. This transformation is defined as G i , k G i , k , where i is the index for a location and k is the index for a time stamp. Following the above process, we project the learned representation from the heterogeneous transfer learning module into the prediction module and combine it with news sentiment and semantic features for final predictions.
  • Multimodal Data Learning
    The multimodal data learning module captures the temporal dependencies of hospitalization rates and encodes sentiment and semantic features over time. It contains a dynamic location-aware analysis for sentiment and semantic features, which dynamically model the public emotions and opinions in different locations during COVID-19 from news data. Given pre-trained news sentiment data V R N × T and semantic data S R N × T × 50 , where V i , t R and S i , t R 1 × 50 are the embeddings to represent the average emotion score and semantic feature of day t’s news for location i, the module processes thw data as the following steps:
    (1)
    For each timestamp k, calculate the cosine similarity for news sentiment data ( C k v ) and news semantic data ( C k s ) with window size T between every two locations i and j:
    C k v [ i , j ] = V i , [ k T : k ] · V j , [ k T : k ] | | V i , [ k T : k ] | | · | | V j , [ k T : k ] | | ,
    C k s [ i , j ] = c o n c a t ( S i , [ k T : k ] ) · c o n c a t ( S j , [ k T : k ] ) | | c o n c a t ( S i , [ k T : k ] ) | | · | | c o n c a t ( S j , [ k T : k ] ) | | ,
    where V i , [ k T : k ] R T and S i , [ k T : k ] R T × 50 represent the sentiment and semantic embeddings of location i, respectively, for the time-span [ k T : k ] . The concat is a concatenation function for reshaping the semantic embedding dimension into R T × 50 .
    (2)
    Implement the location-aware attention mechanism to create an attention coefficient matrix A, for measuring the sentiment/semantic dependencies between every two locations i and j, where the coefficient a i , j in A is defined as
    a i , j = u T g ( W s h i + W t h j + b s ) + b u ,
    where h i and h j are the last hidden state h k of an RNN model for location i and location j, W s , W t R d a × D , u R d a , b s R d a , and b u R are trainable parameters.
    (3)
    Adopt an element gate to combine the sentiment/semantic cosine similarity matrix C k v / C k s and attention coefficient matrix A:
    A ^ k v = σ ( W m A + b m 1 N 1 N ) C k v + ( 1 N 1 N ) A ,
    A ^ k s = σ ( W m A + b m 1 N 1 N ) C k s + ( 1 N 1 N ) A ,
    where W m R N × N and b m R are trainable parameters.
    (4)
    Apply linear transformation to the location-aware attention matrix of sentiment A ^ k v and semantics A ^ k s :
    L k v = W v A ^ k v + b v ,
    L k s = W s A ^ k s + b s ,
    where L k v R N × D and L k s R N × D are dynamic matrices of sentiment and semantic features that change over different time stamps, and W and b are the trainable parameters for each equation.
  • Prediction
    TLSS also learns RNN hidden states from historical hospitalization rates with window size T. The prediction module combines the embedding of news sentiment feature ( L i , k v R D ), the embedding of news semantic feature ( L i , k s R D ), the hidden states ( h i , k R D ) from the RNN model, and the hidden states learned from Cola-GNN ( G i , k R F ) in the latent space.
    y ^ i , k = ϕ ( θ [ h i , k ; L i , k v ; L i , k s ; G i , k ] + b θ ) ,
    where ϕ is the activation function, θ R D + D + D + F and b θ are trainable parameters. D is the dimension of RNN hidden states and sentiment/semantic embeddings, and F is the dimension of the hidden states from the transferred knowledge of the source model.

3.2.4. Evaluation Metrics

We evaluate our models using the root mean squared error (RMSE) and the Diebold–Mariano (DM) Test.
  • DM-test measures the difference between the predicted values from two models ( y ^ 1 , y ^ 2 ) and the corresponding observed values y i :
    D M = ( y ^ 1 , i y i ) 2 ( y ^ 2 , i y i ) 2
  • The Root Mean Squared Error (RMSE) is the standard deviation of the residuals, which measures the difference between the predicted values y i ^ from a model and the corresponding observed values y i :
    R M S E = 1 N i = 1 N ( y i ^ y i ) 2

3.2.5. Comparison Methods

We calculate the RMSE to measure the model performance of TLSS and other state-of-the-art methods and their derivative approaches, such as autoregressive-OLS (AR ), autoregressive-gradient descent (AR), autoregressive moving average-OLS (ARMA ), autoregressive moving average-gradient descent (ARMA), vector autoregressive (VAR), recurrent neural network (RNN), long- and short-term time-series network (LSTNet), and cross-location attention-based graph neural network (Cola-GNN) (see Appendix B for the description and experiment setup of these methods). In the state-level experiment, we specifically use the DM-test to compare the significance level of the improvement achieved by TLSS against other models. In the country-level experiment, we use the t-test to compare the performance of the various models (e.g., AR , ARMA , AR, ARMA, VAR, RNN, and LSTNet) under two conditions: with and without the exogenous variables, such as COVID-19 cases, news sentiment, and news semantic features.

3.3. Data Description

3.3.1. Dataset Description

We used the following datasets from 1 August 2020 to 30 September 2022. Please refer to Table 2 for more data descriptions.
  • Hospitalization rate data are collected from the CDC COVID-19 Reported Patient Impact and Hospital Capacity by State Time Series [78]. It comprises the daily count of newly admitted patients with confirmed COVID-19 (new admission counts) in 50 US states. In the country-level experiment, we aggregate hospitalization rates by location.
  • COVID-19 Cases Data are collected from CDC US-COVID-19-Cases [8]. It comprises the daily count of newly confirmed COVID-19 cases (new patient counts) in 50 US states. In the country-level experiment, we aggregate COVID-19 cases by location.
  • Country-level COVID-19 Original News Data are collected from Refinitiv Real-time News [79], which comprises news articles related to COVID-19 in the United States.
  • State-level COVID-19 Original News Data are collected from the Global Database of Events, Language, and Tone (GDELT) [80], which comprises news articles related to COVID-19 in 50 US states.
  • Pre-trained News Sentiment Data (Country-level and State-level) are the sentiment-related features extracted from each news article. We pre-train the original country-level and state-level news data using VADER.
  • Pre-trained News Semantic Data (Country-level and State-level) are the semantic-related features extracted from each news article. We pre-train the original country-level and state-level news data using SBERT.
We split all data into training, validation, and test sets in chronological order at a ratio of 80%–10%–10%, respectively. We use validation data to avoid overfitting and to determine the number of epochs for training. To measure variables at different scales, we normalize the hospitalization rate data in a range of 0 to 1 based on the training data. We also normalize the COVID-19 cases data and pre-trained semantic data (country-level and state-level) between 0 and 1 based on their overall dataset. Pre-trained news sentiment data (country-level and state-level) are in the range of −1 and 1 to measure the negative and positive emotions.

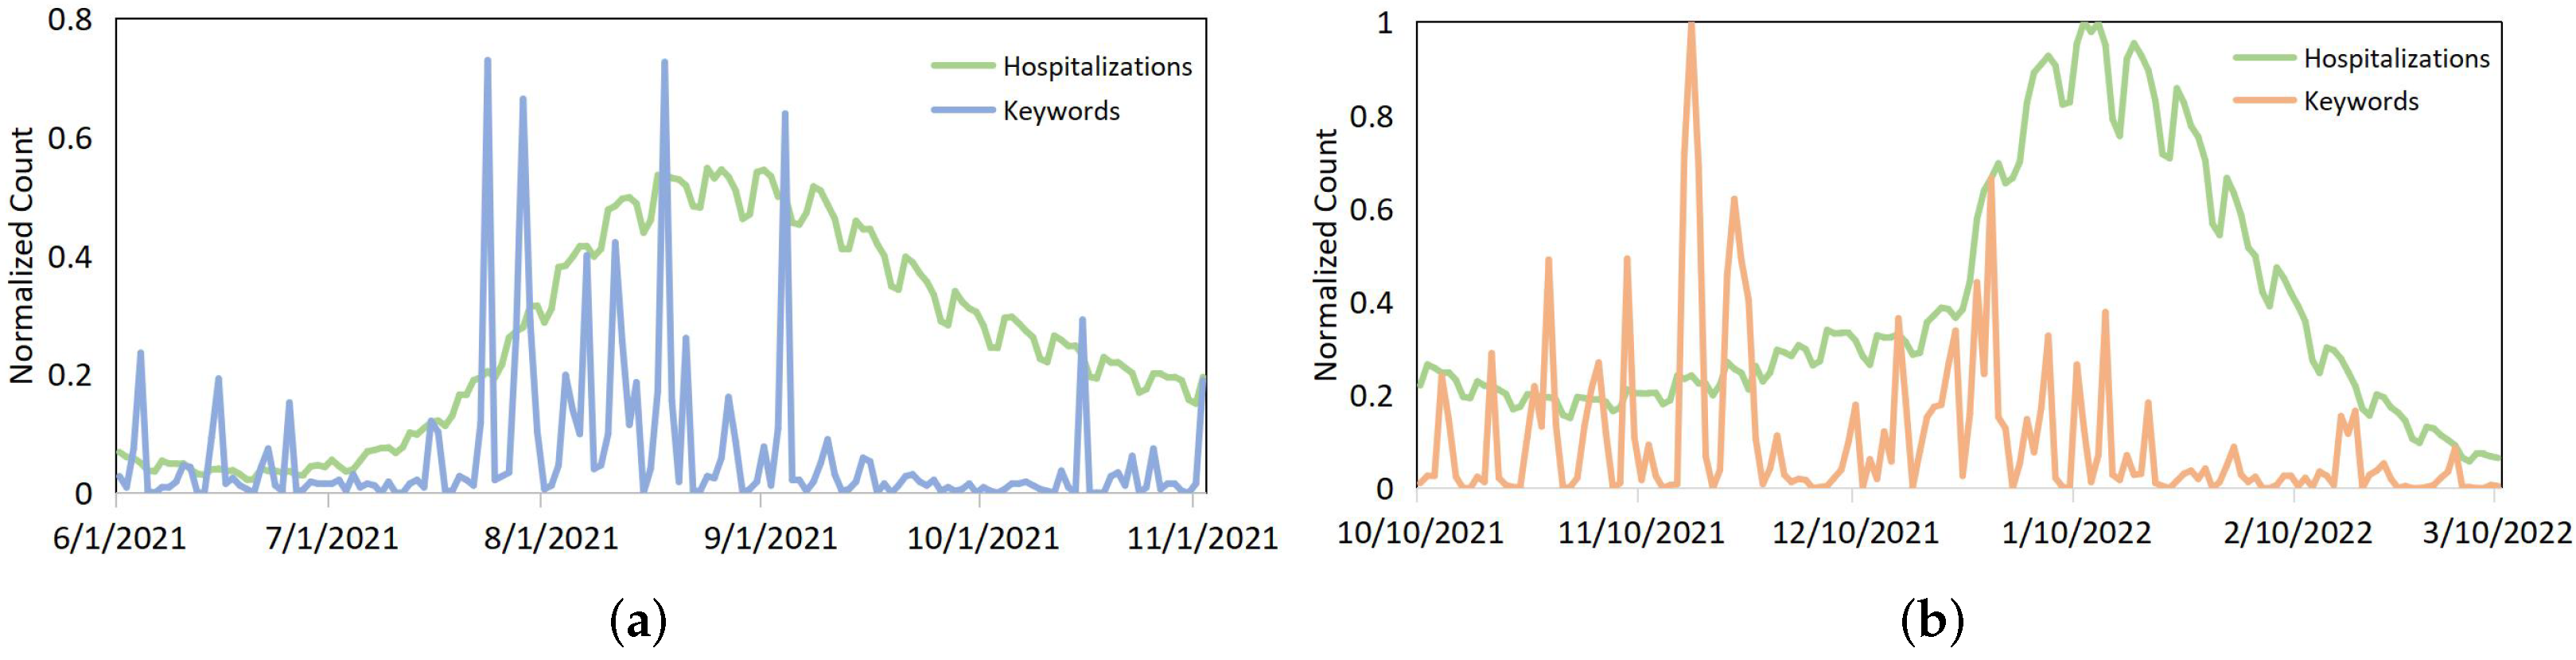
3.3.2. Visual Examples to Describe the Association between Hospitalization Rates and News

Figure 1 shows visual examples to describe the potential valuable relationship between hospitalization rates and news articles, which is the motivation for using news articles as an auxiliary feature in hospitalization rate forecasting. Figure 1a exhibits the extensive coverage of epidemic policies (e.g., mask-wearing) in the news media aimed to control the virus spread, when hospitalization rates continue growing during COVID-19. Notably, the hospitalization rate subsequently decreased following the publicity and implementation of relative prevention policies. It suggests the latent impact of public opinions and policies on hospitalization rates during the COVID-19 outbreaks. Figure 1b shows that holiday-related COVID-19 news was widely reported in November and December 2021, respectively, in the US. Additionally, hospitalization rates grew rapidly after holidays like Thanksgiving and Christmas. It suggests that the social factors (e.g., public sentiments reflected in news articles) may imply informative clues in explaining some unconventional trends of hospitalization rates.

3.4. Experiment Setup

All programs are implemented using Python 3.7 and PyTorch 1.12.1 in Google Colab Pro with premium GPUs (e.g., NVIDIA V100 or A100 Tensor Core GPUs).

3.4.1. Country-Level and State-Level Experiments

We evaluate the experiment results with different time settings (lead time = { 1 , 7 , 14 } ), and historical input window sizes T = { 9 , 15 } . Window size = 9 days is calculated from AR model order selection in Python package s t a t s m o d e l s . t s a . a r _ m o d e l . a r _ s e l e c t _ o r d e r . Window size = 15 days is based on the consideration of the longest incubation period of COVID-19, which is 14 days [81]. For baseline approaches containing an RNN module, the dimension of hidden units is tuned from { 12 , 20 , 32 , 64 } , and the dimension of hidden layers is tuned from { 1 , 2 , 3 } . The batch size is 32, the initial learning rate is selected from the set { 0.001 , 0.005 , 0.01 } . All models are trained using the Adam optimizer [82] with a weight decay of 5 × 10 4 and a dropout rate of 0.2. We set up the training epoch as 1500 and stop early if the validation loss does not decrease in 200 epochs.
We pre-train the source model Cola-GNN with input window size T of { 9 , 15 } , and set lead time values as the same as the target model TLSS (lead time = { 1 , 7 , 14 } ). We set the number of filters as 10, and long-term and short-term dilation rates as 2 and 1 in the multi-scale dilated convolution module of Cola-GNN. For the RNN module, the dimension of hidden units is tuned from { 10 , 20 , 30 } , and the dimension of hidden layers is tuned from { 1 , 2 } . Other hyper-parameters are consistent with other baselines and trained using Adam optimizer. We initialize the parameters of the target model TLSS using the shared parameters of dilated convolution layers from the pre-trained source model.

3.4.2. Pre-Train Sentiment and Semantic Data

We collect COVID-19 related news articles at the country and state levels from Refinitiv Real-time News and GDELT via keyword filtering. The raw data undergo preprocessing, which includes removing punctuations, URLs, and numbers, as well as converting the text to lowercase. We then tokenize the data and feed it into VADER and SBERT models for sentiment and semantic feature extraction.
To generate a sentiment score for each news article, we pre-train the data using an unsupervised sentiment analysis method VADER. VADER calculates a sentiment score for every word, and these scores are aggregated to determine the overall sentiment of an article. For each location, we implement average pooling to the sentiment scores of news articles in a day and obtain a scalar value to represent the average polarity of news at the current time stamp. Country-level sentiment data only have one location (e.g., US), and state-level sentiment data have 50 locations (e.g., 50 US states).
The semantic analysis dynamically models public opinions and policies in different locations during COVID-19 from news data. We use a pre-trained SBERT model p a r a p h r a s e M i n i L M - L 6 - v 2 to generate word-embedding vectors for each news article with a maximum input length of 500 tokens and output size of 768. We then apply Principle Component Analysis (PCA) on the existing model and reduce the output size to 50 dimensions. For each location i, we implement average pooling to the semantic vectors of news articles in day t and obtain a vector S i , t R 1 × 50 to represent the average semantic feature at the current time stamp. Country-level semantic data only have one location (e.g., US), and state-level semantic data have 50 locations (e.g., 50 US states).

3.4.3. Ablation Test

We perform ablation tests in hospitalization rate forecasting to evaluate the contribution of each module in TLSS:
  • TLSS w/o transfer learning: Exclude the transfer learning module in TLSS and conduct training on the hospitalization rate data without utilizing knowledge learned from existing epidemics, such as the flu.
  • TLSS w/o sentiment analysis: Exclude the sentiment analysis module in TLSS and ignore the sentiment information in news data.
  • TLSS w/o semantic analysis: Exclude the semantic analysis module in TLSS and ignore the semantic information in news data.

4. Results

4.1. Non-Linear Correlation Test Result

We implement three non-linear correlation tests (White test, Granger causality test, and Brownian distance correlation test) to detect the association of COVID-19 cases with hospitalization rates at country-level and state-level data, respectively. In a Granger causality test, the input window size (lag) is fifteen days, and the lead time is one day. In Table 3, we observe that the p-values [83] of the White test, Granger causality test, and Brownian distance correlation test are remarkably close to zero. It shows an extremely significant relationship between COVID-19 cases and corresponding hospitalization rates at the country level. Based on their significant correlation, we learn and transfer knowledge from rich epidemic infection data to hospitalization rate forecasting, thus overcoming the challenges of homogeneous data insufficiency, such as sparse historical hospitalization records. It effectively increases the flexibility of heterogeneous transfer learning architecture within TLSS.
Considering the spatial variation, we apply non-linear correlation tests at the state level to explore the relationship between COVID-19 cases and hospitalization rates in 50 US states. We adopt distinct p-value thresholds (e.g., 0.01, 0.05, and 0.1) to indicate the significance levels, such as highly significant, moderately significant, and weakly significant, corresponding to the 99%, 95%, and 90% confidence intervals [84]. In Table 4, we count the number of states that show a significant correlation between COVID-19 cases and hospitalization rates. In the White test, the correlation between COVID-19 cases and hospitalization rates is significant in all 50 states, but the states AK, HI, and KS show relatively weaker significance compared with other locations. In the Granger causality test, the input window size (lag) is fifteen days, and the lead time is one day. The correlation is strongly significant in forty-three states, moderately significant in four states (GA, HI, ID, and WY), weakly significant in two states (ME and NM), and non-significant in the state KS. The distance correlation test also exhibits a significant correlation between COVID-19 cases and hospitalization in all 50 states. Table 5 indicates that the Brownian distance correlation is highly significant in 24 states (i.e., correlation larger than 0.7), moderately significant in 23 states (i.e., correlation larger than 0.5 and less than 0.7), and relatively weak significant in 3 states (AK, HI, and KS) (i.e., correlation less than 0.5). Overall, we demonstrate the significant relationship between COVID-19 cases and hospitalization rates in more than 90% of US states (see Appendix C for detailed state-level experimental results).

4.2. Country-Level Experiment

In Table 6, we compare the RMSE of forecasting models with different exogenous variables at country-level experiments. We train several state-of-the-art models on hospitalization rate data with an input window of fifteen lagged days and a lead time of one day. The significant difference in RMSE values across traditional AR , ARMA , and other models is because of their different estimation methods. Traditional AR and ARMA use ordinary least squares (OLS), while other models use gradient descent to estimate the unknown parameters.
Most methods exhibit relatively good performance in capturing temporal patterns due to the small information gap between the history window and the predicted time. When we only use the historical data of hospitalization rates in time series prediction, RNN achieves the best prediction result. When we add the exogenous variable COVID-19 cases into the model, the forecasting performance improves in most cases. The decreased prediction ability of RNN and lstnet suggests that input complexity affects deep learning model performance in time series forecasting. When we add more exogenous variables, such as news sentiment and semantic features, into the model, most approaches are further optimized. In Table 7, we implement Student’s t-test (t-test) [85] to measure the variance of model performance when adding exogenous variables (e.g., COVID-19 cases, news sentiment feature, and news semantic feature). Although some methods show improved performance on RMSE with exogenous variables, the results are not significant. However, it provides a valuable inspiration to investigate optimization in capturing temporal dependencies of multimodal data, especially for complex text data. Moreover, we will expand our analysis at the state level to consider the impact of geolocation.

4.3. State-Level Experiment

In this section, we evaluate the model performance and explore the contribution of exogenous variables at state-level experiments. We compare the prediction accuracy and significance level of TLSS against other baseline models based on RMSE and DM-test, with an input window of 9 and 15 lagged days and lead times of 1, 7, and 14 days. The large difference in RMSE values across AR , ARMA , and other models is because of their different estimation methods. In Table 8, we observe that the performance of some models improved when adding exogenous variable COVID-19 cases. Most baseline methods have decreasing performance when adding news features. It suggests that the temporal dependencies of complex text data are hard to capture in multiple locations. VAR and lstnet methods are sensitive to input complexity and lead time, which declares the challenges of long-term forecasting with multimodal data. Cola-GNN shows significant improvement in hospitalization rate forecasting, demonstrating the importance of geolocation correlation at the population level. TLSS outperforms most models with a stable and optimal forecasting performance, showing its conspicuous capacity to capture temporal dependencies from complex text data.
When lead time is one day, most methods achieve comparatively good performance in capturing temporal patterns without exogenous variables due to the small information gap between the history window and the predicted time. When lead time is seven days, compared with deep learning methods (RNN, Cola-GNN, and TLSS), statistical models (AR, ARMA, and VAR) have declined performance, especially VAR, due to the largest number of model parameters. It suggests the influence of model complexity on time series forecasting when lead time becomes more extensive, particularly with limited input. When lead time is fourteen days, Cola-GNN exhibits competitive forecasting performance with TLSS because it is originally designed for long-term epidemic prediction. It also indicates that the news impact may wane over time.
We apply DM-test to compare the improvement and accuracy of TLSS against other baselines. In most cases, TLSS presents statistically significant optimization in hospitalization rate prediction with limited data during the COVID-19 pandemic. It demonstrates that efficient information extraction and application from news data will significantly improve the model’s accuracy. News can serve as a useful supplementary feature, especially for prediction with a lead time of less than fourteen days.
Overall, TLSS outperforms all baseline methods in most situations. Directly incorporating exogenous variables, such as COVID-19 cases and news articles, does not automatically improve the performance of most models. It suggests that temporal dependencies are hard to capture accurately in multimodal data. Enhancing the capability of AI technical support in healthcare sustainability remains a persistent challenge.

4.4. Ablation Test

We perform ablation tests in hospitalization rate forecasting to evaluate the performance of each module within TLSS. Table 9 exhibits that TLSS achieves the best performance for forecasting hospitalization rates during COVID-19 with a lead time of 1, 7, and 14 days. Additionally, we observe that TLSS shows significant improvement with transfer learning architecture with a lead time of 7 and 14 days. This is due to its ability to capture the spread patterns of existing diseases and transfer the learned knowledge to the target model for hospitalization rate prediction during the initial phase of an emerging disease outbreak. The higher accuracy of more extensive lead time also shows the possible delay impact of infectious cases on hospital admissions. For example, confirmed COVID-19 cases may be hospitalized after three days when the condition worsens. Models that involve news sentiment and semantic analysis have better results with a lead time of 7 and 14 days due to the latency effect of news opinions and attitudes on epidemic transmission and hospital resources. In hospitalization rate prediction with a one-day lead time, the news sentiment feature has a more significant influence than news semantic information. This finding indicates that public emotion plays a crucial role in epidemic prevention efforts. The ablation test results demonstrate the essentiality of each model module and the inclusion of exogenous variables. By considering the impact of social factors and learning the general characteristics of existing pandemics, TLSS achieves accurate prediction of hospitalization rates.

5. Discussion

5.1. Healthcare Sustainability during an Emerging Pandemic

Healthcare systems are confronted with sustainability challenges while constantly improving their quality level and reducing unnecessary waste, especially during the outbreak of emerging diseases (e.g., COVID-19) [86,87,88]. An effective and accurate forecasting tool is of prime importance in understanding the expected volume of patients, thereby rapidly responding to pandemics [15]. In this paper, we implement the state-of-the-art method TLSS into a new application scenario: forecasting hospitalization rates. We also incorporate information on existing infectious diseases, news sentiment, and semantic information as exogenous features to model the dynamic propagation of new pandemics. Our proposed analytical framework outperforms other baseline models, especially with longer lead times, suggesting that existing methods struggle to capture accurate temporal dependencies for relatively long-term forecasting.
These accurate forecasting results can support healthcare institutions in making informed decisions toward sustainable finance management during pandemics. For example, institutions can avoid over-investing in unnecessary resources or under-investing in high-demand resources. Moreover, by anticipating future demands, health systems can enhance their flexibility in managing human and medical resources, such as constructing temporary hospital facilities to provide additional hospital beds during the peak period of the COVID-19 outbreak. Accurate hospitalization rate forecasting can also aid in planning and coordinating patient care, thus improving the service quality. For instance, it can improve patient outcomes, including shorter hospital stays, reduced readmissions, and fewer complications. In summary, hospitalization rate forecasting is crucial for health institutions to enhance the overall healthcare sustainability over the long term.

5.2. Strength and Applicability of TLSS

More researchers have gradually recognized the critical impact of relevant historical knowledge on an emerging forecasting task, as discussed in Appendix A. They demonstrated that transfer learning architectures outperform traditional isolated machine learning approaches in many cases [89,90]. However, most of them use a homogeneous transfer learning approach such as utilizing the knowledge of existing diseases (e.g., flu) to forecast a new epidemic (e.g., COVID-19). In this work, we successfully learn and transfer heterogeneous information from infection case data to the task of hospitalization rate forecasting based on the demonstrated nonlinear correlation between them. It addresses the scarcity issue of historical data of the same type. For example, it is hard to learn knowledge from sparse hospitalization records of the existing disease (e.g., flu) and transfer it to predict hospitalization rates of an emerging disease (e.g., COVID-19). We also further demonstrate the contribution of the transfer learning module in the ablation test, particularly with a lead time of 7 and 14 days. It implies that the learned experience from existing diseases significantly benefits relative long-term hospitalization rate prediction. Additionally, the novel application of TLSS inspires us to explore other factors, such as mortality and chronic diseases, which may be highly correlated with our target task and can provide critical clues. We will examine the possibility of learning knowledge from multiple correlated factors and transferring them to the target task.
The COVID-19 pandemic has provided recent evidence that institutions incorporating social, environmental, and governance (ESG) factors have a competitive edge in long-term development [91]. It drives multiple works focused on assessing hospital performance from an ESG perspective [92,93,94]. However, few papers value or quantitatively analyze the impacts of ESG components on healthcare sustainability, such as how social factors affect hospitalization rates. TLSS adopts a multimodal data learning module to capture the impact of news sentiment and semantic features on hospitalization rates over time. We successfully extract the relevant information and collect the temporal dependencies from the complex text data (i.e., news articles), thereby improving the accuracy in predicting hospitalization rates. It is beneficial for health systems to address sustainability challenges considering the impact of news opinions and emotions on human behavior. For instance, news and public policies can suggest patients with mild illnesses to isolate at home, thus reducing the pressure of hospitalization during COVID-19. Furthermore, news sentiment exhibits a more significant influence than semantic information in hospitalization rate prediction in the ablation test. It suggests that public emotions and situations may affect human awareness and behavior more than public policies. Overall, our work further optimizes AI technical support by leveraging public opinions and concerns for strategizing sustainable development in healthcare.

6. Conclusions

We introduce healthcare sustainability challenges during an emerging pandemic (i.e., COVID-19) and propose an analytical framework using machine learning methods to address the issues from a data science perspective. In this paper, we utilize non-linear correlation tests (e.g., White test, Granger causality test, and Brownian distance correlation test) to demonstrate the significant relationship between infection cases and hospitalization rates during COVID-19. We then adopt TLSS into a novel application scenario: hospitalization rate forecasting during COVID-19. According to the demonstrated impact of infection cases on hospitalization rates, we learn the general characteristics from rich historical infection records of existing diseases (i.e., flu), instead of from the sparse data of hospitalization rates directly. The learned knowledge is then transferred to a target model for hospitalization rate forecasting during the new epidemic (i.e., COVID-19). The heterogeneous transfer learning architecture within TLSS tackles the challenges of limited input data during the initial phase of an emerging epidemic and the homogeneous data scarcity of existing diseases. For instance, the hospitalization data are sparse in both the early stages of COVID-19 and flu history records simultaneously. We successfully incorporate social variables, such as news sentiment and semantic analysis, to forecast hospitalization rates during the spread of pandemics. We adopt a location-aware attention mechanism to capture the dynamic correlation between news text data and time series numerical data in multiple locations over time. We evaluate TLSS performance during COVID-19 propagation and demonstrate its effectiveness and accuracy in predicting future hospitalization rates across various lead times.
We provide valuable AI technical support for healthcare sustainability, facilitating urgent answers to crises when new epidemics outbreak. We optimize the early-stage forecasting of hospitalization rates during emerging epidemics to better understand the expected volume of patients. By accurately predicting future hospitalization rates, health institutions can effectively reduce their costs by avoiding over- or under-investing. Additionally, they can adjust staff and medical resource allocation to improve the service quality of patient care.
In the future, we intend to refine our AI analytics framework and improve its flexibility, adapting it to various scenarios through continuously updating and purposefully utilizing appropriate techniques. We propose to provide comprehensive readable and visualized forecasting results, enabling broad application in healthcare sustainability, thereby developing its further application to respond to the needs of both health providers and patients simultaneously. Additionally, we aim to extend the exploration of ESG factors, including governance and climate risks, which may also have specific impacts on hospitalization rates or other critical health-related indicators. Such further research will provide a valuable and comprehensive analysis that supports healthcare sustainability in long-term development.

Author Contributions

Conceptualization, J.C. and G.G.C.; methodology, J.C., G.G.C., Y.N. and T.B.-Z.; validation, J.C., G.G.C., Y.N. and T.B.-Z.; formal analysis, J.C. and G.G.C.; investigation, J.C. and G.G.C.; resources, J.C., G.G.C., Y.N. and T.B.-Z.; data curation, J.C., G.G.C. and Y.N.; writing—original draft preparation, J.C., G.G.C., Y.N. and T.B.-Z.; writing—review and editing, J.C., G.G.C., Y.N. and T.B.-Z.; funding acquisition, G.G.C. and Y.N. All authors have read and agreed to the published version of the manuscript.

Funding

This work is supported in part by the US National Science Foundation under grants 1948432 and 2047843.

Institutional Review Board Statement

Not applicable.

Informed Consent Statement

Not applicable.

Data Availability Statement

Publicly available datasets were analyzed in this study. News data require a Refinitiv license [79].

Acknowledgments

The authors would like to thank the editor and the reviewers for their contributions.

Conflicts of Interest

The authors declare no conflict of interest.

Appendix A. Heterogeneous Transfer Learning (HTL)

HTL focuses on transferring knowledge from the source domain to a different but related target domain, in which data are heterogeneous in both feature and label spaces [76]. Moon and Carbonell [95] proposed Attentional Heterogeneous Transfer, which leverages the combined knowledge from unlabeled source and target data to enhance the discrimination power of feature mapping. Effective transfer learning represents a strong improvement over isolated methods in many real-world tasks. Rodríguez et al. [96] designed a COVID-19-augmented ILI deep network (CALI-NET), transfer learning framework to forecast flu cases where flu and COVID-19 co-exist. However, CALI-NET cannot be directly applied to a new scenario (e.g., hospitalization rate forecasting) due to the restriction of input data and the lack of training flexibility. Prinsen et al. [97] demonstrated that transfer learning could effectively overcome limitations with the quantity of training data. Ozer et al. [89] compared the classification performance of several machine learning methods with transfer learning architecture for hospitalization prediction in arboviral infections with resource-limited settings. It shows the higher significant effectiveness and accuracy of transfer learning than isolated approaches. Kumar et al. [98] designed an ensemble model for chest X-ray images to detect COVID-19 infection in the early stage. They used transfer learning models such as EfficientNet, GoogLeNet, and Xception Net to optimize the classifier’s generalization ability and improve the model accuracy. Wang et al. [90] presented a comprehensive review of the existing work associated with deep learning and transfer learning for health monitoring. These studies introduce the advantages of HTL from different perspectives and motivate us to design novel frameworks for facilitating healthcare to overcome existing limitations.

Appendix B. Comparison Methods

  • Autoregressive (AR)
    AR is a statistical model, which can result in accurate forecasts of time series problems. It uses historical data as an input to linear regression to predict future values. In the experiment, we train independent AR models for different locations. The hyperparameter lag (p) is set up as window size T. The optimization method of AR is gradient descent. Particularly, the AR model is estimated using ordinary least squares (OLS) with the Python function s t a t s m o d e l s . t s a . a r _ m o d e l . A u t o R e g .
  • Autoregressive Moving Average (ARMA)
    ARMA is derived from merging the AR and the moving average (MA) models to optimize the explanation of the behavior of time series. In the experiment, the hyperparameter order(q) is set as smoothing window size 2. The optimization method of ARMA is gradient descent. Particularly, the ARMA model is estimated using ordinary least squares (OLS) with the Python function s t a t s m o d e l s . t s a . a r i m a . m o d e l . A R I M A .
  • Vector Autoregressive (VAR)
    VAR is derived from AR and modeled as a linear combination model that includes the cross-signal dependence of multivariate time series. Thus, it contains more parameters and takes a longer running time than AR.
  • Recurrent Neural Network (RNN)
    RNN is a powerful artificial neural network for temporal dependencies learning. It is composed of hidden layers of neurons to recognize data’s sequential characteristics for predicting the next likely output. In the experiment, we implement it with an input vector of features (e.g., hospitalization rates, COVID-19 cases, and news sentiment and semantic information) of multiple locations.
  • Long- and Short-term Time-series network (LSTNet)
    LSTNet leverages both Convolution Neural Network (CNN) and Recurrent Neural Network (RNN) to capture short-term local dependency patterns from multiple features and to learn long-term patterns in time series.
  • Cross-Location Attention Based Graph Neural Network (Cola-GNN)
    Cola-GNN is a neural network that combines graph structures and time series features at the macroscopic level (e.g., geolocation) for long-term influenza-like illness (ILI) prediction. We apply it in hospitalization rate prediction during COVID-19 in 50 US states. It is the source model of TLSS.

Appendix C. State-Level Non-Linear Correlation Test Results for Hospitalization Rates and Infection Cases during COVID-19

Table A1. State-level non-linear correlation test results for hospitalization rates and infection cases during COVID-19. The Boldface of the White test results indicates a larger p-value compared with other states. Underline of distance correlations indicates a smaller correlation compared with other states.
StateWhite Test (p-Value)Granger Causality Test (p-Value)Distance Correlation Test (p-Value)Distance Correlation
AK 6 . 21 × 10 8 0.00000.00000.4754
AL 7.15 × 10 65 0.00000.00000.7892
AR 1.22 × 10 45 0.00000.00000.7755
AZ 5.62 × 10 57 0.00000.00000.7597
CA 1.49 × 10 38 0.00000.00000.6424
CO 1.97 × 10 61 0.00000.00000.8058
CT 7.18 × 10 67 0.00000.00000.6481
DE 1.08 × 10 43 0.00000.00000.7851
FL 4.26 × 10 68 0.00000.00000.8502
GA 2.90 × 10 58 0.01120.00000.6864
HI 1 . 08 × 10 5 0.01200.00000.4844
IA 9.32 × 10 47 0.00000.00000.6769
ID 4.20 × 10 11 0.03410.00000.6621
IL 1.61 × 10 39 0.00000.00000.7025
IN 2.11 × 10 102 0.00000.00000.7405
KS 1 . 39 × 10 6 0.20530.00000.4463
KY 1.03 × 10 23 0.00000.00000.5497
LA 1.50 × 10 68 0.00000.00000.7255
MA 5.19 × 10 40 0.00000.00000.6663
MD 2.90 × 10 53 0.00000.00000.7391
ME 4.54 × 10 28 0.05010.00000.7308
MI 7.31 × 10 36 0.00000.00000.5963
MN 2.70 × 10 85 0.00000.00000.6457
MO 2.57 × 10 46 0.00000.00000.6697
MS 1.63 × 10 82 0.00000.00000.6909
MT 2.21 × 10 36 0.00000.00000.6552
NC 8.38 × 10 24 0.00000.00000.7902
ND 1.07 × 10 51 0.00000.00000.7423
NE 1.50 × 10 76 0.00000.00000.6837
NH 2.07 × 10 56 0.00000.00000.6019
NJ 6.93 × 10 40 0.00000.00000.8243
NM 1.04 × 10 52 0.09890.00000.6358
NV 2.77 × 10 87 0.00000.00000.6616
NY 9.26 × 10 61 0.00000.00000.8158
OH 1.83 × 10 91 0.00000.00000.7704
OK 2.05 × 10 70 0.00000.00000.6853
OR 1.27 × 10 43 0.00000.00000.6306
PA 4.49 × 10 41 0.00000.00000.8171
RI 5.38 × 10 36 0.00000.00000.7495
SC 7.61 × 10 90 0.00000.00000.8647
SD 4.16 × 10 76 0.00000.00000.6805
TN 5.38 × 10 46 0.00000.00000.8345
TX 9.91 × 10 20 0.00000.00000.7654
UT 7.76 × 10 87 0.00000.00000.6436
VA 1.11 × 10 59 0.00000.00000.6780
VT 3.93 × 10 58 0.00000.00000.5499
WA 3.80 × 10 18 0.00000.00000.7753
WI 3.89 × 10 216 0.00000.00000.7033
WV 1.94 × 10 106 0.00000.00000.7975
WY 1.12 × 10 79 0.02560.00000.6563

References

  1. Ranjbari, M.; Shams Esfandabadi, Z.; Zanetti, M.C.; Scagnelli, S.D.; Siebers, P.O.; Aghbashlo, M.; Peng, W.; Quatraro, F.; Tabatabaei, M. Three pillars of sustainability in the wake of COVID-19: A systematic review and future research agenda for sustainable development. J. Clean. Prod. 2021, 297, 126660. [Google Scholar] [CrossRef] [PubMed]
  2. Jiang, P.; Klemeš, J.J.; Van Fan, Y.; Fu, X.; Bee, Y.M. More is not enough: A deeper understanding of the COVID-19 impacts on healthcare, energy and environment is crucial. Int. J. Environ. Res. Public Health 2021, 18, 684. [Google Scholar] [CrossRef] [PubMed]
  3. Thakur, V. Framework for PESTEL dimensions of sustainable healthcare waste management: Learnings from COVID-19 outbreak. J. Clean. Prod. 2021, 287, 125562. [Google Scholar] [CrossRef] [PubMed]
  4. Countries Where Coronavirus Has Spread—Worldometer. Available online: https://www.worldometers.info/coronavirus/countries-where-coronavirus-has-spread/ (accessed on 5 July 2023).
  5. Zhu, H.; Wei, L.; Niu, P. The novel coronavirus outbreak in Wuhan, China. Glob. Health Res. Policy 2020, 5, 6. [Google Scholar] [CrossRef]
  6. Mohan, B.S.; Vinod, N. COVID-19: An insight into SARS-CoV2 pandemic originated at Wuhan city in Hubei province of China. J. Infect. Dis. Epidemiol. 2020, 6, 146. [Google Scholar] [CrossRef]
  7. WHO Coronavirus (COVID-19) Dashboard. Available online: https://covid19.who.int/ (accessed on 1 May 2023).
  8. CDC COVID-19 Response. United States COVID-19 Cases and Deaths by State over Time. Available online: https://data.cdc.gov/Case-Surveillance/United-States-COVID-19-Cases-and-Deaths-by-State-o/9mfq-cb36 (accessed on 1 May 2023).
  9. Hakovirta, M.; Denuwara, N. How COVID-19 Redefines the Concept of Sustainability. Sustainability 2020, 12, 3727. [Google Scholar] [CrossRef]
  10. Lennox, L.; Doyle, C.; Reed, J.E.; Bell, D. What makes a sustainability tool valuable, practical and useful in real-world healthcare practice? A mixed-methods study on the development of the Long Term Success Tool in Northwest London. BMJ Open 2017, 7, e014417. [Google Scholar] [CrossRef]
  11. Lennox, L.; Maher, L.; Reed, J. Navigating the sustainability landscape: A systematic review of sustainability approaches in healthcare. Implement. Sci. 2018, 13, 27. [Google Scholar] [CrossRef]
  12. Sherman, J.D.; Thiel, C.; MacNeill, A.; Eckelman, M.J.; Dubrow, R.; Hopf, H.; Lagasse, R.; Bialowitz, J.; Costello, A.; Forbes, M.; et al. The Green Print: Advancement of Environmental Sustainability in Healthcare. Resour. Conserv. Recycl. 2020, 161, 104882. [Google Scholar] [CrossRef]
  13. Mortimer, F.; Isherwood, J.; Wilkinson, A.; Vaux, E. Sustainability in quality improvement: Redefining value. Future Healthc. J. 2018, 5, 88. [Google Scholar] [CrossRef]
  14. Goh, C.Y.; Marimuthu, M. The path towards healthcare sustainability: The role of organisational commitment. Procedia Soc. Behav. Sci. 2016, 224, 587–592. [Google Scholar] [CrossRef]
  15. Dash, S.; Shakyawar, S.K.; Sharma, M.; Kaushik, S. Big data in healthcare: Management, analysis and future prospects. J. Big Data 2019, 6, 54. [Google Scholar] [CrossRef]
  16. Duan, W.; Fan, Z.; Zhang, P.; Guo, G.; Qiu, X. Mathematical and computational approaches to epidemic modeling: A comprehensive review. Front. Comput. Sci. 2015, 9, 806–826. [Google Scholar] [CrossRef] [PubMed]
  17. Afzal, A.; Saleel, C.A.; Bhattacharyya, S.; Satish, N.; Samuel, O.D.; Badruddin, I.A. Merits and limitations of mathematical modeling and computational simulations in mitigation of COVID-19 pandemic: A comprehensive review. Arch. Comput. Methods Eng. 2022, 29, 1311–1337. [Google Scholar] [CrossRef] [PubMed]
  18. Makridakis, S. A Survey of Time Series. ISR 1976, 44, 29–70. [Google Scholar] [CrossRef]
  19. Cheng, Q.; Argon, N.T.; Evans, C.S.; Liu, Y.; Platts-Mills, T.F.; Ziya, S. Forecasting emergency department hourly occupancy using time series analysis. Am. J. Emerg. Med. 2021, 48, 177–182. [Google Scholar] [CrossRef]
  20. Perone, G. Comparison of ARIMA, ETS, NNAR, TBATS and hybrid models to forecast the second wave of COVID-19 hospitalizations in Italy. Eur. J. Health Econ. 2022, 23, 917–940. [Google Scholar] [CrossRef]
  21. Chen, J.; Li, K.; Zhang, Z.; Li, K.; Yu, P.S. A Survey on Applications of Artificial Intelligence in Fighting Against COVID-19. ACM Comput. Surv. 2020, 54, 1–32. [Google Scholar] [CrossRef]
  22. Morens, D.M.; Fauci, A.S. Emerging infectious diseases in 2012: 20 years after the institute of medicine report. MBio 2012, 3, e00494-12. [Google Scholar] [CrossRef]
  23. Morens, D.M.; Daszak, P.; Taubenberger, J.K. Escaping Pandora’s box—Another novel Coronavirus. N. Engl. J. Med. 2020, 382, 1293–1295. [Google Scholar] [CrossRef]
  24. Creamer, G.G.; Creamer, B. A Non-Linear Dependence Analysis of Oil, Coal and Natural Gas Futures with Brownian Distance Correlation. In Proceedings of the 2014 AAAI Fall Symposia, Arlington, VI, USA, 13–15 November 2014. [Google Scholar]
  25. Bekalu, M.A.; McCloud, R.F.; Viswanath, K. Association of social media use with social well-being, positive mental health, and self-rated health: Disentangling routine use from emotional connection to use. Health Educ. Behav. 2019, 46, 69–80. [Google Scholar] [CrossRef] [PubMed]
  26. Al-Dmour, H.; Masa’deh, R.; Salman, A.; Abuhashesh, M.; Al-Dmour, R. Influence of social media platforms on public health protection against the COVID-19 pandemic via the mediating effects of public health awareness and behavioral changes: Integrated model. J. Med. Internet Res. 2020, 22, e19996. [Google Scholar] [CrossRef] [PubMed]
  27. Chen, J.; Creamer, G.G.; Ning, Y. Forecasting Emerging Pandemics with Transfer Learning and Location-aware News Analysis. In Proceedings of the 2022 IEEE International Conference on Big Data (Big Data), Osaka, Japan, 17–20 December 2022; pp. 874–883. [Google Scholar]
  28. Buffoli, M.; Capolongo, S.; Bottero, M.; Cavagliato, E.; Speranza, S.; Volpatti, L. Sustainable Healthcare: How to assess and improve healthcare structures’ sustainability. Ann. Ig. 2013, 25, 411–418. [Google Scholar] [PubMed]
  29. Ramirez, B.; J. West, D.; M. Costell, M. Development of a culture of sustainability in health care organizations. J. Health Organ. Manag. 2013, 27, 665–672. [Google Scholar] [CrossRef] [PubMed]
  30. Sun, D.; Wang, F.; Chen, N.; Chen, J. The Impacts of Technology Shocks on Sustainable Development from the Perspective of Energy Structure—A DSGE Model Approach. Sustainability 2021, 13, 8665. [Google Scholar] [CrossRef]
  31. Jamaludin, N.H.; Habidin, N.F.; Shazali, N.A.; Ali, N.; Khaidir, N.A. Exploring sustainable healthcare service and sustainable healthcare performance: Based on Malaysian healthcare industry. J. Sustain. Dev. Stud. 2013, 3, 14–26. [Google Scholar]
  32. Ling, T.; Pedersen, J.S.; Drabble, S.; Celia, C.; Brereton, L.; Tiefensee, C. Sustainable development in the National Health Service (NHS): The views and values of NHS leaders. Rand Health Q. 2012, 2, 12. [Google Scholar]
  33. Khatana, S.A.M.; Groeneveld, P.W. Health Disparities and the Coronavirus Disease 2019 (COVID-19) Pandemic in the USA. J. Gen. Intern. Med. 2020, 35, 2431–2432. [Google Scholar] [CrossRef]
  34. Capolongo, S.; Bottero, M.C.; Lettieri, E.; Buffoli, M.; Bellagarda, A.; Birocchi, M.; Cavagliato, E.; Dervishaj, A.; di Noia, M.; Gherardi, G.; et al. Healthcare Sustainability Challenge. In Improving Sustainability During Hospital Design and Operation: A Multidisciplinary Evaluation Tool; Capolongo, S., Bottero, M.C., Buffoli, M., Lettieri, E., Eds.; Springer International Publishing: Cham, Switzerland, 2015; pp. 1–9. [Google Scholar]
  35. Brambilla, A.; Apel, J.M.; Schmidt-Ross, I.; Buffoli, M.; Capolongo, S. Testing of a Multiple Criteria Assessment Tool for Healthcare Facilities Quality and Sustainability: The Case of German Hospitals. Sustainability 2022, 14, 16742. [Google Scholar] [CrossRef]
  36. Rees, E.M.; Nightingale, E.S.; Jafari, Y.; Waterlow, N.R.; Clifford, S.; Pearson, C.A.B.; CMMID Working Group; Jombart, T.; Procter, S.R.; Knight,, G.M. COVID-19 length of hospital stay: A systematic review and data synthesis. BMC Med. 2020, 18, 270. [Google Scholar] [CrossRef]
  37. Gul, M.; Celik, E. An exhaustive review and analysis on applications of statistical forecasting in hospital emergency departments. Health Syst. 2020, 9, 263–284. [Google Scholar] [CrossRef] [PubMed]
  38. Nsoesie, E.O.; Brownstein, J.S.; Ramakrishnan, N.; Marathe, M.V. A systematic review of studies on forecasting the dynamics of influenza outbreaks. Influenza Other Respir. Viruses 2014, 8, 309–316. [Google Scholar] [CrossRef] [PubMed]
  39. Brockwell, P.J.; Davis, R.A. Time Series: Theory and Methods; Springer: Berlin/Heidelberg, Germany, 1986. [Google Scholar]
  40. Mahalakshmi, G.; Sridevi, S.; Rajaram, S. A survey on forecasting of time series data. In Proceedings of the ICCTIDE’16, Kovilpatti, India, 7–9 January 2016; pp. 1–8. [Google Scholar]
  41. Liu, Z.; Zhu, Z.; Gao, J.; Xu, C. Forecast Methods for Time Series Data: A Survey. IEEE Access 2021, 9, 91896–91912. [Google Scholar] [CrossRef]
  42. Dama, F.; Sinoquet, C. Time Series Analysis and Modeling to Forecast: A Survey. arXiv 2021, arXiv:2104.00164. [Google Scholar]
  43. Soltani, M.; Farahmand, M.; Pourghaderi, A.R. Machine learning-based demand forecasting in cancer palliative care home hospitalization. J. Biomed. Inform. 2022, 130, 104075. [Google Scholar] [CrossRef]
  44. Lim, B.; Zohren, S. Time-series forecasting with deep learning: A survey. Philos. Trans. A Math. Phys. Eng. Sci. 2021, 379, 20200209. [Google Scholar] [CrossRef]
  45. Miotto, R.; Wang, F.; Wang, S.; Jiang, X.; Dudley, J.T. Deep learning for healthcare: Review, opportunities and challenges. Brief. Bioinform. 2018, 19, 1236–1246. [Google Scholar] [CrossRef]
  46. Cheng, L.; Ren, Y.; Zhang, K.; Pan, L.; Shi, Y. Hospitalization Behavior Prediction Based on Attention and Time Adjustment Factors in Bidirectional LSTM. In Proceedings of the Database Systems for Advanced Applications; Li, G., Yang, J., Gama, J., Natwichai, J., Tong, Y., Eds.; Springer International Publishing: Cham, Switzerland, 2019; pp. 397–401. [Google Scholar]
  47. Kaushik, S.; Choudhury, A.; Dasgupta, N.; Natarajan, S.; Pickett, L.A.; Dutt, V. Ensemble of Multi-headed Machine Learning Architectures for Time-Series Forecasting of Healthcare Expenditures. In Applications of Machine Learning; Johri, P., Verma, J.K., Paul, S., Eds.; Springer: Singapore, 2020; pp. 199–216. [Google Scholar]
  48. Hao, T.; Huang, Z.; Liang, L.; Weng, H.; Tang, B. Health Natural Language Processing: Methodology Development and Applications. JMIR Med. Inform. 2021, 9, e23898. [Google Scholar] [CrossRef]
  49. Solangi, Y.A.; Solangi, Z.A.; Aarain, S.; Abro, A.; Mallah, G.A.; Shah, A. Review on Natural Language Processing (NLP) and Its Toolkits for Opinion Mining and Sentiment Analysis. In Proceedings of the 2018 IEEE 5th ICETAS, Bangkok, Thailand, 22–23 November 2018; pp. 1–4. [Google Scholar]
  50. Smailhodzic, E.; Hooijsma, W.; Boonstra, A.; Langley, D.J. Social media use in healthcare: A systematic review of effects on patients and on their relationship with healthcare professionals. BMC Health Serv. Res. 2016, 16, 442. [Google Scholar] [CrossRef]
  51. Househ, M. The use of social media in healthcare: Organizational, clinical, and patient perspectives. Stud. Health Technol. Inform. 2013, 183, 244–248. [Google Scholar]
  52. Du, E.; Chen, E.; Liu, J.; Zheng, C. How do social media and individual behaviors affect epidemic transmission and control? Sci. Total Environ. 2021, 761, 144114. [Google Scholar] [CrossRef] [PubMed]
  53. Chen, N.; Sun, D.; Chen, J. Digital transformation, labour share, and industrial heterogeneity. J. Innov. Knowl. 2022, 7, 100173. [Google Scholar] [CrossRef]
  54. Blei, D.M.; Ng, A.Y.; Jordan, M.I. Latent Dirichlet Allocation. J. Mach. Learn. Res. 2003, 3, 993–1022. [Google Scholar]
  55. Lamsal, R.; Harwood, A.; Read, M.R. Twitter conversations predict the daily confirmed COVID-19 cases. Appl. Soft Comput. 2022, 129, 109603. [Google Scholar] [CrossRef]
  56. Hutto, C.J.; Gilbert, E.E. VADER: A Parsimonious Rule-based Model for Sentiment Analysis of Social Media Text. Proc. Int. Aaai Conf. Web Soc. Media 2014, 8, 216–225. [Google Scholar] [CrossRef]
  57. Le, Q.V.; Mikolov, T. Distributed Representations of Sentences and Documents. In Proceedings of the 31st International Conference on Machine Learning, PMLR, Beijing, China, 21–26 June 2014. [Google Scholar]
  58. Pennington, J.; Socher, R.; Manning, C. GloVe: Global Vectors for Word Representation. In Proceedings of the 2014 Conference on Empirical Methods in Natural Language Processing (EMNLP), Doha, Qatar, 25–29 October 2014; pp. 1532–1543. [Google Scholar]
  59. Devlin, J.; Chang, M.; Lee, K.; Toutanova, K. BERT: Pre-training of Deep Bidirectional Transformers for Language Understanding. arXiv 2018, arXiv:1810.04805. [Google Scholar]
  60. Reimers, N.; Gurevych, I. Sentence-BERT: Sentence Embeddings using Siamese BERT-Networks. arXiv 2019, arXiv:1908.10084. [Google Scholar]
  61. Abualigah, L.; Alfar, H.E.; Shehab, M.; Hussein, A.M.A. Sentiment analysis in healthcare: A brief review. In Recent Advances in NLP: The Case of Arabic Language; Springer: Berlin/Heidelberg, Germany, 2020; pp. 129–141. [Google Scholar]
  62. Greaves, F.; Ramirez-Cano, D.; Millett, C.; Darzi, A.; Donaldson, L. Use of sentiment analysis for capturing patient experience from free-text comments posted online. J. Med. Internet Res. 2013, 15, e239. [Google Scholar] [CrossRef]
  63. Alamoodi, A.; Zaidan, B.; Zaidan, A.; Albahri, O.; Mohammed, K.; Malik, R.; Almahdi, E.; Chyad, M.; Tareq, Z.; Albahri, A.; et al. Sentiment analysis and its applications in fighting COVID-19 and infectious diseases: A systematic review. Expert Syst. Appl. 2021, 167, 114155. [Google Scholar] [CrossRef]
  64. Gohil, S.; Vuik, S.; Darzi, A. Sentiment Analysis of Health Care Tweets: Review of the Methods Used. JMIR Public Health Surveill. 2018, 4, e43. [Google Scholar] [CrossRef]
  65. Aslam, F.; Awan, T.M.; Syed, J.H.; Kashif, A.; Parveen, M. Sentiments and emotions evoked by news headlines of coronavirus disease (COVID-19) outbreak. Humanit. Soc. Sci. Commun. 2020, 7, 23. [Google Scholar] [CrossRef]
  66. Matošević, G.; Bevanda, V. Sentiment analysis of tweets about COVID-19 disease during pandemic. In Proceedings of the 2020 43rd International Convention on Information, Communication and Electronic Technology (MIPRO), Opatija, Croatia, 28 September–2 October 2020; pp. 1290–1295. [Google Scholar]
  67. Mourad, A.; Srour, A.; Harmanani, H.; Jenainati, C.; Arafeh, M. Critical Impact of Social Networks Infodemic on Defeating Coronavirus COVID-19 Pandemic: Twitter-Based Study and Research Directions. IEEE Trans. Netw. Serv. Manag. 2020, 17, 2145–2155. [Google Scholar] [CrossRef]
  68. Mahdikhani, M. Predicting the popularity of tweets by analyzing public opinion and emotions in different stages of COVID-19 pandemic. IJIM Data Insights 2022, 2, 100053. [Google Scholar] [CrossRef]
  69. Zeng, K.; Pan, Z.; Xu, Y.; Qu, Y. An Ensemble Learning Strategy for Eligibility Criteria Text Classification for Clinical Trial Recruitment: Algorithm Development and Validation. JMIR Med. Inform. 2020, 8, e17832. [Google Scholar] [CrossRef]
  70. Gourisaria, M.K.; Chandra, S.; Das, H.; Patra, S.S.; Sahni, M.; Leon-Castro, E.; Singh, V.; Kumar, S. Semantic analysis and topic modelling of web-scrapped COVID-19 tweet corpora through data mining methodologies. Healthcare 2022, 10, 881. [Google Scholar] [CrossRef]
  71. Testing for neglected nonlinearity in time series models A comparison of neural network methods and alternative tests. J. Econom. 1993, 56, 269–290. [CrossRef]
  72. Prabowo, H.; Suhartono, S.; Prastyo, D. The Performance of Ramsey Test, White Test and Terasvirta Test in Detecting Nonlinearity. Inferensi 2020, 3, 1. [Google Scholar] [CrossRef]
  73. Granger, C.W.J. Investigating Causal Relations by Econometric Models and Cross-spectral Methods. Econometrica 1969, 37, 424–438. [Google Scholar] [CrossRef]
  74. Ghysels, E.; Swanson, N.R.; Watson, M.W. (Eds.) Essays in Econometrics: Collected Papers of Clive W. J. Granger; Cambridge University Press: Cambridge, MA, USA, 2001; Volume 1: Spectral Analysis, Seasonality, Nonlinearity, Methodology, and Forecasting. [Google Scholar]
  75. Székely, G.J.; Rizzo, M.L. Brownian distance covariance. Ann. Appl. Stat. 2009, 3, 1236–1265. [Google Scholar] [CrossRef]
  76. Day, O.; Khoshgoftaar, T.M. A survey on heterogeneous transfer learning. J. Big Data 2017, 4, 29. [Google Scholar] [CrossRef]
  77. Deng, S.; Wang, S.; Rangwala, H.; Wang, L.; Ning, Y. Cola-GNN: Cross-Location Attention Based Graph Neural Networks for Long-Term ILI Prediction. In Proceedings of the 29th ACM CIKM, CIKM ’20, Virtual, 19–23 October 2020; pp. 245–254. [Google Scholar]
  78. U.S. Department of Health and Human Services. United States COVID-19 reported patient impact and hospital capacity by State over time. Available online: https://beta.healthdata.gov/Hospital/COVID-19-Reported-Patient-Impact-and-Hospital-Capa/g62h-syeh (accessed on 29 September 2023).
  79. Financial Technology, Data, and Expertise. Available online: https://www.refinitiv.com/ (accessed on 30 January 2023).
  80. Leetaru, K.; Schrodt, P.A. GDELT: Global data on events, location, and tone. In Proceedings of the ISA Annual Convention, San Francisco, CA, USA, 3–6 April 2013. [Google Scholar]
  81. Symptoms of COVID-19. Available online: https://www.cdc.gov/coronavirus/2019-ncov/symptoms-testing/symptoms.html (accessed on 26 May 2023).
  82. Kingma, D.P.; Ba, J. Adam: A Method for Stochastic Optimization. arXiv 2014, arXiv:1412.6980. [Google Scholar]
  83. Fisher, R.A. Statistical Methods and Scientific Inference; Oliver and Boyd: Edinburgh, UK, 1956. [Google Scholar]
  84. Meng, X.L. Posterior predictive p-values. Ann. Stat. 1994, 22, 1142–1160. [Google Scholar] [CrossRef]
  85. Student. The probable error of a mean. Biometrika 1908, 6, 1–25. [Google Scholar] [CrossRef]
  86. Eckelman, M.J.; Huang, K.; Lagasse, R.; Senay, E.; Dubrow, R.; Sherman, J.D. Health Care Pollution And Public Health Damage In The United States: An Update: Study examines health care pollution and public health damage in the United States. Health Affairs 2020, 39, 2071–2079. [Google Scholar] [CrossRef]
  87. Zhang, D.; Ling, H.; Huang, X.; Li, J.; Li, W.; Yi, C.; Zhang, T.; Jiang, Y.; He, Y.; Deng, S.; et al. Potential spreading risks and disinfection challenges of medical wastewater by the presence of Severe Acute Respiratory Syndrome Coronavirus 2 (SARS-CoV-2) viral RNA in septic tanks of Fangcang Hospital. Sci. Total Environ. 2020, 741, 140445. [Google Scholar] [CrossRef]
  88. Grimm, C.A. Hospital Experiences Responding to the COVID-19 Pandemic: Results of a National Pulse Survey 23–27 March 2020; US Department of Health and Human Services Office of Inspector General: Washington, DC, USA, 2020; Volume 41. [Google Scholar]
  89. Ozer, I.; Cetin, O.; Gorur, K.; Temurtas, F. Improved machine learning performances with transfer learning to predicting need for hospitalization in arboviral infections against the small dataset. Neural Comput. Appl. 2021, 33, 14975–14989. [Google Scholar] [CrossRef]
  90. Wang, Y.; Nazir, S.; Shafiq, M. An Overview on Analyzing Deep Learning and Transfer Learning Approaches for Health Monitoring. Comput. Math. Methods Med. 2021, 2021, 5552743. [Google Scholar] [CrossRef]
  91. Piechocka-Kałużna, A.; Tłuczak, A.; Łopatka, P. The Impact of CSR/ESG Reporting on the Cost of Capital: An Example of US Healthcare Entities. Eur. Res. Stud. J. 2021, 24, 679–690. [Google Scholar] [CrossRef]
  92. Brambilla, A.; Lindahl, G.; Dell’Ovo, M.; Capolongo, S. Validation of a multiple criteria tool for healthcare facilities quality evaluation. Facilities 2020, 39, 434–447. [Google Scholar] [CrossRef]
  93. Ghahremanloo, M.; Hasani, A.; Amiri, M.; Hashemi-Tabatabaei, M.; Keshavarz-Ghorabaee, M.; Ustinovičius, L. A novel DEA model for hospital performance evaluation based on the measurement of efficiency, effectiveness and productivity. Eng. Manag. Prod. Serv. 2020, 12, 7–19. [Google Scholar] [CrossRef]
  94. Sepetis, A. Sustainable finance in sustainable health care system. Open J. Bus. Manag. 2019, 8, 262. [Google Scholar] [CrossRef]
  95. Moon, S.; Carbonell, J. Completely Heterogeneous Transfer Learning with Attention—What And What Not To Transfer. In Proceedings of the IJCAI’17: Proceedings of the 26th International Joint Conference on Artificial Intelligence, Melbourne, Australia, 19–25 August 2017; pp. 2508–2514.
  96. Rodríguez, A.; Muralidhar, N.; Adhikari, B.; Tabassum, A.; Ramakrishnan, N.; Prakash, B.A. Steering a Historical Disease Forecasting Model Under a Pandemic: Case of Flu and COVID-19. arXiv 2020, arXiv:2009.11407. [Google Scholar] [CrossRef]
  97. Prinsen, V.; Jouvet, P.; Al Omar, S.; Masson, G.; Bridier, A.; Noumeir, R. Automatic eye localization for hospitalized infants and children using convolutional neural networks. Int. J. Med. Inform. 2021, 146, 104344. [Google Scholar] [CrossRef] [PubMed]
  98. Kumar, N.; Gupta, M.; Gupta, D.; Tiwari, S. Novel deep transfer learning model for COVID-19 patient detection using X-ray chest images. J. Ambient. Intell. Human Comput. 2021, 14, 469–478. [Google Scholar] [CrossRef]
Figure 1. Examples of impact of news articles on hospitalization rates during COVID-19. (a) US: Normalized daily hospitalization count and normalized occurrence of keywords (e.g., mask) in news articles. (b) US: Normalized daily hospitalization count and normalized occurrence of keywords (e.g., holiday-related keywords) in news articles.
Sustainability 15 15840 g001
Table 1. Major mathematical notations.
NotationDescription
Twindow size of one training input
ktime index
Nnumber of locations
hhorizon/lead time of a prediction
D , F feature dimensions
X R N × T infection cases for N locations of window size T
Y R N × T hospitalization rates for N locations of window size T
V R N × T sentiment scores for N locations of window size T
S R N × T × 50 semantic embeddings for N locations of window size T
C k v R N × N dynamic sentiment cosine similarity of N locations
C k s R N × N dynamic semantic cosine similarity of N locations
G i , k R N × F learned representations from the source model
G i , k R N × F learned representations from the target model
Table 2. Data description. Size means the number of dates multiplied by the daily data dimension. The size of original news is the total number of news articles in the datasets.
DatasetLocationSizeMaxMin
Hospitalization Rates5079125500
COVID-19 Cases50791319,8090
Country-level COVID-19 Original News-419 k--
State-level COVID-19 Original News-1103 k--
Pre-trained News Sentiment (State-level)507911−1
Pre-trained News Semantic (State-level)50791 × 5010
Pre-trained News Sentiment (Country-level)17911−1
Pre-trained News Semantic (Country-level)1791 × 5010
Table 3. Country-level non-linear correlation test results for hospitalization rates and infection cases during COVID-19.
White TestGranger Causality TestDistance Correlation Test
p-value 1.68 × 10 54 6.81 × 10 21 0.0000
Table 4. Number of states with non-linear correlation test results for hospitalization rates and infection cases during COVID-19 with different statistical significance levels.
p < 0.01p < 0.05p < 0.1Non-Significant
White Test50000
Granger Causality Test43421
Distance Correlation Test50000
p < 0.X represents p-values at different significant levels.
Table 5. Number of states with different Brownian distance correlations between hospitalization rates and COVID-19 infection cases.
Brownian Distance Correlation>0.7<0.7 and >0.5<0.5
Number of States24233
Table 6. Country-level Experiment: RMSE performance of different methods on hospitalization rate data and exogenous variables (COVID-19 cases, news sentiment feature, and news semantic feature) using an input window of fifteen lagged days and a lead time of one day. Boldface indicates the best result of each column.
RMSEHospitalizationsHospitalizations and COVID-19 CasesHospitalizations, COVID-19 Cases, and News Sentiment and Semantic Features
AR 0.12010.09460.0928
ARMA 0.10680.10300.0704
AR0.00790.00760.0073
ARMA0.00760.00780.0072
VAR0.00780.00740.0076
RNN0.00670.00770.0084
lstnet0.00800.00820.0079
Algorithms listed are autoregressive-OLS (AR ), autoregressive-gradient descent (AR), autoregressive moving average-OLS (ARMA ), autoregressive moving average-gradient descent (ARMA), vector autoregressive (VAR), recurrent neural network (RNN), and long- and short-term time-series network (LSTNet).
Table 7. The t-statistic of RMSE differences between hospitalization rate forecasting with and without exogenous variables (COVID-19 cases, news sentiment feature, and news semantic feature) at the country level.
Hospitalizations vs.
Hospitalizations
and COVID-19 Cases
Hospitalizations vs.
Hospitalizations,
COVID-19 Cases,
and News Sentiment
and Semantic Features
Hospitalizations and
COVID-19 Cases vs.
Hospitalizations,
COVID-19 Cases,
and News Sentiment
and Semantic Features
t-statistic0.38420.91240.5706
Table 8. State-level Experiment: RMSE performance of different methods on hospitalization rate data and exogenous variables (COVID-19 cases, news sentiment feature, and news semantic feature) with input windows of 9 and 15 lagged days and lead times of 1, 7, and 14 days. We use DM-test to compare the performance of TLSS against other models. Boldface and underlined indicate the best and the second-best result of each column.
RMSELead Time1714
Window Size915915915
hospitalizationsAR 0.0893 ***0.1046 ***
ARMA 0.0906 ***0.0958 ***
AR0.0427 **0.04280.0472 ***0.0474 **0.0551 ***0.0524 *
ARMA0.0427 ***0.0429 **0.0475 ***0.0474 **0.0561 ***0.0569 ***
VAR0.0488 ***0.0545 ***0.0542 ***0.0592 ***0.0686 ***0.0721 ***
RNN0.0439 ***0.0442 ***0.0465 **0.0472 *0.0556 ***0.0535 **
lstnet0.0432 ***0.0432 **0.0468 ***0.04730.05240.0567 ***
hospitalizations,
COVID-19 cases
AR 0.0862 ***0.1025 ***
ARMA 0.0836 ***0.0921 ***
AR0.0430 *0.0427 *0.0489 ***0.0482 ***0.0550 ***0.0546 ***
ARMA0.0435 ***0.0437 ***0.0484 ***0.0498 ***0.0565 ***0.0584 ***
VAR0.0566 ***0.0606 ***0.0617 ***0.0671 ***0.0781 ***0.0872 ***
RNN0.0451 ***0.0441 ***0.0478 ***0.0467 *0.0547 ***0.0528 *
lstnet0.0469 ***0.0466 ***0.0524 ***0.0507 ***0.0608 ***0.0605 ***
hospitalizations,
COVID-19 cases,
news features
AR 0.2052 ***0.2039 ***
ARMA 0.1052 ***0.0995 ***
AR0.0468 ***0.0443 ***0.0488 ***0.0493 ***0.0588 ***0.0572 ***
ARMA0.0465 ***0.0444 ***0.0483 ***0.0515 ***0.0583 ***0.0577 ***
VAR0.0676 ***0.0585 ***0.0683 ***0.0774 ***0.0850 ***0.0981 ***
RNN0.0446 ***0.0453 ***0.0483 ***0.0503 ***0.05370.0558 ***
lstnet0.0469 ***0.0469 ***0.0527 ***0.0514 ***0.0623 ***0.0638 ***
hospitalizations,
geolocation
Cola-GNN0.0419 ***0.0419 *0.0445 ***0.0452 *0.05230.0517
hospitalizations,
geolocation,
news features
TLSS0.04100.04160.04290.04490.05270.0518
p-values (*, **, *** indicate statistical significance level at p < 0.10, p < 0.05 and p < 0.01). Algorithms listed are autoregressive-OLS (AR), autoregressive-gradient descent (AR), autoregressive moving average-OLS (ARMA), autoregressive moving average-gradient descent (ARMA), vector autoregressive (VAR), recurrent neural network (RNN), long- and short-term time-series network (LSTNet), and cross-location attention-based graph neural network (Cola-GNN).
Table 9. Ablation test result of TLSS with an input window of 15 lagged days and lead times of 1, 7, and 14 days. We use RMSE and DM-test to compare TLSS with partial versions of this model to evaluate the contribution of each component within it.
Lead Time = 1Lead Time = 7Lead Time = 14
RMSERMSERMSE
TLSS0.04160.04490.0518
TLSS w/o transfer learning0.04180.0497 ***0.0581 ***
TLSS w/o news sentiment analysis0.0427 ***0.0466 ***0.0555 ***
TLSS w/o news semantic analysis0.04170.0464 **0.0573 ***
p-values (*, **, *** indicate statistical significance at p < 0.10 , p < 0.05 , and p < 0.01 ).
Disclaimer/Publisher’s Note: The statements, opinions and data contained in all publications are solely those of the individual author(s) and contributor(s) and not of MDPI and/or the editor(s). MDPI and/or the editor(s) disclaim responsibility for any injury to people or property resulting from any ideas, methods, instructions or products referred to in the content.

