

The Impact of Climate Change on the Water Systems of the Yesil River Basin in Northern Kazakhstan
 , , ,
, , ,
Abstract
:1. Introduction
- Studying Temperature and Precipitation Dynamics: Monitoring the dynamics of temperature changes and precipitation patterns is fundamental to understanding the local climate trends. These data provide essential insights into how the climate in Northern Kazakhstan is evolving, which is critical for assessing its impact on water resources.
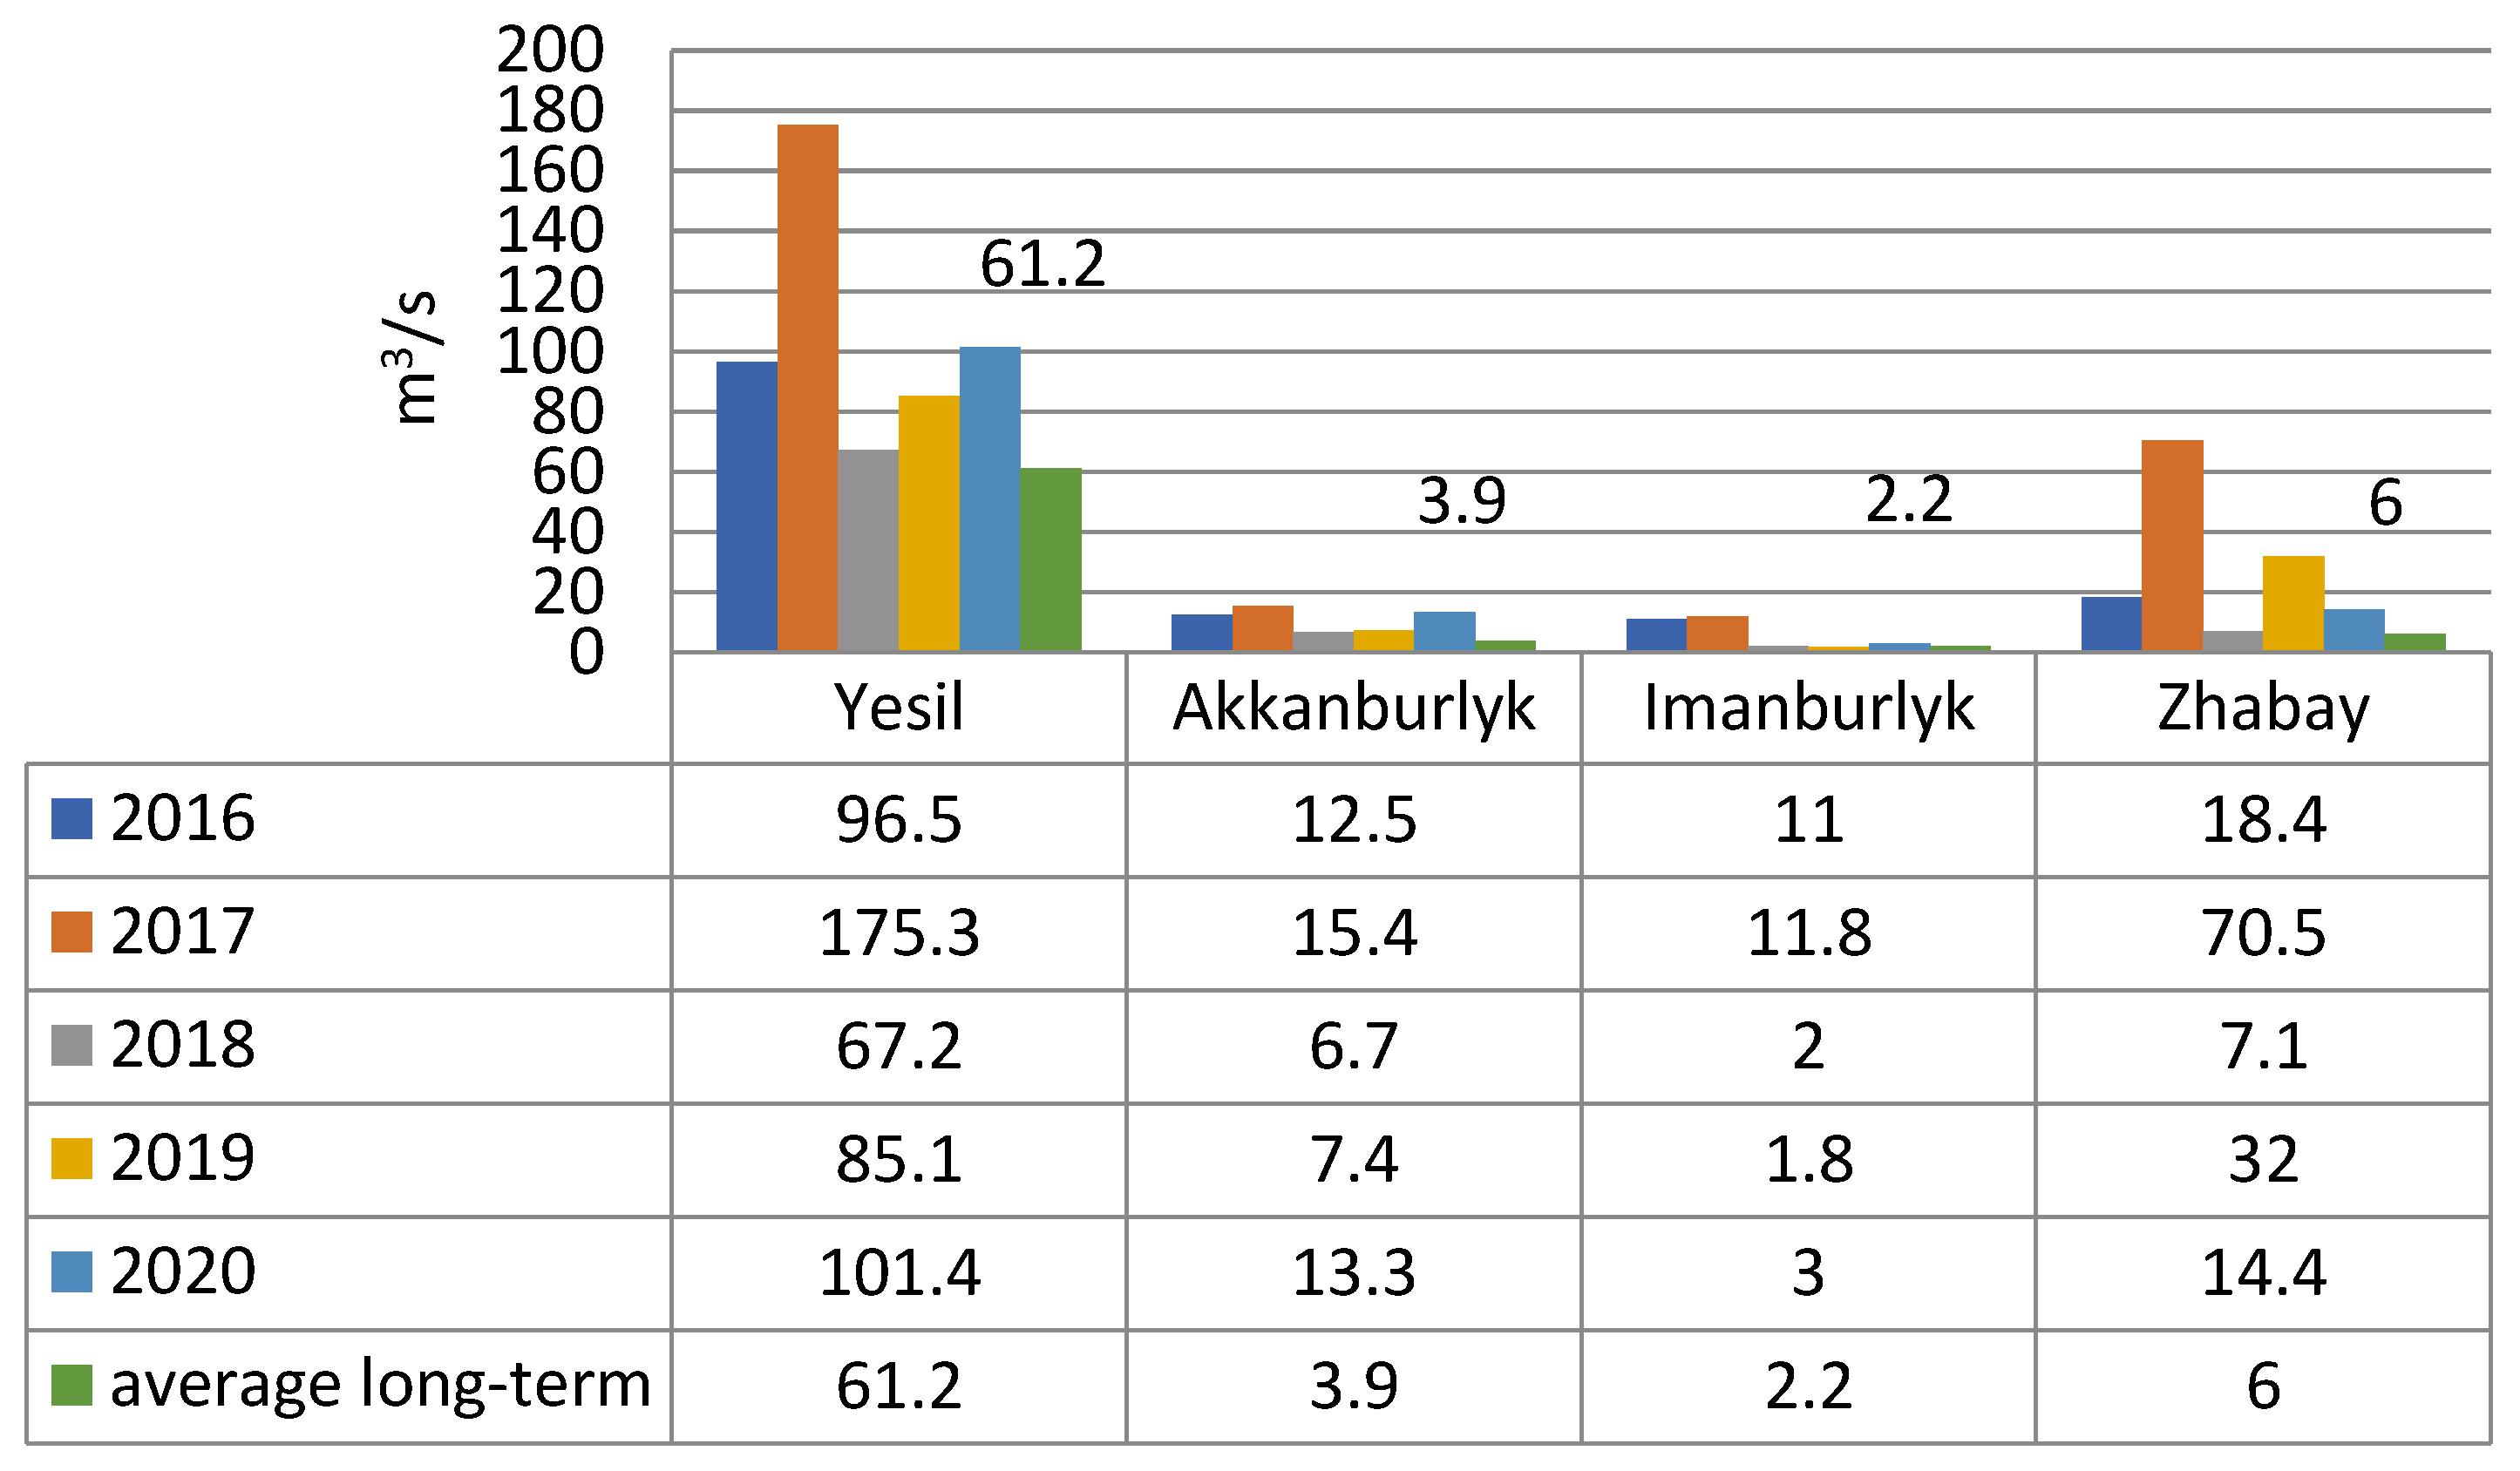
- Calculating Water Consumption: Calculating the water consumption of specific rivers in the Yesil basin, including the Yesil, Akkanburlyk, Imanburlyk, and Zhabai rivers, is essential for water resource management. This information helps in evaluating the availability and sustainability of water resources for various uses, including agriculture, industry, and domestic needs.
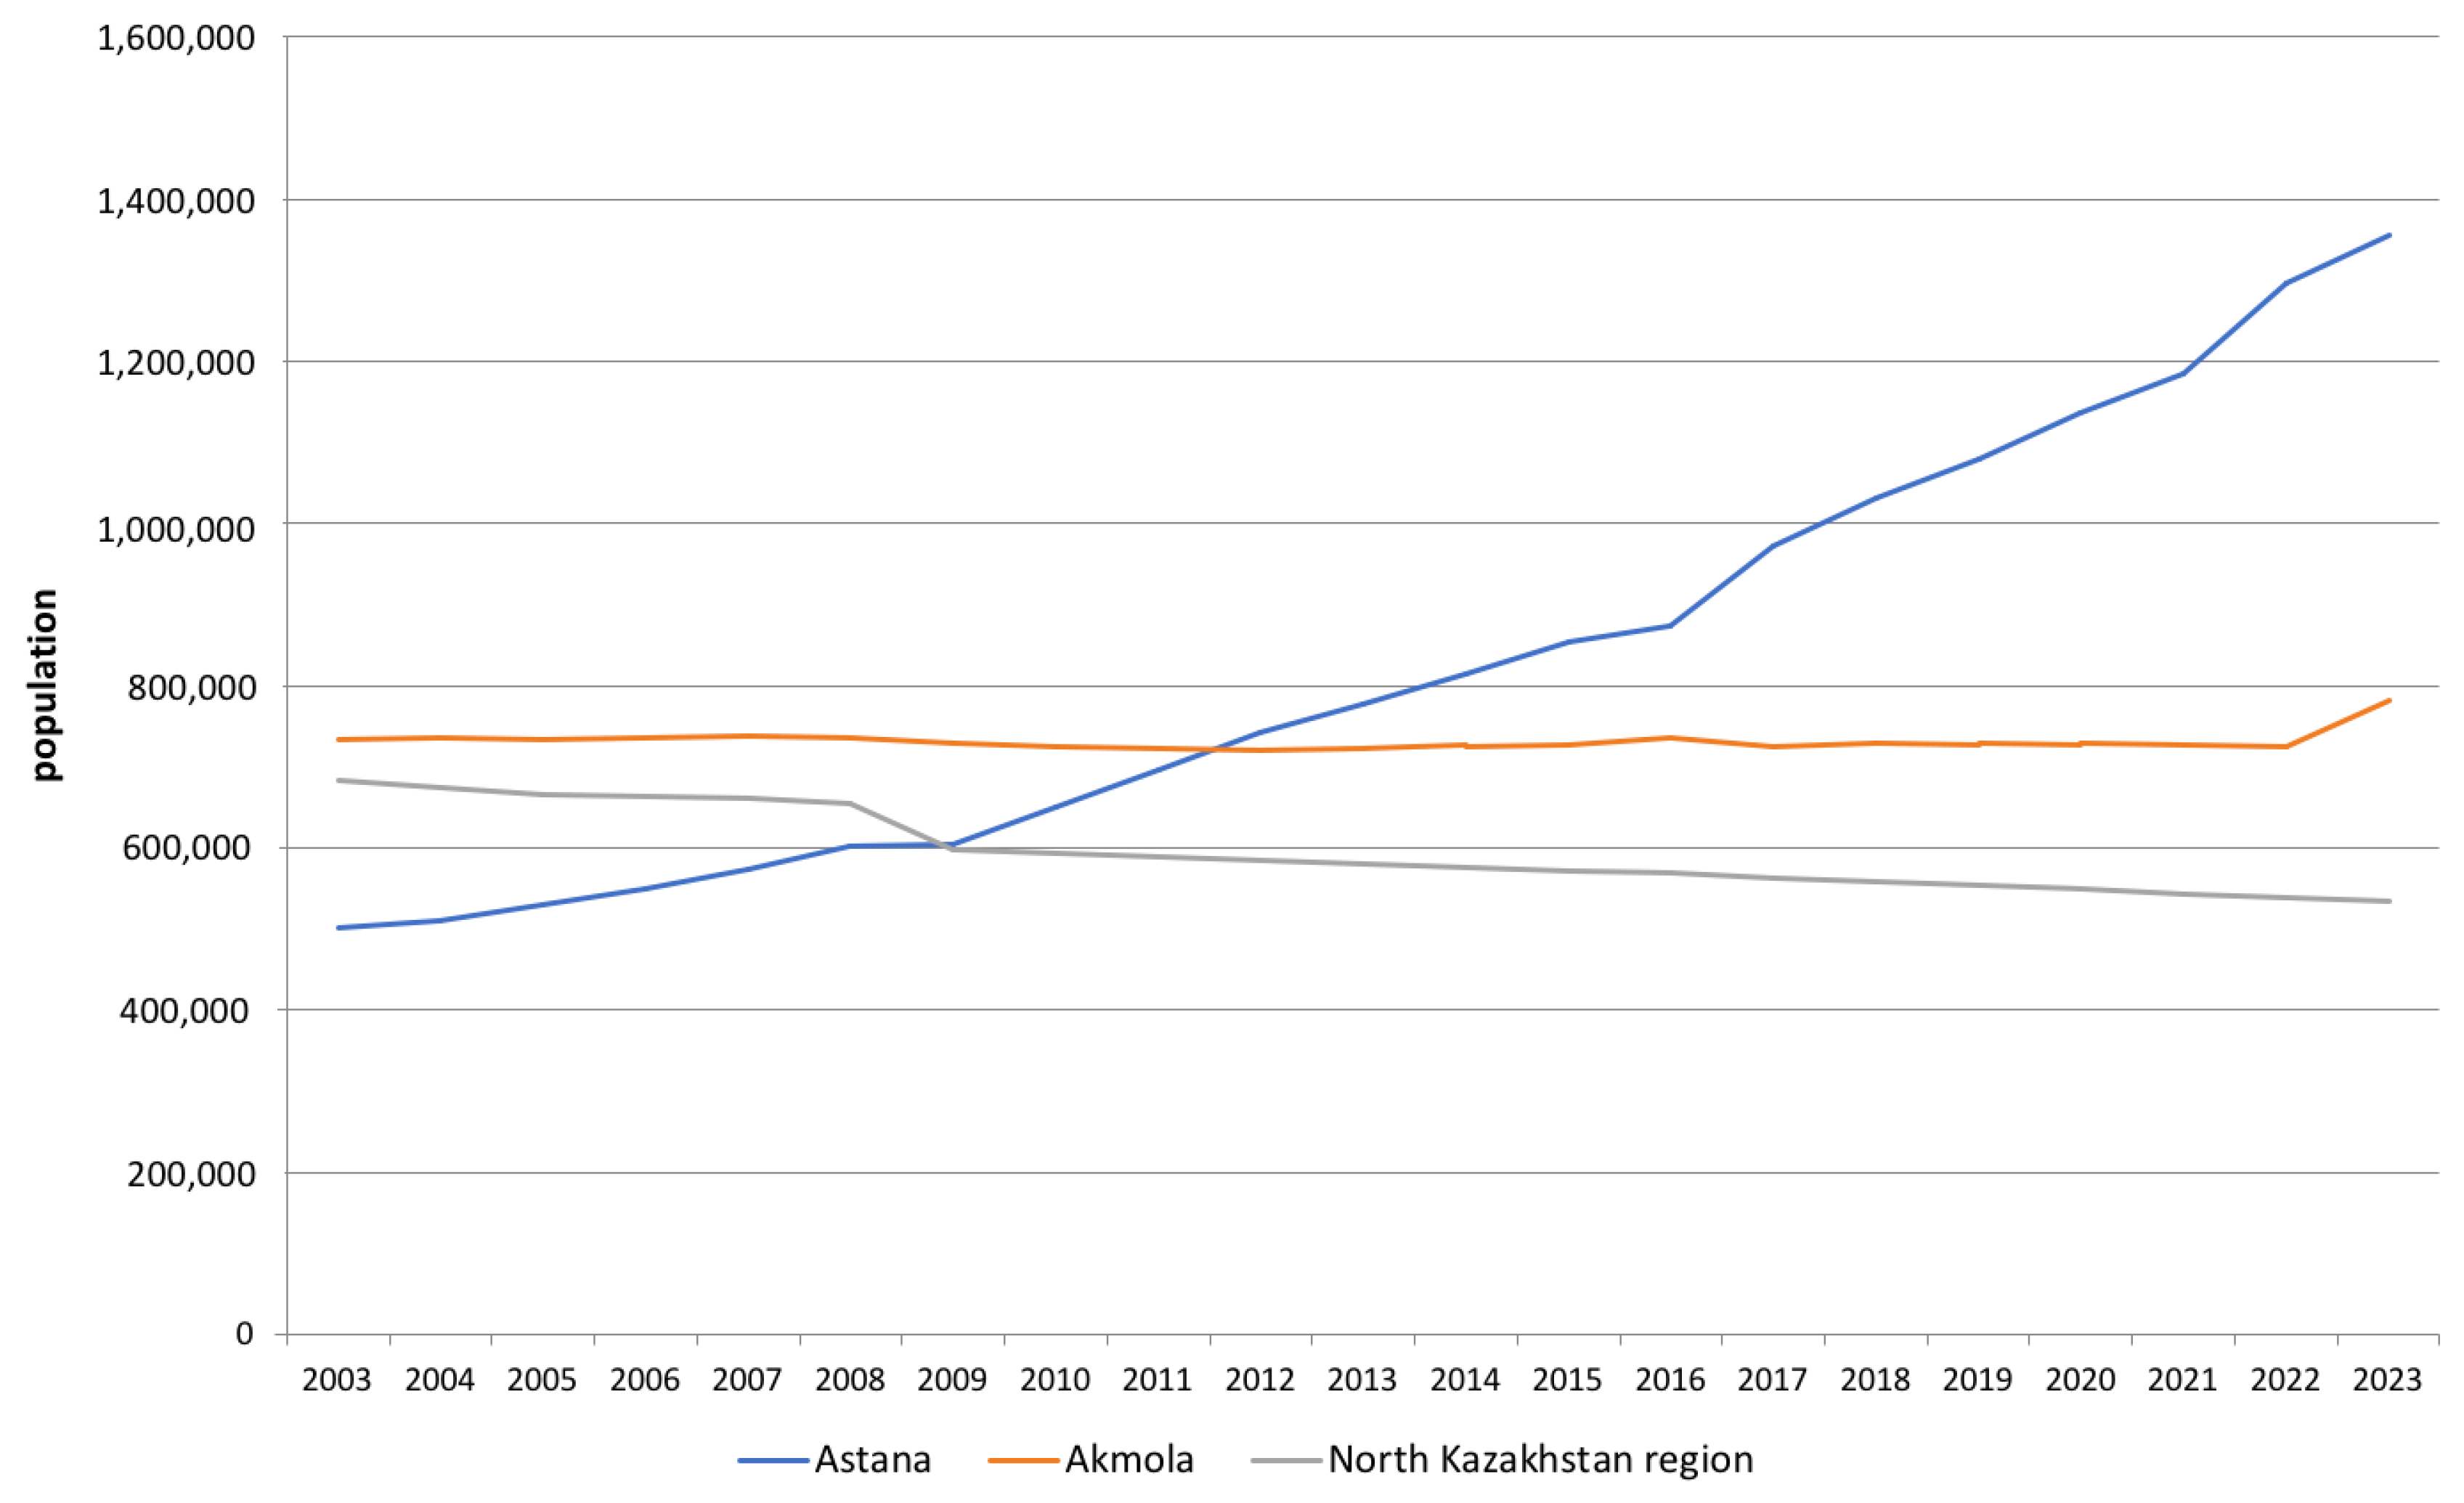
- Analyzing Population Dynamics: Examining changes in the population of the Yesil River basin is relevant as it can provide insights into the increasing demand for water resources due to demographic shifts. This analysis helps in projecting future water needs and planning for sustainable resource management.
- Considering Climate and Hydrological Scenarios: Assessing climate and hydrological indicators under different scenarios is crucial for understanding potential future changes. These scenarios allow for the development of adaptive strategies to address the impacts of climate change on water systems.
2. Materials and Methods
- -
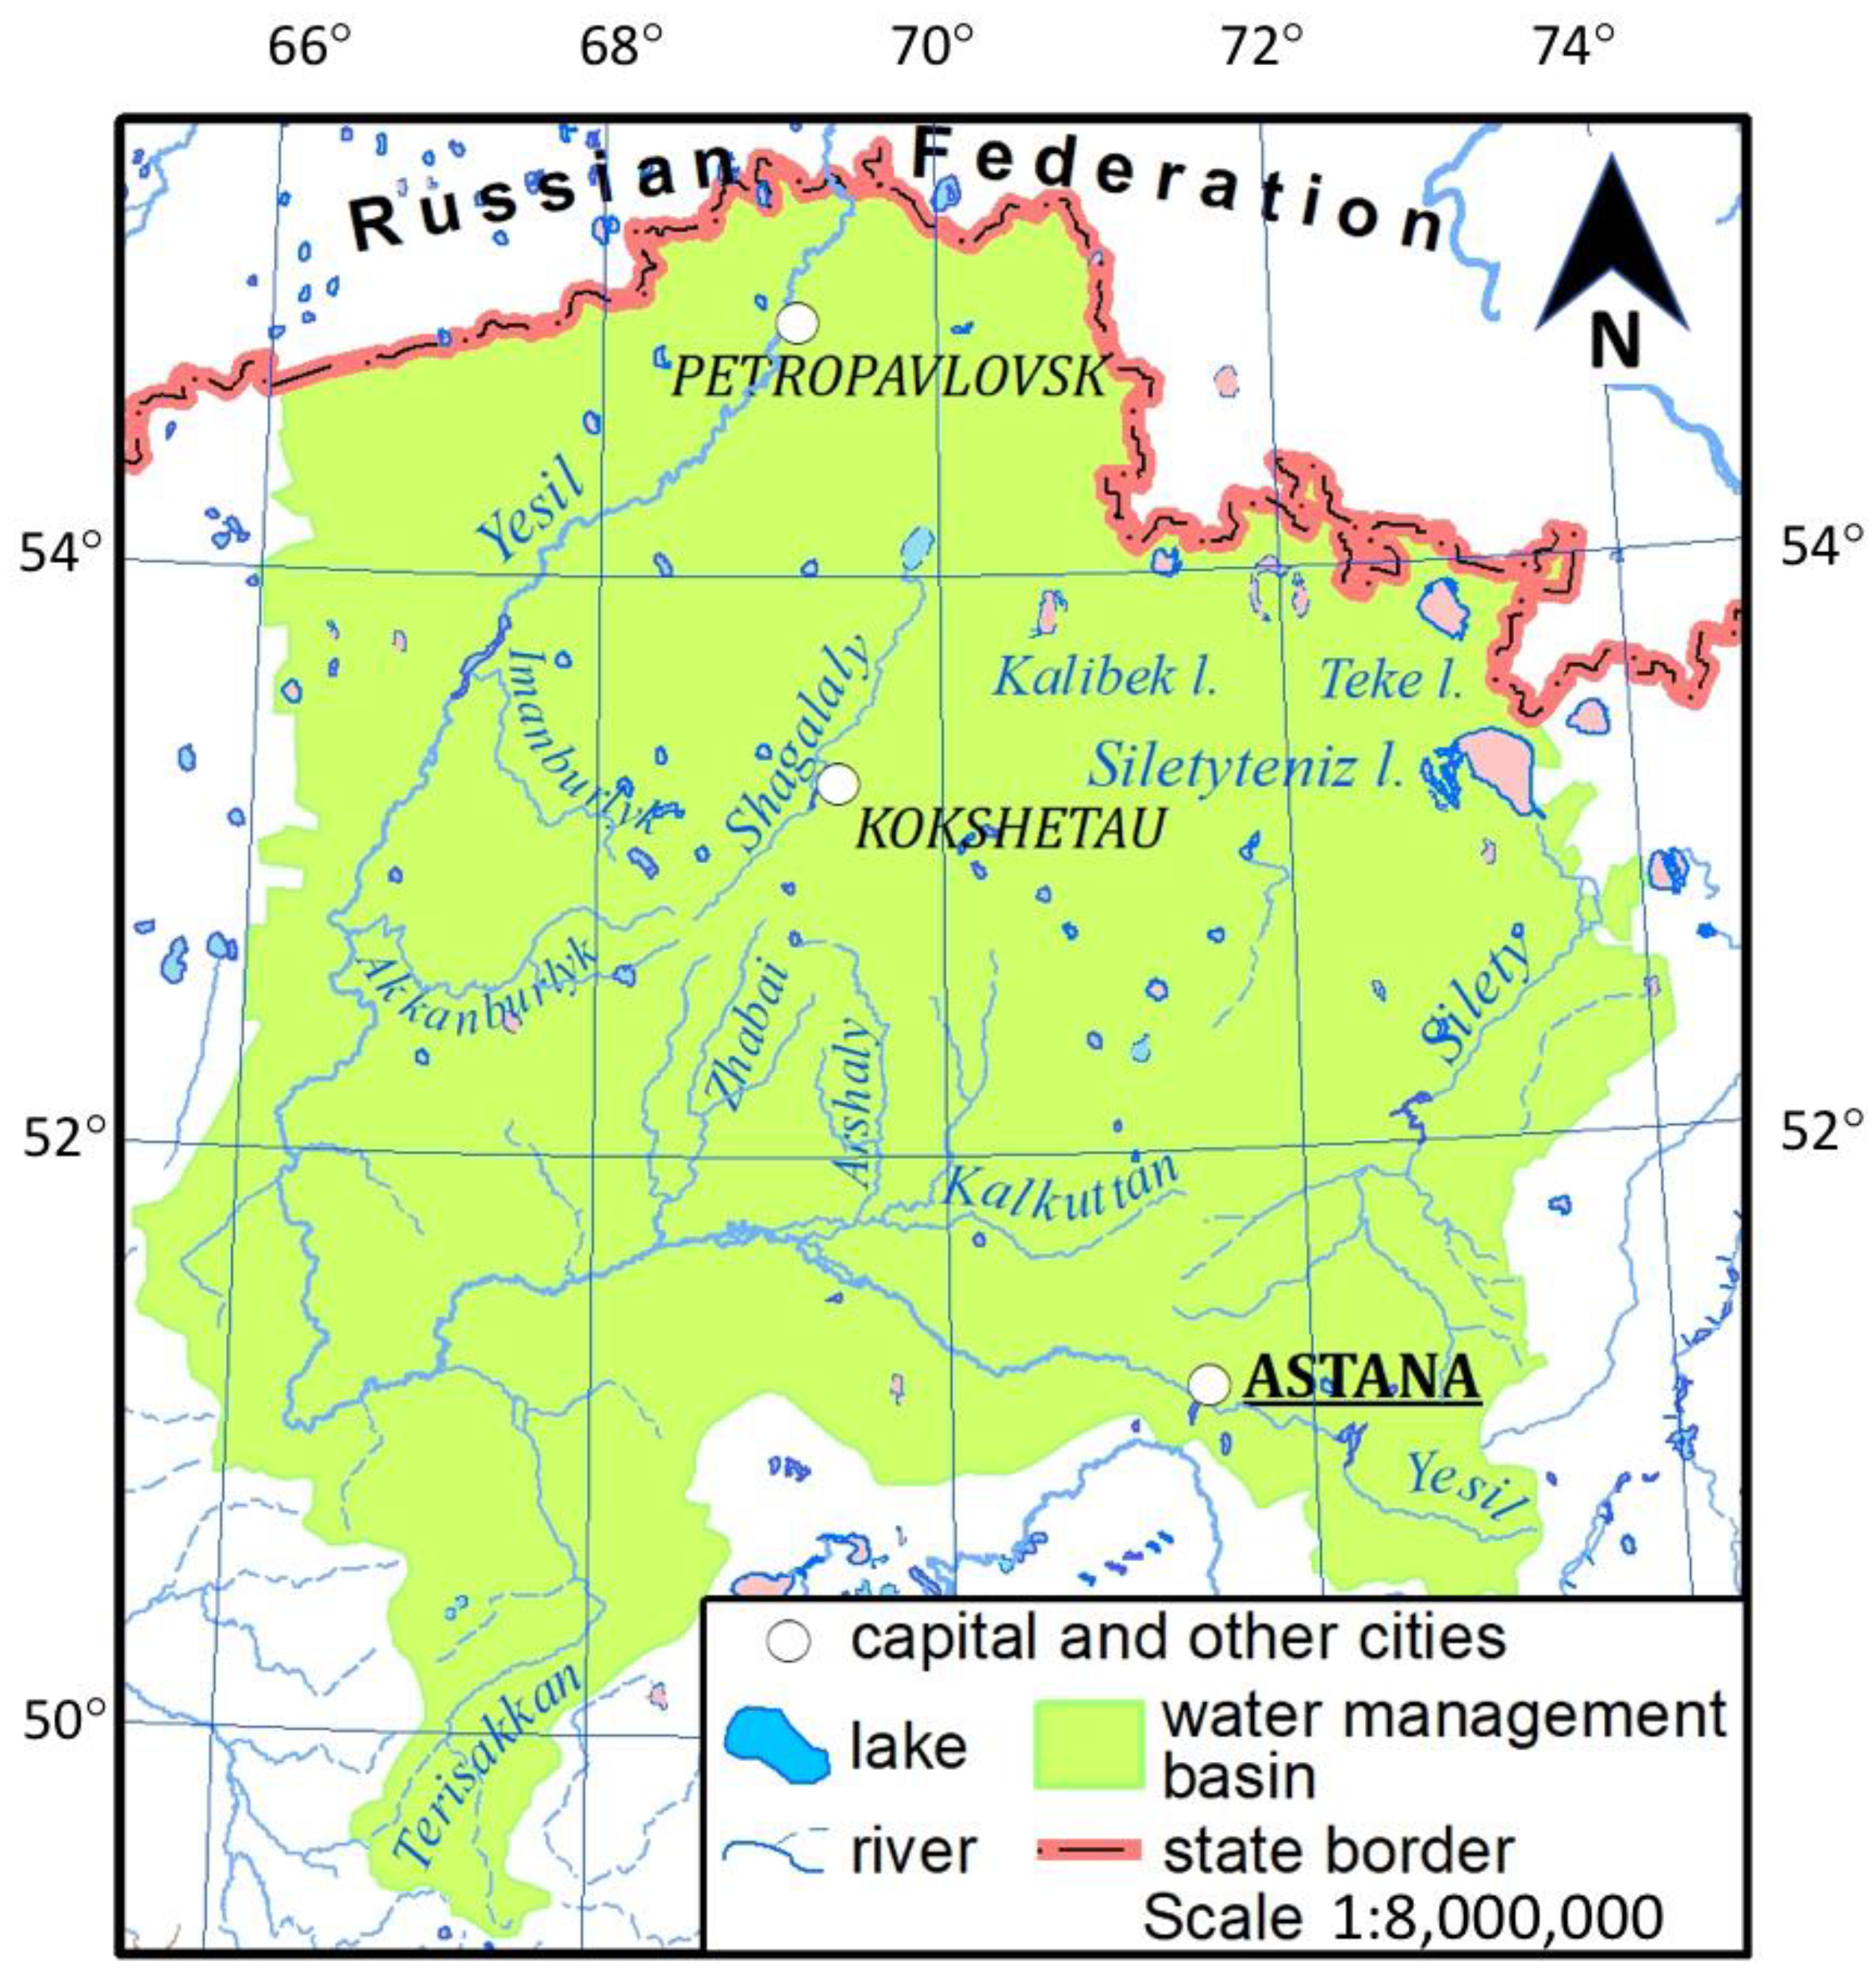
- Description of the study area: Initially, the study began with a detailed description of the geographical and environmental characteristics of the study area, which in this case is Northern Kazakhstan. This step served to establish the context for the research.
- -
- Compilation of available data from existing weather stations: The next phase involved the collection and compilation of relevant meteorological data from pre-existing weather stations within the study area. This data likely included information such as temperature, precipitation, humidity, and other pertinent climatic variables.
- -
- Calculations of water flow and runoff: Following the data compilation, calculations were carried out to determine water flow and runoff in the study area. This phase would involve the analysis of precipitation, evaporation, and other hydrological parameters to understand the dynamics of water flow within the region.
- -
- Determination of monthly and annual averages: To gain a comprehensive understanding of the climate and hydrological patterns, the research included the determination of monthly and annual averages. This would allow for the identification of seasonal variations and long-term trends in the study area’s environmental conditions.
3. Results
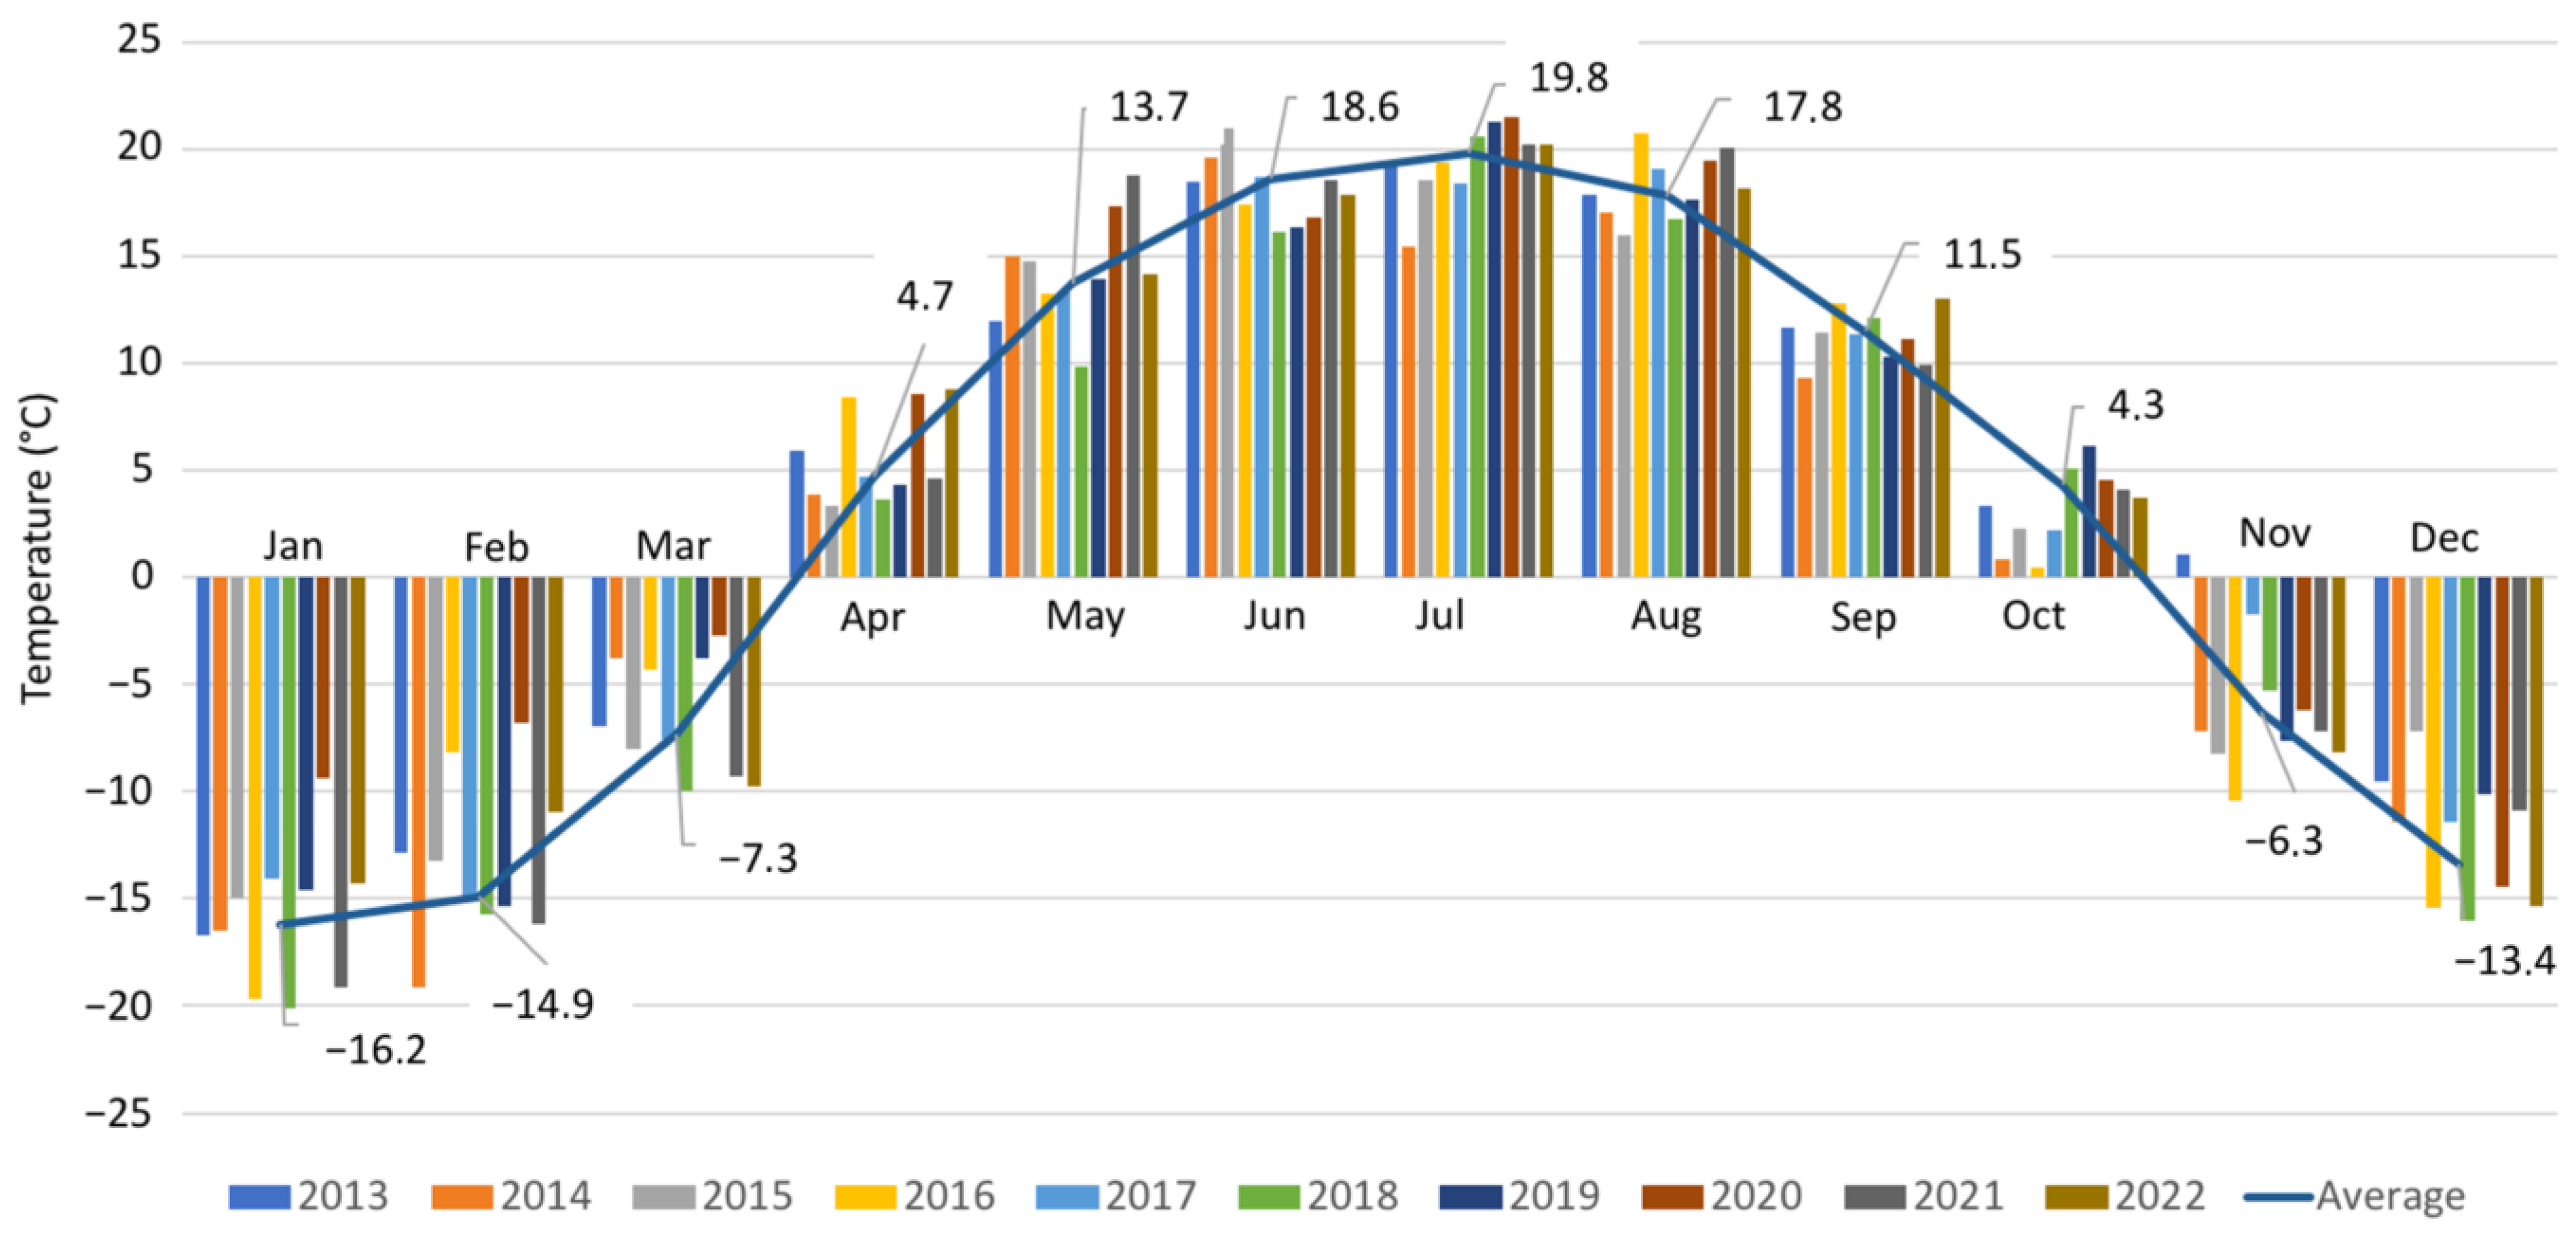
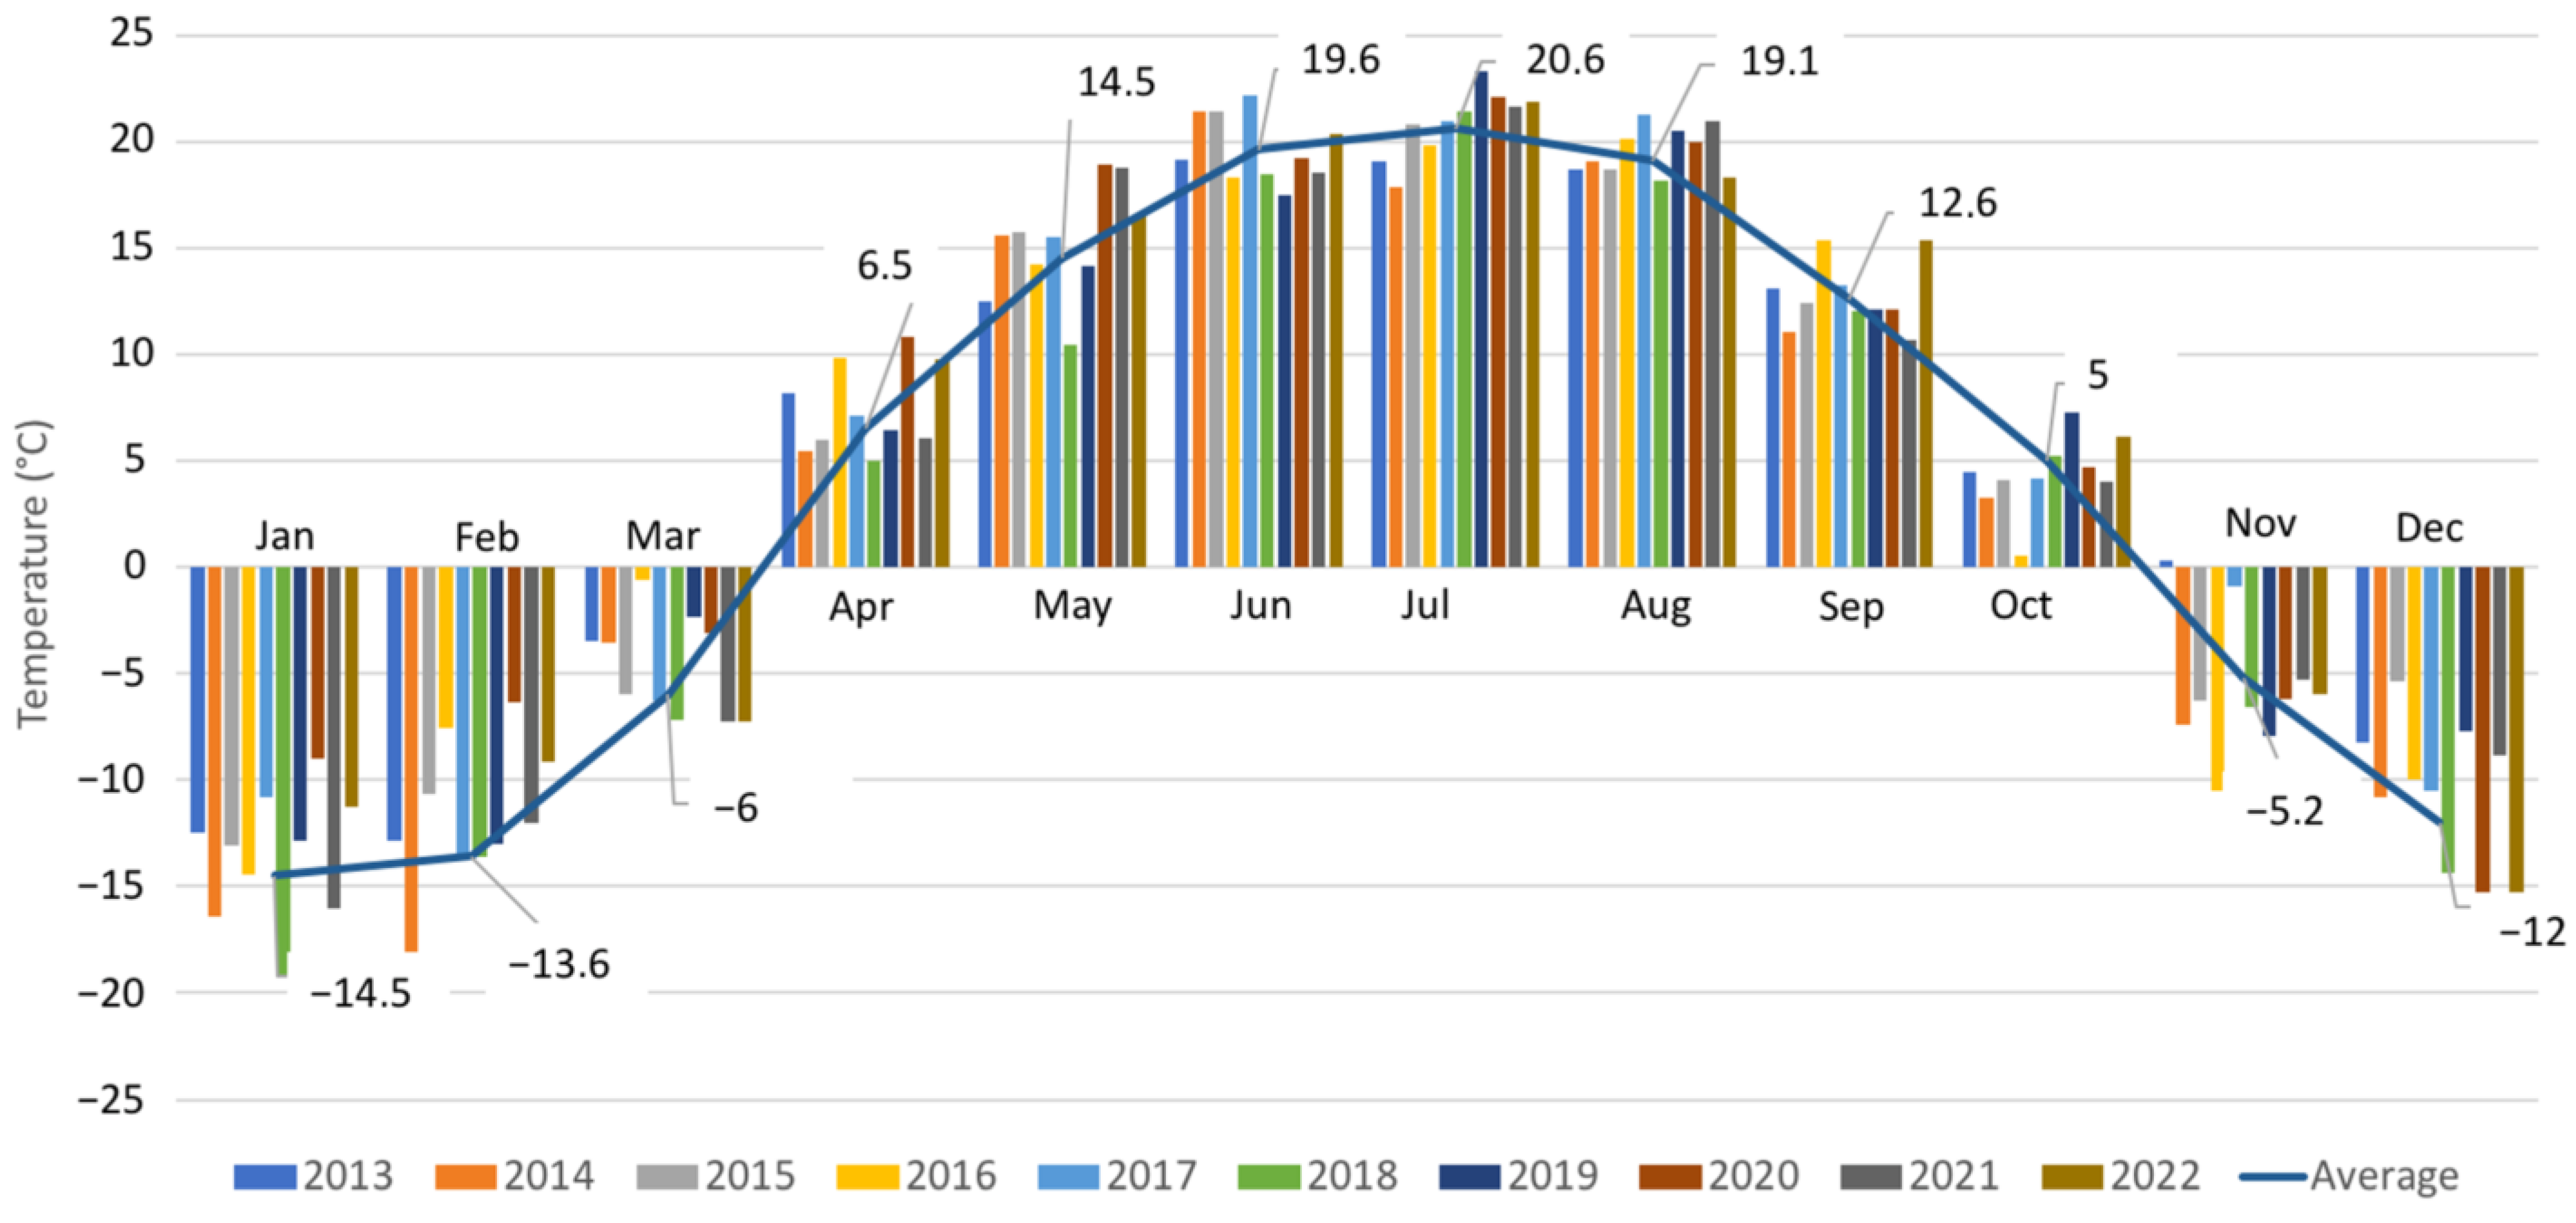
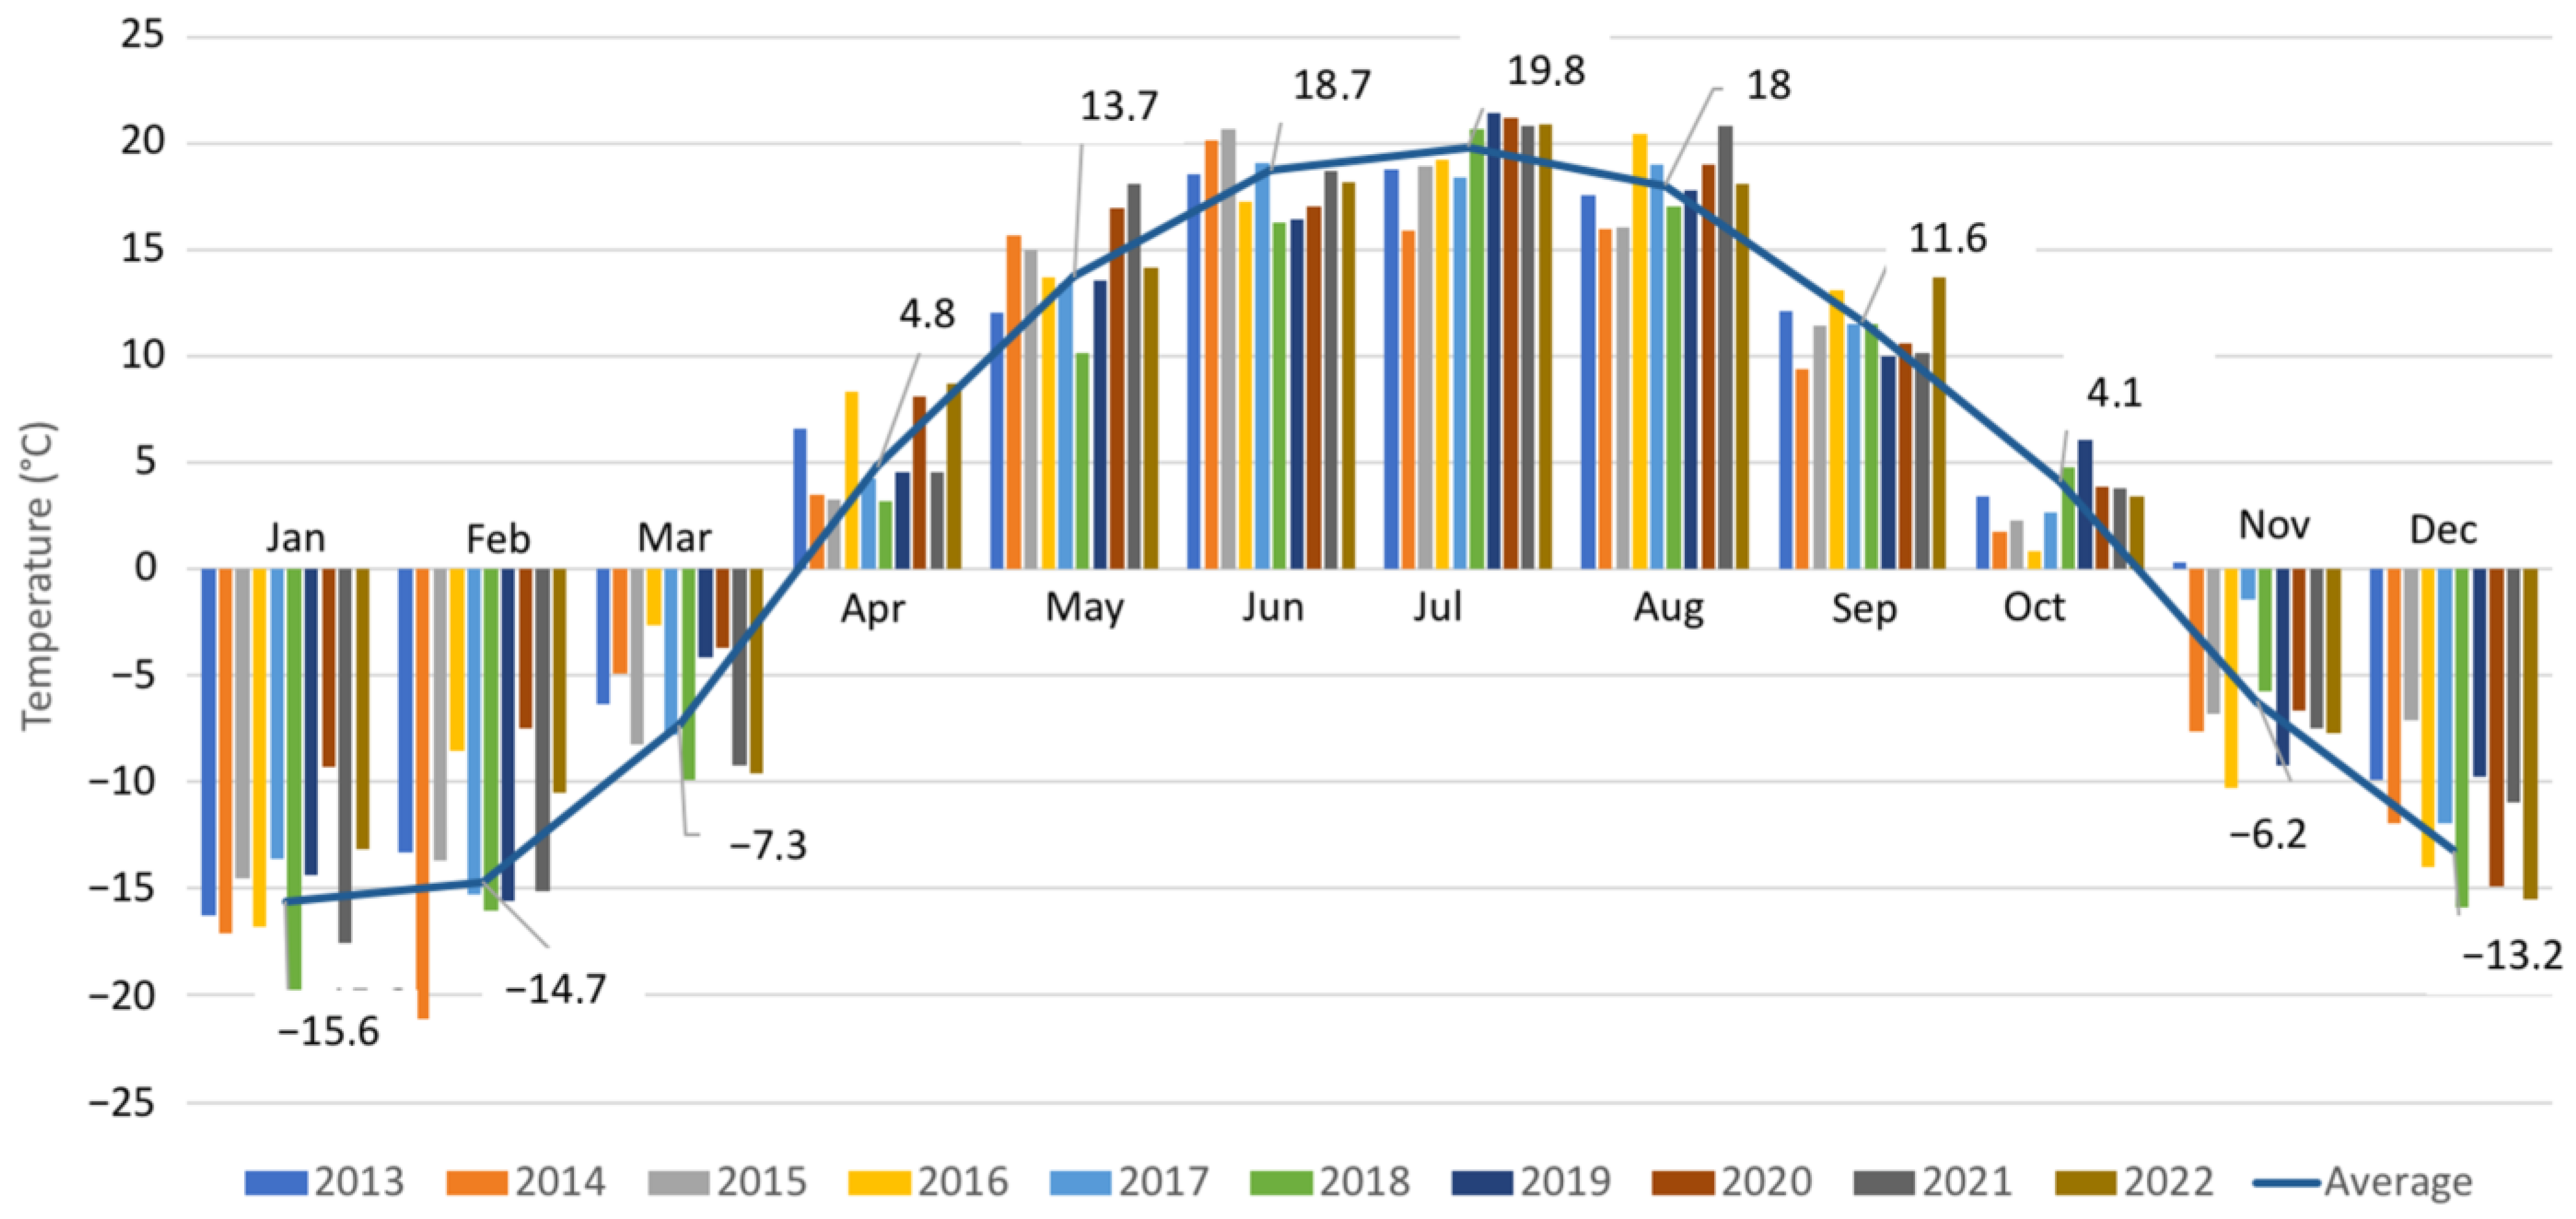
3.1. Weather Stations Data Analysis
3.2. Statistical Analysis
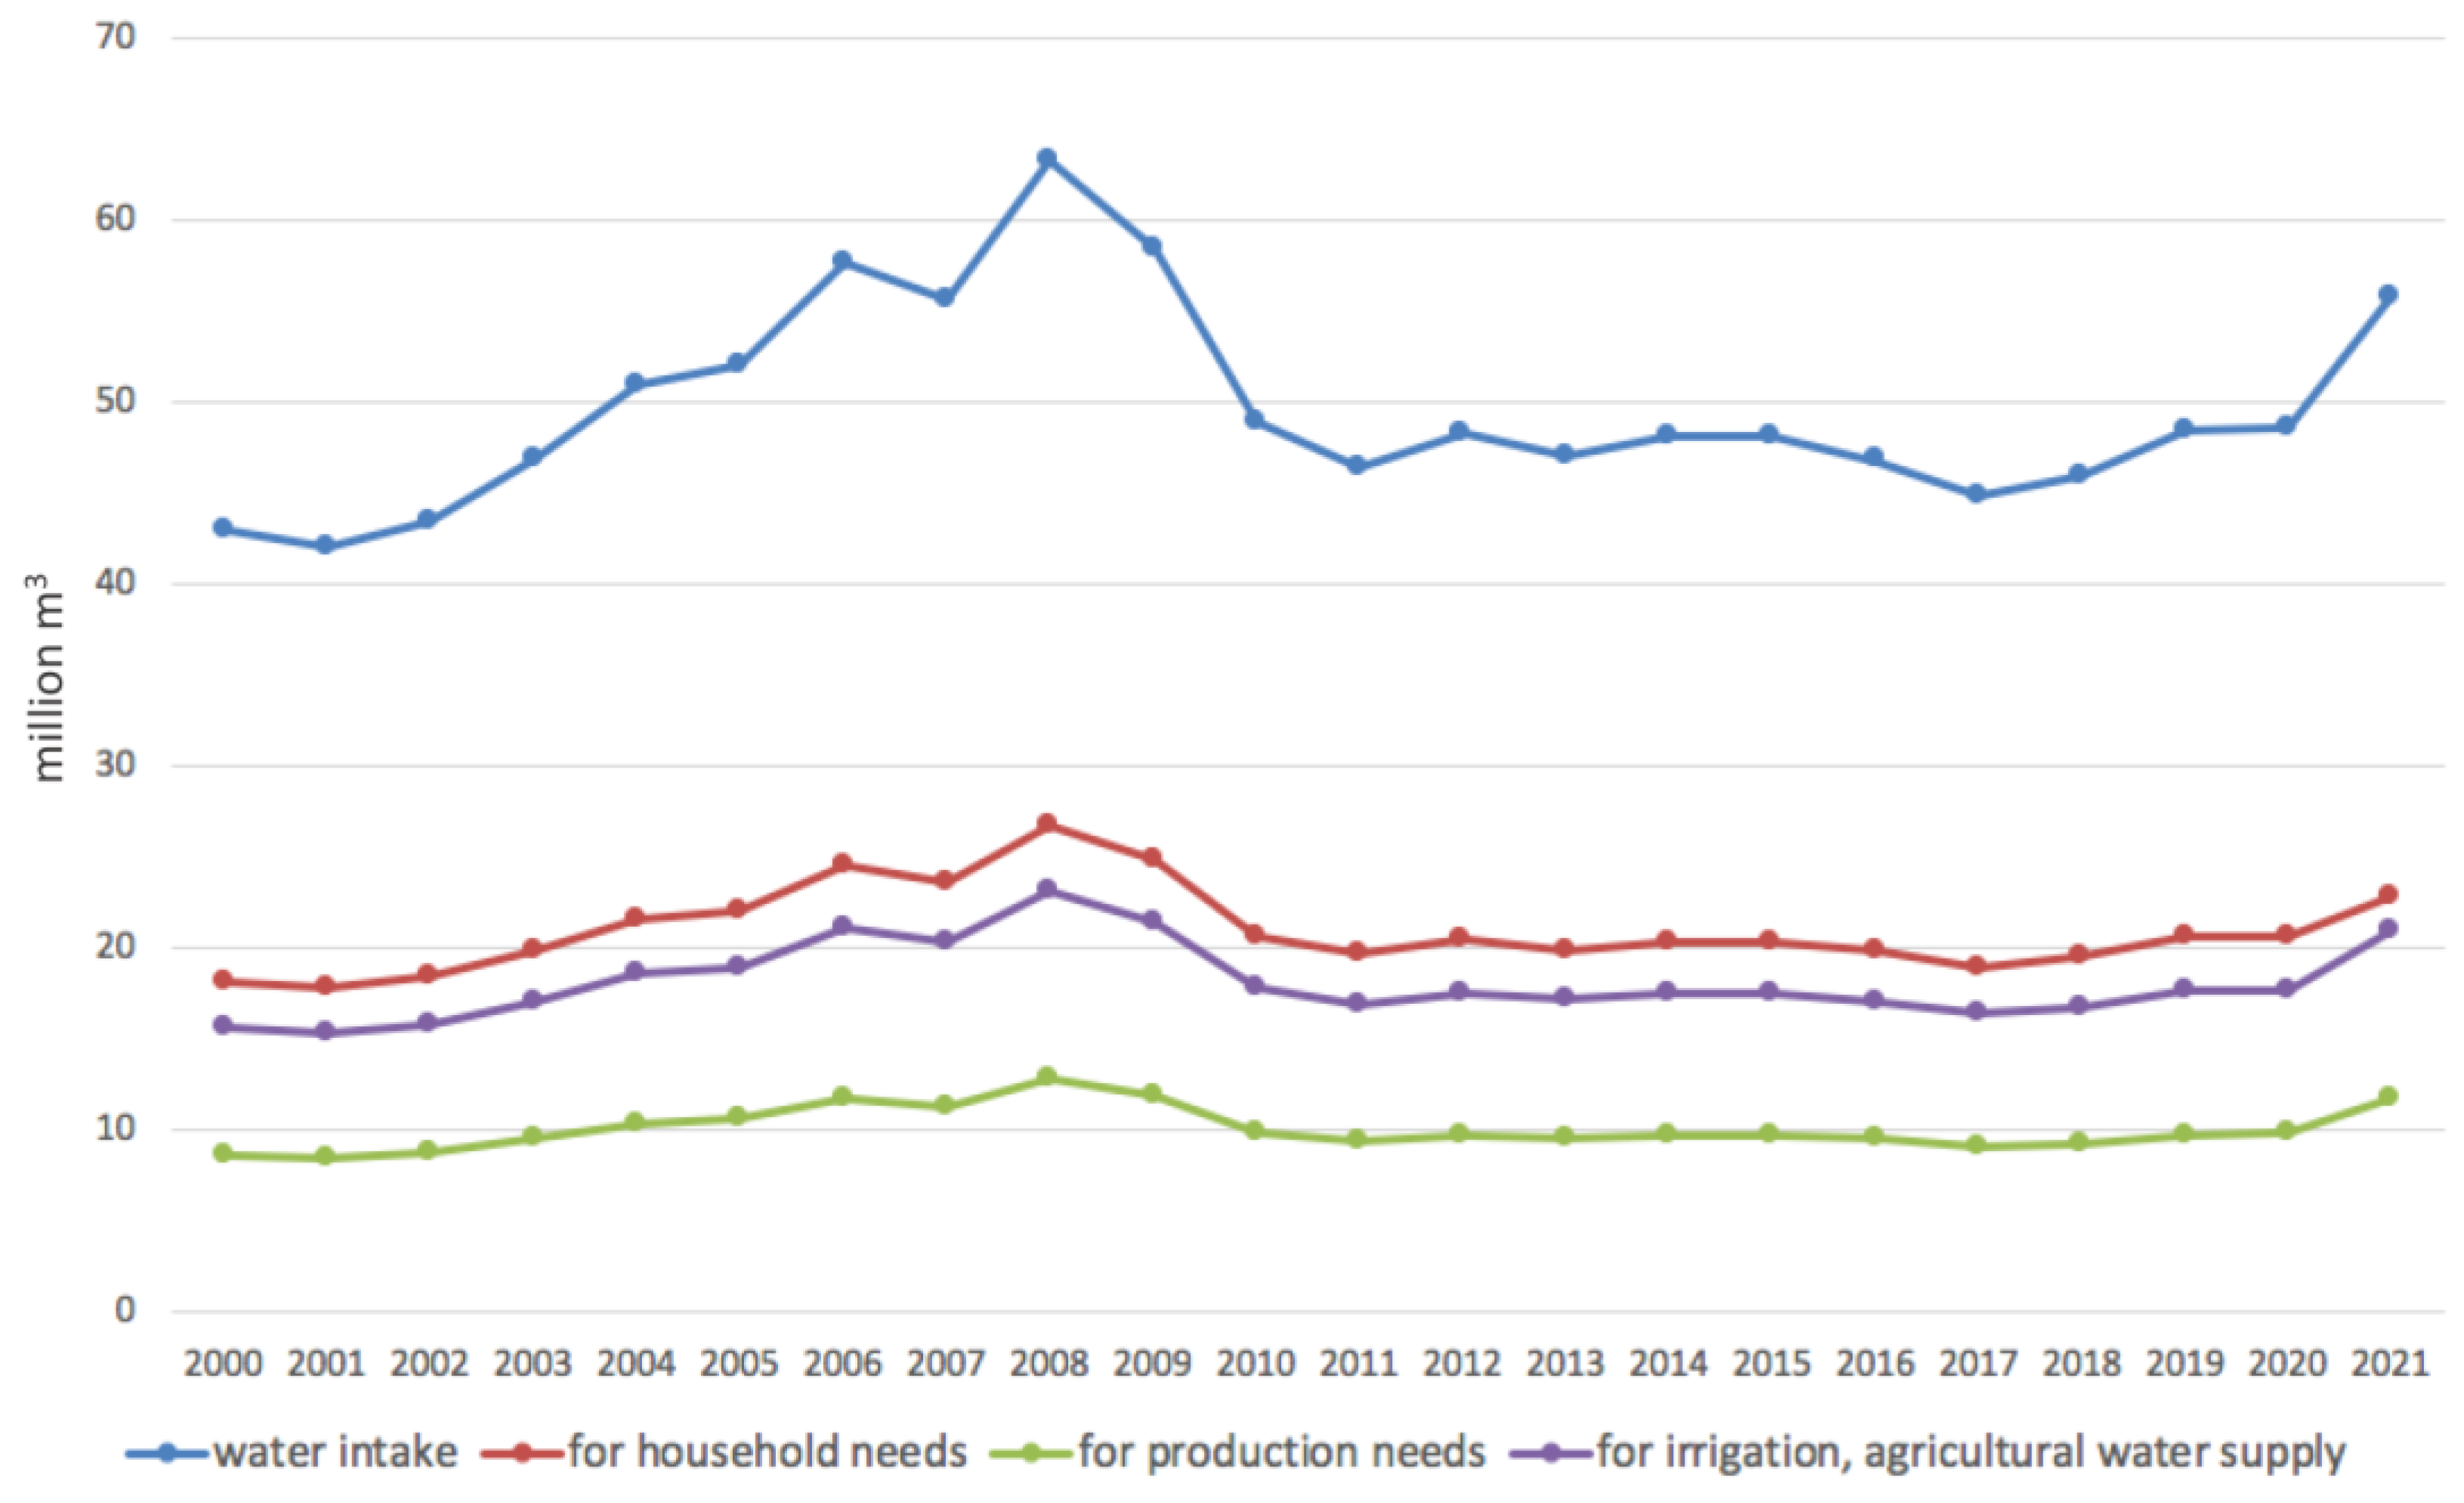
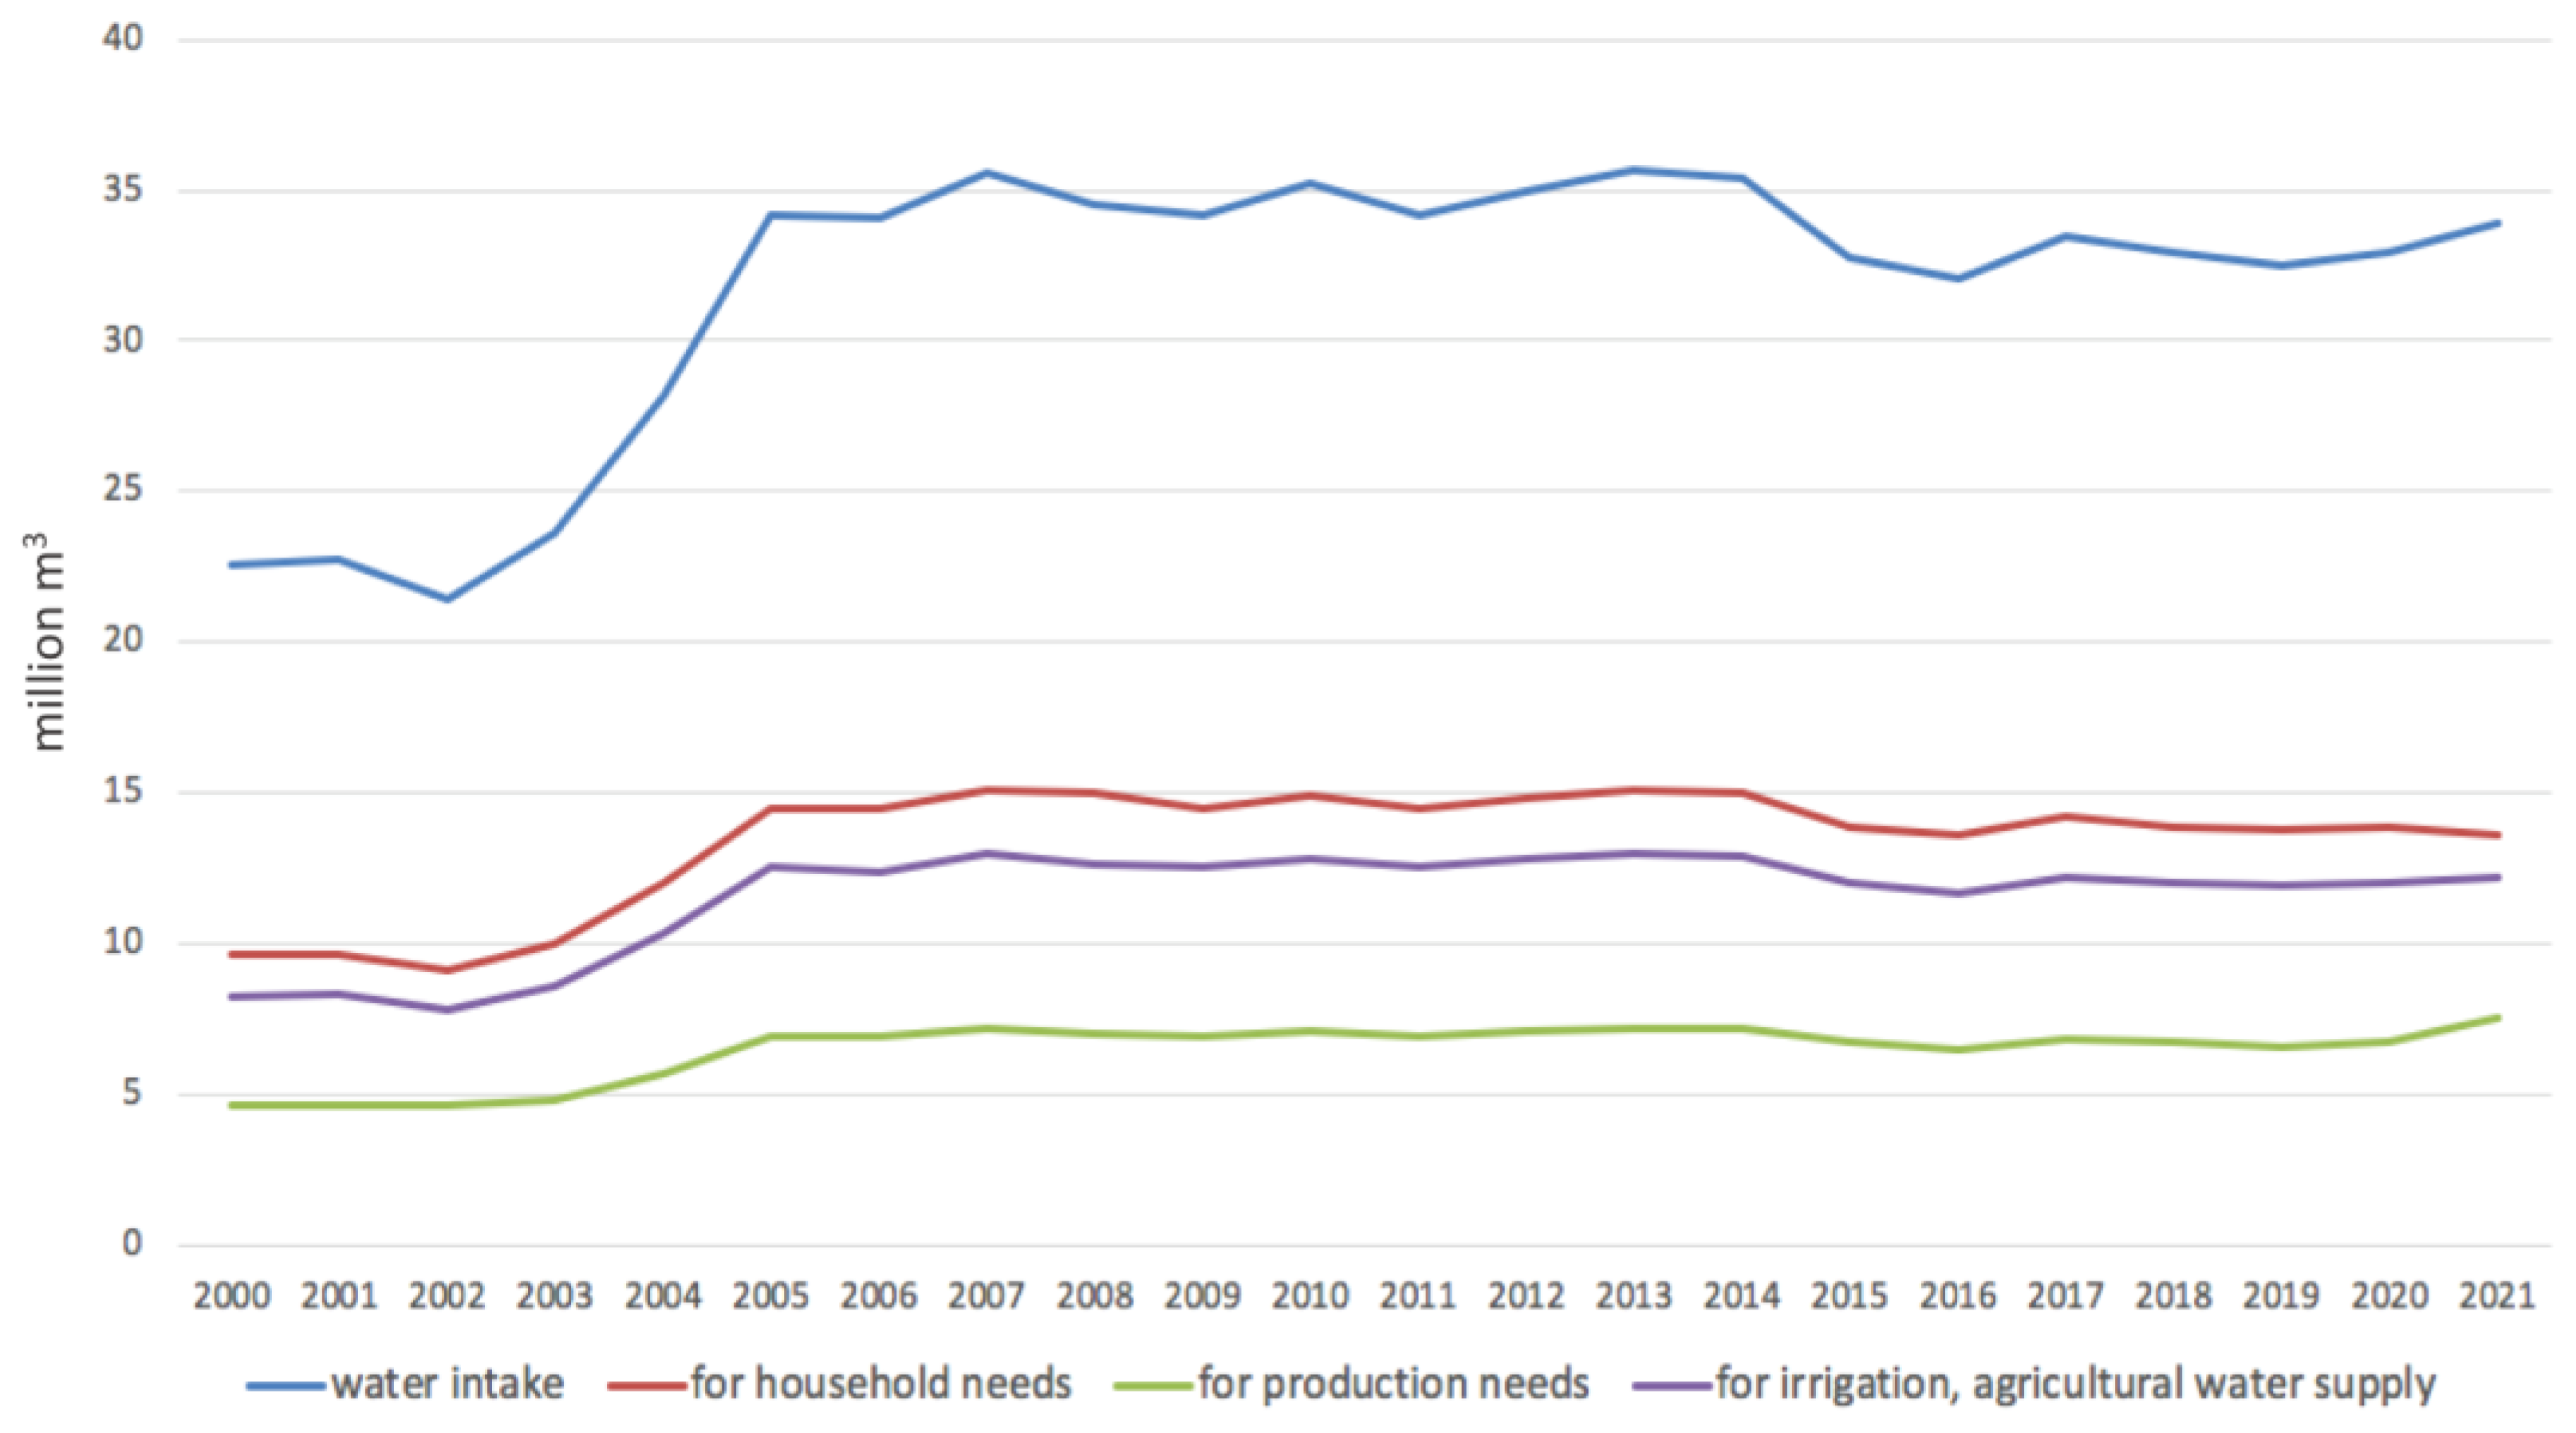
3.3. Socioeconomic Factors
- -
- Industry: 20.3%
- -
- Irrigated agriculture: 22.0%
- -
- Agricultural water supply: 14.5%
- -
- Fisheries and other industries: 0.8%
4. Discussion
5. Conclusions
Author Contributions
Funding
Data Availability Statement
Conflicts of Interest
References
- World Meteorological Organization (WMO). WMO Statement on the State of the Global Climate in 2018; WMO: Geneva, Switzerland, 2018. [Google Scholar]
- IPCC. Climate Change 2021: The Physical Science Basis. Contribution of Working Group I to the Sixth Assessment Report of the Intergovernmental Panel on Climate Change; Masson-Delmotte, V., Zhai, P., Pirani, A., Connors, S.L., Péan, C., Berger, S., Caud, N., Chen, Y., Goldfarb, L., Gomis, M.I., et al., Eds.; Cambridge University Press: Cambridge, UK; New York, NY, USA, 2021; p. 2391. [Google Scholar]
- Blunden, J.; Boyer, T.; Bartow-Gillies, E. State of the Climate in 2022. Bull. Am. Meteorol. Soc. 2023, 104, S1–S501. [Google Scholar] [CrossRef]
- Vilesov, E.N.; Naumenko, A.A.; Veselova, L.K.; Aubekerov, B.J. Physical Geography of Kazakhstan; Naumenko, A.A., Ed.; Textbook; Kazak: Almaty, Kazakhstan, 2012; 362p. [Google Scholar]
- Ministry of Ecology, Geology and Natural Resources of the Republic of Kazakhstan; Research Center of RSE “Kazhydromet”. Annual Bulletin of Monitoring the State and Climate Change of Kazakhstan: 2021; Research Center of RSE “Kazhydromet”: Astana, Kazakhstan, 2022; 76p. [Google Scholar]
- Baikenova, G.E.; Baranovskaya, N.V.; Kakabayev, A.A.; Bersimbaev, R.I.; Korogod, N.P.; Narkovich, D.V.; Kurovskaya, V.V. Indicators of the state of the ecosystems based on the hair compositions of the northern Kazakhstan residents. Bull. Tomsk. Polytech. Univ. Geo Assets Eng. 2021, 332, 148–158. [Google Scholar]
- Esserkepova, I. (Ed.) Kazakhstan’s Second National Communication to the Conference of the Parties to the United Nations Framework Convention on Climate Change; Ministry of Environment Protection: Astana, Kazakhstan, 2009; ISBN 978-601-7060-41-1. Available online: https://unfccc.int/resource/docs/natc/kaznc2e.pdf (accessed on 1 November 2023).
- Paptsov, A.G.; Shelamova, N.A. Global Food Security in the Conditions of Climate Change: Monograph; RAS: Moscow, Russia, 2018; p. 132. [Google Scholar]
- Genina, M.; Zuma, L.B.; Umirbekov, A.; Isaeva, G.; Musagazhinova, A. Analysis of Activities in the Field of Adaptation to Climate Change in Central Asia; Technical Report; Regional Environmental Center for Central Asia (CAREC): Almaty, Kazakhstan, 2011; 159p, Available online: https://carececo.org/upload/27.pdf (accessed on 1 November 2023)Technical Report.
- Kozhakhmetova, E.A.; Kozhakhmetov, P.Z.; Petrova, E.E. Climate change and its impact on the sustainable development of agriculture in Kazakhstan. In Proceedings of the International Scientific Conference on Regional Problems of Hydrometeorology and Environmental Monitoring, Kazan, Russia, 2–4 October 2012; pp. 149–150. [Google Scholar]
- Lawal, I.M.; Bertram, D.; White, C.J.; Kutty SR, M.; Hassan, I.; Jagaba, A.H. Application of Boruta algorithms as a robust methodology for performance evaluation of CMIP6 general circulation models for hydro-climatic studies. Theor. Appl. Climatol. 2023, 153, 113–135. [Google Scholar] [CrossRef]
- Scientific Information Center of the Interstate Coordinating Water Management Commission of Central Asia. Climate Change: COP 27 and after; SIC ICWC: Tashkent, Uzbekistan, 2021; 56p. [Google Scholar]
- Ghosh, S.; Chatterjee, S.; Shiva Prasad, G.; Pal, P. Effect of Climate Change on Aquatic Ecosystem and Production of Fisheries. In Inland Waters—Dynamics and Ecology; IntechOpen: London, UK, 2021. [Google Scholar] [CrossRef]
- Weiskopf, S.R.; Rubenstein, M.A.; Crozier, L.G.; Gaichas, S.; Griffis, R.; Halofsky, J.E.; Hyde, K.J.W.; Morelli, T.L.; Morisette, J.T.; Muñoz, R.C.; et al. Climate change effects on biodiversity, ecosystems, ecosystem services, and natural resource management in the United States. Sci. Total Environ. 2020, 733, 137782. [Google Scholar] [CrossRef] [PubMed]
- Carter, S.L.; ALynch, J.; Myers, B.J.E.; Rubenstein, M.A.; Thompson, L.M. Hypotheses from recent assessments of climate impacts to biodiversity and ecosystems in the United States. In Handbook of Climate Change and Biodiversity; Leal Filho, W., Barbir, J., Preziosi, R., Eds.; Springer International: Basel, Switzerland, 2019; pp. 355–375. [Google Scholar]
- Borggaard, D.; Dick, D.; Star, J.; Alexander, M.; Bernier, M.; Collins, M.; Crocker, J.; Damon-Randall, K.; Dudley, R.; Griffis, R.; et al. Atlantic Salmon (Salmo Salar) Climate Scenario Planning Pilot Draft Workshop Summary; NOAA Fisheries Greater Atlantic Region Office: Gloucester, MA, USA, 2019. [Google Scholar]
- Staudinger, M.D.; Lynch, A.J.; Gaichas, S.K.; Fox, M.G.; Gibson-Reinemer, D.; Langan, J.A.; Teffer, A.K.; Thackeray, S.J.; Winfield, I.J. How Does Climate Change Affect Emergent Properties of Aquatic Ecosystems? Fisheries 2021, 46, 423–441. [Google Scholar] [CrossRef]
- Alimkulov, S.K.; Tursunova, A.A.; Saparova, A.A. Resources of the River Flow of Kazakhstan in the Conditions of Future Climatic and Anthropogenic Changes. Hydrometeorol. Ecol. 2021, 1. Available online: https://cyberleninka.ru/article/n/resursy-rechnogo-stoka-kazahstana-v-usloviyah-buduschih-klimaticheskih-i-antropogennyh-izmeneniy (accessed on 22 June 2023).
- Gagloeva, A.E. Influence of climate change on water resources of Central Asia. Water resources of Central Asia and their use: Mater. In Proceedings of the International Scientific and Practical Conference Dedicated to Summing Up the Results of the UN Decade “Water for Life”, Almaty, Kazakhstan, 22–23 September 2016; pp. 97–302. [Google Scholar]
- Shahgedanova, M.; Afzal, M.; Severskiy, I.; Usmanova, Z.; Saidaliyeva, Z.; Kapitsa, V.; Kasatkin, N.; Dolgikh, S. Changes in the mountain river discharge in the northern Tien Shan since the mid-20-th Century: Results from the analysis of a homogeneous daily streamflow data set from seven catchments. J. Hydrol. 2018, 564, 1133–1152. [Google Scholar] [CrossRef]
- Valjarević, A.; Milanović, M.; Gultepe, I.; Filipović, D.; Lukić, T. Updated Trewartha climate classification with four climate change scenarios. Geogr. J. 2022, 188, 506–517. [Google Scholar] [CrossRef]
- Shulembayeva, K.; Rodrigo-Ilarri, J.; Rodrigo-Clavero, M.-E.; Khussainov, A.; Kakabayev, A.; Khussainova, R. Assessment of the Hydrophysical and Hydrochemical Characteristics of Lake Burabay (Akmola Region, North Kazakhstan). Sustainability 2023, 15, 11788. [Google Scholar] [CrossRef]
- Serikbay, N.T.; Tillakarim, T.A.; Rodrigo-Ilarri, J.; Rodrigo-Clavero, M.-E.; Duskayev, K.K. Evaluation of Reservoir Inflows Using Semi-Distributed Hydrological Modeling Techniques: Application to the Esil and Moildy Rivers’ Catchments in Kazakhstan. Water 2023, 15, 2967. [Google Scholar] [CrossRef]
- Salikova, N.S.; Rodrigo-Ilarri, J.; Alimova, K.K.; Rodrigo-Clavero, M.-E. Analysis of the Water Quality of the Ishim River within the Akmola Region (Kazakhstan) Using Hydrochemical Indicators. Water 2021, 13, 1243. [Google Scholar] [CrossRef]
- Zaikov, B.D. Average Runoff and Its Distribution Per Year on the Territory of the USSR; Publishing House and 2nd Typolitogr.: Moscow, Russia; Hydrometeoizdat: Leningrad, Russia, 1946; 148p. [Google Scholar]
- Lvovich, M.I. Experience of Classification of Rivers of the USSR; State Hydrological Institute: Moscow, Russia, 1938. [Google Scholar]
- Uryvaeva, V.A. Surface Water Resources of Virgin and Fallow Lands Development Areas. Issue 1, Akmola Region; Hydrometeoizdat: Leningrad, Russia, 1958; 789p. [Google Scholar]
- Karakus, P. Investigation of Meteorological Effects on Çivril Lake, Turkey, with Sentinel-2 Data on Google Earth Engine Platform. Sustainability 2023, 15, 13398. [Google Scholar] [CrossRef]
- Medeu, A.R.; Malkovsky, I.M.; Toleubaeva, L.S. Water Resources of Kazakhstan: Assessment, Forecast, Management. In Renewable Surface Water Resources of Western, Northern, Central and Eastern Kazakhstan; Galperin, R.I., Ed.; Arko LLP: Almaty, Kazakhstan, 2012; Volume VII, 684p. [Google Scholar]
- Karatai, M.A.; Turumova, G.E.M. The dynamics of climate change in the Esil water basin. Hydrometeorologyandecology 2022, 4, 6–23. [Google Scholar]
- UNDP. Water Resources of Kazakhstan in the New Millennium; “Firm KIIK” LLP: Almaty, Kazakhstan, 2004; 132p. [Google Scholar]
- Medeu, A.R.; Malkovsky, I.M.; Toleubaeva, L.S.; Tairov, A.Z.; Sorokina, T.E.; Puzikov, E.M.; Dolbeshkin, M.V.; Povetkin, R.D.; Abdibekov, D.U.; Tolekova, A. Strategy of sustainable water supply of the Republic of Kazakhstan for the period up to 2050. Quest. Geogr. Geoecology 2018, 100, 18–46. (In Russian) [Google Scholar]
- Didovets, I.; Lobanova, A.; Krysanova, V.; Menz, C.; Babagalieva, Z.; Nurbatsina, A.; Gavrilenko, N.; Khamidov, V.; Umirbekov, A.; Qodirov, S.; et al. Central Asian rivers under climate change: Impacts assessment in eight representative catchments. J. Hydrol. Reg. Stud. 2021, 34, 100779. [Google Scholar] [CrossRef]
- Lobanova, A.; Didovets, I.; Menz, C.; Atabek, B.U.; Hattermann, F.Z.; Krysanova, V. Rapid assessment of climate risks for irrigated agriculture in two river basins in the Aral Sea BasinAgric. Water Manag. 2021, 243, 106381. [Google Scholar] [CrossRef]
- Gan, R.; Luo, Y.; Zuo, Q.; Sun, L. Effects of projected climate change on the glacier and runoff generation in the Naryn River Basin. Cent. Asia J. Hydrol. 2015, 523, 240–251. [Google Scholar] [CrossRef]
- Hagg, W.; Hoelzle, M.; Wagner, S.; Mayr, E.; Klose, Z. Glacier and runoff changes in the Rukhk catchment, upper Amu-Darya basin until 2050. Glob. Planet. Chang. 2013, 110, 62–73. [Google Scholar] [CrossRef]
- Reyer, C.P.; Otto, I.M.; Adams, S.; Albrecht, T.; Baarsch, F.; Cartsburg, M.; Coumou, D.; Eden, A.; Ludi, E.; Marcus, R.; et al. Climate change impacts in Central Asia and their implications for development. Reg. Environ. Chang. 2015, 17, 1639–1650. [Google Scholar] [CrossRef]
- Collins, M.; Knutti, R.; Arblaster, J.; Dufresne, J.-L.; Fichefet, T.; Friedlingstein, P.; Gao, X.; Gutowski, W.J.; Johns, T.; Krinner, G.; et al. Climate Change 2013: The Physical Science Basis. IPCC Working Group I Contribution to AR5; Cambridge University Press: Cambridge, UK, 2013. [Google Scholar]
- KazHydromet. Development of Predictive Models of Environmental Conditions on the Territory of Schuchinsk-Burabay Resort Territory: Final Report; KazHydromet: Almaty, Kazakhstan, 2007; Volume 151. (In Russian) [Google Scholar]
- Babagalieva, Z. Forecast of the Impact of Climate Change on Changes in the Water Flow of the Water Basins of the Republic of Kazakhstan for the Period Up to 2100; As Part of the Project to Develop the Eighth National Communication of the Republic of Kazakhstan within the Framework of the UNFCCC and the Preparation of Two (Fourth and Fifth) Biennial Reports; UNDP: Astana, Kazakhstan, 2021; 34p. [Google Scholar]
- Umirbekov, A.; Akhmetov, A.; Gafurov, Z. Water-Agriculture-Energy Nexus in Central Asia through the Lens of Climate Change; Regional Climate Vulnerability in CAREC and Perspectives for Regional Cooperation; CAREC Institute: Urumqi, China, 2022; Volume 2, 39p. [Google Scholar]


| Weather Station | Coordinates WGS84 | Absolute Height, m |
|---|---|---|
| Akkol | 52°0′0″ N, 70°56′0″ E | 383 |
| Arshaly | 50°50′3.49″ N, 72°10′18.11″ E | 426 |
| Astana | 50°50′3.49″ N, 72°10′18.11″ E | 349 |
| Atbasar | 51°49′0″ N, 68°21′0″ E | 302 |
| Balkashino | 52°31′3.1″ N, 68°45′9.41″ E | 398 |
| Blagoveshenko | 52°31′3.1″ N, 68°45′9.41″ E | 150 |
| Vozvishenko | 52°47′50.7″ N, 66°45′12.09″ E | 125 |
| Yereimentau | 51°37′0″ N, 73°6′0″ E | 397 |
| Yesil | 51°57′20″ N, 66°24′15″ E | 219 |
| Zhaksy | 51°54′0″ N, 67°19′0″ E | 386 |
| Zhaltyr | 51°37′25.47″ N, 69°49′58.93″ E | 304 |
| Zheleznodorozhny | 52°5′51″ N, 65°40′14″ E | 252 |
| Kyshkenekol | 53°38′3″ N, 72°20′17″ E | 137 |
| Kokshetau | 53°17′30″ N, 69°23′30″ E | 228 |
| Petropavl | 54°51′44″ N, 69°8′27″ E | 140 |
| Presnegorkovka | 54°29′59″ N, 65°45′56″ E | 160 |
| Ruzayeka | 52°49′22″ N, 66°57′5″ E | 226 |
| Saumalkol | 53°17′29.09″ N, 68°6′16.71″ E | 385 |
| Sergeyevka | 53°52′48″ N, 67°24′57″ E | 153 |
| IBMP * Burabay | 53°5′14″ N, 70°18′0″ E | 352 |
| Tainsha | 53°50′52″ N, 69°45′50″ E | 155 |
| Timiryazeva | 53°44′45.13″ N, 66°29′13.88″ E | 171 |
| Chkalovo | 53°37′31″ N, 70°25′50″ E | 165 |
| Shuchinsk | 52°56′0″ N, 70°12′0″ E | 393 |
| Yiavlenka | 54°20′37.5″ N, 68°27′30.78″ E | 113 |
| Weather Station | January | February | March | April | May | June | July | August | September | October | November | December | Yearly Average |
|---|---|---|---|---|---|---|---|---|---|---|---|---|---|
| Akkol | −15.8 | −14.6 | −7.2 | 5.0 | 13.1 | 18.2 | 19.2 | 17.5 | 11.0 | 3.8 | −6.4 | −13.2 | 2.6 |
| Arshaly | −15.4 | −14.6 | −7.0 | 5.4 | 13.4 | 18.6 | 19.6 | 18.1 | 11.6 | 4.0 | −6.2 | −13.0 | 2.9 |
| Astana | −14.5 | −13.6 | −6.0 | 6.5 | 14.5 | 19.6 | 20.6 | 19.1 | 12.6 | 5.0 | −5.2 | −12.0 | 3.9 |
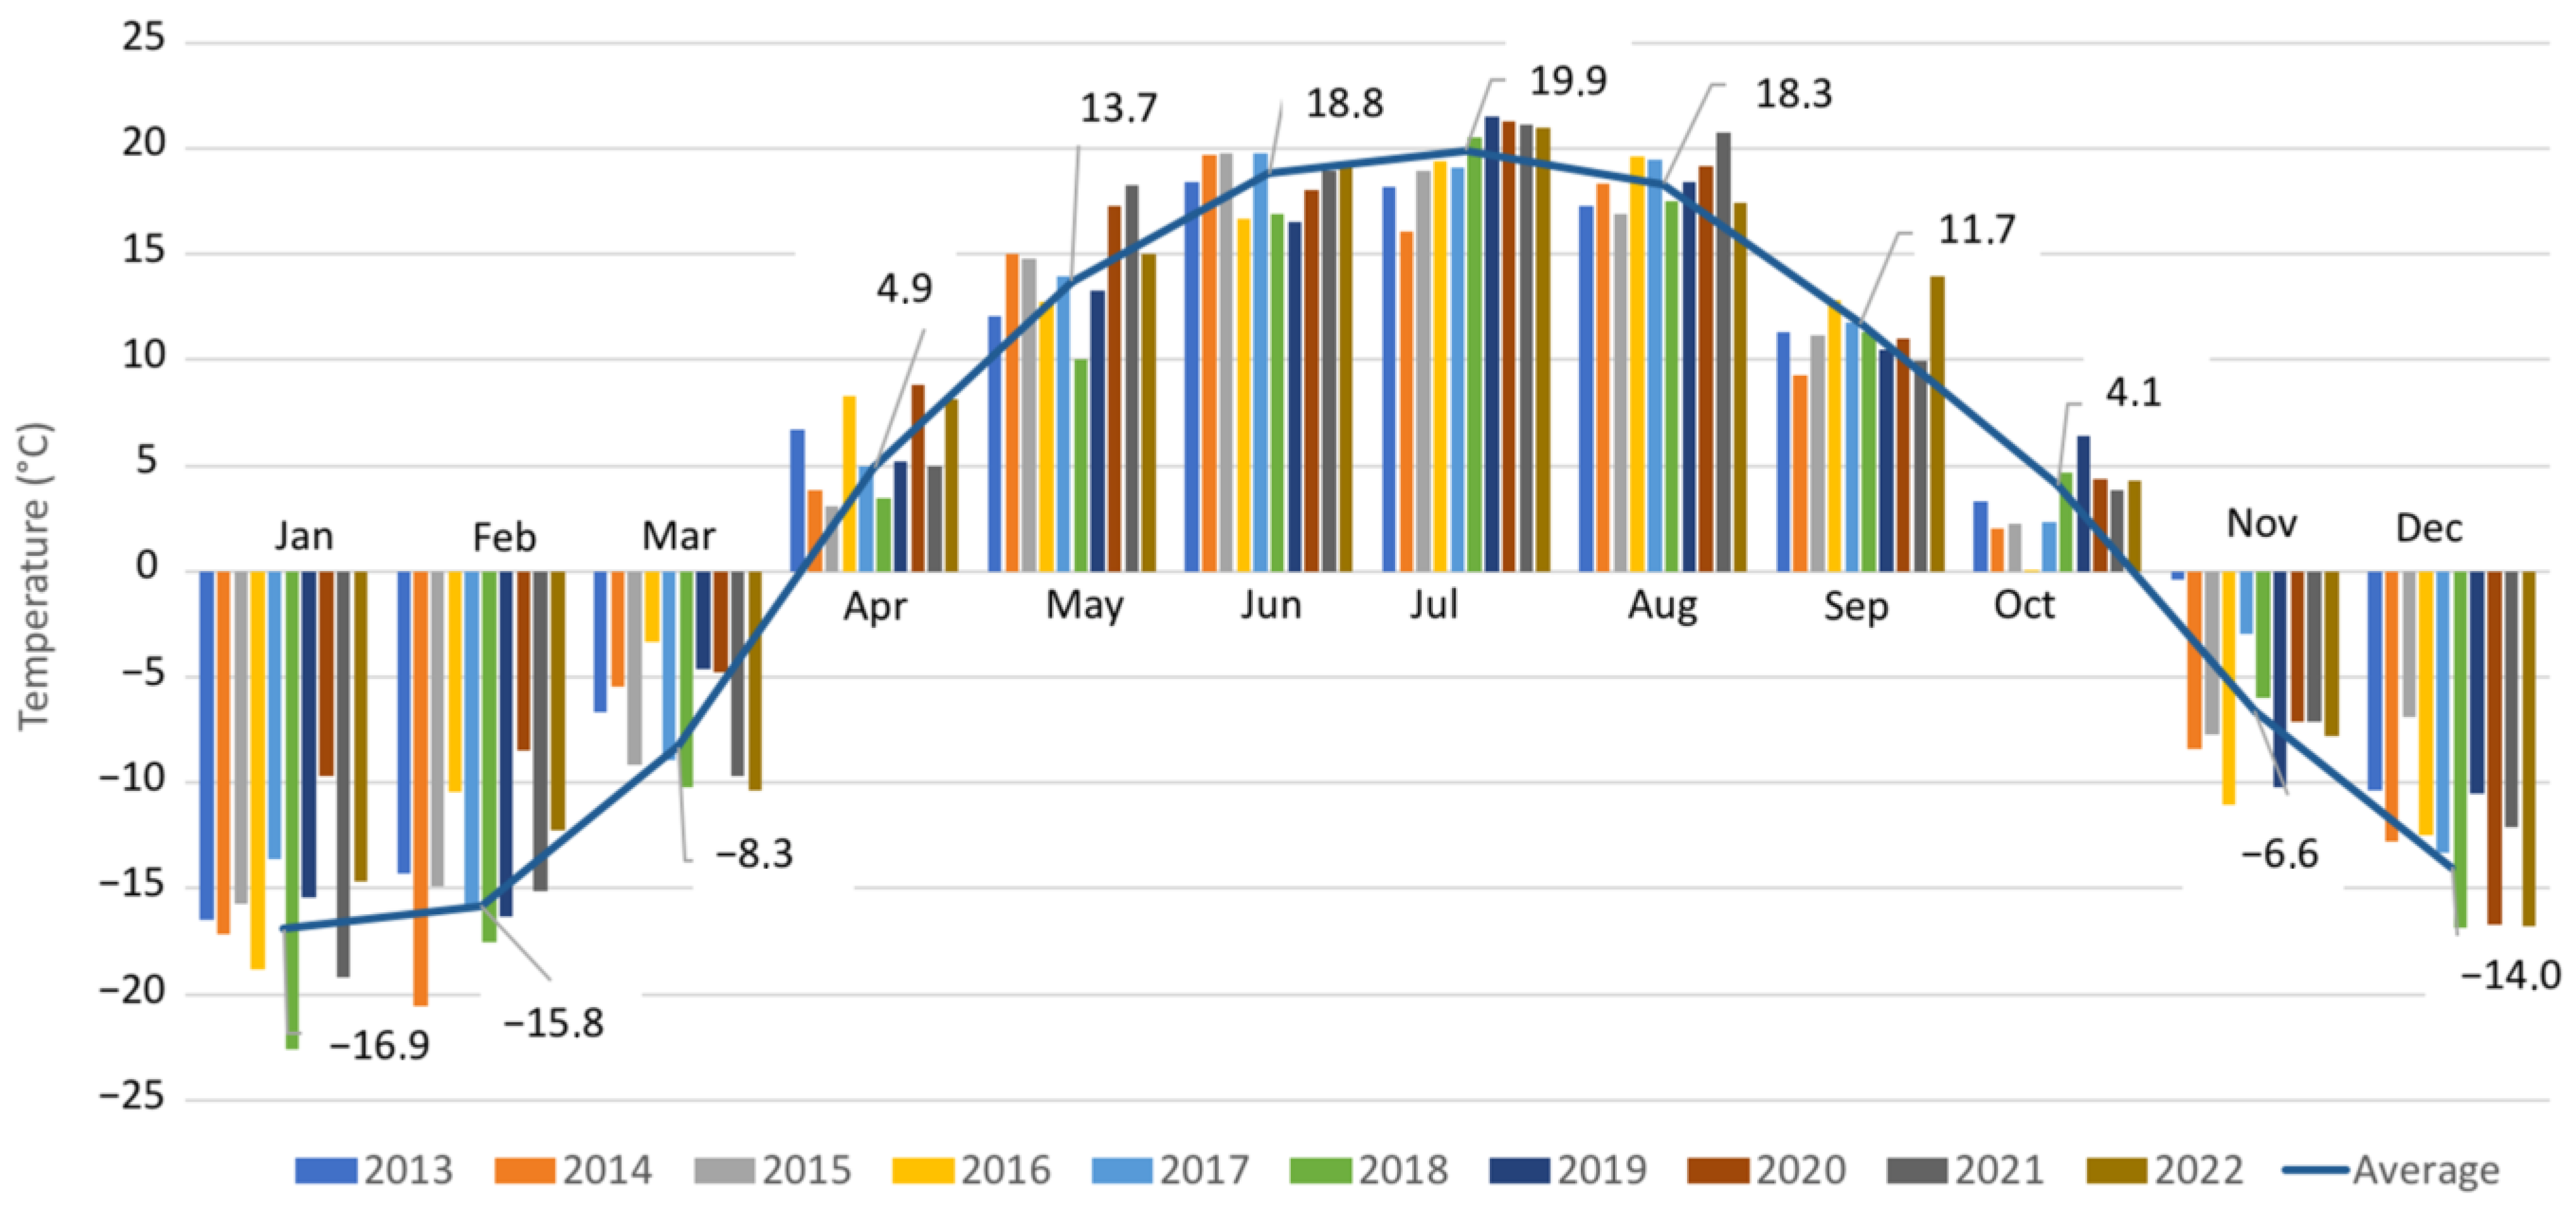
| Atbasar | −16.9 | −15.8 | −8.3 | 4.9 | 13.7 | 18.8 | 19.9 | 18.3 | 11.7 | 4.1 | −6.6 | −14.0 | 2.5 |
| Balkashino | −16.4 | −15.1 | −7.9 | 3.6 | 12.3 | 17.2 | 18.2 | 16.4 | 10.2 | 3.1 | −7.1 | −13.9 | 1.7 |
| Blagoveshenko | −16.5 | −15.1 | −7.4 | 4.3 | 13.2 | 18.3 | 19.6 | 17.5 | 11.2 | 4.0 | −6.4 | −13.6 | 2.4 |
| Vozvishenko | −17.3 | −15.7 | −8.1 | 4.2 | 13.0 | 18.1 | 19.4 | 17.2 | 10.8 | 3.6 | −7.2 | −14.1 | 2.0 |
| Yereimentau | −14.7 | −13.7 | −6.4 | 5.4 | 13.1 | 18.4 | 19.6 | 18.1 | 11.7 | 4.4 | −6.1 | −12.2 | 3.1 |
| Yesil | −15.5 | −14.5 | −6.8 | 5.9 | 14.5 | 19.5 | 20.6 | 19.0 | 12.3 | 4.7 | −5.7 | −12.9 | 3.4 |
| Zhaksy | −15.8 | −14.9 | −7.8 | 4.7 | 13.6 | 18.7 | 19.7 | 18.3 | 11.8 | 4.1 | −6.5 | −13.2 | 2.7 |
| Zhaltyr | −16.0 | −15.0 | −7.5 | 5.5 | 14.1 | 19.3 | 20.2 | 18.6 | 12.1 | 4.5 | −6.0 | −13.2 | 3.1 |
| Zheleznodorozhny | −16.1 | −15.2 | −7.9 | 4.9 | 14.0 | 19.3 | 20.4 | 18.8 | 11.1 | 4.2 | −6.2 | −13.5 | 2.8 |
| Kyshkenekol | −17.3 | −15.5 | −7.6 | 5.0 | 13.5 | 19.0 | 20.3 | 18.1 | 11.5 | 4.0 | −6.8 | −14.0 | 2.5 |
| Kokshetau | −14.3 | −13.1 | −5.7 | 5.1 | 13.5 | 18.6 | 19.6 | 17.9 | 11.8 | 4.7 | −5.5 | −11.8 | 3.4 |
| Petropavl | −16.5 | −14.8 | −7.0 | 4.5 | 13.3 | 18.1 | 19.5 | 17.3 | 11.0 | 4.0 | 6.6 | −13.7 | 2.4 |
| Presnegorkovka | −16.3 | −15.1 | −7.7 | 4.2 | 13.3 | 18.3 | 19.8 | 17.7 | 11.3 | 3.9 | −6.2 | −13.6 | 2.5 |
| Ruzayeka | −15.6 | −14.7 | −7.3 | 4.8 | 13.7 | 18.7 | 19.8 | 18.0 | 11.6 | 4.1 | −6.2 | −13.2 | 2.8 |
| Saumalkol | −15.2 | −14.0 | −6.8 | 4.4 | 13.0 | 17.7 | 18.7 | 17.0 | 10.9 | 3.8 | −6.5 | −13.0 | 2.5 |
| Sergeyevka | −16.2 | −14.9 | −7.3 | 4.7 | 13.7 | 18.6 | 19.8 | 17.8 | 11.5 | 4.3 | −6.3 | −13.4 | 2.7 |
| IBMP * Burabay | −14.5 | −13.0 | −5.9 | 4.9 | 12.5 | 17.5 | 18.6 | 16.9 | 10.7 | 3.7 | −6.1 | −12.0 | 2.8 |
| Tainsha | −15.6 | −14.1 | −6.4 | 5.4 | 13.6 | 18.7 | 19.8 | 17.8 | 11.5 | 4.3 | −6.1 | −12.7 | 3.0 |
| Timiryazeva | −16.1 | −15.0 | −7.5 | 4.7 | 13.7 | 18.8 | 19.9 | 18.0 | 11.6 | 4.2 | −6.2 | −13.3 | 2.7 |
| Chkalovo | −15.0 | −13.7 | −6.0 | 5.8 | 13.7 | 18.8 | 19.8 | 17.8 | 11.6 | 4.5 | −5.9 | −12.2 | 3.3 |
| Shuchinsk | −15.9 | −14.8 | −7.4 | 4.2 | 12.3 | 17.4 | 18.5 | 16.6 | 10.4 | 3.3 | −7.0 | −13.5 | 2.0 |
| Yiavlenka | −15.8 | −14.9 | −6.6 | 4.9 | 13.5 | 18.4 | 19.4 | 17.4 | 11.3 | 4.0 | −6.3 | −13.2 | 2.7 |
| Average | −15.8 | −14.6 | −7.1 | 4.9 | 13.4 | 18.5 | 19.6 | 17.8 | 11.8 | 4.1 | −5.8 | −13.1 | 2.7 |
| min | −16.9 | −15.8 | −8.3 | 3.6 | 12.3 | 17.2 | 18.2 | 16.4 | 10.2 | 3.1 | −6.8 | −14.0 | 1.7 |
| max | −14.3 | −13.0 | −5.9 | 6.5 | 14.5 | 19.6 | 20.6 | 19.1 | 12.6 | 5.0 | −5.2 | −11.8 | 3.9 |
| Amplitude | 2.6 | 2.8 | 2.4 | 2.9 | 2.2 | 2.4 | 2.4 | 2.7 | 2.4 | 1.9 | 1.6 | 2.2 | 2.2 |
| Weather Station | January | February | March | April | May | June | July | August | September | October | November | December | Total Year |
|---|---|---|---|---|---|---|---|---|---|---|---|---|---|
| Akkol | 20 | 17 | 20 | 28 | 33 | 42 | 72 | 40 | 24 | 32 | 29 | 27 | 383 |
| Arshaly | 16 | 16 | 18 | 22 | 33 | 40 | 55 | 31 | 21 | 25 | 26 | 21 | 324 |
| Astana | 18 | 17 | 20 | 22 | 33 | 40 | 56 | 31 | 21 | 26 | 29 | 25 | 337 |
| Atbasar | 19 | 17 | 19 | 20 | 28 | 41 | 49 | 30 | 19 | 24 | 22 | 24 | 312 |
| Balkashino | 26 | 21 | 25 | 26 | 38 | 45 | 74 | 43 | 26 | 32 | 33 | 29 | 418 |
| Blagoveshenko | 16 | 13 | 18 | 24 | 30 | 46 | 61 | 45 | 33 | 29 | 24 | 18 | 355 |
| Vozvishenko | 12 | 11 | 13 | 20 | 28 | 49 | 65 | 47 | 26 | 26 | 22 | 15 | 334 |
| Yereimentau | 22 | 19 | 19 | 23 | 38 | 50 | 69 | 41 | 30 | 30 | 24 | 24 | 389 |
| Yesil | 13 | 12 | 15 | 19 | 33 | 36 | 52 | 29 | 17 | 22 | 22 | 18 | 287 |
| Zhaksy | 23 | 23 | 20 | 20 | 24 | 28 | 42 | 28 | 20 | 23 | 25 | 28 | 306 |
| Zhaltyr | 20 | 17 | 19 | 22 | 30 | 41 | 53 | 34 | 20 | 24 | 26 | 23 | 330 |
| Zheleznodorozhny | 16 | 17 | 21 | 18 | 31 | 31 | 40 | 27 | 17 | 24 | 22 | 21 | 284 |
| Kyshkenekol | 15 | 12 | 13 | 19 | 25 | 40 | 56 | 45 | 22 | 22 | 21 | 18 | 309 |
| Kokshetau | 12 | 11 | 13 | 19 | 26 | 43 | 72 | 44 | 23 | 22 | 18 | 15 | 319 |
| Petropavl | 19 | 16 | 20 | 24 | 33 | 45 | 69 | 45 | 31 | 30 | 30 | 25 | 387 |
| Presnegorkovka | 15 | 13 | 16 | 22 | 33 | 42 | 59 | 56 | 31 | 31 | 25 | 19 | 361 |
| Ruzayeka | 20 | 17 | 20 | 27 | 40 | 35 | 58 | 42 | 23 | 31 | 31 | 24 | 367 |
| Saumalkol | 25 | 21 | 25 | 30 | 39 | 47 | 81 | 52 | 34 | 40 | 36 | 31 | 458 |
| Sergeyevka | 19 | 17 | 22 | 26 | 37 | 41 | 62 | 52 | 29 | 29 | 26 | 23 | 383 |
| Burabay | 11 | 10 | 15 | 22 | 34 | 40 | 78 | 41 | 25 | 26 | 21 | 14 | 337 |
| Tainsha | 14 | 11 | 15 | 23 | 27 | 47 | 65 | 51 | 27 | 27 | 22 | 17 | 344 |
| Timiryazeva | 14 | 12 | 19 | 25 | 28 | 42 | 60 | 50 | 28 | 30 | 22 | 19 | 348 |
| Chkalovo | 13 | 10 | 15 | 22 | 29 | 46 | 67 | 50 | 23 | 25 | 22 | 17 | 339 |
| Shuchinsk | 15 | 12 | 16 | 22 | 32 | 42 | 82 | 42 | 26 | 26 | 21 | 17 | 352 |
| Yiavlenka | 17 | 13 | 19 | 29 | 34 | 48 | 75 | 47 | 30 | 29 | 22 | 19 | 382 |
| Avarage | 17.2 | 15.0 | 18.2 | 23.0 | 31.8 | 41.9 | 62.9 | 41.7 | 25.0 | 27.4 | 24.8 | 21.2 | 350 |
| min | 11 | 10 | 13 | 18 | 24 | 28 | 40 | 27 | 17 | 22 | 18 | 14 | 284 |
| max | 26 | 23 | 25 | 30 | 40 | 50 | 82 | 52 | 34 | 40 | 36 | 29 | 458 |
| Amplitude | 15 | 13 | 12 | 12 | 16 | 22 | 42 | 25 | 17 | 18 | 18 | 15 | 174 |
| Period, Years | Climatic Norm for the Period | ∆T (°C) | |||
|---|---|---|---|---|---|
| 1961–1990 | 1991–2020 | ||||
| Tsr (°C) | σ (°C) | Tsr (°C) | σ (°C) | ||
| January | −16.6 | ±4.51 | −15.9 | ±3.98 | 0.7 |
| February | −16.2 | ±3.29 | −14.6 | ±3.86 | 1.5 |
| March | −8.7 | ±2.98 | −7.1 | ±3.45 | 1.6 |
| April | 4.0 | ±2.81 | 4.9 | ±2.71 | 0.9 |
| May | 12.4 | ±2.02 | 13.4 | ±1.75 | 1.0 |
| June | 18.2 | ±1.53 | 18.4 | ±1.88 | 0.2 |
| July | 20.1 | ±1.64 | 19.5 | ±1.67 | −0.6 |
| August | 16.8 | ±1.50 | 17.7 | ±1.75 | 1.0 |
| September | 11.2 | ±1.60 | 11.4 | ±1.50 | 0.2 |
| October | 2.2 | ±2.05 | 4.1 | ±1.92 | 1.9 |
| November | −6.7 | ±2.94 | −6.3 | ±3.85 | 0.4 |
| December | −13.3 | ±4.12 | −13.2 | ±3.34 | 0.1 |
| Winter | −15.4 | ±2.87 | −14.5 | ±2.76 | 0.8 |
| Spring | 2.6 | ±1.85 | 3.7 | ±1.89 | 1.2 |
| Summer | 18.4 | ±1.09 | 18.6 | ±1.06 | 0.2 |
| Autumn | 2.2 | ±1.51 | 3.0 | ±1.71 | 0.8 |
| Year | 1.9 | ±1.11 | 2.7 | ±0.92 | 0.7 |
| Year | Water Consumption (m3/s) | Average Annual Temperature (°C) | Annual Precipitation (mm) |
|---|---|---|---|
| 2016 | 96.5 | 2.8 | 435.4 |
| 2017 | 175.3 | 3.2 | 325.7 |
| 2018 | 67.2 | 1.4 | 376.2 |
| 2019 | 85.1 | 3.2 | 373.6 |
| 2020 | 101.4 | 5 | 416.5 |
| Correlation | 0.31 | −0.59 | |
| River | 2016 | 2017 | 2018 | 2019 | 2020 | Long-Term Average |
|---|---|---|---|---|---|---|
| Yesil | 3.0 | 5.5 | 2.1 | 2.7 | 3.2 | 1.9 |
| Akkanburlyk | 0.39 | 0.49 | 0.21 | 0.23 | 0.42 | 0.12 |
| Imanburlyk | 0.35 | 0.37 | 0.06 | 0.06 | 0.10 | 0.07 |
| Zhabay | 0.58 | 2.22 | 0.22 | 1.01 | 0.45 | 0.19 |
Disclaimer/Publisher’s Note: The statements, opinions and data contained in all publications are solely those of the individual author(s) and contributor(s) and not of MDPI and/or the editor(s). MDPI and/or the editor(s) disclaim responsibility for any injury to people or property resulting from any ideas, methods, instructions or products referred to in the content. |
© 2023 by the authors. Licensee MDPI, Basel, Switzerland. This article is an open access article distributed under the terms and conditions of the Creative Commons Attribution (CC BY) license (https://creativecommons.org/licenses/by/4.0/).
Share and Cite
Kakabayev, A.; Yessenzholov, B.; Khussainov, A.; Rodrigo-Ilarri, J.; Rodrigo-Clavero, M.-E.; Kyzdarbekova, G.; Dankina, G. The Impact of Climate Change on the Water Systems of the Yesil River Basin in Northern Kazakhstan. Sustainability 2023, 15, 15745. https://doi.org/10.3390/su152215745
Kakabayev A, Yessenzholov B, Khussainov A, Rodrigo-Ilarri J, Rodrigo-Clavero M-E, Kyzdarbekova G, Dankina G. The Impact of Climate Change on the Water Systems of the Yesil River Basin in Northern Kazakhstan. Sustainability. 2023; 15(22):15745. https://doi.org/10.3390/su152215745
Chicago/Turabian StyleKakabayev, Anuarbek, Baurzhan Yessenzholov, Abilzhan Khussainov, Javier Rodrigo-Ilarri, María-Elena Rodrigo-Clavero, Gulmira Kyzdarbekova, and Gulzhan Dankina. 2023. "The Impact of Climate Change on the Water Systems of the Yesil River Basin in Northern Kazakhstan" Sustainability 15, no. 22: 15745. https://doi.org/10.3390/su152215745