Article

An Innovative Approach to Organizational Changes for Sustainable Processes: A Case Study on Waste Minimization

Laboratory of Enterprise Engineering, Faculty of Organizational Sciences, University of Maribor, Kidričeva Cesta 55a, 4000 Kranj, Slovenia
*
Author to whom correspondence should be addressed.
Sustainability 2023, 15(22), 15706; https://doi.org/10.3390/su152215706
Submission received: 18 August 2023 / Revised: 20 October 2023 / Accepted: 1 November 2023 / Published: 7 November 2023
(This article belongs to the Special Issue Transforming Materials Industries for a Sustainable Future)

Abstract

:
It is necessary to adapt constantly to the business environment with its changing demands. Understanding the objectives, scope, and limitations of actual process changes is crucial, and can be achieved with numerous measures, methods, and techniques. This research demonstrates an innovative approach to organizational changes to enable sustainable processes. In the first part of this research, relevant measures, methods, and techniques are selected through an in-depth literature review. Then, an international online questionnaire is executed among 213 enterprises from four countries. In the last part of this research, the developed approach is tested for the example of waste minimization in the process of developing coatings. Based on the analysis of the survey questionnaire, the usability and benefits of various measures are demonstrated, namely from the point of view of their positive impact on structural and operational efficiency indicators. At the end of the article, a case study presents the success of the innovative approach in terms of 88% waste minimization and up to 48% time and cost reductions in the process of developing coatings. The proposed approach enables better choices to be made and the more efficient use of various measures, which can lead to more sustainable processes and improve the efficiency of enterprises.

1. Introduction

Adapting enterprises to changes in the environment is a necessary constant. Organizational changes require time and resources that could otherwise be used to carry out the core business. Questions are raised about the impact of organizational changes on the competitiveness of enterprises [1]. The first question to be answered is as follows: can it be determined with a high degree of certainty before implementation whether or not the organizational change will be met with success?
Furthermore, key performance indicators (KPIs) relating to competitive advantage dimensions [2] are frequently used in organizational changes. It often remains unclear how research findings on reorganization projects and applied business process management technology specifically contribute to better KPIs. After defining KPIs, the following question remains: how can the process be improved to improve the KPIs, or how can the KPIs of the process be improved to achieve set objectives [3]? It is often unknown which approach, measures, or forms of organizational restructuring will provide the best results in a given situation. Therefore, Vos et al. [4] suggest that new research should contribute to a better understanding of the conditions and possibilities in applying change implementation approaches and organizational systems’ process orientations.
The answer can be found in different change implementation approaches [5,6,7,8]. We focus on process approaches [3,6], where business processes are analyzed and improved, followed by the implementation of organizational changes and digital transformation of processes [9]. Against the backdrop of changing business requirements and recurring issues [1], it is necessary to understand the objectives of changes and the actual changes in business processes achieved through measures, methods, and techniques within different business process improvement approaches [10]. This research presents an innovative approach to implementing organizational changes to create sustainable processes that combine the process aspect, various measures to improve them, and associated KPIs. The innovation of the approach lies in the integration of the project approach and the prediction of the impact of organizational changes on process efficiency using efficiency indicators. The advantage of the approach is the connection between the purpose of reorganization and its results through various KPIs [11], and the evaluation of its success based on the measured values. On this basis, the approach is aimed at all those involved in implementing and reviewing the impact of organizational changes on system efficiency and predicting the impact of planned changes.
Organizational change is a one-time, time-limited endeavor with many stakeholders, limited resources, and associated risks. These are just some of the characteristics common to projects [12]. It is also possible to improve enterprises continuously, but there are cycles with the same characteristics as those of phases in a project. In this case, the changes are not radical, and the risk is usually lower [6]. Therefore, organizational change can be considered a project and can be prepared and managed like a project. The execution of a project has a defined start, phases, activities, milestones, and a conclusion with a confirmation that the set objectives have been achieved [13]. However, a project must be prepared before it starts since it is a unique process. Therefore, a project has an executive part (the fundamental transformational processes) and an organizational part (project management processes—planning, organizing, controlling, and leading) [14], which is the focus of the following section.

1.1. Project Initialization: Definition of Requirements and Boundary Conditions

The project preparation phase is a prerequisite for starting an organizational change project [13]. The first part of the preparation process is the initialization phase, where the problem state is identified and defined. Organizational change can affect a single business process, multiple business processes, part of a business system, or the entire business system. Scoping is the responsibility of decision-makers who identify a deviation in the efficiency and effectiveness of the system. System deviations are detected by monitoring the operational indicators of one or more dimensions of competitive advantage of the devil’s quadrant [15,16]. The devil’s quadrant includes the following dimensions with their associated operational indicators:
  • Time (e.g., throughput time [17], process cycle time [18,19,20] or process waiting time [17,21,22]);
  • Cost (e.g., activity cost [17], process cost or cost of quality [19,23,24]);
  • Quality (e.g., quality of external outputs [25,26,27], rework time [19,28,29] or compliance with regulation [19,26,27]);
  • Flexibility (e.g., process flexibility [30,31], product or service variety [27] or special request [18]).
Based on this, the purpose of the organizational change is defined, typically addressing one of the dimensions and quantifying its value (e.g., throughput time from demand to supply is reduced by “x” units of time). Boundary conditions are also defined by quantifying and typically weighting the other dimensions.

1.2. Project Conception: Definition of the Organizational Change Content

Project preparation is accomplished through two project management processes. The first is the conceptualization process, where the team decides, based on analysis, which organizational change approach will be chosen and which measures, methods, or techniques will be used [10]. Research [10] shows that different approaches often use the same methods and techniques but in various combinations. To calculate the costs and benefits, we need to know which processes will be subject to organizational change and with which measures.
The evaluation of structural efficiency is the basis for process selection [32]. From the process models and the attributes of the business objects in processes, it is possible to derive complexity/structural efficiency indicators [33,34,35,36,37,38]. They can be used to calculate unrelated structural efficiency indicators and evaluate individual processes’ structural efficiency [39]. Comparing the structural efficiency assessments of processes indicates which processes have the most significant potential for improvement and are usually prioritized. A prerequisite for the optimal selection of processes is an organized business repository with up-to-date models and business objects [40].
The following measures, methods, and techniques should be selected for each process [10] and can be combined to achieve the desired results:
  • Measures (e.g., merging activities, increasing parallel activities, and empowering employees [16,41]);
  • Methods (e.g., process modeling [16,42], benchmarking [43,44], and brainstorming [44,45]);
  • Techniques (e.g., FMEA [46,47], EPC [48], and cause and effect diagram [16,44]).
In the next step, operational indicators are defined for each selected process to measure the impact of organizational change [15,49]. Achieving the operational indicators means that the objectives of the project are met. A description, measurement unit, and target gradient (e.g., reduction) are defined for each operational indicator. For each operational indicator, a value is measured before the start of the project (AS-IS value), and an expected (desired) value after the end of the project (WISH-TO value) is defined.
For each selected process, the weights are checked, and if necessary, the balance is changed concerning the other processes. Similarly, the weights between the operational indicators of each dimension and between the operational indicators of all dimensions are determined.
The project’s economy is also calculated as part of the conceptualization process. The expected impact of organizational change is the difference between the values of the selected operational indicators of the current state (“AS-IS state”) and the values of the same operational indicators of the expected state (“WISH-TO state”). The predicted impact of the organizational change can be direct (cost), indirect (time, quality, flexibility), or a combination.
To calculate the impacts of an organizational change, we need to add the direct and indirect impacts for each iteration of the process and calculate the impacts for a selected unit of time based on the number of iterations. The activity described above is repeated for all processes subject to organizational change.
When interpreting the calculation results, it must be taken into account that the AS-IS values of the operational indicators are measured, while the WISH-TO values are assumed. The latter poses a risk to the accuracy of the calculation. However, this risk can be mitigated if the right processes are selected for redesign based on structural efficiency, and proper measures are selected based on structural indicators.

1.3. Organizational Change Project Planning

Project planning is teamwork. The team should include experts involved in the process’ redesign. It should also include experts from the organization, and from the fields of information technology (IT) and human resources (HR). The scope and content of the project are derived from the purpose and objectives, and the boundary conditions provide the framework for the execution plan. The execution part of an organizational change project is usually divided into the following phases [6,14]:
  • Preparation for improvement;
  • Process mapping/process modeling (if we do not have an up-to-date business repository);
  • Process analysis;
  • Key process improvement through selected measures;
  • Solution implementation/system adaptation (the adaptation of an organizational structure, IT system, and HR system to the improved process);
  • Process monitoring and control.
The activities within the phases depend on the selected measures, methods, or techniques and must be well defined in the plan. The objective, execution method, duration, experts, and other assigned resources, results, and possible risks must be anticipated.
The suitability and effectiveness of the presented approach for designing sustainable processes are tested in this research through the following methods:
  • Demonstrating the usefulness and benefits of process improvement methods and techniques through their impact on performance indicators (Section 3.1);
  • A case study of waste minimization in the development process (Section 3.2).

2. Research Procedure

The overall research on the suitability and effectiveness of the innovative approach was conducted in three phases:
  • An overview of the theoretical background (Section 1);
  • A verification of the suitability of the innovative approach through considering evidence of the usefulness and benefits of the methods and techniques (the determination of a representative sample, Section 2.1, and a survey questionnaire, Section 2.2);
  • A verification of the effectiveness of the innovative approach through a case study of waste minimization in the development process (Section 2.3).

2.1. Determination of the Representative Sample

The representative sample for the survey was determined based on Eurostat statistics for the most recent years available [50,51,52,53,54]. Due to the volume of available data, we focused on four European Union countries: Slovenia, Croatia, Germany, and Sweden. The relevance of the countries’ selection was ensured via a preliminary review of Eurostat statistics, which confirmed that the selected countries are similar in some criteria (e.g., geographical, historical, cultural—Slovenia and Croatia); in other criteria, they represent good practice examples (Germany and Sweden) of enterprise effectiveness.
Based on a review of enterprises by size [50], it was found that two criteria can be used for sampling: the proportion of the enterprise size and the gross value added (GVA) of the enterprise size. It is reasonable to consider GVA as the primary criterion for sampling. This decision is based on the realization that we should focus on micro and small enterprises if we select enterprises based on the size proportion criterion alone. These enterprises often do not use business process improvement methods, techniques, or approaches and are less relevant to research. Furthermore, considering GVA, medium and large enterprises cover at least 56.8% of the GVA in all selected countries. However, we also included medium enterprises in the research, as some studies show the peculiarities of the newly joined countries of the European Union [55].
Based on a review of enterprises by business area [51,52,53], it was found that six business areas stand out across all criteria (e.g., portion, gross value added, and employment), namely manufacturing (including the coatings industry, which is the subject of the case study); wholesale and retail trade, the repair of motor vehicles and motorcycles; construction; professional, scientific and technical activities; information and communication; and transportation and storage). These business areas stand out, whether they are compared overall or country-by-country.
To determine the sample’s representativeness, we were interested in more detailed information on the suitability of the selected enterprises. Based on the data obtained, we calculated the proportion of enterprises the research would cover if we focused only on the six outstanding business areas (Table 1).
The results in the table confirm that the sample covers at least 71.8% of large enterprises and at least 74.7% of medium enterprises in all selected countries. It is also important to note that detailed data for other business areas were unavailable during the research.
However, before the final calculation of the representative sample, it is useful to adjust it to be consistent with one of the research aims (the analysis of differences between countries). For this reason, the calculation is based on the assumption of the equal coverage of enterprises in all countries. As a result, the calculation is performed for 30 enterprises per country and assumes a sample of 120 enterprises. The calculation consists of two parts: the ratio between medium and large enterprises and the ratio between the predominant purpose of enterprises (material and non-material (service) production) by country. Table 2 shows the representative sample by country, size, and the purpose of enterprises.
Thus, the representative sample allows comparisons based on two criteria, but when using specific statistical tests, it prevents comparisons of the size of enterprises. When considering additional options, it should be noted that the sample can be adjusted (partially in terms of size or entirely in terms of size and purpose).
As a result, sample adjustments would eliminate the inability to perform statistical tests, but the sample’s representativeness would deteriorate with each additional adjustment. At the same time, individual statistical tests are based on certain assumptions (e.g., normal distribution, homogeneity of variances, etc.) that are not necessarily achieved because they depend primarily on the respondents’ answers. Considering the above possibilities and limitations, this research used a baseline calculated representative sample.

2.2. Survey Questionnaire

We found that a survey is the only appropriate research method to conduct the research with, so we created a questionnaire for the following reasons:
  • It covers the scientific and professional needs in the research field;
  • It covers the purpose of this research;
  • It covers performance indicators and relevant process improvement methods and techniques (based on a review of the available literature);
  • It enables a comparison of results according to the enterprise classification criteria.
The survey questionnaire consisted of six sections. The questionnaire was available in four languages. The anonymous survey questionnaire did not ask for respondents’ personal information. It was created using the “1 ka tool” [56]. Before starting the research, the questionnaire was validated for its content and technically validated by nine employees in different enterprises.
Each enterprise first received an e-mail invitation to participate in the international research, followed by two reminders on predetermined dates. In addition, the invitation was forwarded to a new contact for each returned e-mail (e.g., technical problems, non-existent e-mail address, etc.). The research was carried out during the period 1 April 2021–15 July 2021, with the questionnaire available for exactly 90 days.
Based on the number of questionnaires completed after the initial transmissions, it was determined that a close follow-up of a representative sample did not yield the expected distribution of responses. Consequently, the sample was slightly adjusted in the follow-ups as more material enterprises were added. The questionnaires for the Slovenian and German enterprises were also published on social media.
After data collection, respondents’ responses were reviewed, and all adequately completed questionnaires were included in the analysis. Based on the responses, a detailed analysis of the response rate was prepared and is shown in Table 3. The analysis shows the highest response rate in Slovenia (14.7%) and the lowest in Sweden (0.8%). The overall response rate of the questionnaires was 7.6%. In some countries, we noticed a lower response during the survey. Therefore, we also conducted the 2nd and 3rd rounds of sending invitations and reminders, where we tried to replace non-responding enterprises with others with the same characteristics. The General Data Protection Regulation also affected enterprises’ willingness to respond in some countries.
However, the results of the response rate analysis were in line with expectations. After reviewing research, we found lower response rates reported by Sivo et al. [57] and Baruch and Holtom [58]; they are 3% or more for data obtained from individuals and 10% or more for data obtained from enterprises. A recent review of the research with response rates of 5% and above has shown that studies with lower response rates are often slightly less rigorous than those with higher response rates [59].
We calculated the sample size’s adequacy using a freely available calculator [60]. We assumed that the achieved sample size was adequate for the research, knowing that a sample size between 30 and 500 is sufficient for most research [61]. However, we wanted to know with what level of confidence and under what conditions we could say that the achieved sample size is adequate. Therefore, the size of the selected population of 63,034 medium and large enterprises in the six selected business areas was entered into the calculator. Using an alternative scenario, we found that the margin of error for the achieved sample size was 6.70%. Based on the calculator, it was confirmed that our responses can tolerate the achieved margin of error. According to the calculator’s recommendation, based on the most conservative assumptions for statistical tests and assuming a normal distribution, we left the normal distribution at 50%. A confidence level of 95% was used for the calculation. The calculator recommends a sample of 196 enterprises based on the above conditions. We have exceeded the recommended sample and can state, with a confidence level of 95%, that the achieved sample (213 enterprises) is adequate and representative of the selected research population.

2.3. Case Study on Waste Minimization in the Development of New Products in the Coatings Industry

We have chosen the coatings industry as a case study for an innovative approach to organizational changes for sustainable processes. This is a significant segment of the manufacturing area that is relatively weakly organized.
The problem in the coatings industry is the increasing complexity of developing new products that must meet numerous requirements. Coatings contain various ingredients, such as resins, additives, pigments, fillers, catalysts, solvents, etc. In the classic development of a new product, developers prepare and test many potential products in the laboratory. Only technologically appropriate products (that protect the substrate, meet esthetic criteria, etc.) are included in production and offered on the market. Due to the many possible ingredients for formulation, creating new coatings involves complicated systems [62,63]. The coatings industry adopts high-flow systems with computer simulation to address product demands, following examples from other industrial sectors such as pharmaceuticals [62,64,65,66]. Advances in laboratory equipment speed up testing and allow more measurements to be taken in a specific period, reducing product development times. However, to ensure safety and environmental considerations, it is crucial to evaluate the hazards of a product based on ingredient data during formulation preparation [67]. Modern information technology can significantly streamline these processes [68,69,70].
It is essential to redesign processes with chosen measures, methods, and techniques to improve the coating development process radically. In this case, using digital transformation [71] in combination with other process reengineering measures (e.g., reducing the number of activities, changing the sequence of activities, etc.) is appropriate.
The primary purpose is to optimize the number of tests in the laboratory. For this, the formulator needs access to structured databases of ingredients. The databases should be in the cloud and have up-to-date, precise ingredient data. Based on these databases, the formulator can create a formulation suitable for the user from a functional, health, and environmental perspective. Another benefit of this redesign is that all required documentation (i.e., hazard labels, safety data sheets, and technical data sheets) can be generated. In this way, unnecessary laboratory testing can be avoided. The reduced number of laboratory tests could enable waste minimization. In addition, the development throughput time can be shortened, and costs can be minimized.
The necessary precondition for the proposed improvement is process analysis, for which we need relevant and up-to-date data, process models, and a “technical enabler” [72].
First, itis necessary to create AS-IS (process execution before redesign) and TO-BE (process execution after redesign) models of the coating development process. The architecture of integrated information systems (ARIS) methodology, specifically an event-driven process chain model (EPC model type), was used for process modeling. Process modeling is described in detail by Kern et al. [68].
Second, we have found the technical enabler used as a 4th-generation information tool [73]. It is an “all-in-one” tool that enables real-time online searches for coating ingredients, virtual coating formulations, and digital technical and safety data sheet generation.
The proposed process redesign was tested in the selected enterprise. Based on the results, its suitability was verified. To verify the process redesign, we conducted three analyses using the following data:
  • Waste minimization [74]:
    Data on the number of necessary laboratory test repetitions for a successful realization of coating development;
    Data on the amount of waste generated during laboratory tests.
  • Throughput time reduction, where the time for each process activity was monitored [68]:
    Waiting time;
    Orientation time (preparation–finishing time);
    Processing time.
  • Cost reduction where this was observed [75]:
    The cost of each process activity (the activity-based costing method)—the difference between the average cost of the process before and after digital transformation. The calculation considered the following savings: fewer laboratory tests, lower material consumption, and less labor (due to shorter activity times).
Achieving the specified results will confirm the suitability of the proposed coating development process’ redesign and the presented approach’s success.

3. Results

This chapter analyzes the usefulness and benefits of process improvement methods and techniques through their positive impact on efficiency indicators. The analysis involved several steps:
  • Descriptive statistics (averages; contingency tables);
  • Conducting a proportion test;
  • Conducting a population mean test.
All tests were conducted repeatedly, analyzing the impact of individual methods and techniques and the impact of sets of process improvement methods and techniques on structural and operational efficiency indicators.
The second part of the chapter presents the results of a case study on waste minimization in the development process.

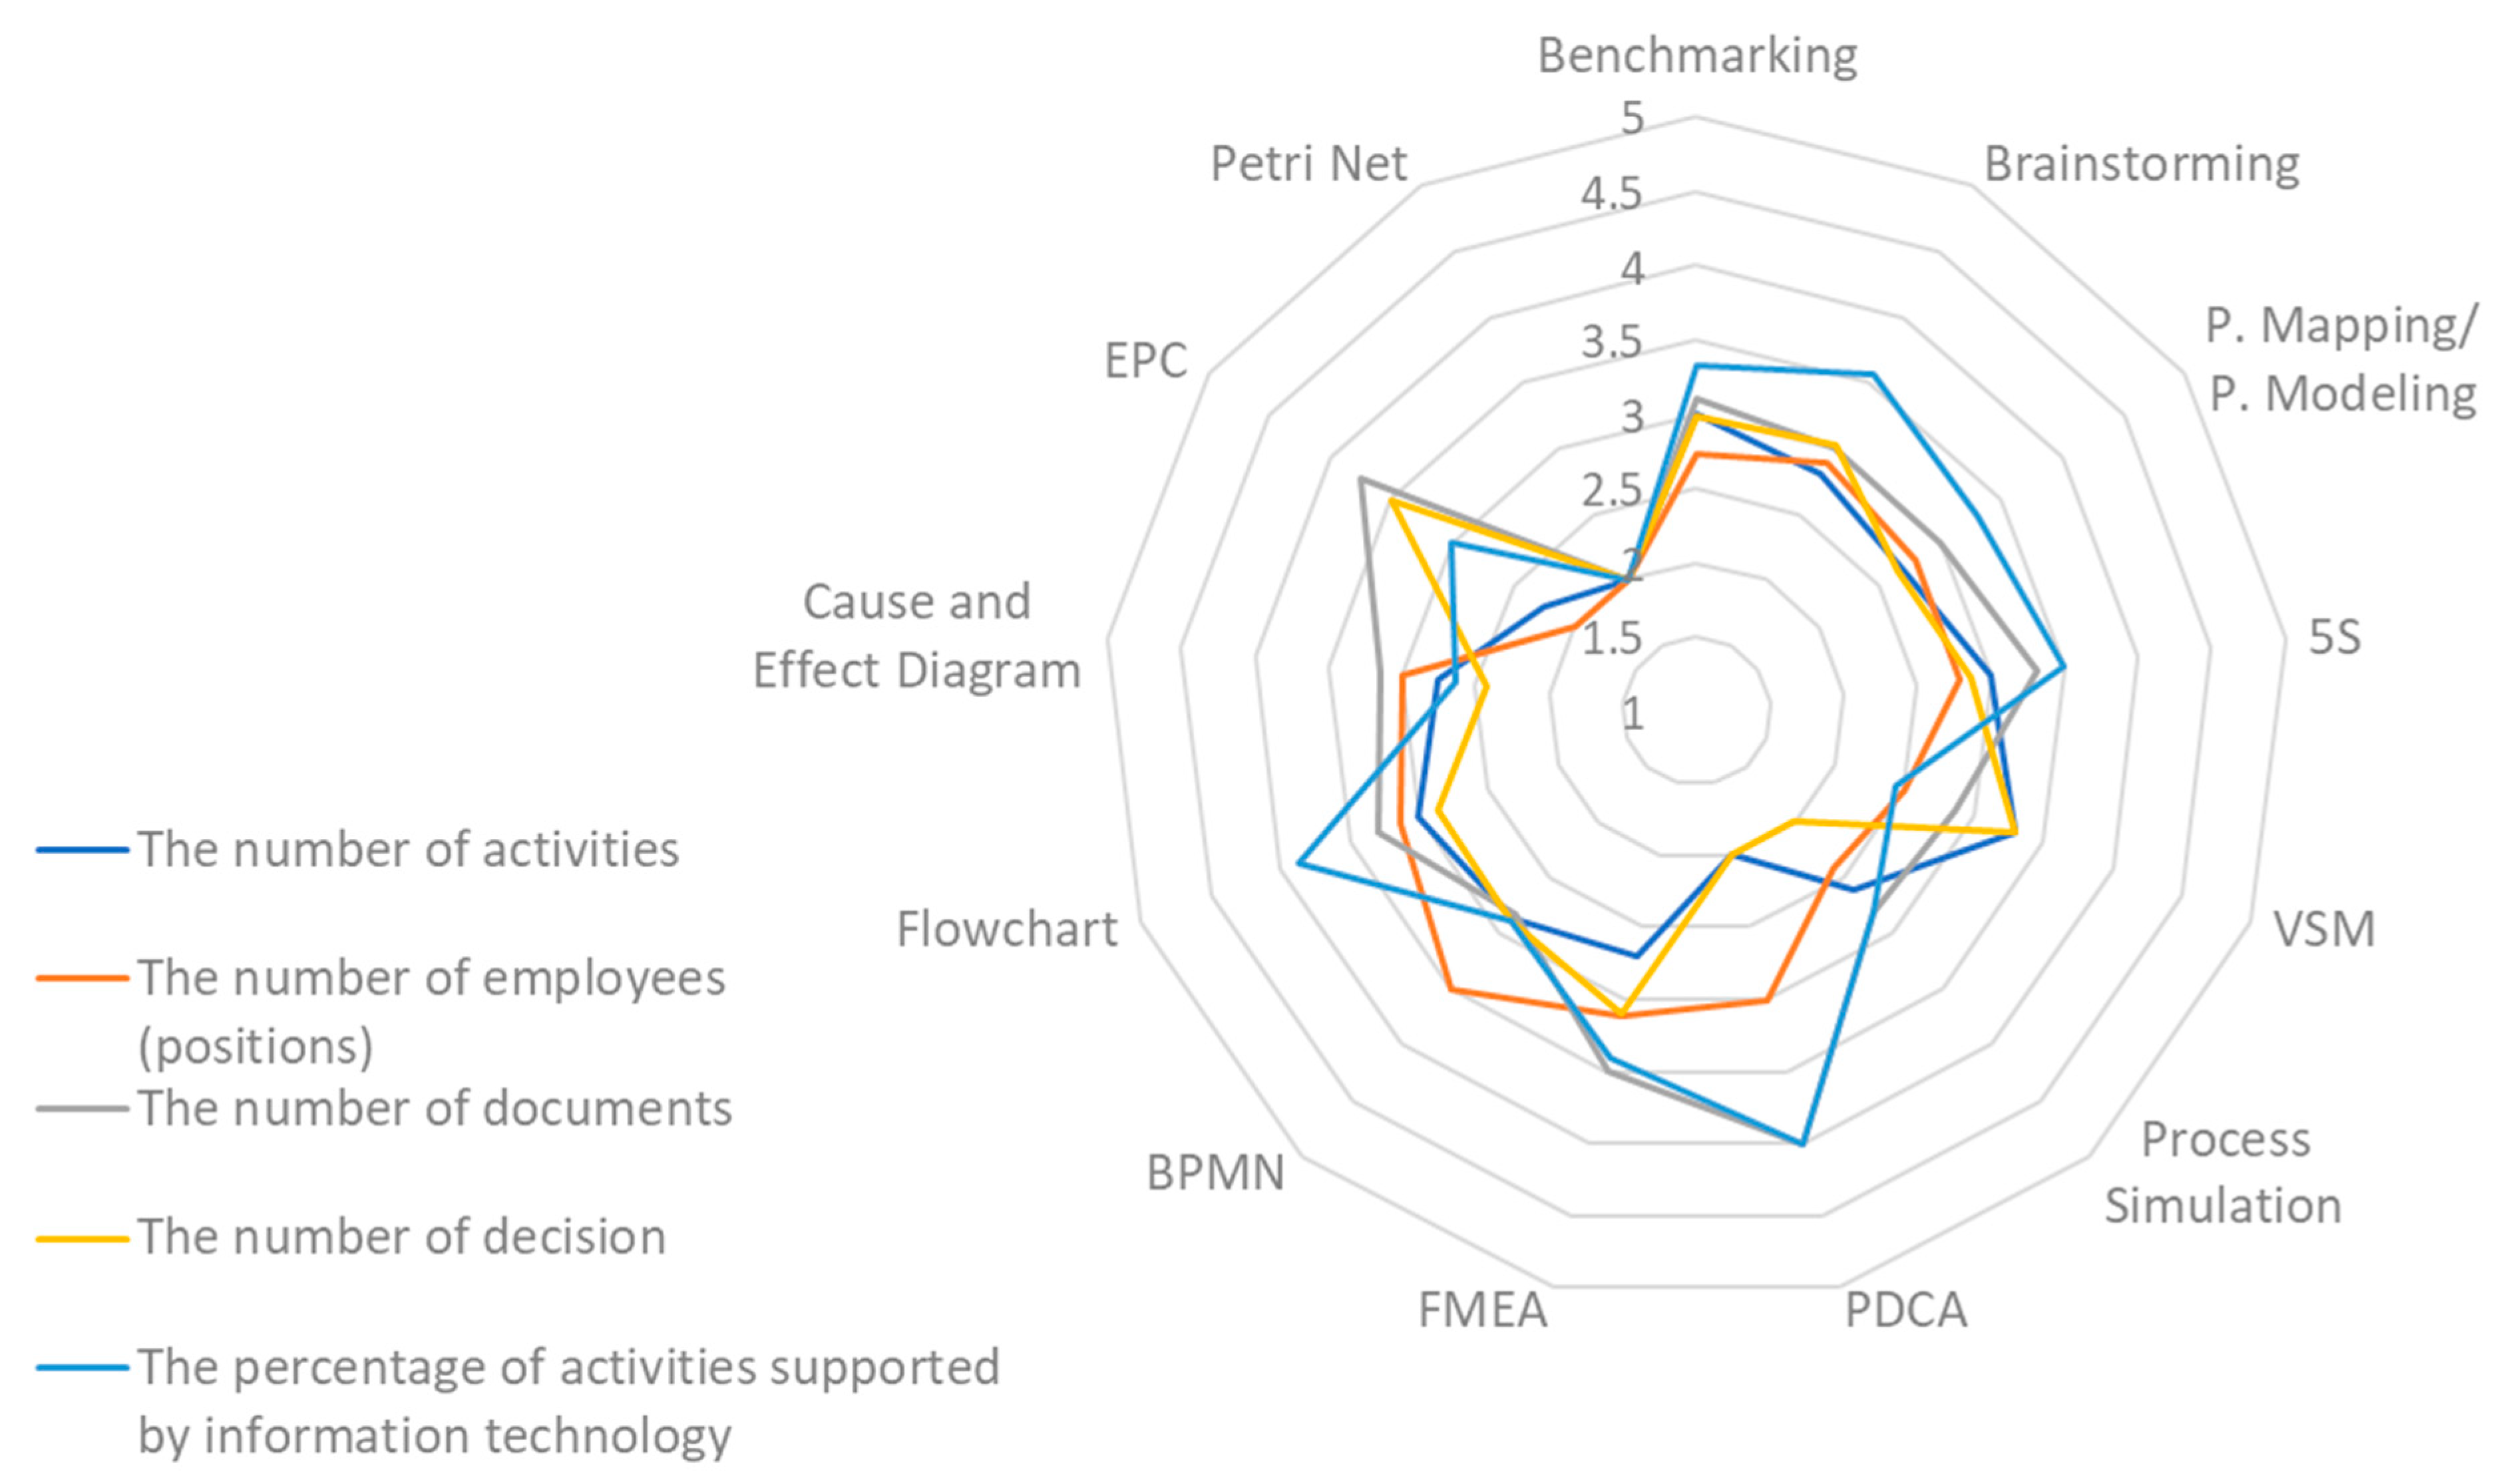
3.1. Analysis of the Usefulness and Benefits of Process Improvement Methods and Techniques

Briefly, 213 respondents from different enterprises completed the questionnaire. Most respondents were from the following:
  • Medium (55.9%) and large enterprises (41.8%);
  • Material (60.6%) and non-material enterprises (36.6%);
  • Enterprises from Slovenia (60.6%) and Croatia (28.6%).
In this context, respondents particularly highlighted the redesign of product and service development and management processes (44%), out of which 49% represented core (primary) processes in their enterprises.
The survey questionnaire and its analysis were intended to confirm the connection between the purpose of reorganization, the measures in the organization (business process improvement methods and techniques), and the performance indicators (KPIs). We verified the connection using the positive impact of the most commonly used methods and techniques in practice on various performance indicators. Here, we used the proportion test to check the positive impact (results in Table 4 and Table 5) and the population mean test to check the strength of the positive impact (results in Table 6 and Table 7).
At the beginning of the analysis, contingency tables were prepared to show the number of respondents who selected a certain level of improvement of the indicator and the percentage of the number of respondents who evaluated the same method or technique [10]. At least 75% of respondents selected a strong or very strong process improvement level.
Based on this and the recommended test conditions [76], we conducted the proportion test with a 75% respondent condition. The proportion test was used to test whether or not the population proportion of enterprises with a significant positive impact on improving a particular indicator could be greater than 75%.
Tests were conducted for seven methods, six techniques, and individual methods and techniques. We chose to test all methods and techniques for which at least ten respondents evaluated impact. This decision was based on examples provided in several sources [76,77,78]. The results of all 63 tests are presented in Table 4 and Table 5, with p-values reported in the tables.
Table 4 shows that all p-values of the tests conducted for the methods are less than 0.05. Consequently, it can be argued that the population proportion of enterprises with a significant positive impact of methods on all structural efficiency indicators is higher than 75%.
It can also be argued that the population proportion of enterprises with a significant positive impact of techniques on reducing the number of activities and decisions, and increasing the percentage of activities supported by information technology is higher than 75%. However, this is not true for the positive impact of techniques on reducing the number of employees (positions) and documents.
The table also shows that individually tested methods positively impact structural efficiency indicators. The population proportion is higher than that of 75% of enterprises that show a significant positive impact of the following methods:
  • Benchmarking, with an impact of reducing the number of activities, documents, and decisions, and of increasing the percentage of activities supported by information technology;
  • Brainstorming, with an impact of reducing the number of activities, documents, and decisions;
  • P. napping/P. modeling, with an impact of reducing the number of activities and decisions, and of increasing the percentage of activities supported by information technology;
  • Finally, 5S, with an impact of reducing the number of activities, employees (positions), and decisions, and of increasing the percentage of activities supported by information technology.
In contrast to these methods, the FMEA technique does not positively impact structural efficiency indicators.
Table 5 shows that all the p-values of the tests conducted for the methods and techniques are less than 0.05. Consequently, it can be argued that the population proportion of enterprises with a significant positive impact of methods and techniques on all operational efficiency indicators is higher than 75%.
The table also shows that individually tested methods and techniques positively impact operational efficiency indicators. The population proportion is higher than that of the 75% of enterprises that show a significant positive impact of the following methods:
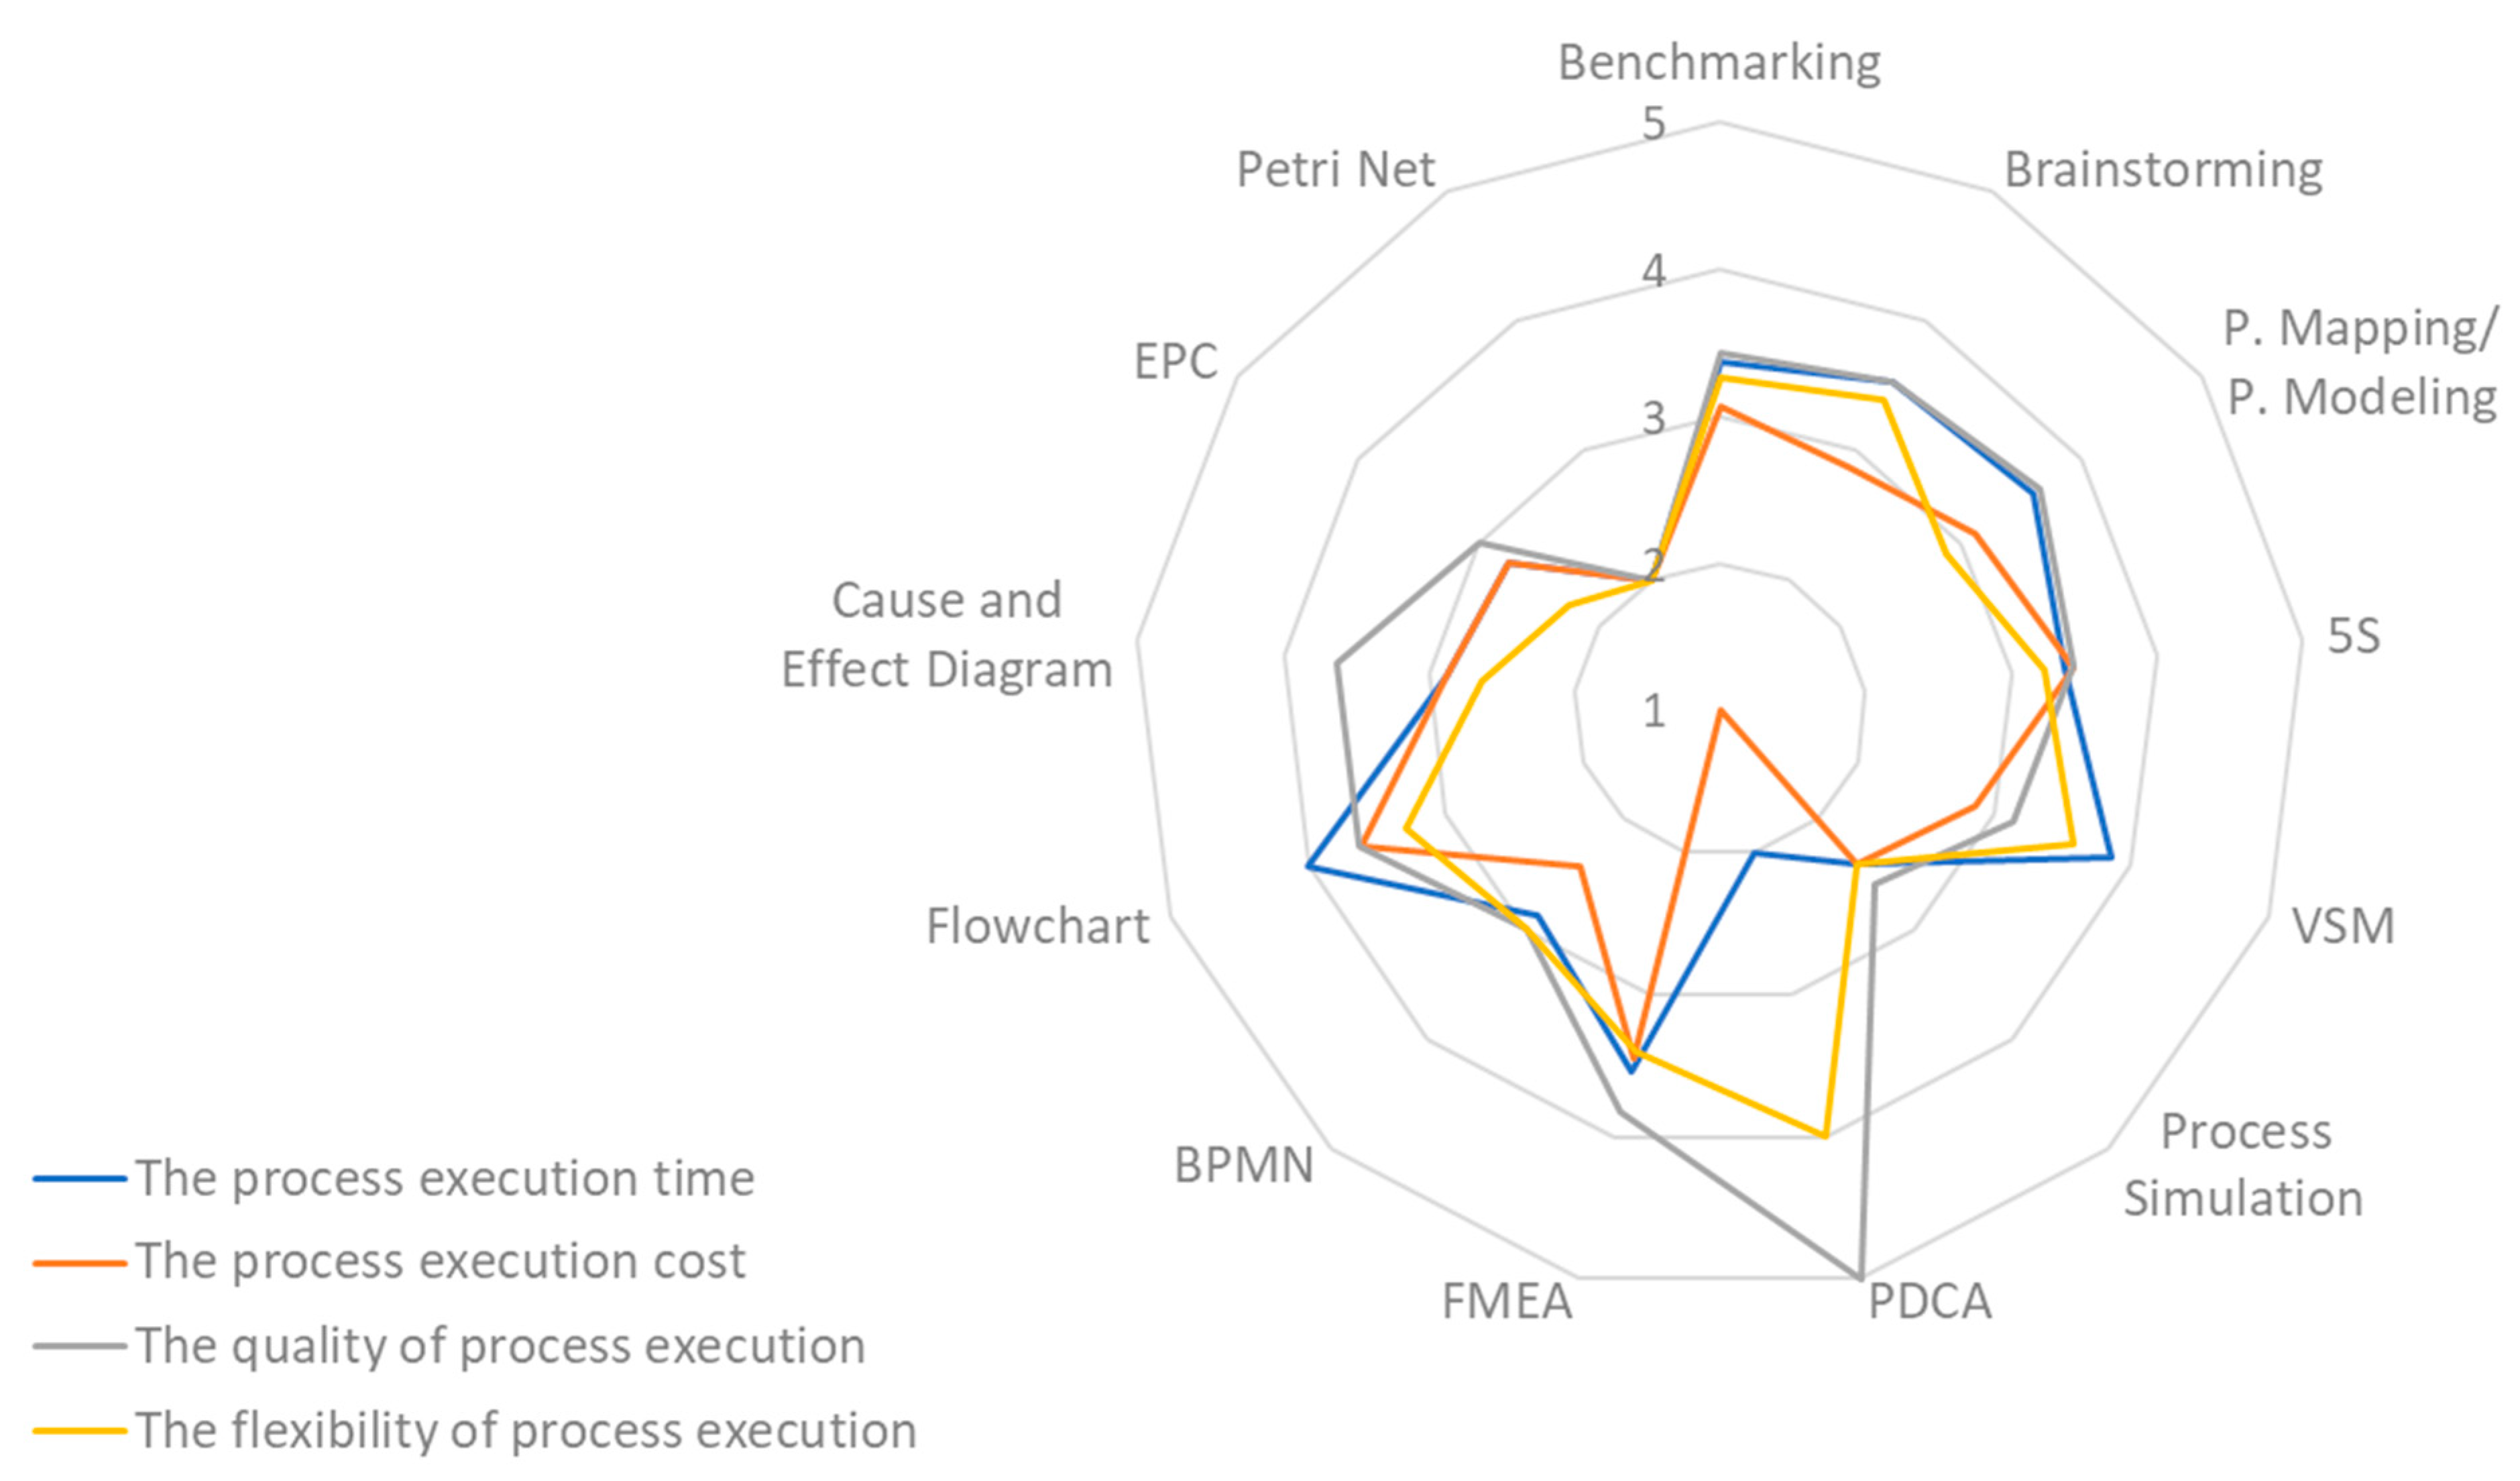
  • Benchmarking, brainstorming, and P. mapping/P. modeling, with the impact of shortening the process time, reducing the process costs, and achieving quality and flexibility improvements in the process;
  • The method of 5S, with the impact of shortening the process time and achieving quality improvement in the process;
  • FMEA, with an impact of shortening the process time, reducing the process costs, and achieving quality improvements in the process.
  • Therefore, based on the tests conducted, we can confirm the following:
  • The use of individual process improvement methods has a positive impact on operational efficiency indicators (14 out of 16 tests conducted);
  • The use of individual process improvement methods has a positive impact on structural efficiency indicators (14 out of 20 tests conducted);
  • The use of process improvement methods has a positive impact on operational efficiency indicators (four out of four tests conducted);
  • The use of process improvement methods has a positive impact on structural efficiency indicators (five out of five tests conducted);
  • The use of FMEA has a positive impact on operational efficiency indicators (three out of four tests conducted);
  • The use of FMEA has no positive impact on structural efficiency indicators (zero out of five tests conducted);
  • The use of process improvement techniques has a positive impact on operational efficiency indicators (four out of four tests conducted);
  • The use of process improvement techniques has a positive impact on structural efficiency indicators (three out of five tests conducted).
To conclude on the analysis of the positive impact of the methods and techniques on the efficiency indicators, a population mean test was used to test the strength of the positive impact on each indicator (Table 6 and Table 7). We were interested in whether or not the future application of the methods and techniques could lead to at least a moderate improvement in the process. First, we estimated that the hypothetical value was 2.5 based on the questionnaire’s content, where this value represented a 50% improvement in the process.
Table 6 shows that most p-values of the tests are less than 0.05. Consequently, it can be argued that the average improvement in structural efficiency indicators related to using methods is higher than 2.5. Similarly, it can be argued that the average improvement in the last four structural efficiency indicators related to using techniques is higher than 2.5. An exception is the p-value of the test for the average improvement in the number of activities (reduction). In this case, the p-value is 0.077 > 0.05, meaning we cannot confirm that the improvement in the number of activities due to the use of techniques is higher than 2.5.
Table 6 also shows that the average improvement of structural efficiency indicators regarding most of the following individual methods and techniques tested is higher than 2.5:
  • Benchmarking and FMEA have an average improvement of above 2.5 for reducing the number of employees (positions), documents, and decisions, and for increasing the percentage of activities supported by information technology;
  • Brainstorming has an average improvement of above 2.5 for reducing the number of activities, documents, and decisions, and for increasing the percentage of activities supported by information technology;
  • P. mapping/P. modeling has an average improvement of above 2.5 for increasing the percentage of activities supported by information technology;
  • The method of 5S has an average improvement of above 2.5 for reducing the number of activities and documents, and for increasing the percentage of activities supported by information technology.
Table 7 shows that almost all the p-values of the tests are less than 0.05. As a result, it can be argued that the average improvement in operational efficiency indicators related to using methods and techniques is higher than 2.5.
The detailed validations of each test are described in the following lines.
  • Benchmarking, brainstorming, 5S, and FMEA have an average improvement of above 2.5 for shortening the process time, reducing the process costs, and achieving quality and flexibility improvements in the process;
  • P. mapping/P. modeling has an average improvement of above 2.5 for shortening the process time, reducing the process costs, and achieving quality improvements in the process.
Based on the tests, we confirm that the following moderate process improvements can be expected in the use of the following:
  • A range of methods:
    Moderate average improvement for the five structural indicators;
    Moderate average improvement for the four operational indicators.
  • A range of techniques:
    Moderate average improvement for the four structural indicators;
    Moderate average improvement for the four operational indicators.
  • Individual methods:
    Moderate average improvement for structural indicators (12 out of 20 tests);
    Moderate average improvement for operational indicators (15 out of 16 tests).
  • Individual techniques:
    Moderate average improvement for the four structural indicators;
    Moderate average improvement for the four operational indicators.
At the end of the first part of this research, to validate the approach, it was also necessary to test the potential and strength of the simultaneous positive impact of the methods and techniques on the structural and operational efficiency indicators, as shown in Figure 1 and Figure 2. Descriptive statistics were used for analysis, and Table A1 and Table A2 in Appendix A present the overall analysis results regarding the average improvement in efficiency indicators. This analysis uses a five-point scale, with a score of 1 representing a slight improvement, a score of 3 representing a moderate improvement, and a score of 5 representing a very strong improvement for each indicator. At the end of this analysis, the average positive impacts of the methods and techniques from the same group on each indicator are compared and ranked. The ranking of impacts is color-coded in the tables from white (lowest positive impact) to dark gray (highest positive impact).
From the analysis results presented in Appendix A, it was not possible to conclude which method or technique is more or less appropriate within its group in terms of the positive impact on efficiency indicators because the number of respondents involved varied too much for each method and technique (e.g., comparing PDCA and benchmarking). However, it can be concluded from the tables that the methods and techniques have at least a light (or higher) impact on improving efficiency indicators. When looking at the individual groups, it is confirmed that, on average, the methods and techniques have a moderate impact on the structural and operational efficiency indicators. At the same time, the analysis results show that the methods are more effective in improving processes in terms of structural and operational efficiency indicators.
Using descriptive statistics, we tested the simultaneous impact on several efficiency indicators. We confirmed that the use of individual process improvement methods and techniques can have a positive impact on structural and operational efficiency indicators at the same time.
Based on all the results presented in this chapter and the distribution of assessments on the impact of methods and techniques on efficiency indicators, we can give the following guidelines for the business industry:
  • To improve the percentage of activities supported by information technology (structural efficiency indicator), using 5S, P. mapping/P. modeling and benchmarking is most appropriate;
  • To improve the quality of process execution (an operational efficiency indicator), using FMEA, P. mapping/P. modeling and benchmarking is most appropriate.

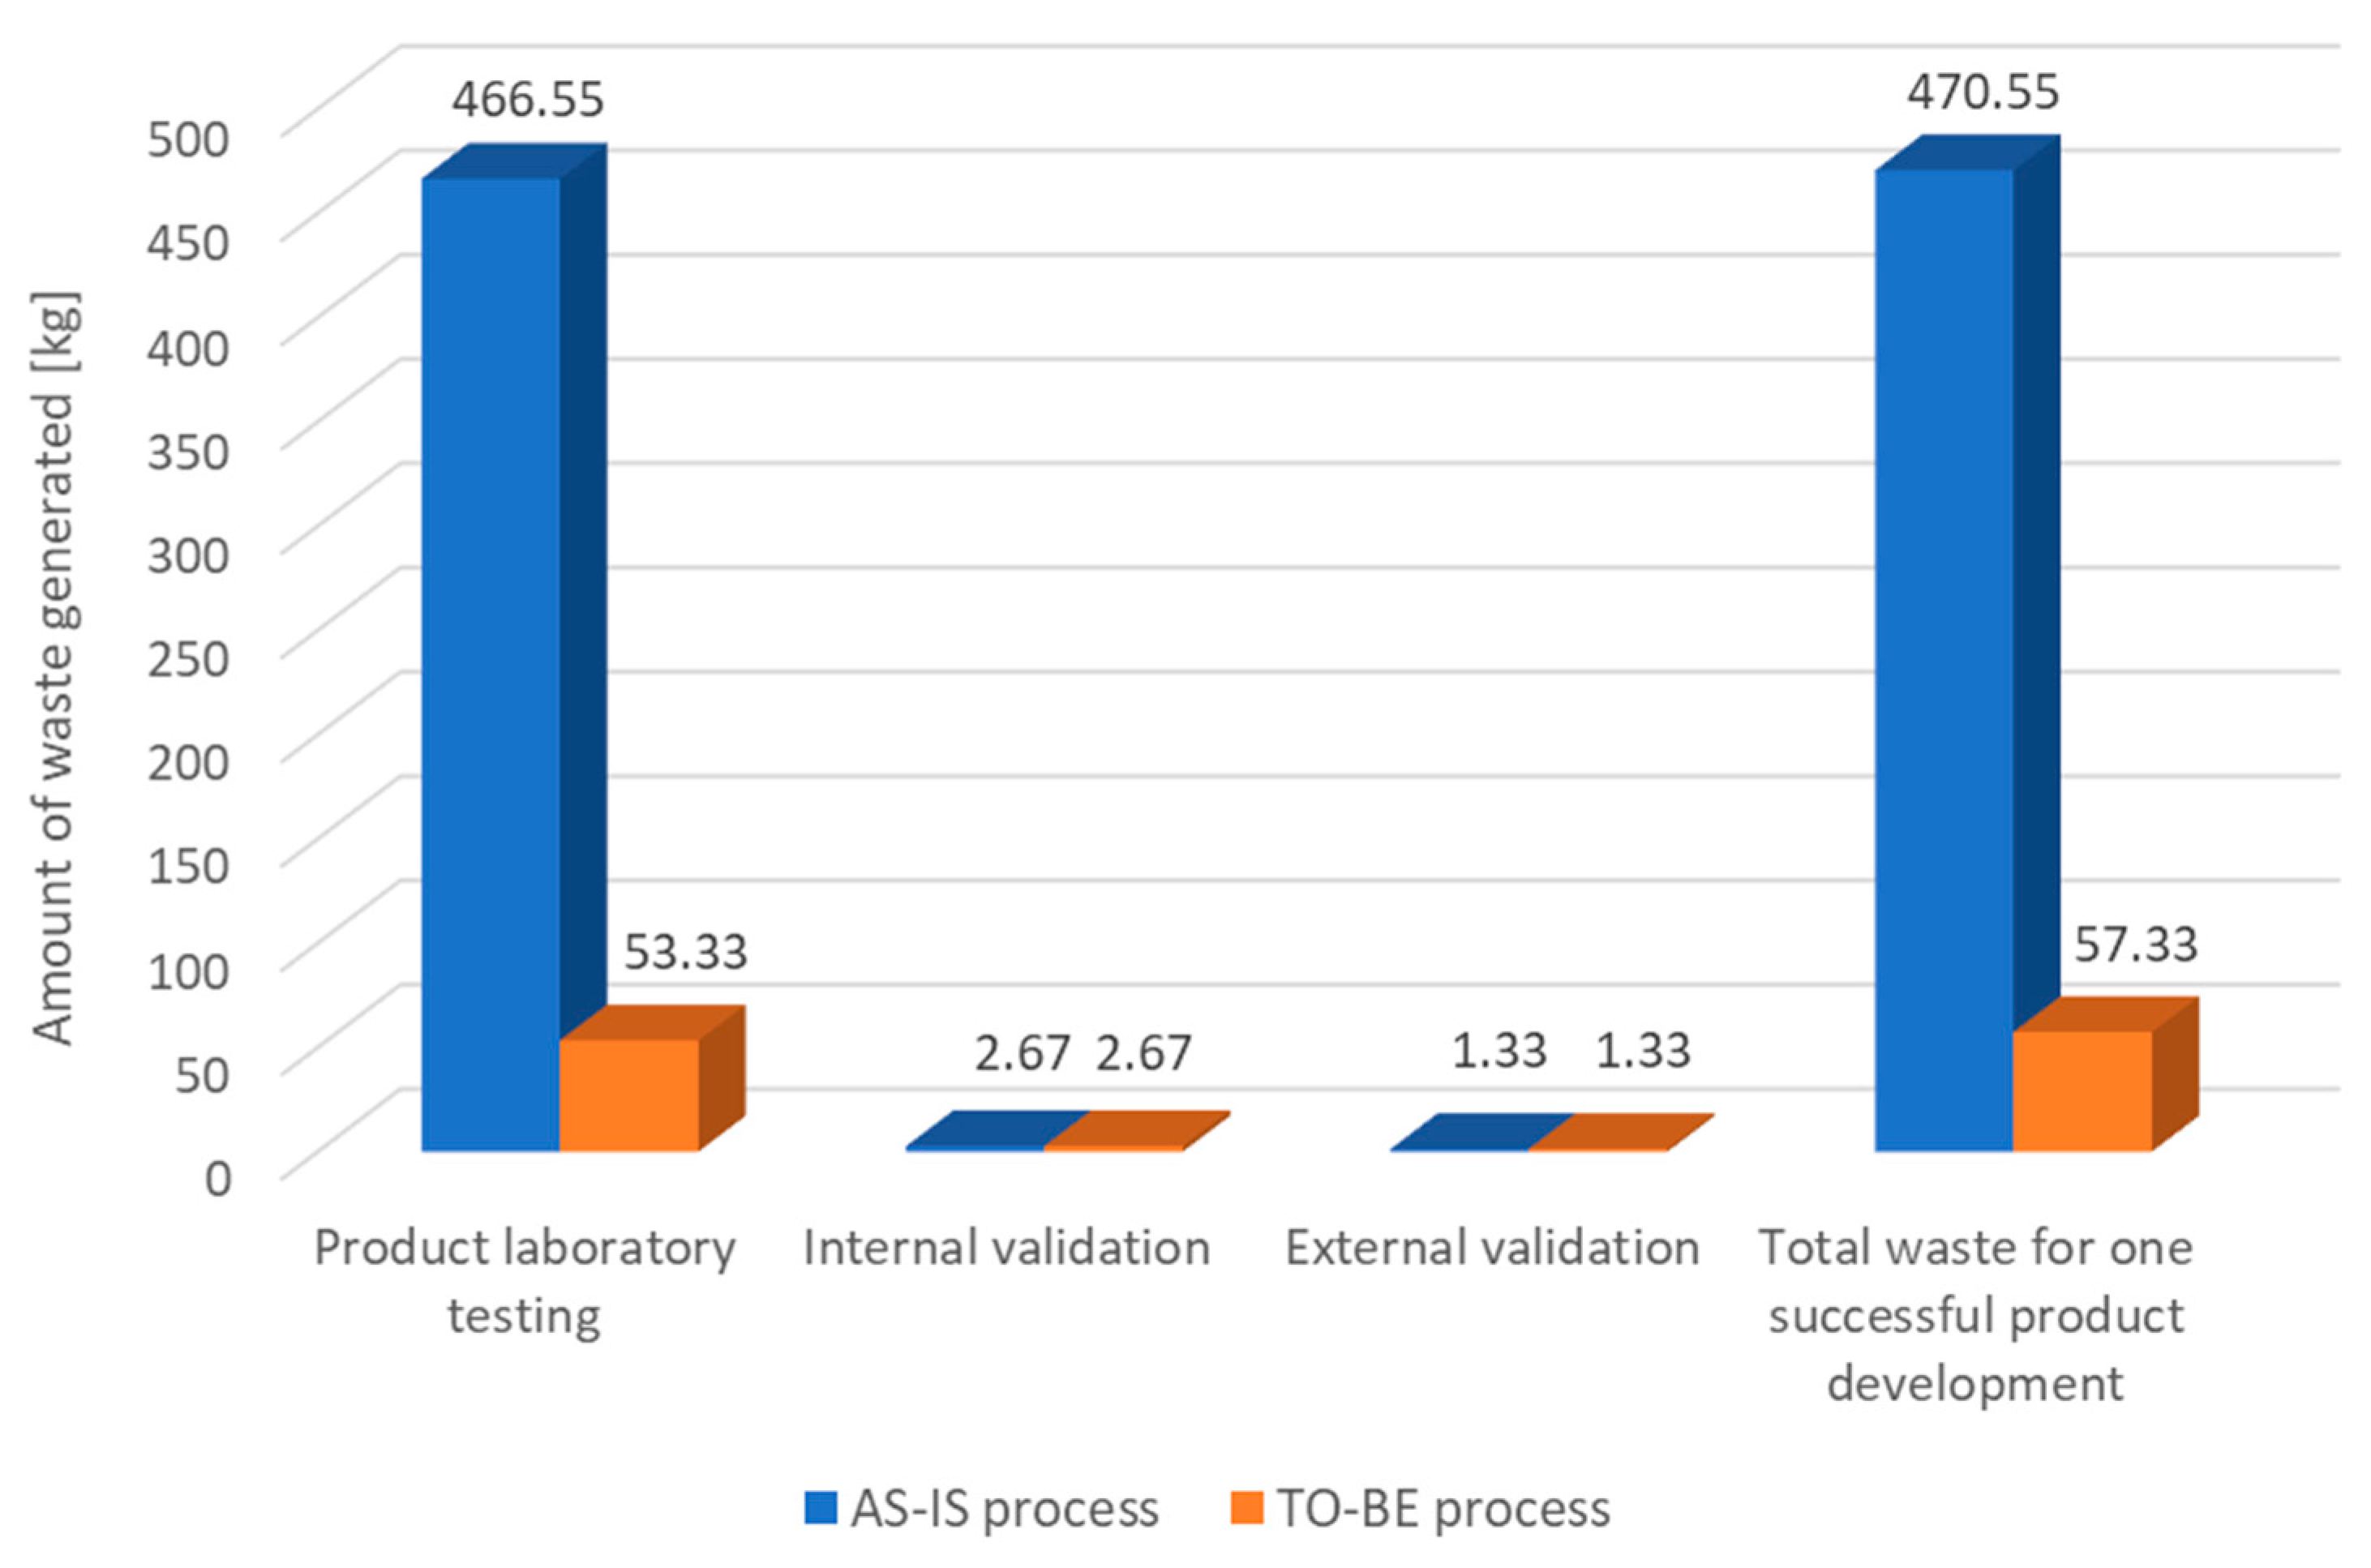
3.2. Case Study on Waste Minimization in the Development of New Products in the Coatings Industry

The research objective was to demonstrate that an innovative approach to organizational changes for sustainable processes can minimize waste and optimize the throughput time and costs of the coating development process.
Different development processes can be divided into two variants of the process:
  • The development of a new product without information communication technology (ICT) support (classic process);
  • The development of a new product with ICT support and a local database.
The dissection of these two process variants into key activities is presented in Table 8. The process variants are the same regarding waste generation but differ in ICT support for process activities. Waste is generated in three activities: product laboratory testing and external and internal validation.
Regarding the research objective, data were collected on the amounts of waste generated during the laboratory testing of each coating sample. The average amount of waste generated during a test is 1 kg. This is assumed based on the average amount of ingredients in a sample, which is from 0.25 to 2.5 kg. In a laboratory test, 20–50 samples are examined. Therefore, 35 samples can be considered an average number for calculating waste minimization. The calculation also considered the number of repetitions of each activity for successful development. Based on the data obtained, it was calculated that the average amount of waste in laboratory testing is 467 kg. The total amount of waste for successful product development must also consider the waste from internal and external product validation. In this case, the total amount of waste is 470.55 kg.
We used the process modeling method to redesign the process and implemented a technical enabler. As a result, we executed measures in the development process to reduce the number of activities and change the sequence of activities. A comparison of the changed state of the development process, which is the result of the executed measures, is shown in Table 9.
The innovative approach to organizational changes for sustainable processes significantly influenced the number of laboratory tests and the time required to execute the redesigned process (time advantage) successfully. A reduced number of laboratory tests leads to an efficient minimization of waste generated by laboratory tests.
After the redesign of the process, the average amount of ingredients in a tested sample remained the same. However, the average number of samples for calculating waste minimization was reduced to 10. This is based on the lower number of samples in each test (5–15) due to the change in the sequence of activities (digital pre-testing of formulations). Thus, the average amount of waste in the redesigned development process was reduced to 53 kg.
The comparison of the amount of waste generated between the classic and the redesigned process is shown in Figure 3.
In addition, several other benefits of the redesigned process were noted: environmental friendliness, shorter throughput times, lower costs, innovations, broader offerings, the ability to produce optimal products, the ability to track progress, and a greater probability of producing niche products in smaller series.
Therefore, the proposed improvement helps to minimize the pollution level (environmental advantage). Laboratory testing is more expensive than computer simulations are because of the price of equipment, human labor, energy, and materials (cost–benefit). Repetitive laboratory work is time-consuming. However, fewer test repetitions leave formulators more time to develop new products (innovative advantage).
The proposed improvement in the coating development process provided significant savings, summarized in Table 10 and graphically presented in Figure 4.

4. Discussion and Conclusions

This research presents an innovative approach to implementing organizational change to create sustainable processes. The theoretical foundations are summarized from the relevant professional and scientific literature. The empirical part is based on the experiences of more than 200 realized organizational improvement implementations.
The literature review [3,4,11,79] and the approach developed suggest the need to confirm a cause–effect relationship between the following:
  • The purpose of organizational changes—operational efficiency indicators;
  • Necessary organizational (process) changes—structural efficiency indicators;
  • Essential process change measures—process improvement methods and techniques.
This research analyzes the experience of implementing organizational improvements, with the following results:
  • The positive impact of process improvement methods and techniques on structural and operational efficiency indicators is confirmed. The results obtained are confirmed by Bait et al. [70] and also by Griesberger et al. [80], who theoretically evaluate the impact of methods and techniques on efficiency indicators. They estimate that, e.g., the cause and effect diagram technique impacts individual elements, such as the resources and process inputs involved.
  • The concurrent positive impact of process improvement methods and techniques on structural and operational efficiency indicators is confirmed. The concurrent positive impact is supported by Djordevic et al. [81] and by the finding [80] that no technique can improve structural efficiency indicators without impacting the improvement of at least one operational efficiency indicator.
The results also suggest that improvements in structural efficiency indicators impact operational efficiency indicators [10], which is also discussed by Urh and Zajec [82], who show that reducing the number of activities positively impacts the time and flexibility of process execution. They also argue that optimizing employees (positions) positively impacts the time and costs of process execution.
All of the evidence confirms the meaningfulness and suitability of an innovative approach to creating sustainable processes. Its success is further confirmed by a case study on redesigning a coating development process using digital transformation (with the implementation of a technical enabler) and process modeling. The organizational improvement purpose was achieved and exceeded, with an 88% reduction in waste and up to a 48% reduction in time and costs. Conversely, flexibility decreased by 50% when the number of process variants was reduced. This is the expected result since, in the presented approach, we focus on the purpose of improvement and at least on preserving the boundary conditions. It is practically impossible to improve all four dimensions of competitive advantage in a single improvement. Similar results were found in other industries [83] when they researched waste reduction.
However, it must be considered that the demonstrated approach is appropriate in the following scenarios:
  • The enterprise plans and implements organizational changes to improve performance through more efficient processes;
  • The enterprise has a system of operational indicators to measure the efficiency of processes. Operational indicators must be measured across all dimensions of competitive advantage for each process and the business system as a whole.
Under the above assumptions, i.e., when the enterprise is sufficiently mature [84,85], the presented approach is suitable to assist management in making organizational change decisions. The approach has the added value of enabling managers to quickly and efficiently select appropriate measures, methods, and techniques that can lead to more sustainable processes and improve the efficiency of enterprises. It also makes it possible to measure the impact of organizational changes after the project is completed and the changes are finally implemented in the enterprise.
The purpose of this research was fully achieved. However, due to the integration of scientific and professional requirements with research and statistical methods, we had to consider the following limitations:
  • We used only the most relevant business process improvement methods and techniques. We imposed this limitation due to the extensive literature in the studied field;
  • We limited the sample of enterprises according to specific criteria for their classification. This limitation was imposed due to the scope of the research and to meet the requirements of statistical methods (e.g., several countries were not included in the sample; enterprises were not divided by business area);
  • Our research did not aim to examine differences between countries. Therefore, the uneven rate of responses by enterprises to the survey by country is irrelevant;
  • In selecting the statistical methods, we considered the limitations imposed by the sample size. We also considered the assumptions of the statistical methods, such as the normal distribution and homogeneity of variances, which depend on the distribution of respondents’ answers.
For future research in this area, we recommend verifying the results obtained using a second sample (expanding the sample size according to other criteria for classifying enterprises) and using other quantitative research methods (e.g., experiments). We also believe that the approach could be complemented in the future with the incorporation of artificial intelligence [86]. The business repository contains a large number of process models and business objects. The large amount of data over several time periods (longitudinal analysis) undoubtedly makes it possible to predict organizational change’s impacts even better with the help of machine learning.

Author Contributions

Conceptualization, E.K.A. and T.K.; methodology, E.K.A. and T.K.; software, E.K.A. and B.U.; validation, T.K.; formal analysis, E.K.A. and B.U.; investigation, E.K.A. and B.U.; resources, T.K.; data curation, E.K.A. and B.U.; writing—original draft preparation, E.K.A.; writing—review and editing, E.K.A., B.U., and T.K.; visualization, E.K.A. and B.U.; supervision, T.K.; project administration, T.K.; funding acquisition, T.K. All authors have read and agreed to the published version of the manuscript.

Funding

The University of Maribor, Faculty of Organizational Sciences and the authors acknowledge the financial support from the Slovenian Research and Innovation Agency (research core funding P5-0018).

Institutional Review Board Statement

Not applicable.

Informed Consent Statement

Not applicable.

Data Availability Statement

The data presented in this study are available on request from the corresponding author.

Acknowledgments

The authors are grateful to the University of Maribor, Faculty of Organizational Sciences, Laboratory of Enterprise Engineering, for supporting the project.

Conflicts of Interest

The authors declare no conflict of interest.

Appendix A

Table A1. Impact of methods on efficiency indicators.
Methods/
Techniques
Reducing the Number of ActivitiesReducing the Number of Employees (Positions)Reducing the Number of DocumentsReducing the Number of DecisionsIncreasing the Percentage of Activities Supported by Information TechnologyShortening
the Process Time
Reducing the Process CostQuality
Improvement of the Process
Flexibility
Improvement of the Process
Brainstorming (47)3.00 12.743.102.983.333.373.073.433.26
Benchmarking (32)2.812.893.003.033.573.532.873.533.39
P. Mapping/
P. Modeling (17)
2.692.803.002.653.313.593.123.652.88
5S (14)3.002.793.312.863.503.363.423.433.23
VSM (7)3.292.502.863.292.433.862.863.143.57
Process Simulation (5)2.602.402.802.002.802.402.402.602.40
PDCA (1)2.003.004.002.004.002.001.005.004.00
Average rating of the impact on the indicator2.902.773.062.903.343.423.003.453.22
Average impact rating per indicator group2.993.27
1 The average positive impacts of the methods and techniques from the same group on each indicator are compared and ranked. The ranking of impacts is color-coded in the tables from white (lowest positive impact) to dark gray (highest positive impact).
Table A2. Impact of techniques on efficiency indicators.
Methods/
Techniques
Reducing the Number of ActivitiesReducing the Number of Employees (Positions)Reducing the Number of DocumentsReducing the Number of DecisionsIncreasing the
Percentage of
Activities Supported by Information
Technology
Shortening
the Process time
Reducing the
Process Cost
Quality
Improvement of the
Process
Flexibility Improvement of the Process
FMEA (11)2.703.113.503.103.403.553.453.823.40
BPMN (9)2.86 13.502.832.882.882.882.433.003.00
Flowchart (8)3.003.133.292.863.874.003.623.633.29
Cause and Effect Diagram (8)2.753.003.142.432.632.882.883.632.63
EPC
(4)
2.252.003.753.503.002.752.753.002.25
Petri Nets (1)2.002.002.002.002.002.002.002.002.00
Average rating of the impact on the indicator2.742.973.242.893.153.253.083.442.97
Average impact rating per indicator group3.003.19
1 The average positive impacts of the methods and techniques from the same group on each indicator are compared and ranked. The ranking of impacts is color-coded in the tables from white (lowest positive impact) to dark gray (highest positive impact).

References

  1. Žužek, T.; Gosar, Ž.; Kušar, J.; Berlec, T. A new product development model for SMEs: Introducing agility to the plan-driven concurrent product development approach. Sustainability 2021, 13, 12159. [Google Scholar] [CrossRef]
  2. Rezaee, Z. Supply chain management and business sustainability synergy: A theoretical and integrated perspective. Sustainability 2018, 10, 275. [Google Scholar] [CrossRef]
  3. van der Aalst, W.M.P.; La Rosa, M.; Santoro, F.M. Business process management: Don’t forget to improve the process! Bus. Inf. Syst. Eng. 2016, 58, 1–6. [Google Scholar] [CrossRef]
  4. Vos, L.; Chalmers, S.E.; Dückers, M.L.; Groenewegen, P.P.; Wagner, C.; van Merode, G.G. Towards an organisation-wide process-oriented organisation of care: A literature review. Implement. Sci. 2011, 6, 8. [Google Scholar] [CrossRef]
  5. Pettersen, J. Defining lean production: Some conceptual and practical issues. TQM J. 2009, 21, 127–142. [Google Scholar] [CrossRef]
  6. Dumas, M.; La Rosa, M.; Mendling, J.; Reijers, H.A. Fundamentals of Business Process Management, 1st ed.; Springer: Berlin/Heidelberg, Germany, 2013; pp. 253–287. [Google Scholar] [CrossRef]
  7. van der Aalst, W. Process Mining: Data Science in Action, 2nd ed.; Springer: Berlin/Heidelberg, Germany, 2016; pp. 25–52. [Google Scholar] [CrossRef]
  8. Shiralkar, K. Just-in-Time manufacturing using cloud computing. Int. J. Eng. Technol. 2017, 3, 405–408. [Google Scholar]
  9. Rosário, A.T.; Dias, J.C. Sustainability and the digital transition: A literature review. Sustainability 2022, 14, 4072. [Google Scholar] [CrossRef]
  10. Krhač Andrašec, E. Business Process Improvement Methods and Techniques and their Impact on the Efficiency of Organizational Systems. Ph.D. Thesis, University of Maribor, Maribor, Slovenia, 1 March 2023. [Google Scholar]
  11. Gazi, F.; Atan, T.; Kılıç, M. The assessment of internal indicators on the balanced scorecard measures of sustainability. Sustainability 2022, 14, 8595. [Google Scholar] [CrossRef]
  12. Kern, T.; Urh, B.; Krhač Andrašec, E. The profitability threshold of organizational changes. In Research Trends and Sustainable Solutions in Enterprise Engineering, 1st ed.; Urh, B., Maletič, M., Eds.; University of Maribor, University Press: Maribor, Slovenia, accepted.
  13. Project Management Institute. A Guide to the Project Management Body of Knowledge (PMBOK®® Guide), 7th ed.; Project Management Institute: Newtown Square, PA, USA, 2021. [Google Scholar]
  14. Kern, T.; Urh, B. Digital transformation of multi project environment in companies and institutions. In Modern Approaches to Enterprise System Engineering, 1st. ed.; Maletič, M., Urh, B., Eds.; University of Maribor, University Press: Maribor, Slovenia, 2022; pp. 7–36. [Google Scholar] [CrossRef]
  15. Van Looy, A.; Shafagatova, A. Business process performance measurement: A structured literature review of indicators, measures and metrics. SpringerPlus 2016, 5, 1797. [Google Scholar] [CrossRef]
  16. Dumas, M.; La Rosa, M.; Mendling, J.; Reijers, H.A. Fundamentals of Business Process Management, 2nd ed.; Springer: Berlin/Heidelberg, Germany, 2018; pp. 297–341. [Google Scholar] [CrossRef]
  17. Chimhamhiwa, D.; van der Molen, P.; Mutanga, O.; Rugege, D. Towards a framework for measuring end to end performance of land administration business processes—A case study. Comput. Environ. Urban Syst. 2009, 33, 293–301. [Google Scholar] [CrossRef]
  18. Longo, A.; Motta, G. Design processes for sustainable performances: A model and a method. In BPM 2005: Business Process Management Workshops: Lecture Notes in Computer Science, 1st ed.; Bussler, C.J., Haller, A., Eds.; Springer: Berlin/Heidelberg, Germany, 2006; Volume 3812, pp. 399–407. [Google Scholar] [CrossRef]
  19. Vernadat, F.; Shah, L.; Etienne, A.; Siadat, A. VR-PMS: A new approach for performance measurement and management of industrial systems. Int. J. Prod. Res. 2013, 51, 7420–7438. [Google Scholar] [CrossRef]
  20. Bhagwat, R.; Sharma, M.K. Performance measurement of supply chain management: A balanced scorecard approach. Comput. Ind. Eng. 2007, 53, 43–62. [Google Scholar] [CrossRef]
  21. Pourshahid, A.; Amyot, D.; Peyton, L.; Ghanavati, S.; Chen, P.; Weiss, M.; Forster, A.J. Business process management with the user requirements notation. Electron. Commer. Res. 2009, 9, 269–316. [Google Scholar] [CrossRef]
  22. Walsh, P. Finding key performance drivers: Some new tools. Total Qual. Manag. 1996, 7, 509–520. [Google Scholar] [CrossRef]
  23. Korherr, B.; List, B. Extending the EPC with Performance Measures. In Proceedings of the ‘07 ACM Symposium on Applied Computing, Seoul, Republic of Korea, 11–15 March 2007. [Google Scholar] [CrossRef]
  24. Kutucuoglu, K.Y.; Hamali, J.; Sharp, J.M.; Irani, Z. Enabling BPR in maintenance through a performance measurement system framework. Int. J. Flex. Manuf. Syst. 2002, 14, 33–52. [Google Scholar] [CrossRef]
  25. Bosilj-Vuksic, V.; Milanovic, L.; Skrinjar, R.; Indihar-Stemberger, M. Organizational Performance Measures for Business Process Management: A Performance Measurement Guideline. In Proceedings of the Tenth International Conference on Computer Modeling and Simulation, Cambridge, UK, 1–3 April 2008. [Google Scholar] [CrossRef]
  26. Glavan, L.M. Understanding process performance measurement systems. Bus. Syst. Res. J. 2012, 2, 25–38. [Google Scholar] [CrossRef]
  27. Gunasekaran, A.; Kobu, B. Performance measures and metrics in logistics and supply chain management: A review of recent literature (1995–2004) for research and applications. Int. J. Prod. Res. 2007, 45, 2819–2840. [Google Scholar] [CrossRef]
  28. Mirsu, D.B. Monitoring help desk process using KPI. In Soft Computing Applications: Advances in Intelligent Systems and Computing, 1st ed.; Balas, V., Fodor, J., Várkonyi-Kóczy, A., Dombi, J., Jain, L., Eds.; Springer: Berlin/Heidelberg, Germany, 2013; Volume 195, pp. 637–647. [Google Scholar] [CrossRef]
  29. Wu, H.Y. Constructing a strategy map for banking institutions with key performance indicators of the balanced scorecard. Eval. Program Plan. 2012, 35, 303–320. [Google Scholar] [CrossRef]
  30. Herzog, N.V.; Polajnar, A.; Pizmoht, P. Performance measurement in business process reengineering. Stroj. Vestn. J. Mech. Eng. 2006, 52, 210–224. [Google Scholar]
  31. Martinsons, M.; Davison, R.; Tse, D. The balanced scorecard: A foundation for the strategic management of information systems. Decis. Support Syst. 1999, 25, 71–88. [Google Scholar] [CrossRef]
  32. Urh, B.; Zajec, M.; Kern, T.; Krhač Andrašec, E. Structural indicators for business process redesign efficiency assessment. In Advances in Manufacturing II: Vol 3—Quality Engineering and Management, 1st ed.; Hamrol, A., Grabowska, M., Maletič, D., Woll, R., Eds.; Springer: Cham, Switzerland, 2019; Volume 3, pp. 16–32. [Google Scholar] [CrossRef]
  33. Rolón, E.; Ruiz, F.; García, F.; Piatiini, M. Applying software metrics to evaluate business process models. CLEI Electron. J. 2006, 9, 5. [Google Scholar] [CrossRef]
  34. Cardoso, J.; Mendling, J.; Neumann, G.; Reijers, H.A. A discourse on complexity of process models. In BPM 2006: Business Process Management Workshops: Lecture Notes in Computer Science, 1st ed.; Eder, J., Dustdar, S., Eds.; Springer: Berlin/Heidelberg, Germany, 2006; Volume 4103, pp. 117–128. [Google Scholar] [CrossRef]
  35. Cardoso, J. Business process control-flow complexity: Metric, evaluation, and validation. Int. J. Web Serv. Res. 2008, 5, 49–76. [Google Scholar] [CrossRef]
  36. Reijers, H.A.; Mendling, J. A study into the factors that influence the understandability of business process models. IEEE Trans. Syst. Man Cybern. Part A Syst. Hum. 2011, 41, 449–462. [Google Scholar] [CrossRef]
  37. Sun, H.; Hou, H. Study on complexity metrics of business process. In Proceedings of the 3rd International Conference on Computer Science and Service System: Advances in Intelligent System Research, Bangkok, Thailand, 13–15 June 2014; Luo, X., Ed.; Atlantis Press: Dordrecht, The Netherlands, 2014; Volume 109, pp. 289–292. [Google Scholar] [CrossRef]
  38. Figl, K. Comprehension of procedural visual business process models—A literature review. Bus. Inf. Syst. Eng. 2017, 59, 41–67. [Google Scholar] [CrossRef]
  39. Urh, B. Predicting the Effectiveness of Business System from the Point of View of Managing Business Process Efficiency. Ph.D. Thesis, University of Maribor, Maribor, Slovenia, 6 March 2012. [Google Scholar]
  40. Davis, R. ARIS Design Platform: Advanced Process Modelling and Administration, 1st ed.; Springer: London, UK, 2008; pp. 155–186. [Google Scholar] [CrossRef]
  41. Franz, P.H.; Kirchmer, M.; Rosemann, M. Value-Driven Business Process Management—Which Values Matter for BPM, 1st ed.; Accenture, Queensland University of Technology (QUT): London, UK; Philadelphia, PA, USA; Brisbane, QLD, Australia, 2011. [Google Scholar]
  42. Schweikhart, S.A.; Dembe, A.E. The applicability of Lean and Six Sigma techniques to clinical and translational research. J. Investig. Med. 2009, 57, 748–755. [Google Scholar] [CrossRef]
  43. Botha, G.J.; Kruger, P.S.; De Vries, M. Enhancing customer experience through business process improvement: An application of the Enhanced Customer Experience Framework (ECEF). S. Afr. J. Ind. Eng. 2012, 23, 39–56. [Google Scholar] [CrossRef]
  44. Boutros, T.; Cardella, J. The Basics of Process Improvement, 1st ed.; CRC Press: New York, NY, USA, 2016; pp. 132–141. [Google Scholar] [CrossRef]
  45. Stoiljković, V.; Trajković, J.; Stoiljković, B. Lean Six Sigma sample analysis process in a microbiology laboratory. J. Med. Biochem. 2011, 30, 346–353. [Google Scholar] [CrossRef]
  46. Pinney, S.J.; Page, A.E.; Jevsevar, D.S.; Bozic, K.J. Current concept review: Quality and process improvement in orthopedics. Orthop. Res. Rev. 2015, 8, 1–11. [Google Scholar] [CrossRef]
  47. Schuller, B.W.; Burns, A.; Ceilley, E.A.; King, A.; LeTourneau, J.; Markovic, A.; Sterkel, L.; Taplin, B.; Wanner, J.; Albert, J.M. Failure mode and effects analysis: A community practice perspective. J. Appl. Clin. Med. Phys. 2017, 18, 258–267. [Google Scholar] [CrossRef]
  48. Amjad, A.; Azam, F.; Anwar, M.W.; Butt, W.H.; Rashid, M. Event-driven process chain for modeling and verification of business requirements—A systematic literature review. IEEE Access 2018, 6, 9027–9048. [Google Scholar] [CrossRef]
  49. Valiris, G.; Glykas, M. Business analysis metrics for business process redesign. Bus. Process Manag. J. 2004, 10, 445–480. [Google Scholar] [CrossRef]
  50. Structural Business Statistics Overview. Available online: https://ec.europa.eu/eurostat/statistics-explained/index.php/Structural_business_statistics_overview#Size_class_analysis (accessed on 12 January 2021).
  51. Sectoral Share of the Number of Enterprises within the Non-Financial Business Economy, EU. Available online: https://ec.europa.eu/eurostat/statistics-explained/index.php?title=File:Sectoral_share_of_the_number_of_enterprises_within_the_non-financial_business_economy,_EU,_2018.png (accessed on 12 January 2021).
  52. Analysis of Non-Financial Business Economy Value Added and Employment, EU. 2018. Available online: https://ec.europa.eu/eurostat/statistics-explained/index.php?title=File:Analysis_of_non-financial_business_economy_value_added_and_employment,_EU,_2018_FP18.png (accessed on 12 January 2021).
  53. Value Added, 2017 (Billion EUR). Available online: https://ec.europa.eu/eurostat/statistics-explained/index.php?title=File:T1_Value_added,_2017_(billion_EUR)_FP18.png#file (accessed on 12 January 2021).
  54. Annual Enterprise Statistics for Special Aggregates of Activities (NACE Rev. 2). Available online: https://ec.europa.eu/eurostat/databrowser/view/SBS_NA_SCA_R2__custom_1524839/default/table?lang=en (accessed on 12 January 2021).
  55. Jové-Llopis, E.; Segarra-Blasco, A. Eco-efficiency actions and firm growth in European SMEs. Sustainability 2018, 10, 281. [Google Scholar] [CrossRef]
  56. 1ka. Available online: https://www.1ka.si/ (accessed on 9 February 2021).
  57. Sivo, S.A.; Saunders, C.; Chang, Q.; Jiang, J.J. How low should you go? Low response rates and the validity of inference in IS questionnaire research. J. Assoc. Inf. Syst. 2006, 7, 351–414. [Google Scholar] [CrossRef]
  58. Baruch, Y.; Holtom, B.C. Survey response rate levels and trends in organizational research. Hum. Relat. 2008, 61, 1139–1160. [Google Scholar] [CrossRef]
  59. Morton, S.M.B.; Bandara, D.K.; Robinson, E.M.; Atatoa Carr, P.E. In the 21st century, what is an acceptable response rate? Aust. N. Z. J. Public Health 2012, 36, 106–108. [Google Scholar] [CrossRef]
  60. Sample Size Calculator. Available online: http://www.raosoft.com/samplesize.html (accessed on 18 August 2021).
  61. Sekaran, U. Research Methods for Business: A Skill-Building Approach, 4th ed.; John Wiley & Sons Inc.: Hoboken, NJ, USA, 2003. [Google Scholar]
  62. Bohorquez, S.J.; Van den Berg, P.; Akkerman, J.; Mestach, D.; Van Loon, S.; Repp, J. High-throughput paint optimization by use of a pigment-dispersing polymer. Surf. Coat. Int. 2015, 98, 85–89. [Google Scholar]
  63. Langille, M.; Izmitli, A.; Lan, T.; Agrawal, A.; Liu, C.; Henderson, K.; Lu, Y. Balancing performance of slip/mar additives using a high throughput approach. Coatingstech 2018, 15, 52–56. [Google Scholar]
  64. Judson, R.; Richard, A.; Dix, D.J.; Houck, K.; Martin, M.; Kavlock, R.; Dellarco, V.; Henry, T.; Holderman, T.; Sayre, P.; et al. The toxicity data landscape for environmental chemicals. Environ. Health Perspect. 2009, 117, 685–695. [Google Scholar] [CrossRef]
  65. Dionisio, K.L.; Frame, A.M.; Goldsmith, M.R.; Wambaugh, J.F.; Liddell, A.; Cathey, T.; Smith, D.; Vail, J.; Ernstoff, A.S.; Fantke, P.; et al. Exploring consumer exposure pathways and patterns of use for chemicals in the environment. Toxicol. Rep. 2015, 2, 228–237. [Google Scholar] [CrossRef]
  66. Dionisio, K.L.; Phillips, K.; Price, P.S.; Grulke, C.M.; Williams, A.; Biryol, D.; Hong, T.; Isaacs, K.K. The chemical and products database, a resource for exposure-relevant data on chemicals in consumer products. Sci. Data 2018, 5, 180125. [Google Scholar] [CrossRef]
  67. Askham, C.; Gade, A.L.; Hanssen, O.J. Linking chemical risk information with life cycle assessment in product development. J. Clean. Prod. 2013, 51, 196–204. [Google Scholar] [CrossRef]
  68. Kern, T.; Krhač Andrašec, E.; Senegačnik, M.; Urh, B. Digitalizing the paints and coatings development process. Processes 2019, 7, 539. [Google Scholar] [CrossRef]
  69. Bokolo, A.J.; Mazlina, A.M.; Awanis, R. A proposed model for green practice adoption and implementation in information technology based organizations. Probl. Sustain. Dev. 2018, 13, 95–112. [Google Scholar]
  70. Bait, S.; Di Pietro, A.; Schiraldi, M.M. Waste reduction in production processes through simulation and VSM. Sustainability 2020, 12, 3291. [Google Scholar] [CrossRef]
  71. Camodeca, R.; Almici, A. Digital Transformation and Convergence toward the 2030 Agenda’s Sustainability Development Goals: Evidence from Italian Listed Firms. Sustainability 2021, 13, 11831. [Google Scholar] [CrossRef]
  72. Elektronik Informationstechnik in DIN und VDE, German Standardization Roadmap, Industrie 4.0. Available online: https://www.din.de/blob/65354/57218767bd6da1927b181b9f2a0d5b39/roadmap-i4-0-e-data.pdf (accessed on 30 November 2018).
  73. ALLCHEMIST®. Available online: https://www.allchemist.net/ (accessed on 7 November 2019).
  74. Urh, B.; Senegačnik, M.; Kern, T.; Krhač Andrašec, E. Reducing laboratory test waste in the coating development process. Pol. J. Environ. Stud. 2020, 29, 3841–3851. [Google Scholar] [CrossRef]
  75. Kern, T.; Krhač Andrašec, E.; Urh, B.; Senegačnik, M. Digital transformation reduces costs of the paints and coatings development process. Coatings 2020, 10, 703. [Google Scholar] [CrossRef]
  76. Binomial Test—Simple Tutorial. Available online: https://www.spss-tutorials.com/binomial-test/ (accessed on 10 September 2021).
  77. Jesenko, J. Statistika v Organizaciji in Managementu, 1st ed.; Moderna Organizacija: Kranj, Slovenia, 2001. [Google Scholar]
  78. Binomial Test and 95% Confidence Interval (CI) Using SPSS Statistics. Available online: https://statistics.laerd.com/spss-tutorials/binomial-test-using-spss-statistics.php (accessed on 10 September 2021).
  79. Hoffman, K.A.; Green, C.A.; Ford, J.H., II; Wisdom, J.P.; Gustafson, D.H.; McCarty, D. Improving quality of care in substance abuse treatment using five key process improvement principles. J. Behav. Health Serv. Res. 2012, 39, 234–244. [Google Scholar] [CrossRef]
  80. Griesberger, P.; Leist, S.; Zellner, G. Analysis of Techniques for Business Process Improvement. In Proceedings of the 19th European Conference on Information Systems (ECIS 2011), Helsinki, Finland, 9–11 June 2011; Available online: https://aisel.aisnet.org/ecis2011/20 (accessed on 17 December 2020).
  81. Zahar Djordjevic, M.; Djordjevic, A.; Klochkova, E.; Misic, M. Application of modern digital systems and approaches to business process management. Sustainability 2022, 14, 1697. [Google Scholar] [CrossRef]
  82. Urh, B.; Zajec, M. Connectedness of structural and operational business processes efficiency. Uporab. Inform. 2016, 24, 178–190. [Google Scholar]
  83. Micheli, G.J.L.; Cagno, E.; Tappia, E. Improving eco-efficiency through waste reduction beyond the boundaries of a firm: Evidence from a multiplant case in the ceramic industry. Sustainability 2018, 10, 167. [Google Scholar] [CrossRef]
  84. Novak, R.; Janeš, A. Merjenje Zrelosti Procesne Usmerjenosti, 1st ed.; University of Primorska Press: Koper, Slovenia, 2007. [Google Scholar]
  85. Digital Business Maturity Model: 9 Essential Competencies to Assess Digital Business Maturity. Available online: www.gartner.com/en/documents/3983264 (accessed on 8 March 2023).
  86. Paullada, A.; Raji, I.D.; Bender, E.M.; Denton, E.; Hanna, A. Data and its (dis)contents: A survey of dataset development and use in machine learning research. Patterns 2021, 2, 100336. [Google Scholar] [CrossRef]
Figure 1. Impact of methods and techniques on structural efficiency indicators (source: own elaboration).
Sustainability 15 15706 g001
Figure 2. Impact of methods and techniques on operational efficiency indicators (source: own elaboration).
Sustainability 15 15706 g002
Figure 3. The comparison of the generated waste amount in the classic and redesigned development process (source: own elaboration).
Sustainability 15 15706 g003
Figure 4. Changed dimensions of competitive advantage in a devil’s quadrant of the coating development process (source: own elaboration).
Sustainability 15 15706 g004
Table 1. Calculation of the medium and large enterprises covered (source: own elaboration).
CountrySix Business
Areas (Medium
Enterprises)
Six Business
Areas (Large
Enterprises)
Medium
Enterprises
Large
Enterprises
Percentage Covered
Medium
Enterprises
Percentage
Covered Large
Enterprises
Slovenia1001188118223384.69%80.69%
Croatia1525329186141681.95%79.09%
Germany46,031871561,63412,13974.68%71.79%
Sweden44667795527103180.80%75.56%
Table 2. Representative sample by country, size, and the purpose of enterprises (source: own elaboration).
CountryMedium
Enterprises
Large
Enterprises
Material
Enterprises
Non-Material
Enterprises
Slovenia2461614
Croatia2461317
Germany2551218
Sweden273921
Table 3. Response rate by country (source: own elaboration).
CountryTotal Number of
Enterprises
Response Rate
Slovenia87914.7%
Croatia50312.1%
Germany7972.3%
Sweden6330.8%
Total28127.6%
Table 4. Impact of methods and techniques on structural efficiency indicators (source: own elaboration).
Methods/
Techniques
The Number
of Activities
The Number
of Employees
(Positions)
The Number
of Documents
The Number
of Decision
The Percentage of Activities Supported by Information Technology
Methods (123) 1<0.0010.007<0.001<0.001<0.001
Techniques (41)0.0040.2700.2700.013<0.001
Benchmarking (32)<0.0010.0700.0250.0250.007
Brainstorming (47)0.0120.4780.0120.0120.135
P. Mapping/
P. Modeling (17)
0.0500.1640.1640.0080.050
5S (14)0.0180.0180.1010.0180.018
FMEA (11)0.1970.4550.4550.1970.197
1 Numbers in parentheses represents the sample size for each test. In all the following tables, numbers in parentheses represent the sample size for each test.
Table 5. Impact of methods and techniques on operational efficiency indicators (source: own elaboration).
Methods/
Techniques
The Process
Execution Time
The Process
Execution Cost
The Quality of
Process Execution
The Flexibility of
Process Execution
Methods (123)<0.001<0.001<0.001<0.001
Techniques (41)<0.001<0.001<0.0010.004
Benchmarking (32)<0.0010.001<0.0010.001
Brainstorming (47)0.0040.032<0.0010.004
P. Mapping/
P. Modeling (17)
0.0080.0080.0080.008
5S (14)0.0180.2810.0180.101
FMEA (11)0.0420.0420.0420.197
Table 6. Population mean tests for structural efficiency indicators (source: own elaboration).
Methods/
Techniques
The Number
of Activities
The Number
of Employees
(Positions)
The Number
of Documents
The Number
of Decision
The Percentage of Activities
Supported by
Information
Technology
Methods<0.001 (117)0.003 (104)<0.001 (112)<0.001 (115)<0.001 (112)
Techniques0.077 (38)0.006 (33)<0.001 (33)0.015 (37)<0.001 (39)
Benchmarking0.080 (32)0.031 (28)0.012 (29)0.004 (29)<0.001 (30)
Brainstorming<0.001 (42)0.076 (35)<0.001 (42)0.005 (42)<0.001 (39)
P. Mapping/
P. Modeling
0.180 (16)0.136 (15)0.064 (15)0.276 (17)0.002 (16)
5S0.037 (14)0.146 (14)0.003 (13)0.108 (14)0.002 (14)
FMEA0.283 (10)0.008 (9)0.004 (8)0.015 (10)0.013 (10)
Table 7. Population mean test for operational efficiency indicators (source: own elaboration).
Methods/
Techniques
The Process
Execution Time
The Process
Execution Cost
The Quality of
Process Execution
The Flexibility of
Process Execution
Methods<0.001 (119)<0.001 (114)<0.001 (120)<0.001 (117)
Techniques<0.001 (40)0.001 (39)<0.001 (41)0.007 (38)
Benchmarking<0.001 (32)0.045 (31)<0.001 (32)<0.001 (31)
Brainstorming<0.001 (43)<0.001 (41)<0.001 (44)<0.001 (43)
P. Mapping/
P. Modeling
<0.001 (17)0.010 (17)<0.001 (17)0.054 (17)
5S0.002 (14)0.007 (12)0.005 (14)0.016 (13)
FMEA0.012 (11)0.003 (11)<0.001 (11)0.019 (10)
Table 8. Breakdown of the AS-IS development process into key activities (source: own elaboration).
New Product Development Process
(Without ICT Support or
with ICT Support and a Local Database)
##Process Activity
10Creating a new product idea
20Market analysis of existing products
30Searching for suitable binders
40Study of binders’ properties
50Searching for pigments
60Searching for additives
70Searching for solvents
80Searching for fillers
90Formulation of (modified) formulations
100Ordering samples
110Product laboratory testing
120Product parameter measurement
130Product hazard identification
140Product price calculating
150Internal validation
160External validation
170Preparation of documentation draft
180Creating documentation
Table 9. The sequence of process activities after digital transformation (TO-BE process) (source: own elaboration).
New Product Development Process
(with ICT Support and a Cloud-Based Database)
##Process Activity## 2ICT
10Creating a new product idea104
20Market analysis of existing products20
30Searching for suitable binders30
40Study of binders’ properties3
50Searching for pigments50⇨40
0Searching for additives60⇨50
70Searching for solvents70⇨60
80Searching for fillers80⇨70
90Formulation of (modified) formulations90⇨80
100Ordering samples100⇨130
110Product laboratory testing110⇨140
120Product parameter measurement (calculation) 1120⇨90
130Product hazard identification130⇨100
140Product price calculating140⇨110
150Internal validation150
160External validation160
170Preparation of documentation draft3
180Creating documentation180⇨120
1 Product parameters can be calculated instead of measured using the ICT solution. 2 Changed sequence (number) of activities in the redesigned process. 3 Activity is not required in the redesigned process. 4 Activity execution is supported by ICT.
Table 10. Summary of key savings from the redesigned development process (source: own elaboration).
Dimensions of Competitive AdvantageTotal for One
Successful
Product Development
ProcessWaste
(kg)
Process Throughput Time
(h)
Process
Execution
Cost
(EUR )
Number of Process
Variants
AS-IS470.553853.4650,326.832
TO-BE57.332018.8225,716.451
QualityWaste reduction (%) 87.82%
TimeThroughput time reduction (%): 47.61%
CostCost reduction (%) 48%
FlexibilityReduction in number of process variants (%) −50%
Disclaimer/Publisher’s Note: The statements, opinions and data contained in all publications are solely those of the individual author(s) and contributor(s) and not of MDPI and/or the editor(s). MDPI and/or the editor(s) disclaim responsibility for any injury to people or property resulting from any ideas, methods, instructions or products referred to in the content.

