Article

Assessment of Seabream Fisheries Stock of Oman Using the Monte Carlo Catch Maximum Sustainable Yield and the Bayesian Schaefer Model Methods

by
Yasmin Al Alawi
1,2 and
Sachinandan Dutta
1,*
1
Department of Marine Science and Fisheries, College of Agricultural and Marine Sciences, Sultan Qaboos University, P.O. Box 34, Al-Khoudh 123, Oman
2
Ministry of Agriculture, Fisheries and Water Resources, P.O. Box 427, Muscat 100, Oman
*
Author to whom correspondence should be addressed.
Sustainability 2023, 15(22), 15692; https://doi.org/10.3390/su152215692
Submission received: 18 September 2023 / Revised: 23 October 2023 / Accepted: 24 October 2023 / Published: 7 November 2023
(This article belongs to the Topic Aquatic Environment Research for Sustainable Development)

Abstract

:
The establishment of managerial approaches for the sustainable use of fishery resources depends on a critical understanding of the stock status. The Monte Carlo catch maximum sustainable yield (CMSY) method and a Bayesian state–space implementation of the Schaefer model (BSM) are recent, but widely used, stock assessment methods for data-limited situations. Here, CMSY and BSM were used to evaluate the state and exploitation level of the seabream population. Collections of catch and effort data from 1988 to 2021, pertaining to time series, were obtained from the Fishery Statistics Book published by the Ministry of Agriculture, Fisheries and Water Resources of Oman. The CMSY and BSM results were similar, indicating that the seabream stock of Oman was overfished, as B/BMSY = 0.96 (<1) and F/FMSY = 1.25 (>1). The probability that the stock was being overfished and undergoing overfishing in 2021 was 53%, while the probability that the stock was healthy (high biomass and low fishing pressure) was only 16.2%, when the target should be higher than 75%. The conclusions are of a preliminary nature owing to the utilization of comparatively new methodologies employed to generate them, which commonly validate the condition and utilization of the populations under investigation. Our research suggests that the seabream population in Oman is overfished, and reducing fishing activity is necessary to restore its abundance.

1. Introduction

The assessment of fish stock dynamics is a fundamental part of maintaining and managing a fishery [1,2,3,4]. Fish stock assessment can assist a manager in determining the appropriate time and intensity at which to fish a species to sustain its population [4]. Stock assessment methods use a combination of qualitative and quantitative information to detect the elements that have an impact on the parameters of the population dynamics, such as its maturation, fertility, natural mortality, fishing mortality, and growth rate [5]. Generally, the lack of sufficient and accurate data of fisheries often contributes to the unsustainability and overexploitation of fisheries in the Arabian Gulf [6,7]. According to the FAO’s (2022) [8] long-term monitoring of marine fish stocks and fishery resources, they are continuously being depleted. From 90% in 1974 to 65.8% in 2017, the percentage of fish stocks that are biologically sustainable has declined globally [8]. Only a few stock assessments in the Arabian Gulf have been conducted at the species level because the majority of capture data are reported at the family level, making it impossible to conduct assessments (such as catch-at-age) using single species [7]. The catch maximum sustainable yield (CMSY) was offered as a new technique for calculating the MSY and related variables using only catch data and a Monte Carlo model, such as carrying capacity (k) and the intrinsic rate of population increase [9,10,11,12]. In the traditional method of stock assessment, survey and fishery data are used, but these are hard to access, and from 90% of the global fishery stocks. little information is available [13]. The CMSY software also includes a Bayesian state–space Schaefer surplus production model (BSM) to estimate stock status when additional abundance data are available. Whenever an index of relative abundance is the only available information, fishery stock assessment frequently uses Bayesian state–space surplus production models. It can be difficult to diagnose poor fits into simple models such as these, even when they are relatively simple [14]. Catch and effort statistics, a biomass index, or a measure of relative abundance (for example, catch per unit of work) are required as inputs [9,12,15]. In the evaluation of stocks with limited data, the methodologies of CMSY and BSM have gained significant recognition due to their heavy reliance on catch data and supplementary qualitative information for the estimation of biomass and associated data [10,11,16,17]. With CMSY and BSM analyses, the relative stock status and key reference points of a species could be obtained, aiding in the development of sustainable management strategies of various fisheries [15,16,18].
Historically, the coastal populations of Arab Gulf regions have relied heavily on fish for their protein needs [19]. Since the inception of the sixth millennium BC, the detection of fisheries has functioned as a significant economic endeavor for the inhabitants of the region [7]. The Gulf Cooperation Council (GCC) is a group of countries that includes Saudi Arabia, Bahrain, Kuwait, Oman, Qatar, and the United Arab Emirates, and possesses a rich marine resource base, such as coral reefs and coastal wetlands, which are supplying protein for various countries [20]. During the last two decades, the fishery production of the Gulf has been rapidly increasing, with an annual catch of around 671,000 tons, of which 71% was from artisanal fisheries, as the effort increased dramatically [21]. However, the catch per unit effort is declining; therefore, the fish stocks of the GCC region have declined due to an increase in fishing pressure and the degradation of important ecosystems that support fisheries [22]. Fisheries in Oman are generally artisanal, coastal, and industrial, and over 50% of Oman’s population in the coastal region rely on fisheries [23]; therefore, fisheries have been valuable sources of employment and food security as early as the 1960s. The coastal waters of Oman are highly productive and rich in biodiversity [24].
In the Arabian Gulf and the Sea of Oman, seabream is an important and widespread species [25]. A total of eight species of Acanthopagrus sp. are found in the Western Indian Ocean, including the Red Sea and Arabian Gulf: Acanthopagrus arabicus [26], A. berda, A. bifasciatus, A. catenula, A. omanensis, A. randalli, A. sheim, and A. vagus [27]. Argyrops filamentosus (Valenciennes) (Sparidae) is one of the most commonly consumed commercial seabream fish and is an appealing aquaculture species [28]. Acanthopagrus sp. is mainly caught by the traps and stake nets used by commercial fishers in Kuwait [29]. There are many seabream species in Iraqi marine waters. such as A. arabicus, A. berda, Sparidentex hasta, and Argyrops spinifer. Trawlers, gill nets, traps (Gargoors), and handlines are used to capture these species. According to Mohamed and Al-Hassani (2021) [30], seabream accounted for almost 6% of the fisheries’ total landings in Kuwait. In Oman, Acanthopagrus bifasciatus, Argyrops filamentosus, and Sparidae species are the most widely recorded and characterized seabreams [31].
Seabreams inhabit temperate and tropical coastal waters and they are popular targets for recreational anglers worldwide [6,29]. Seabream are ‘cyclic migrants’ because their spawning occurs in the open sea, while the juveniles move into shallow areas with water depths of less than five meters [32]. Adult seabreams migrate back to deep areas of sea, which explains the abundance of the seabream population across the Indian ocean, Mediterranean, and Persian (Arabian) Gulf [33]. Seabream species exhibit a wide distribution in the Red Sea and Arabian Gulf, as well as in the regions of southeastern Africa, the Sea of Japan, South Asia, New Caledonia, and Australia [27]. They are most commonly observed in shallow, warm coastal waters and estuaries [27]. Approximately 23.3% of the total seabream catch is from Turkey, which produces 273.977 tons [34]. A significant part of Omani fishing is the catch of seabream, either by using gill nets, trammel nets, and hand lines or through industrial fishing (trawlers). There is considerable commercial and recreational importance of seabreams throughout their size range because they are excellent food fish [25]. Oman’s fishing industry is primarily artisanal and coastal [23,35]. The amount of fish caught by artisanal fishing in 2021 was 94.3%, commercial fishing contributed 5% through nine longline and netting vessels, and coastal fishing contributed 0.5% [31]. In the Arabian sea and the Gulf of Oman, there is a high demand for knowledge about the population structure of seabreams and the impact of oceanographic parameters such as salinity, temperature, and dissolved oxygen on the population dynamics of seabreams [30]. Between 2016 and 2022, fish production in the Gulf of the Oman tripled to reach more than 900,000 tons worth OMR 432 million (OMR 1 = USD 2.6) [31]. Fisheries have increased their contribution by 130% over the last decade. About 92% of the seabream catch is from the Arabian Sea in 2021, with 16,525 tons valued at OMR 12 million [31]. Data relating to commercial fishery in Oman are scarce, insufficient, or even nonexistent for numerous species. Therefore, the traditional fishery management policies such as creation of a marine protected area, the closure of spawning grounds, and mesh size limitations were the main focuses of Oman’s marine fishery management. It is also difficult to determine the total allowable catch (TAC) and stock status in Oman because of the insignificant amount of seabream data available and the lack of studies being performed on MSY and stock status at the moment. This paper aims to conduct stock assessment and to estimate the biological reference points (BRPs) of the seabream fisheries in Oman in order to ensure their sustainable exploitation, conservation and recommend management measures by using CMSY and the related Bayesian Schaefer model (BSM) [36] on catch-effort data. The applicability of the model results depend on the specific management objectives, such as to assess the sustainability of seabream fisheries and set catch limits. The rationale behind this methodology is to conduct a robust assessment of the seabream fish population in Omani waters, considering data limitations and incorporating uncertainty. The results of this assessment can guide sustainable fishery management practices and conservation efforts to ensure the long-term health of the seabream population.

2. Materials and Methods
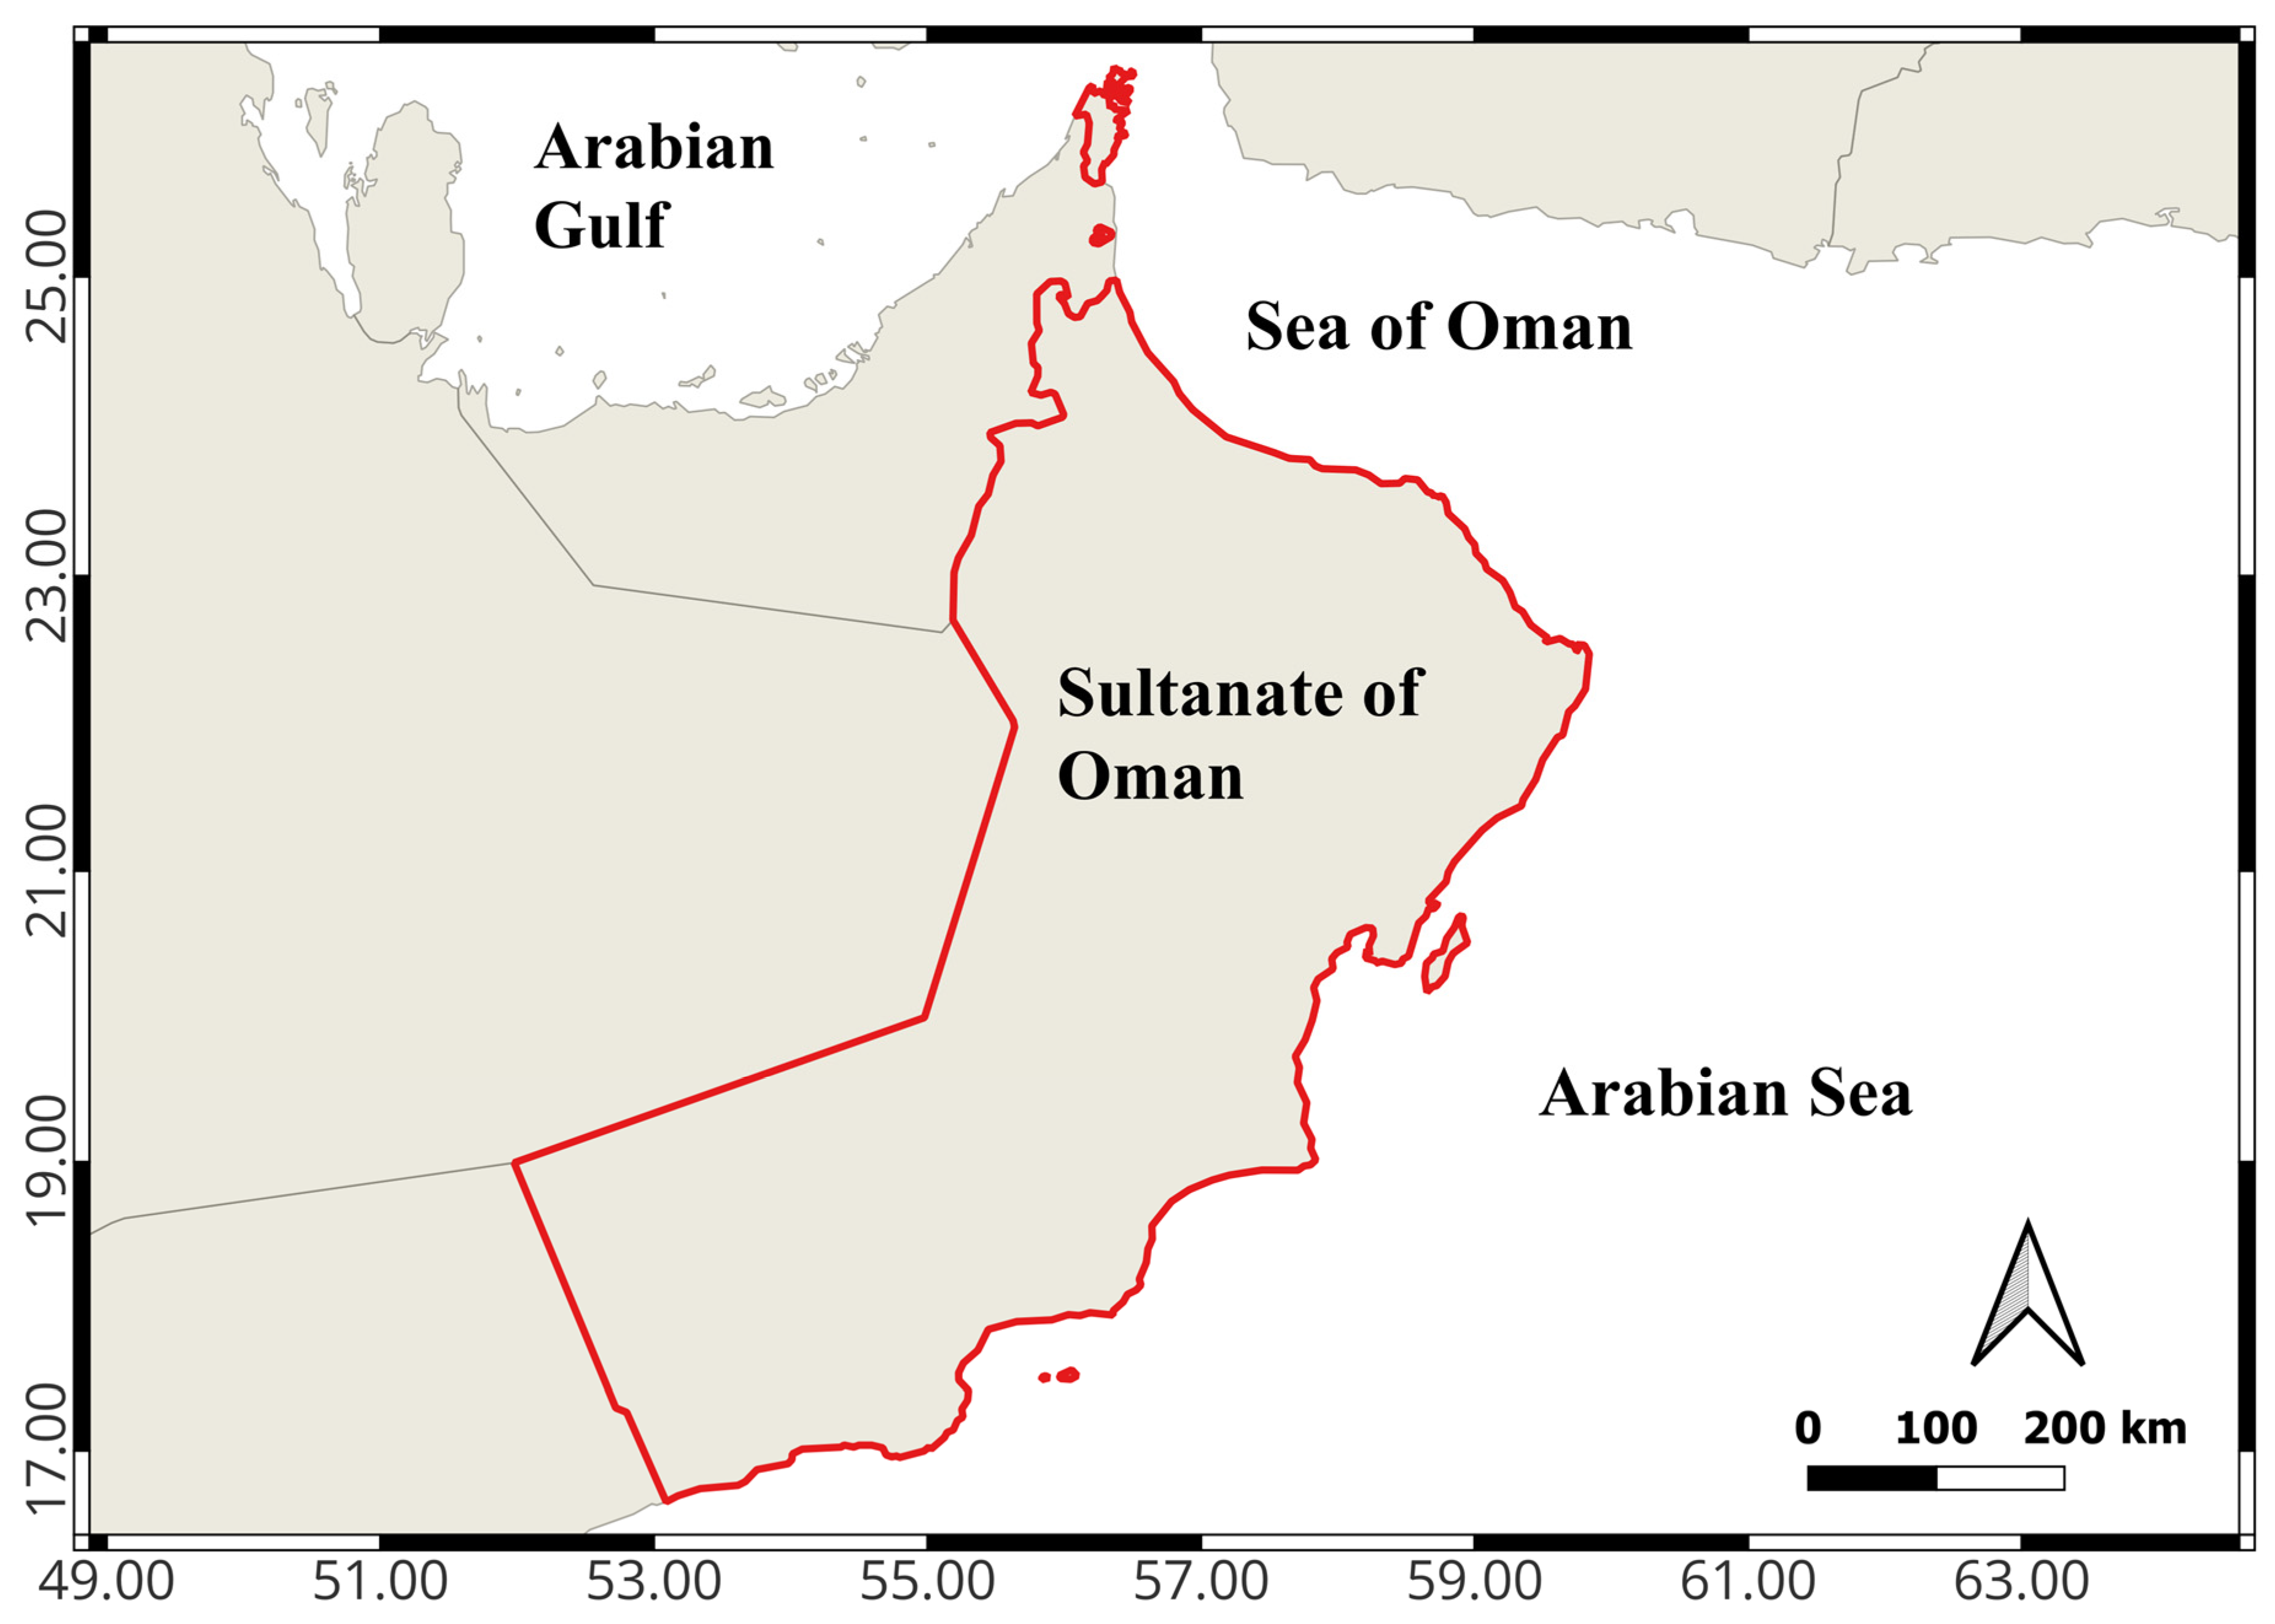
2.1. Study Area

The Arabian Gulf, Oman Sea, and Arabian Sea surround Oman, which is situated in the northwest of the Indian Ocean (see Figure 1). The southwest monsoon dominates the research area which is a major factor in enhancing fish productivity because upwelling waters enriched with nutrients enhance the fish productivity of the region [37].

2.2. Data Source

The Fishery Statistics Book of the Ministry of Agriculture, Fisheries and Water Resources (MAFWR) of Oman is the source of annual catch (tons) and effort (number of boats) data for the seabream fisheries from 1988 to 2021.

2.3. CMSY and BSM Methods

The present study utilizes the CMSY package, (CMSY ++16 version, https://oceanrep.geomar.de/id/eprint/52147/, accessed on 20 March 2023), which runs the CMSY and BSM models jointly. In this way, a biomass trajectory is formed according to the catches and to the stock’s growth rate (Figure 2A) determined by resilience (r) and carrying capacity (k). Thousands of such trajectories are generated using the method’s Monte Carlo component, each with a different assumption of the parameters r and k. Out of these, the trajectories that possess viable solutions are identified [36]. After the prior values and landings data are provided to the model, the following phase of the procedure is to identify viable r-k couples (Figure 2B). The probable r-k pair, along with its approximate 95% confidence bounds, is located in close proximity to the vertex of the triangle formed by the attainable r-k pairs uncovered through the CMSY and BSM methodologies within the logarithmic domain of the plot [36]. The correlation between carrying capacity (k) and r values is effectively illustrated by both CMSY and BSM, resulting in a 95% confidence interval (CI) that identifies the optimal pair of r-k values (Figure 2B). The Bayesian state–space Schaefer surplus production model (BSM) was utilized in CMSY R-code to accommodate for the fluctuation in population dynamics (process error) as well as measurement and sampling (observation error) [10,11]. In contrast to the frequently employed Schaefer surplus production model [10], the CMSY and BSM models posit that the increase in population adheres to logistic curves in its inherent nature. The Markov Chain Monte Carlo technique [36] the JAGS (just another Gibbs sampler) program is utilized to sample the probability distributions of the parameters [38]. Based on the equation below, in the subsequent year (t + 1), biomass (Bt+1) follows:
B t + 1 = B t + r ( 1 B t k ) B t C t
Bt represents the biomass at year t, r represents the intrinsic rate of population growth, k represents the carrying capacity (assumed to be equal to the unexploited population size), and Ct represents the catch in year t.
In the presence of severe depletion (biomass below 0.25 k), Equation (1) is modified to accommodate “depensation”, i.e., reduced recruitment at low biomass levels [39], as shown in Equation (2):
B t + 1   = B t + ( r 4 B t / k ) ( 1 B t / k ) B t C t   I B t / k < 0.25
Typically, 4Bt/k means that recruitment declines linearly below half of the biomass capable of producing MSY. The CMSY method utilizes a Monte Carlo method to ascertain feasible population biomass paths. This is achieved by considering time series of catches and qualitative stock status information, including the compatibility with catch time series, the compatibility with assumed priors for biomass reductions, and the occurrence within viable r-k ranges. The parameter pair is deemed as “viable” provided that its corresponding biomass trajectory neither collapses nor surpasses the maximum threshold representing the percentage of carrying capacity (k), which is assumed to be remaining at the conclusion of the time series being investigated [36]. The findings indicate that the most likely combination of r and k is observed in close proximity to the apex of a triangular cluster in a bivariate graph of r versus k. The fishery database is generally used to investigate if a depleted stock could be recovered to the level of biomass that will yield the maximum sustainable yield (BMSY) [40]. BRPs (B/BMSY, F/FMSY) are derived by using BSM [17].

2.4. Identifying the r-k Space’s Boundaries

The default values for r-ranges in the case of seabream were established by converting the estimates of resilience in FishBase [41]. The resilience for the seabream group was set as medium resilience [41], suggesting that viable values could be expected within the range of carrying capacity for stocks with low prior biomass at the end of the time series:
k l o w = max ( C ) / r h i g h ; k h i g h = 4 m a x ( C ) / r l o w
The CMSY method explores the variety of r-values between klow and khigh, where klow the representation denotes the lower and upper limits of the preceding k range, while the maximum catch is indicated by max(C). Furthermore, the rlow signifies the lower and upper bounds of the explored range of r-values.
Equation (4) was used in the scenario of slightly depleted stocks with high previous biomass at the end of the time series:
k l o w = 2 m a x C / r h i g h   ; k h i g h = 12 m a x ( C ) / r l o w
where the parameters are defined as in Equation (3).
A log-space bin with equal width was used to assign all available r values, and the 75th percentile of the occupied bins’ mid-values was utilized to obtained the most likely r value. The most likely k value is calculated using linear regression if the r value is greater than the 50th percentile of the mid-values of the occupied bins:
M S Y = r k / 4 = log ( 4 M S Y ) + ( 1 ) log ( r )
As a result of fitting Equation (6) inversely and defining the standard deviation of r as a constant distribution between 0.001 and 0.02 irf, here are the parameters of the equation:
i r f = 3 / ( r h i g h r l o w )  
irf is an opposite sort influence used to define r, rhigh, and rlow are defined in the previous section.
For data-limited stocks, quantity can be predicted using the Schaeffer model and a catchability coefficient (q) in Equation (7):
C P U E t = q B t
The catchability coefficient is represented by q, where CPUEt indicates the average catch per unit effort in year t and Bt is the biomass in year t.
Equation (7) expresses abundance dynamics as CPUE:
                      C P U E t + 1 = C P U E t + r ( 1 C P U E t / q K ) C P U E t q C t
Using Equations (1) and (7), the parameters and variables have been characterized, and the prior for q can be calculated using Equation (9):
Y = r B ( 1 B / k )
where Y: yield or catch of fish, B: biomass or population size of fish, r: intrinsic growth rate of the fish population, k: carrying capacity of the environment for the fish population.
Stocks with recent high biomass are given by the lower and higher priors as follows:
q l o w = 0.25 r p g m C P U E m e a n / C m e a n
q h i g h = 0.5 h i g h C P U E m e a n / C m e a n
When the stock has a high recent biomass, qlow and qhigh are the prior catchability coefficients’ upper and lower boundaries, rpgm is the geometric mean, rhigh is the upper prior range.
The variable CPUEmean represents the mean of the catch per unit effort (CPUE) for the preceding five-year period. Similarly, the variable Cmean depicts the average quantity of caught fish during the same time frame.
There was a change to 0.5 multipliers for stocks with recent qlow and 1.0 multipliers for stocks with recent qhigh. In the previous five-year period, an evaluation was conducted on species exhibiting medium and high degrees of resilience, whereas an assessment on species characterized by low or very low levels of resilience was carried out a decade ago.

2.5. Setting Prior Biomass Ranges

CMSY and BSM require prior knowledge about biomass in relation to the carrying capacity (k). In addition to the previously mentioned biomass range, we also incorporated an unexploited biomass range (Bstart/k) and a bend range (Bend/k) at both the beginning and ending of the time sequence, respectively. According to Liang et al. (2020) [10], if an intermediate year in the time series is deemed remarkable, for example, extraordinarily low biomass or exceptionally high biomass, then relative intermediate biomass for that year should also be included as a previous.

3. Results and Discussion

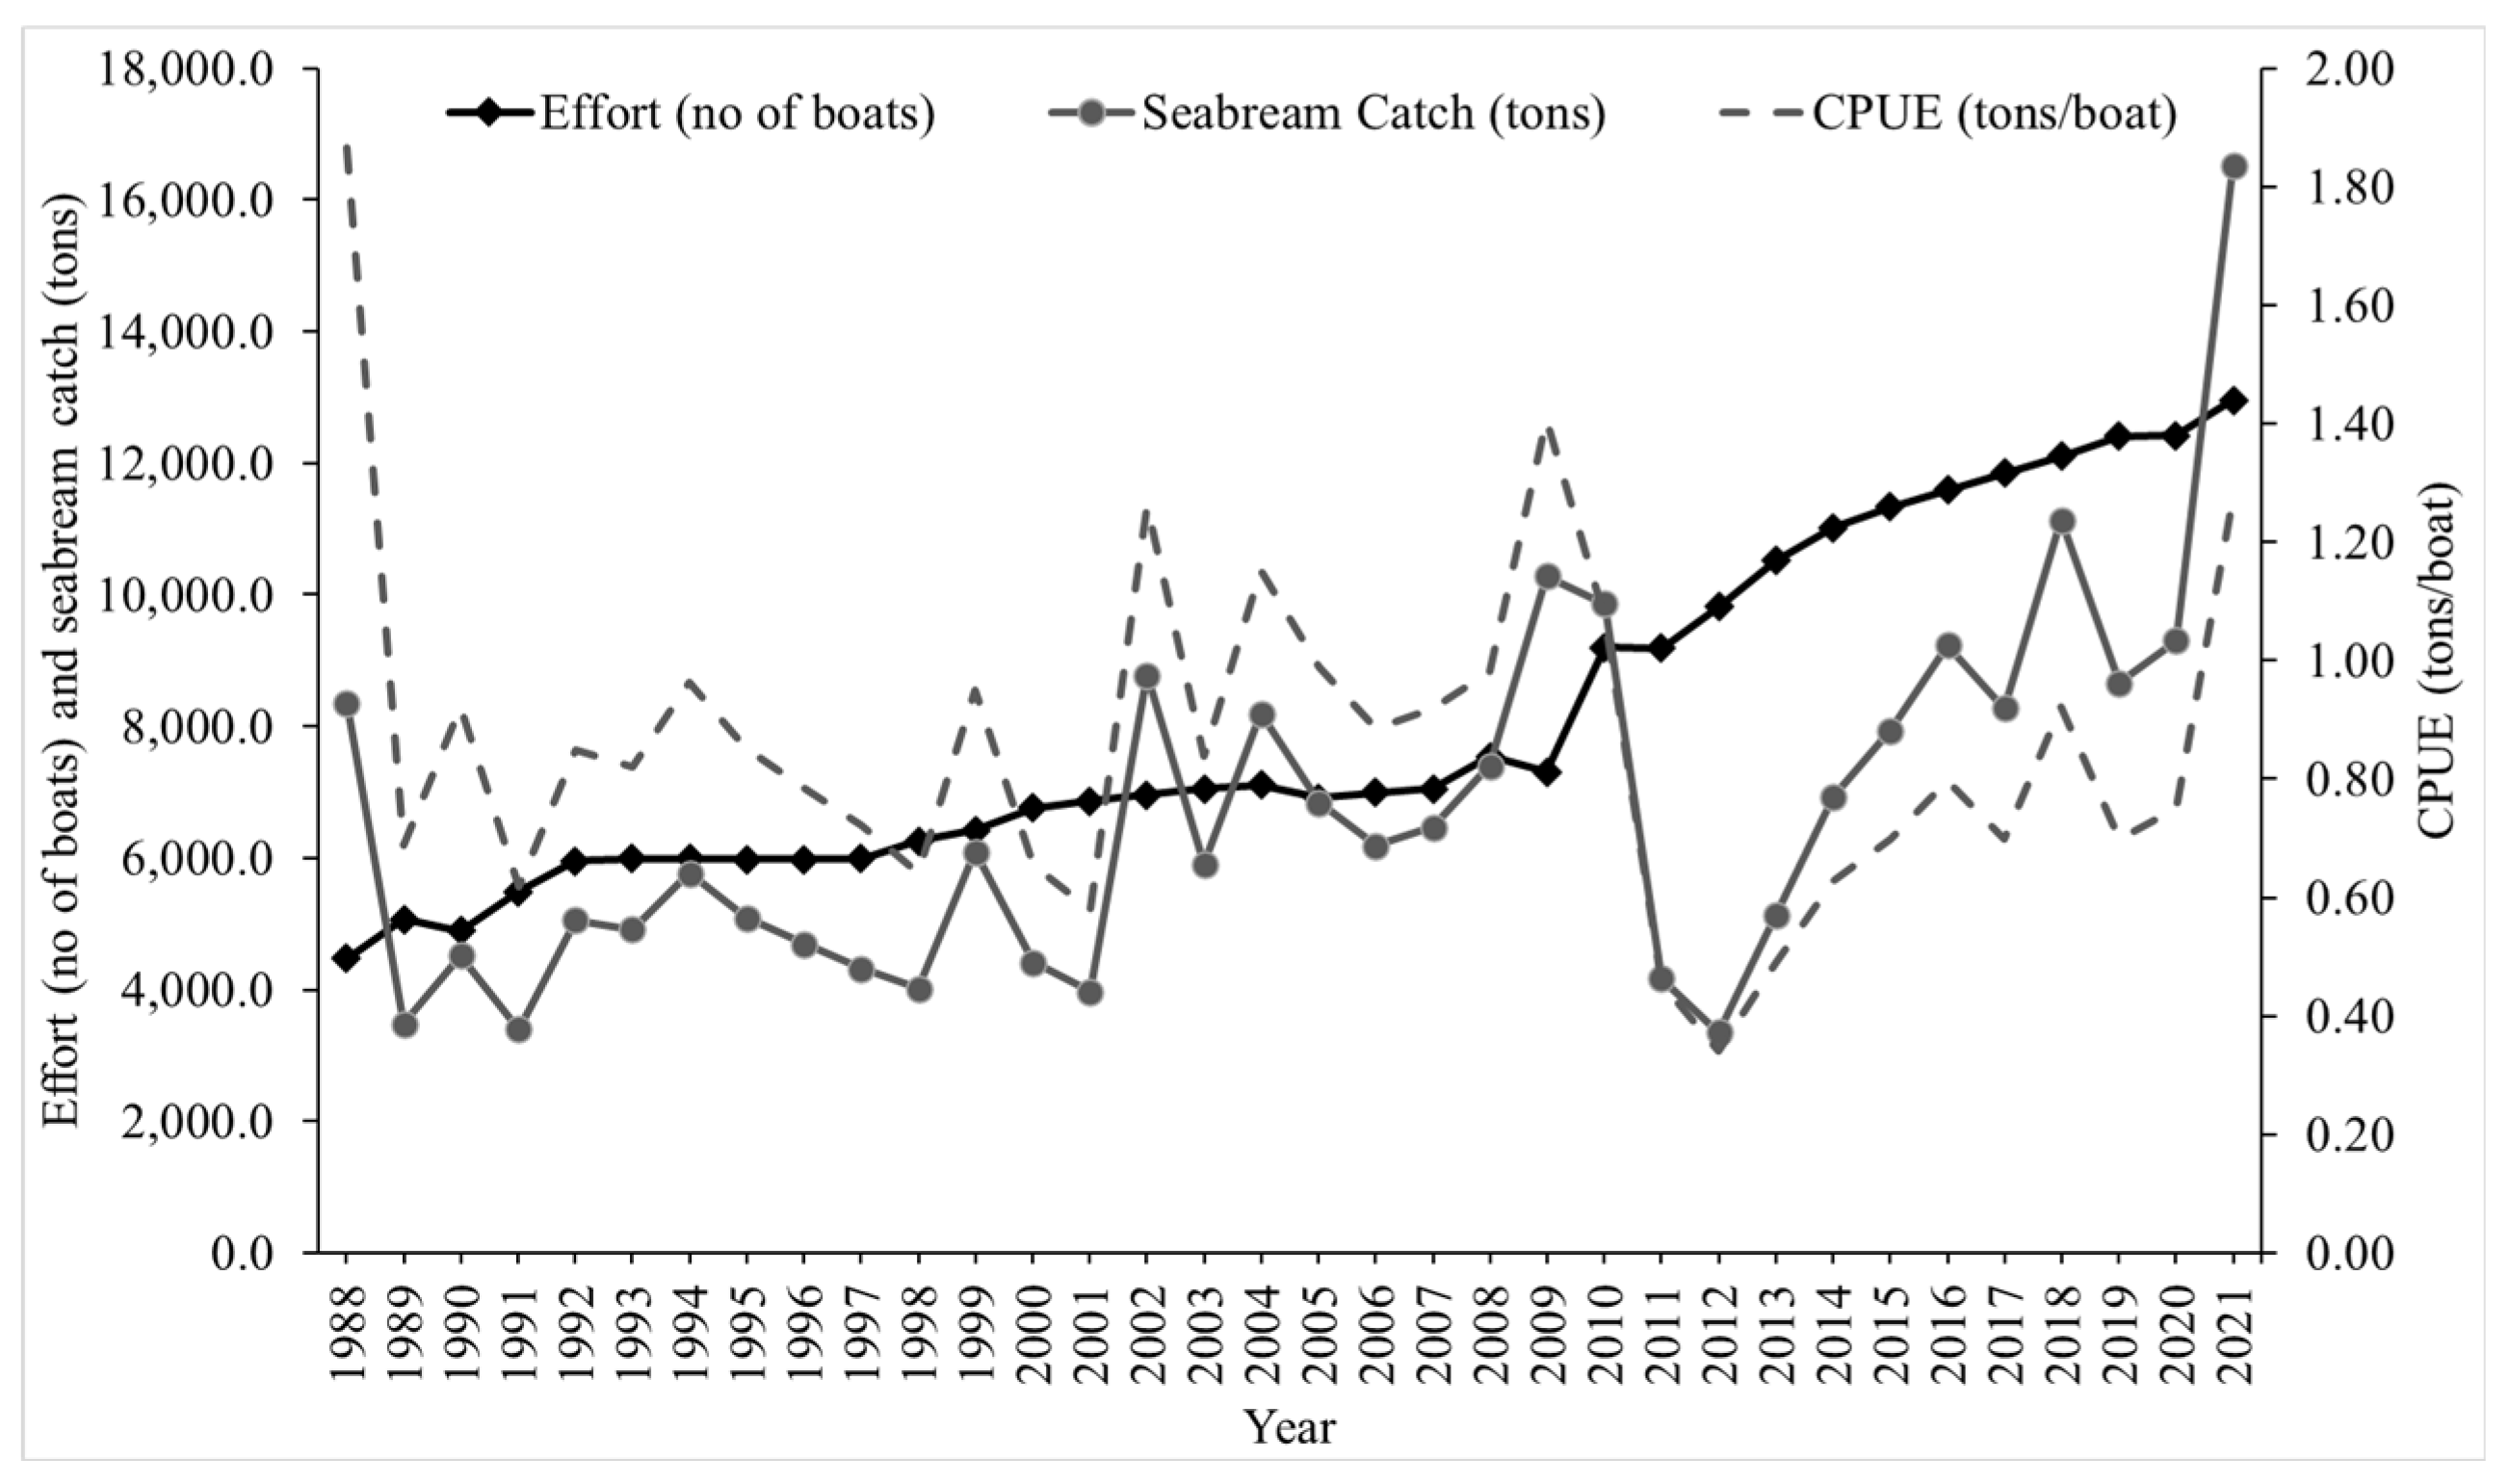
3.1. Catch, Effort and CPUE

The total catch of seabream in Oman from 1988 to 2021 was 179,139.93 tons, the average catch was 6728 tons, the 2012 catch was the lowest ever reported, i.e., 3352.2 tons and the highest was16,525.3 tons in 2021 (Figure 3). The highest CPUE (1.87 tons/boat) was recorded in 1988 and the lowest (0.34 tons/boat) in 2012 (Figure 3). The average CPUE per boat from 1988 to 2021 was 0.86 tons. The CPUE changed substantially over the study period (t = 17.05, p < 0.001, df = 33). Memon et al. (2015) [42] estimated the mean CPUE was 0.261 metric tons/boat of king soldier bream (Argyrops spinifer) in Pakistan during 1985 to 2009.

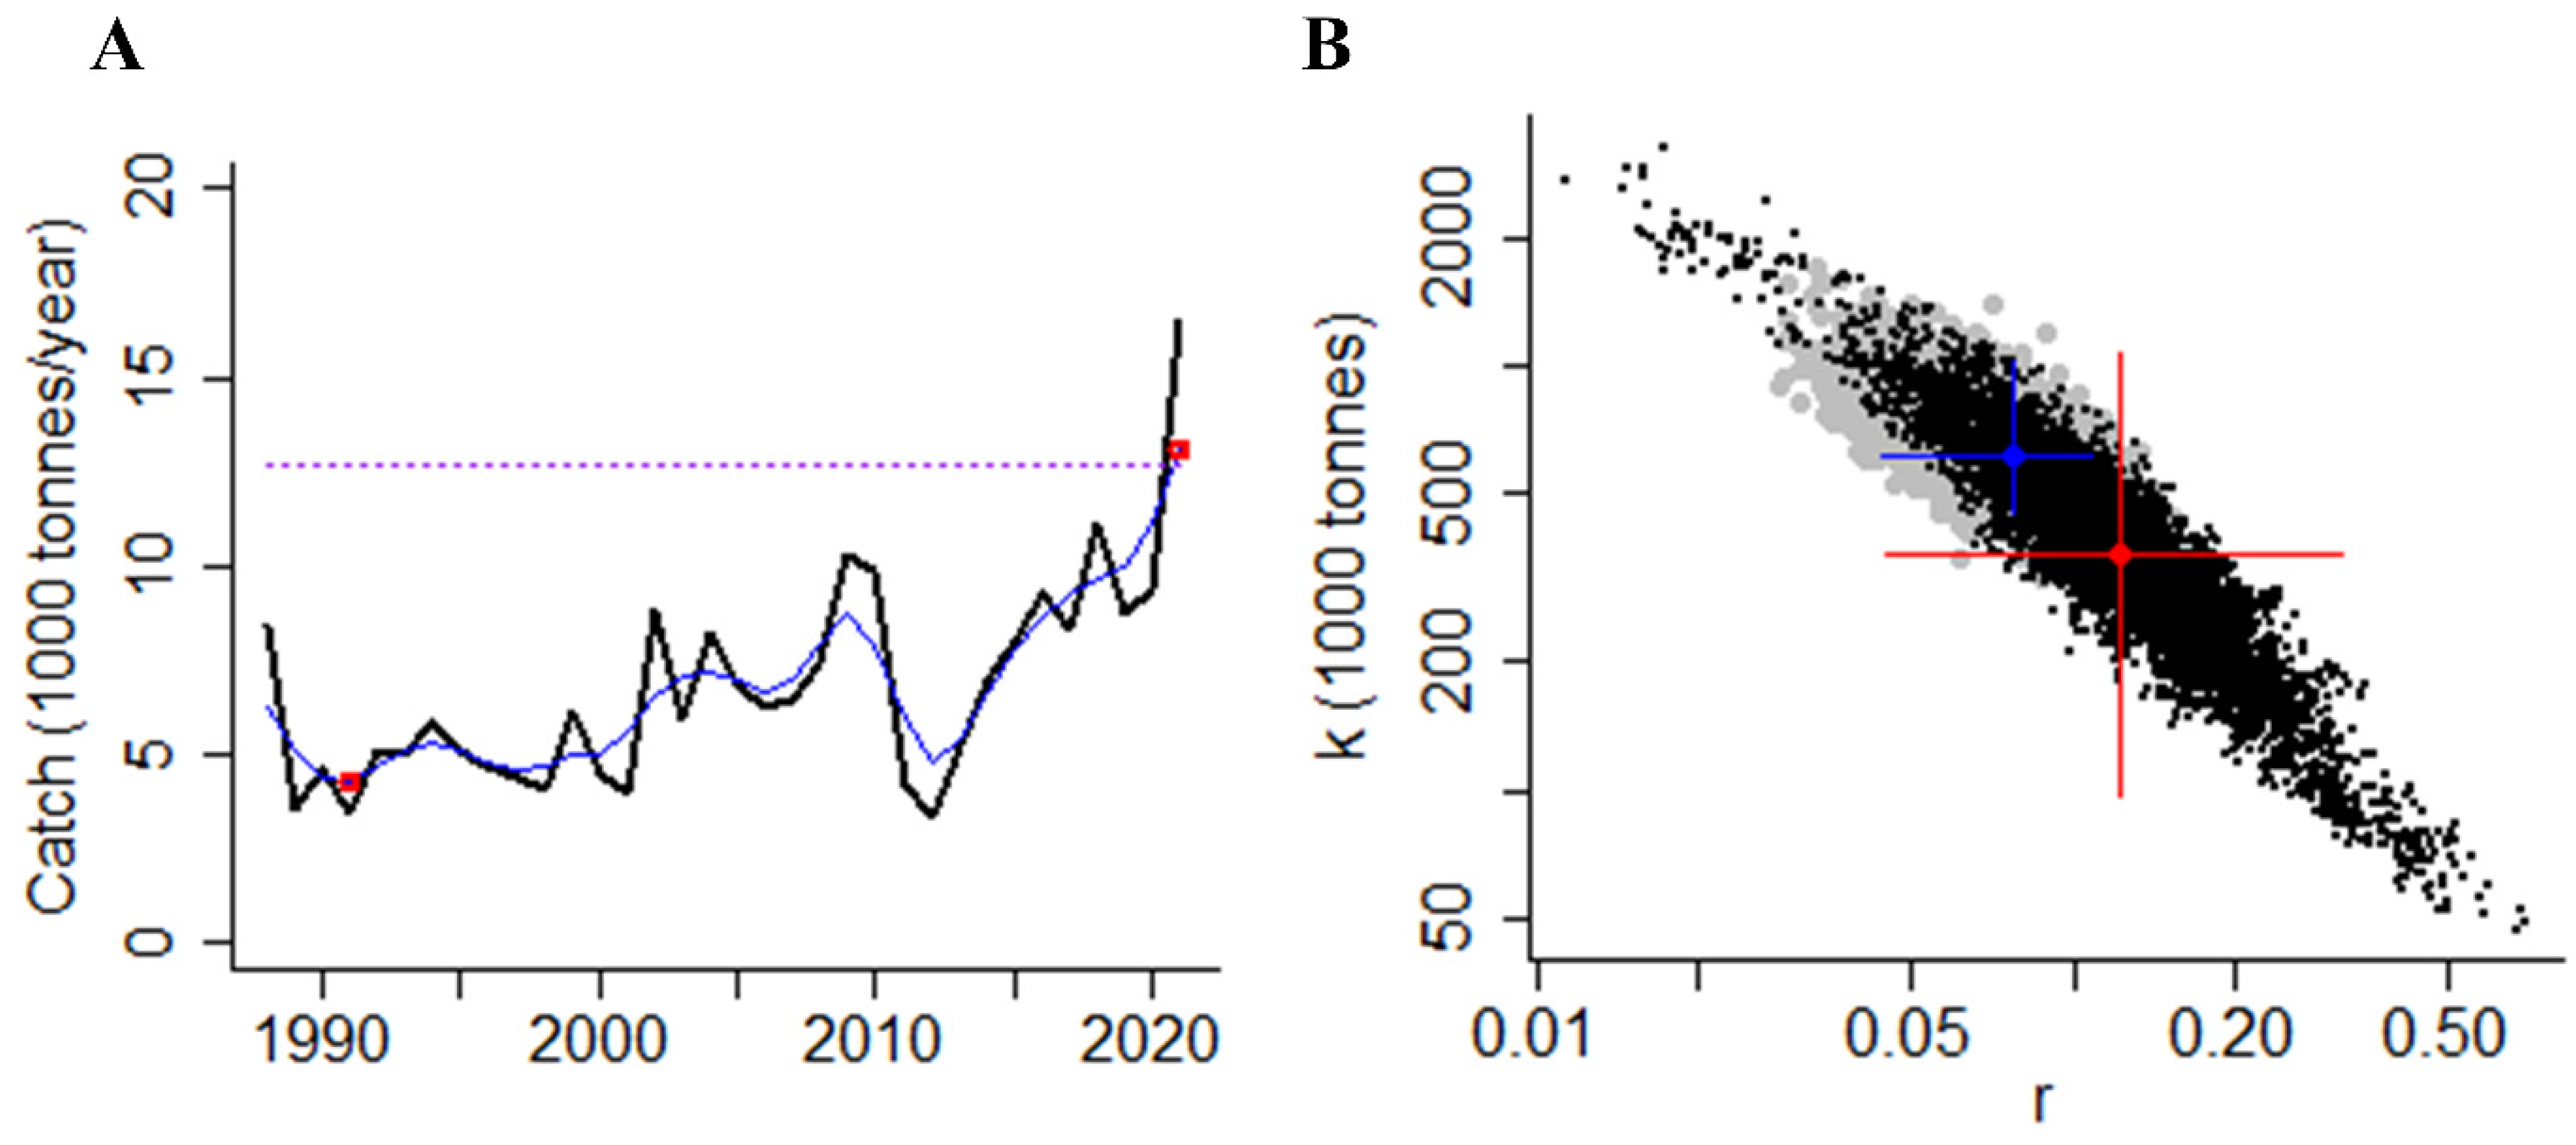
3.2. Key Parameter (k, q, r, MSY)

Table 1 depicts the contributions of the CMSY and BSM approaches to stock information and critical characteristics such as carrying capacity (k), intrinsic biological growth rate (r), catchability coefficient (q), and maximum sustainable yield (MSY). Their capacity of k (611,000 mt) in the CMSY method is higher than in the BSM (363,000 mt) method. On the contrary, the biological growth rate (r) yield by BSM method is higher than the CMSY method with values of 0.121 and 0.0772, respectively. According to CMSY, the MSY of seabream population of Oman was 11,800 tons whereas the MSY was 11,000 tons in the BSM method (Table 1). A comparative analysis of k, q, and r of seabream in Pakistan revealed that they were 20,464 tons, 0.00000744 tons and 0.1, respectively [43]. Memon et al. (2017) [43] calculated the results using the CEDA method which is based on the input initial proportion (IP). Considering an IP of 0.51 as a result of starting biomass over carrying capacity, the estimations of MSY and model parameters are complemented by their confidence bounds, as provided in Table 1. Both the CMSY and BSM approaches estimate MSY very closely, but BSM has a higher confidence level (Table 1). More seabreams were landed in 2021 than the estimated MSY so a management plan will be developed based on the BSM results.

3.3. Biological Reference Points

Table 2 summarizes the detailed accounts of the estimated biological reference points (BRPs) on seabream fisheries using the BSM method. The BMSY of seabream in Oman was 181,000 tons and FMSY was 0.0607 (Table 2). The fishing mortality at the last year (2021) (FNOW) was estimated at 0.0747 per year. Based on B/BMSY in the final year (2021) of a time series, stock status of seabream could be calculated based on Table 3. The B/BMSY is less than 1 (i.e., 0.962) and the F/FMSY ratio was more than 1 (i.e., 1.25) (Table 2), indicating that the seabream fisheries are overfished.
Al Beak et al. (2015) [45] found that the white seabream population was not overexploited between 2010 and 2012 in the Coast of North Siani. Wang et al. (2020) [12] found that the Yellowback seabream (Dentex hypselosomus), based on time series capture data from 1966 to 2017, in the Tsushima Warm Current Region, Southwest Japan, and East China were healthy. Another study by Zhang et al. (2020) [13] identified that the red seabream (Pagrus major) was grossly overfished as F/FMSY and B/BMSY were 2.43 and 0.44, respectively, from the Sea of Japan. Ju et al. (2020) [18] found that the blackhead seabream (Acanthopagrus schlegelii) was severely overfished from the coastline waters of Taiwan.

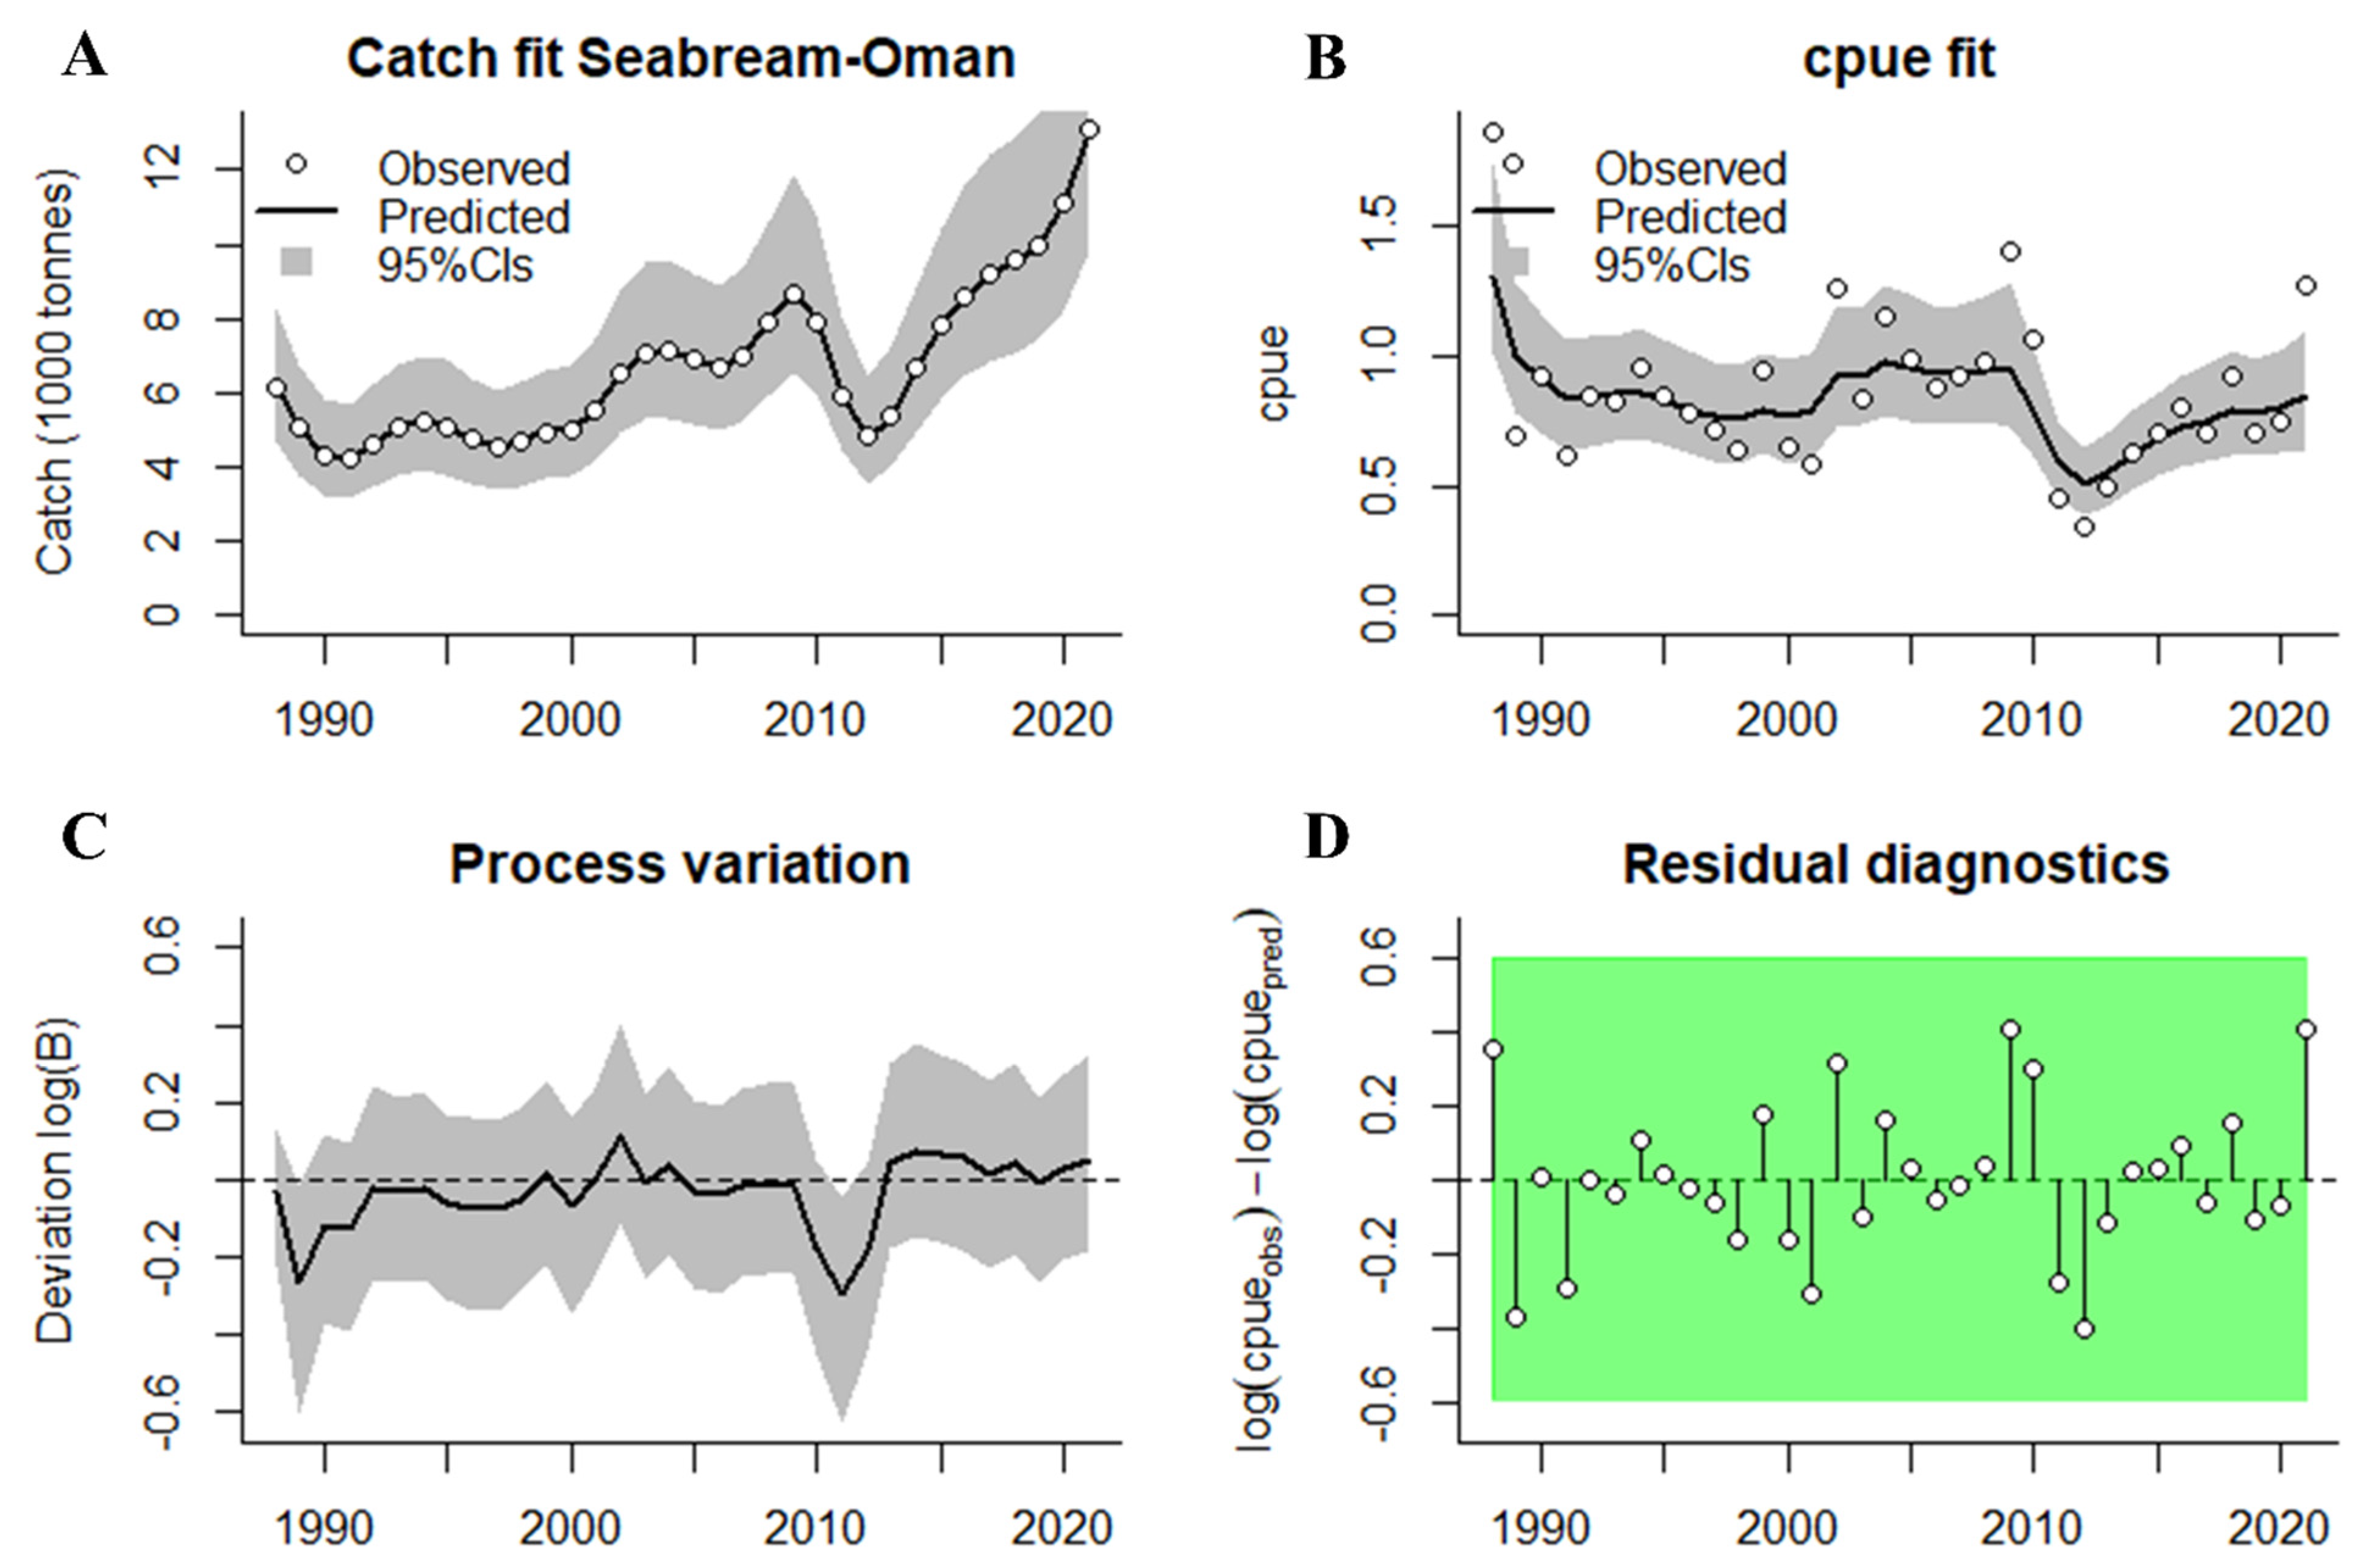
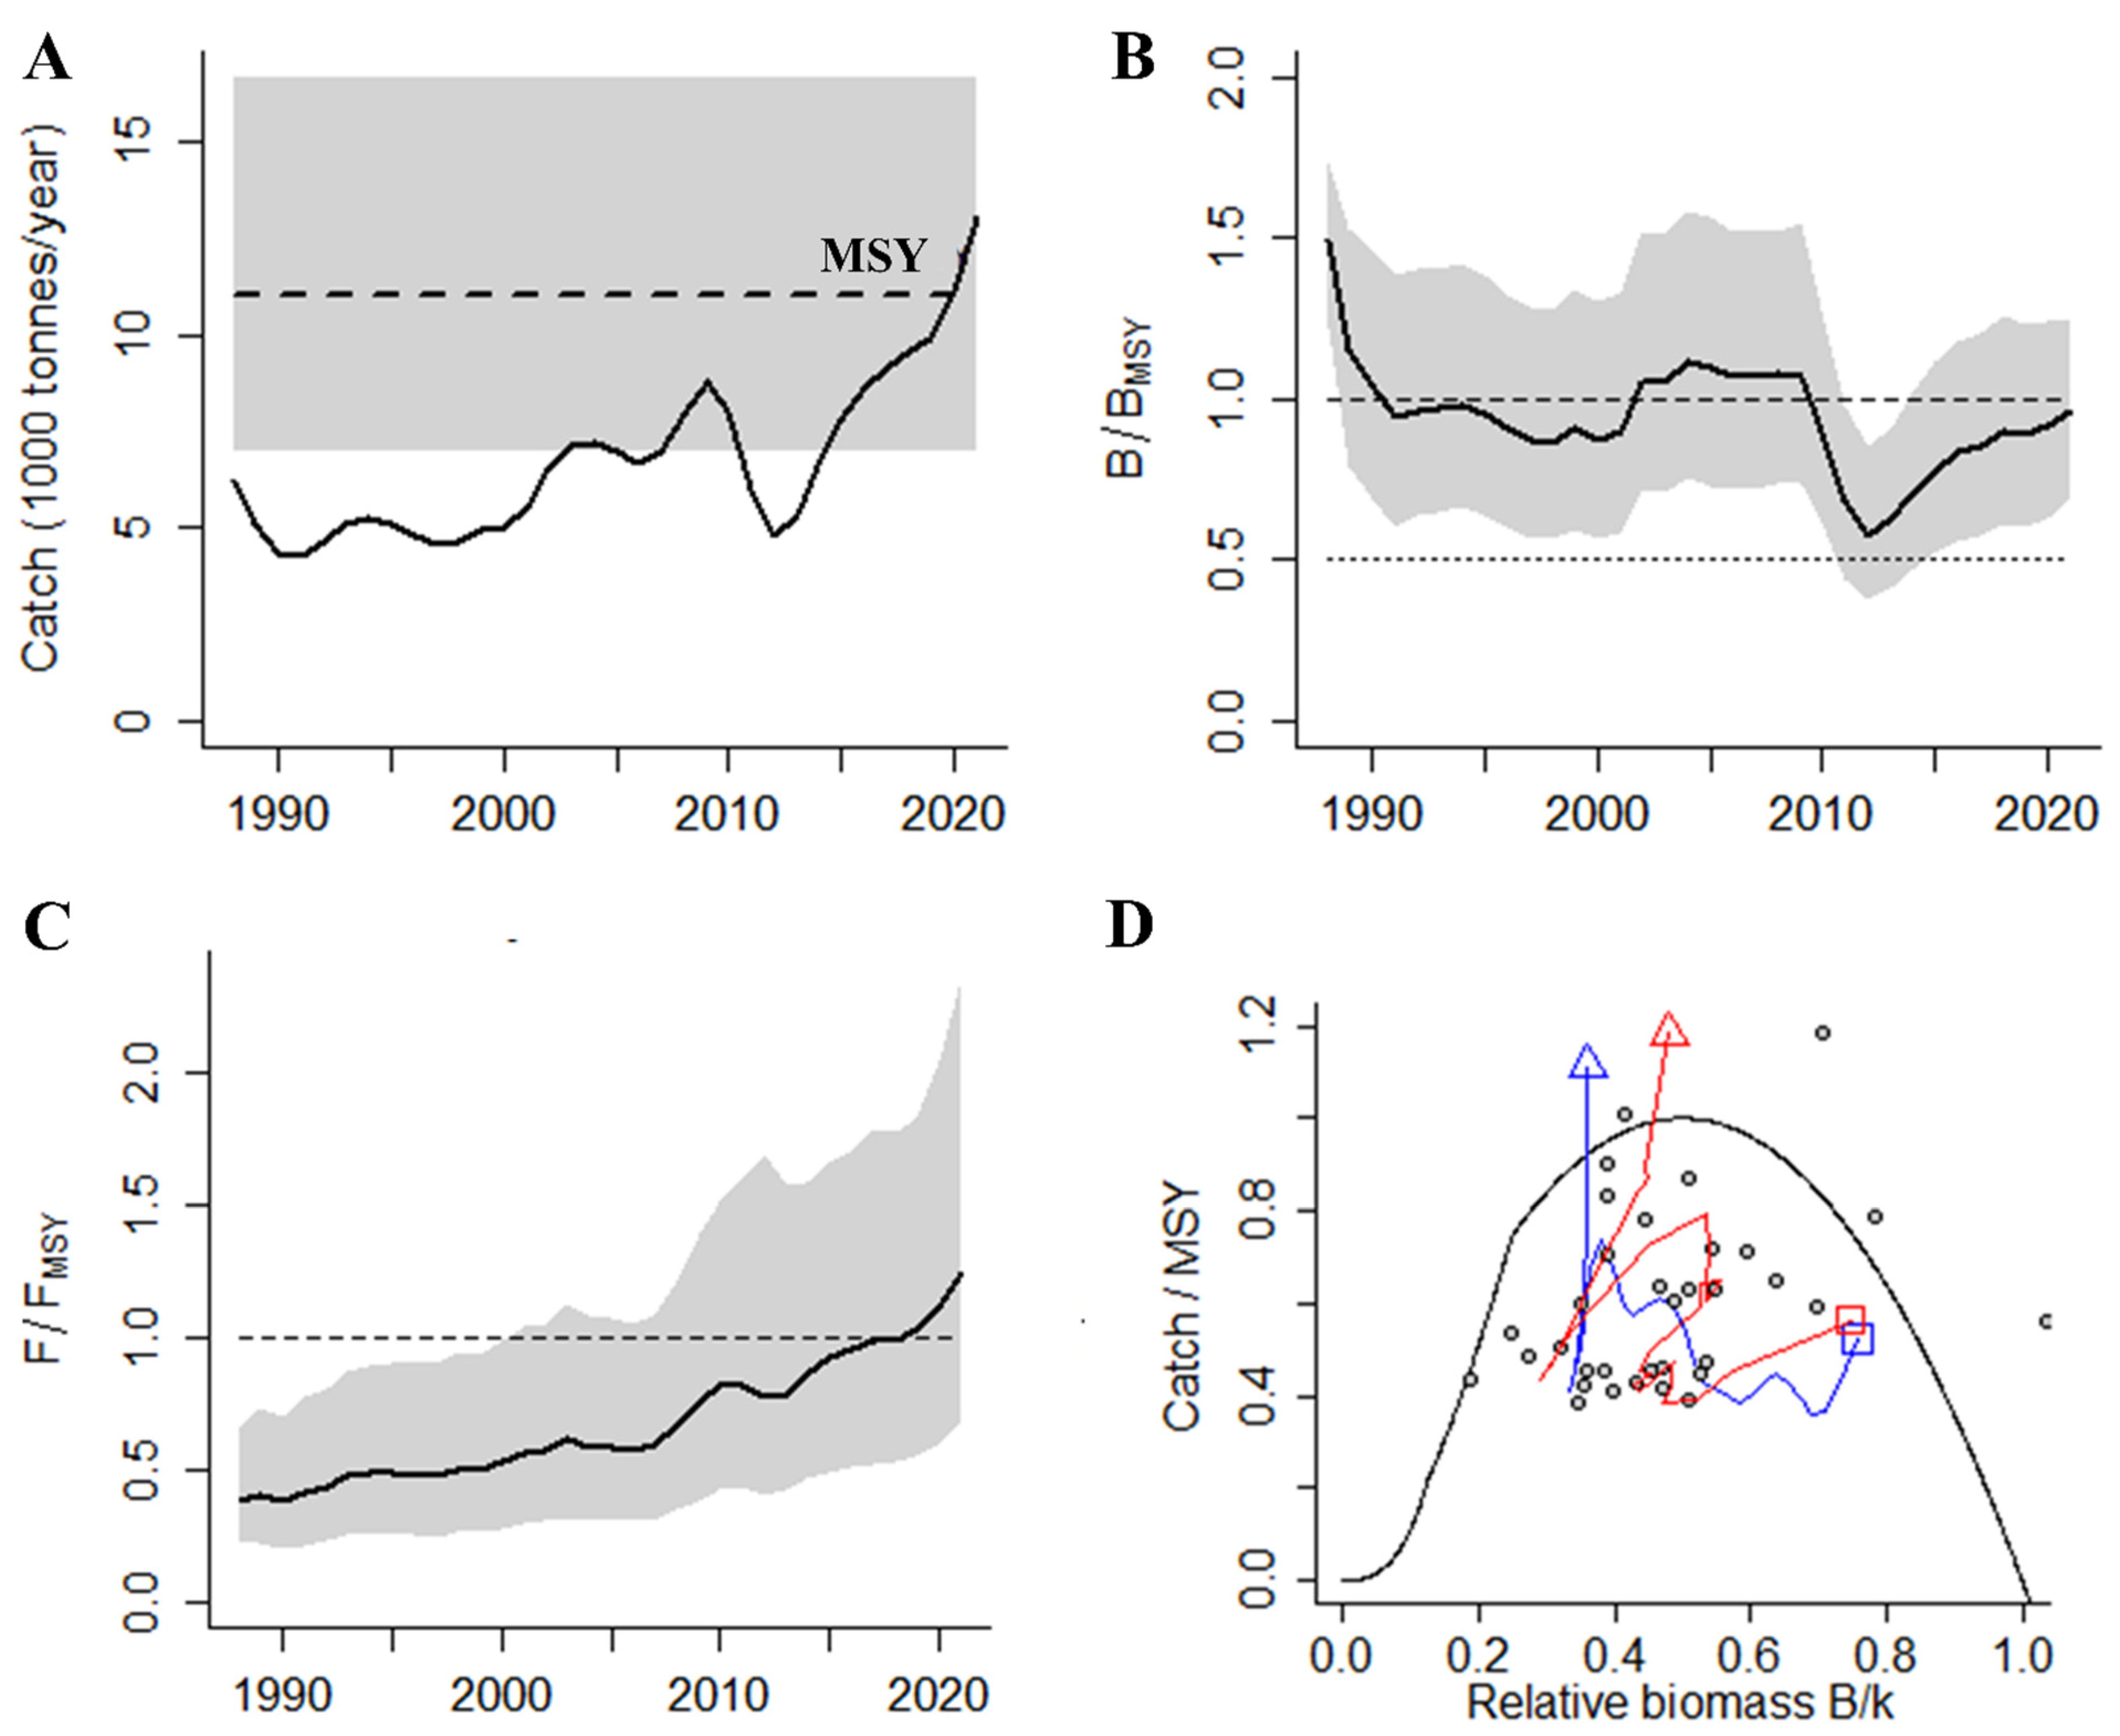
3.4. Catch and CPUE Data Fit in the CMSY and BSM Analyses

The seabream’s predicted and observed catch exhibited conformity within the 95% confidence intervals throughout the entire duration of the model (Figure 4A). Furthermore, during the whole period, CPUE observations were within the 95% confidence interval (Figure 4B). These results suggest that within the study period there were no notable variations in catch between predictions and observations. However, the CPUE showed a fluctuation trend (Figure 4B).

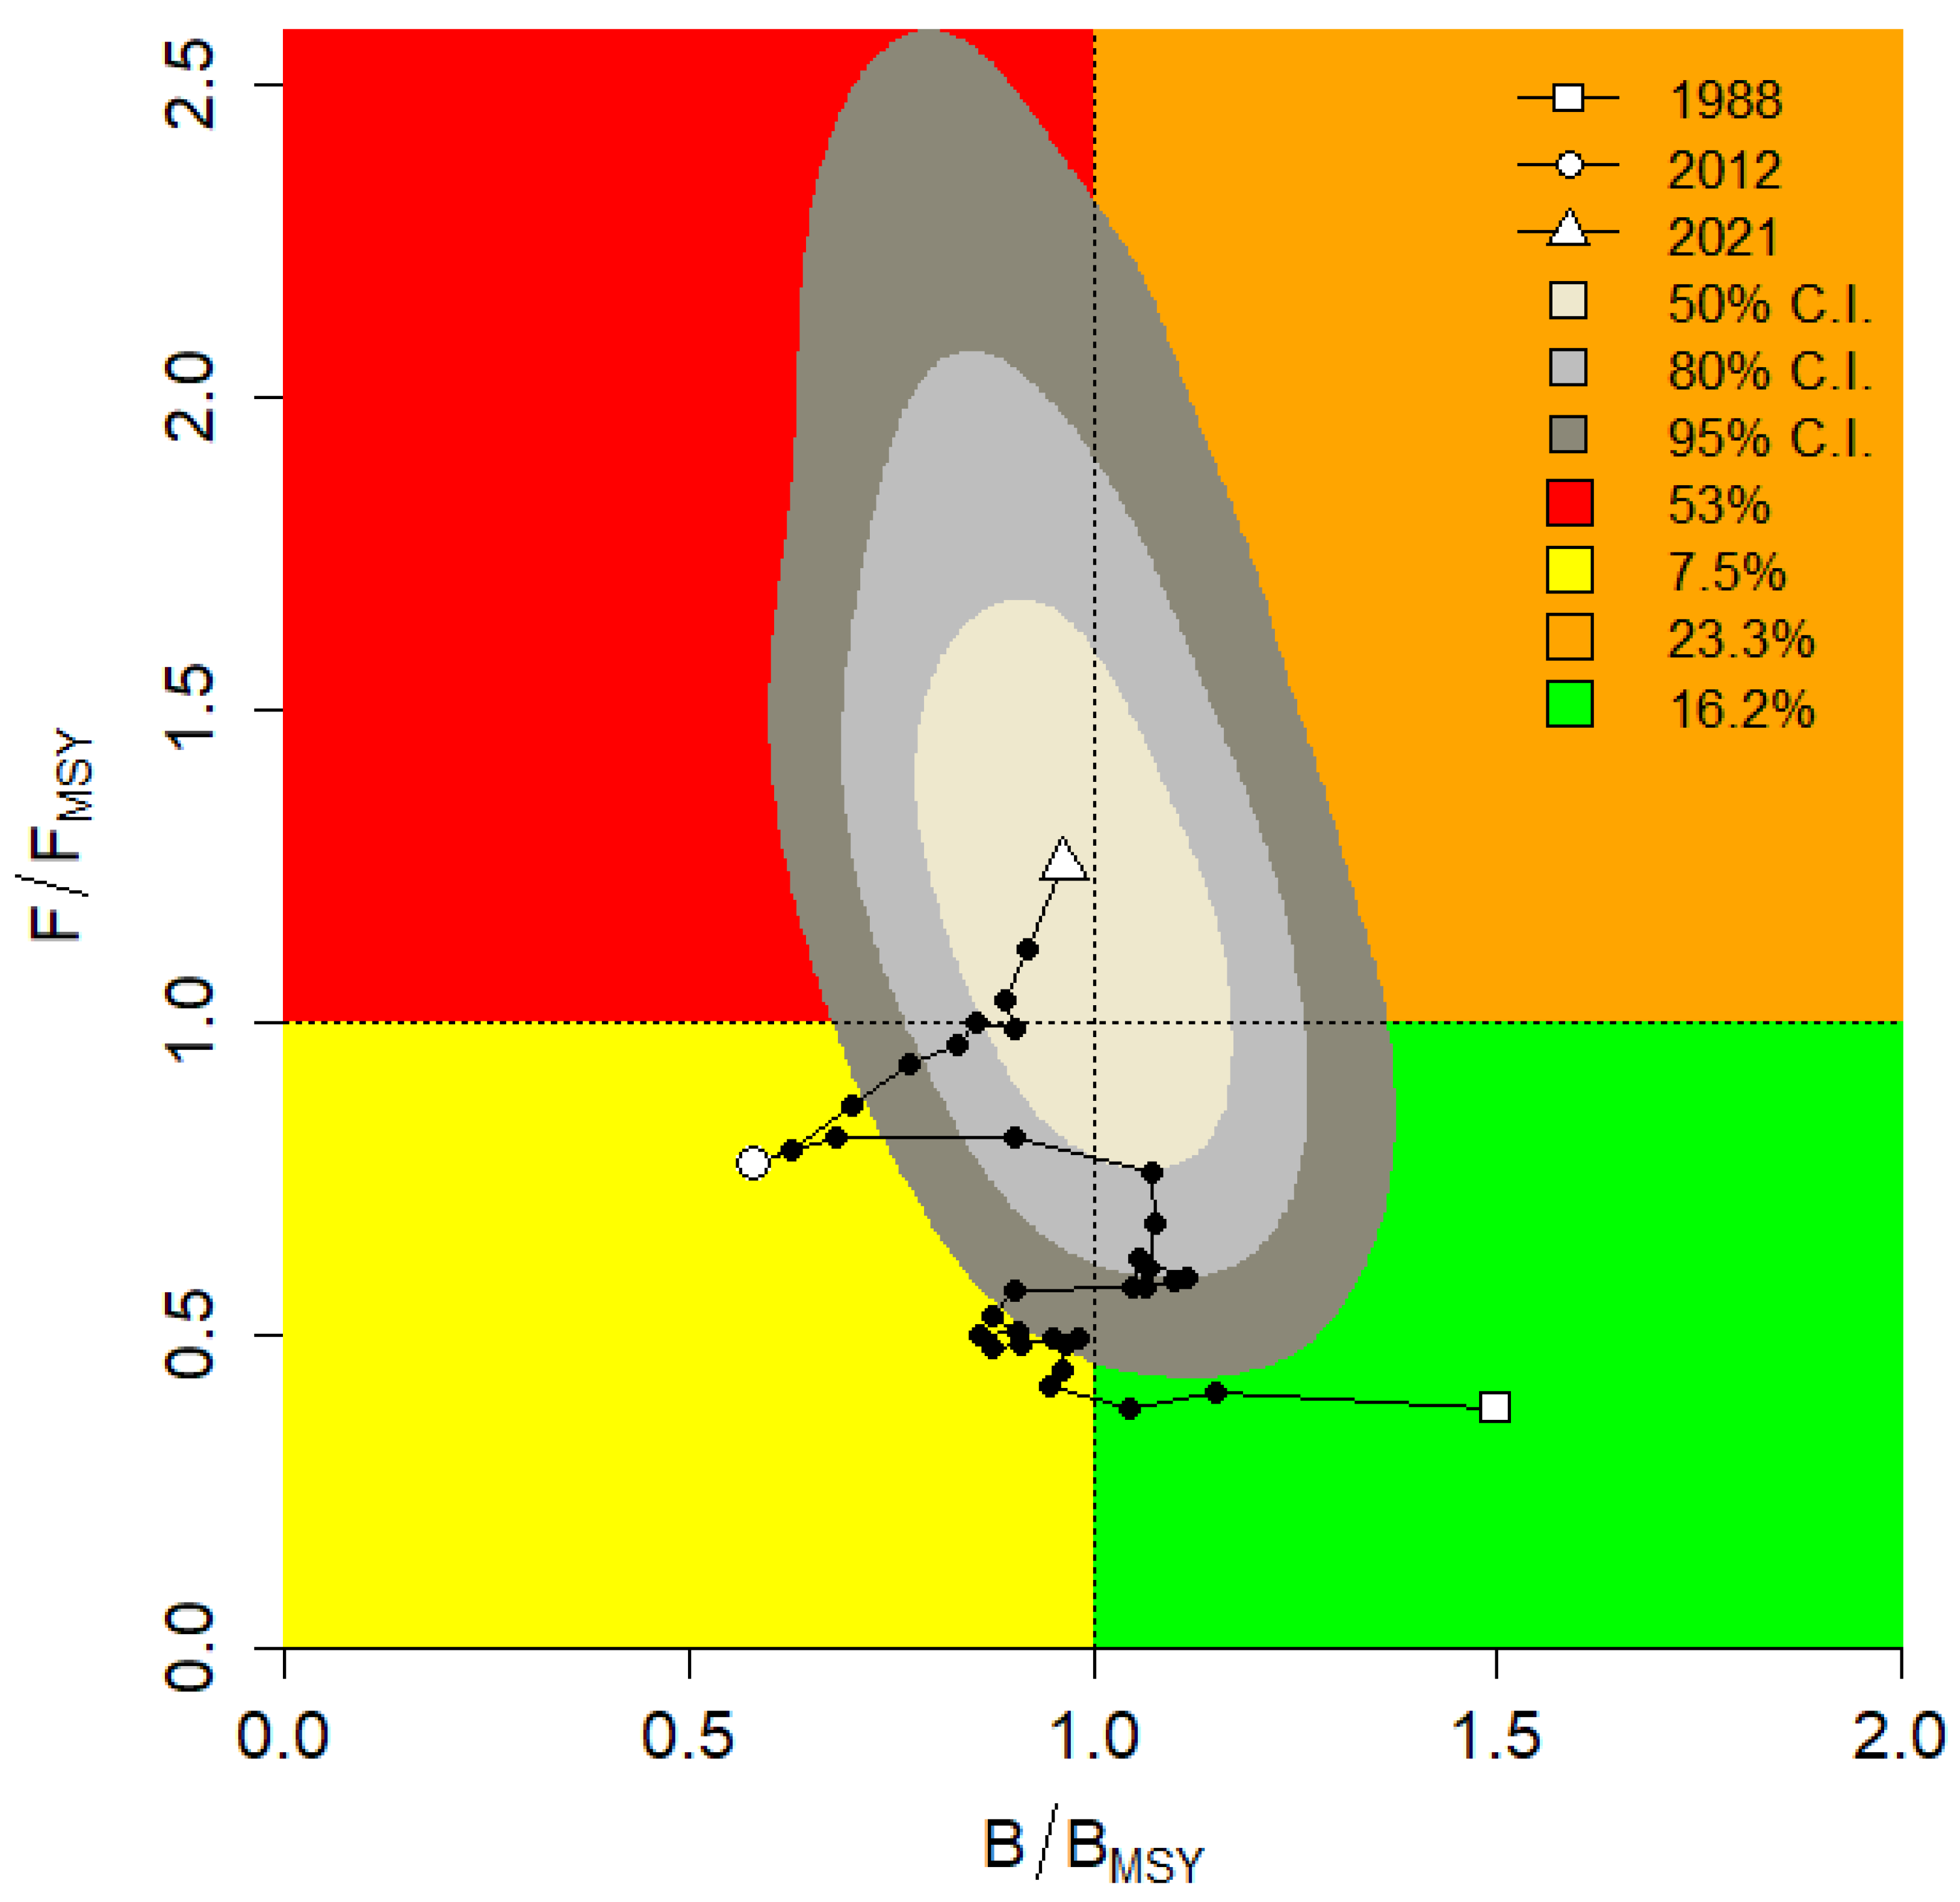
3.5. Existing Stock Status

Figure 5 illustrates catch and stock diagrams produced by the BSM method. The catch diagram demonstrates catches that are below the MSY until 2020, after which they exceed and surpass the MSY (Figure 5A). The stock figure (Figure 5B) clarifies that B/BMSY 1990–2000 was below the unity (<1) line, which suggests overfished biomass. The fish stock has gradually improved afterwards and been brought to safe biomass (>1) between 2000 and 2010. It dipped to being an overfished zone again in 2010 and remained so till the present. Figure 5A compares the catches with the BSM estimate and its confidence interval for MSY. The charts of landings vs. MSY and B/BMSY (Figure 5) further show that seabream will be overfished by 2020. During the study period, seabream landings ranged from 3300 tons in 1992 to above 16,000 tons in 2021 (Figure 5A), with an average landing of 6728 tons. As of 2021, seabream landings reached a peak after displaying some degree of fluctuation trends since 2010. Figure 5B provides a visual representation of the findings pertaining to the growth of relative biomass. The B/BMSY value of 0.962 and F/FMSY value of 1.25 suggest that the seabream population in the Oman region is experiencing overfishing in the current fishing year (i.e., 2021), as indicated in Table 2. Results were not consistent with previous studies on red seabream in the Sea of Japan which considered the stock to be grossly overfished when Bend/BMSY was less than 0.5 [13].
Figure 5C of fishing pressure (F/FMSY) clearly indicates that the seabream was overexploited in the last few years (i.e., 2021). Starting from 1988 to 2020, the fishing pressure on the seabream population in the Oman was low, i.e., F/FMSY was <1 (Figure 5C). The current fishing mortality (F) was found to be lower than the fishing mortality at MSY (FMSY), as evidenced by the comparison of their respective plots. The stock, however, is almost at the unsustainable level since current biomass is similar to BMSY. In Figure 5D, CMSY/BSM output indicates the status of the seabream in Oman based on catch comparative to MSY and the biomass in relation to the size of the unexploited stock. BSM estimates and CMSY estimates suggested similar patterns in catch/MSY plot (Figure 5D). The facts above the curve indicate the presence of overfishing and a reduction in biomass, whereas the points below the curve suggest sustainable exploitation and an increase in stock growth. Varghese et al. (2020) [46] indicated that the points of the equilibrium curve cluster around it, providing confidence in the assessment. It could be concluded that exploitation has fluctuated greatly over the study period. As compared to earlier years, current exploitation levels are higher. Biomass has declined from its peak. In order to ensure seabream’s sustainable utilization, a management plan is required. Stock assessment models are helpful in answering questions about stock conditions, predicting the effects of management measures, and assisting fishery managers in making informed decisions [47]. Considering the results, a suggestion is to set the catch limits based on the confidence limit of MSY.
The Kobe plot (Figure 6) shows how the B/BMSY and F/FMSY developed concurrently. The Kobe plot provides the likelihood that the stock may fall into different stock status zones over a period of time. In the initial years (1988–1990), the seabream stock of Oman was healthy stock; however, in recent years (last 3 years, 2019 to 2021) the seabream stock is overexploited. Figure 6 illustrates the gradual decrease in the stock of fish, starting in 2018, from a healthy state with manageable fishing pressure to a state that has already been diminished due to overfishing. By 2019, the stock had entered the overfished zone, where continued overfishing poses the risk of further reduction and potential inability to reach maximum sustainable yield (MSY). In order to ensure the long-term viability of Oman’s seabream fisheries, it is suggested that the current level of fishing pressure be maintained, as indicated by the Kobe phase plot’s representation.

3.6. Existing Management Policies and Recommendations

There are four fundamental categories of regulations governing fishing in the Gulf region: gear limitations, minimum capture sizes, seasonal closings, and spatial boundaries [21]. As part of its efforts to guide the future development and investment decisions for the fishery sector, the MAFWR sponsored a survey in 2008 to evaluate the fish resources of the Arabian Sea coast of Oman [3]. Despite the existing regulations controlling fishing efforts, many fish species are heavily exploited for commercial purposes. In Oman, most demersal fish species are overfished [48]. For instance, the minimum length for fishing seabream is set at 26 cm, which is higher than the maturity size, as established by Ministerial Decree No. 67/2020 regarding the lengths of certain aquatic resources allowed for fishing. Seabream is one of the key species culturing in Oman, and the government has been actively developing the aquaculture sector. According to statistical data, seabream production commenced in 2018 with a total of 350 tons and increased to 3000 tons by the end of 2022 [31]. Oman’s vision for 2040 aims to produce more than 15,000 tons of seabream fish by then. In addition to providing seafood, aquaculture helps alleviate pressure on wild fish populations and facilitates the restocking of overexploited species locally [49]. Although seabream stocks have exhibited signs of overfishing over the last decade due to the increase in fishing pressure, sustainable management remains essential along with aquaculture development. The initial step in developing a management plan involves assessing the fishery’s health and determining the status of the fish population, as achieved in this study. Setting catch limits and identifying areas that require enhanced protection can be accomplished using the information derived from a comprehensive stock assessment. Another effective tool is the establishment of monitoring programs with enforcement mechanisms to ensure sustainable fishery management. Tracking satellites, onboard observers, and inspections at ports can all be employed to monitor fishing activity and enforce regulations. Given the migratory nature of seabream species [50], cooperation agreements among Gulf countries are essential because managing seabream fisheries necessitates shared responsibility. As a final step, stakeholders, including fishermen and fishing communities, should be made aware of the importance of sustainable fishing. Educational initiatives may include outreach programs, workshops, and other forms of engagement. Moreover, seabream aquaculture through artificial feeding can reduce pressure on local fisheries by providing high-quality fish that meet local preferences. Stock assessment methods (such as CMSY and BSM) relying mainly on catch data are more reliable than methods that primarily use biomass data [17]. However, other factors such as environmental shifts are not taken into account [12]. As a result, combining CMSY and BSM methodologies with other models or multispecies approaches may allow for more accurate and holistic stock assessment. Another issue is the rise in the capacity of fishing gears [51]. Improvements in vessel power and the use of modern instrumentation result in increased fishing efficiency, allowing each unit of effort to catch more fish than previously for the same stock abundance [52]. When a gear harvests more than the targeted species it becomes difficult to estimate stocks. It is also difficult to estimate the effort required to catch a resource by estimating all gears’ of respective capacities and species [46]. Fisheries are renewable resources but overfishing reduces fish biomass, sometimes to a point that recruitment may be impaired and the sustainability of the stock through reproduction threatened. The sustainability of an exploited fishery depends on regular scientific fish stock assessments. In the assessment of stocks with limited data, both approaches (CMSY and BSM) are extremely useful and effective. In order to ensure seabream sustainability, the present study recommends maintaining the catch at the MSY level and not increasing fishing pressure. This research will provide detailed stock information and BRPs for managing the sustainable management of the seabream fisheries in Oman, as well as other neighboring countries.

4. Conclusions

In conclusion, the establishment of effective managerial approaches for the sustainable utilization of fishery resources hinges on a critical understanding of the stock’s status. In this study, two widely used stock assessment methods for data-limited situations, the Monte Carlo Catch–Maximum Sustainable Yield method (CMSY) and a Bayesian state–space implementation of the Schaefer model (BSM), were employed to assess the state and exploitation level of the seabream population in Oman. The results obtained through CMSY and BSM were consistent, both indicating that the seabream stock in Oman is currently overfished. The urgent need for action to address the overfishing of the seabream population in Oman. Effective measures to reduce fishing activity and promote the recovery of the seabream stock are imperative to ensure its long-term sustainability.

Author Contributions

Conceptualization, Y.A.A. and S.D.; methodology, Y.A.A. and S.D.; formal analysis, Y.A.A. and S.D.; investigation, Y.A.A. and S.D.; writing—original draft preparation, Y.A.A.; writing—review and editing, Y.A.A. and S.D. All authors have read and agreed to the published version of the manuscript.

Funding

The APC was funded by the Sultan Qaboos University.

Institutional Review Board Statement

Not applicable.

Informed Consent Statement

For every participant in the study, informed consent was acquired. The right of participants to ask questions regarding the research was explained to them. The study period was characterized by the maintenance of confidentiality and privacy.

Data Availability Statement

The corresponding author can provide the datasets used or analyzed in the current work upon reasonable request.

Acknowledgments

The authors are grateful to the Ministry of Agriculture, Fisheries and Water Resources, Oman for providing the data for the study. The authors are grateful to Sultan Qaboos University, College of Agricultural and Marine Sciences, Oman for providing research and administrative support. The first author is thankful to the Deanship of Research, Sultan Qaboos University for awarding her the PhD Fellowship for conducting the research.

Conflicts of Interest

The authors declare no conflict of interest.

References

  1. Kalhoro, M.A.; Tang, D.; Ye, H.J.; Morozov, E.; Liu, Q.; Memon, K.H.; Kalhoro, M.T. Population dynamics of Randall’s threadfin bream Nemipterus randalli from Pakistani waters, Northern Arabian Sea. Indian J. Geo-Mar. Sci. 2017, 46, 551–561. [Google Scholar]
  2. Marshall, K.N.; Koehn, L.E.; Levin, P.S.; Essington, T.E.; Jensen, O.P. Inclusion of ecosystem information in US fish stock assessments suggests progress toward ecosystem-based fisheries management. ICES J. Mar. Sci. 2019, 76, 1–9. [Google Scholar] [CrossRef]
  3. Bose, S.; Al-Mazrouai, A.; Al-Habsi, S.; Al-Busaidi, I.; Al-Nahdi, A. Fisheries and food security: The case of the Sultanate of Oman. In Proceedings of the International Conference on Food Security in the Arab Countries: New Challenges and Opportunities in the Context of Global Price Volatility, Muscat, Oman, 2–4 March 2010. [Google Scholar]
  4. Arkhipkin, A.I.; Hendrickson, L.C.; Payá, I.; Pierce, G.J.; Roa-Ureta, R.H.; Robin, J.P.; Winter, A. Stock assessment and management of cephalopods: Advances and challenges for short-lived fishery resources. ICES J. Mar. Sci. 2021, 78, 714–730. [Google Scholar] [CrossRef]
  5. Whitten, A.R.; Klaer, N.L.; Tuck, G.N.; Day, R.W. Accounting for cohort-specific variable growth in fisheries stock assessments: A case study from south-eastern Australia. Fish. Res. 2013, 142, 27–36. [Google Scholar] [CrossRef]
  6. Al-Zaidan, A.S.; Akbar, A.; Bahbahani, H.; Al-Mohanna, S.Y.; Kolattukudy, B.; Balakrishna, V. Landing, consumption, and DNA barcoding of commercial seabream (Perciformes: Sparidae) in Kuwait. Aquat. Conserv. Mar. Freshw. Ecosyst. 2021, 31, 802–817. [Google Scholar] [CrossRef]
  7. Al-Abdulrazzak, D.; Zeller, D.; Belhabib, D.; Tesfamichael, D.; Pauly, D. Total marine fisheries catches in the Persian/Arabian Gulf from 1950 to 2010. Reg. Stud. Mar. Sci. 2015, 2, 28–34. [Google Scholar] [CrossRef]
  8. FAO. World Fisheries and Aquaculture; FAO: Rome, Italy, 2022; Available online: https://www.fao.org/3/ca9229en/online/ca9229en.html#chapter-1_1 (accessed on 16 March 2023).
  9. Froese, R.; Winker, H.; Coro, G.; Demirel, N.; Tsikliras, A.C.; Dimarchopoulou, D.; Scarcella, G.; Quaas, M.; Matz-Lück, N. Status and rebuilding of European fisheries. Mar. Policy 2018, 93, 159–170. [Google Scholar] [CrossRef]
  10. Liang, C.; Xian, W.; Pauly, D. Assessments of 15 Exploited Fish Stocks in Chinese, South Korean and Japanese Waters Using the CMSY and BSM Methods. Front. Mar. Sci. 2020, 7, 623. [Google Scholar] [CrossRef]
  11. Ren, Q.Q.; Liu, M. Assessing Northwest Pacific Fishery Stocks Using Two New Methods: The Monte Carlo Catch-MSY (CMSY) and the Bayesian Schaefer Model (BSM). Front. Mar. Sci. 2020, 7, 430. [Google Scholar] [CrossRef]
  12. Wang, Y.; Wang, Y.; Liang, C.; Zhang, H.; Xian, W. Assessment of 12 Fish Species in the Northwest Pacific Using the CMSY and BSM Methods. Front. Mar. Sci. 2020, 7, 616. [Google Scholar] [CrossRef]
  13. Zhang, S.; Wang, Y.; Wang, Y.; Liang, C.; Xian, W. Assessment of 11 Exploited Fish and Invertebrate Populations in the Japan Sea Using the CMSY and BSM Methods. Front. Mar. Sci. 2020, 7, 525363. [Google Scholar] [CrossRef]
  14. Best, J.K.; Punt, A.E. Parameterizations for Bayesian state-space surplus production models. Fish. Res. 2020, 222, 105411. [Google Scholar] [CrossRef]
  15. Froese, R.; Winker, H.; Coro, G.; Demirel, N.; Tsikliras, A.C.; Dimarchopoulou, D.; Scarcella, G.; Palomares, M.L.D.; Dureuil, M.; Pauly, D. Estimating stock status from relative abundance and resilience. ICES J. Mar. Sci. 2020, 77, 527–538. [Google Scholar] [CrossRef]
  16. Alam, M.S.; Liu, Q.; Rashed-Un-nabi, M.; Al-Mamun, M.A. Fish Stock Assessment for Data-Poor Fisheries, with a Case Study of Tropical Hilsa Shad (Tenualosa ilisha) in the Water of Bangladesh. Sustainability 2021, 13, 3604. [Google Scholar] [CrossRef]
  17. Barman, P.P.; Shamsuzzaman, M.M.; Schneider, P.; Mozumder, M.M.H.; Liu, Q. Fisheries Reference Point and Stock Status of Croaker Fishery (Sciaenidae) Exploited from the Bay of Bengal, Bangladesh. J. Mar. Sci. Eng. 2022, 10, 63. [Google Scholar] [CrossRef]
  18. Ju, P.; Tian, Y.; Chen, M.; Yang, S.; Liu, Y.; Xing, Q.; Sun, P. Evaluating Stock Status of 16 Commercial Fish Species in the Coastal and Offshore Waters of Taiwan Using the CMSY and BSM Methods. Front. Mar. Sci. 2020, 7, 618. [Google Scholar] [CrossRef]
  19. Al-Husaini, M.; Bishop, J.M.; Al-Foudari, H.M.; Al-Baz, A.F. A review of the status and development of Kuwait’s fisheries. Mar. Pollut. Bull. 2015, 100, 597–606. [Google Scholar] [CrossRef]
  20. Alshubiri, F.; Elheddad, M.; Doytch, N. The impact of fish production on marine trade balance and foreign direct investment: An empirical study of the GCC economies. Mar. Policy 2020, 116, 103660. [Google Scholar] [CrossRef]
  21. Ben-Hasan, A.; Daliri, M. Arabian/Persian Gulf artisanal fisheries: Magnitude, threats, and opportunities. Rev. Fish Biol. Fish. 2022, 33, 541–559. [Google Scholar] [CrossRef]
  22. Bartholomew, A.; Burt, J.A.; Firth, L.B. Artificial reefs in the Arabian Gulf: Benefits, challenges and recommendations for policy-makers. Reg. Stud. Mar. Sci. 2022, 56, 102723. [Google Scholar] [CrossRef]
  23. Alhabsi, S.M. Fisheries Sustainability in Oman. J. Econ. 2011, 2, 35–46. [Google Scholar]
  24. Jayabalan, N.; Al-Marzouqi, A.; Zaki, S.; Al-Kharusi, L. Strategies for Monitoring and Management of Marine Fisheries Resources of the Sultanate of Oman. In The Arabian Seas: Biodiversity, Environmental Challenges and Conservation Measures; Springer: Berlin/Heidelberg, Germany, 2021; pp. 859–881. [Google Scholar]
  25. Farrag, E. Some Biological Aspects and Stock Status of Goldlined Seabream Rhabdosargus sarba (Forsskål, 1775) from the Arabian Gulf of the United Arab Emirates. Comput. Biol. Bioinform. 2017, 5, 43–49. [Google Scholar] [CrossRef]
  26. Jawad, L.; Qasim, A.; Al-Zaidy, F.M.; Waryani, B.; Rutkayová, J. The relationship between fish length and otolith size and weight of Acanthopagrus arabicus Iwatsuki, 2013 (Sparidae) collected from the Iraqi marine waters. Acta Sci. Pol. Zootech. 2021, 20, 27–34. [Google Scholar] [CrossRef]
  27. Pombo-Ayora, L.; Peinemann, V.N.; Williams, C.T.; He, S.; Lin, Y.J.; Iwatsuki, Y.; Bradley, D.D.C.; Berumen, M.L. Acanthopagrus oconnorae, a new species of seabream (Sparidae) from the Red Sea. J. Fish Biol. 2022, 101, 885–897. [Google Scholar] [CrossRef] [PubMed]
  28. Alghamdi, M.; Al-Quraishy, S.; Al-Shaebi, E.M.; Abdel-Gaber, R. Morphological and molecular analyses Protolamellodiscus senilobatus (Monogenea: Diplectanidae), a gill parasite infecting the soldier bream Argyrops filamentosus (Sparidae). J. King Saud Univ. Sci. 2023, 35, 102417. [Google Scholar] [CrossRef]
  29. Anam, R.O.; Munga, C.N.; Gonda, J.R. The biology of Goldsilk Sea Bream (family: Sparidae) from the inshore waters of north coast Kenya. West. Indian Ocean J. Mar. Sci. 2019, 18, 77–86. [Google Scholar] [CrossRef]
  30. Mohamed, A.-R.M.; Al-Hassani, A.H. Population dynamics of Arabian yellowfin seabream, Acanthopagrus arabicus Iwatsuki, 2013 from Iraqi marine waters, Arabian Gulf. Int. J. Fish. Aquat. Stud. 2021, 9, 15–22. [Google Scholar] [CrossRef]
  31. MAFWR. Fishery Statistics Book for the Oman Between 2000 and 2021; Ministry of Agriculture, Fisheries and Water Resources (MAFWR): Muscat, Oman, 2021. [Google Scholar]
  32. González-Wangüemert, M.; Pérez-Ruzafa, Á. In two waters: Contemporary evolution of lagoonal and marine white seabream (Diplodus sargus) populations. Mar. Ecol. 2012, 33, 337–349. [Google Scholar] [CrossRef]
  33. Exadactylos, A.; Vafidis, D.; Tsigenopoulos, C.S.; Gkafas, G.A. High connectivity of the white seabream (Diplodus sargus, l. 1758) in the aegean sea, eastern mediterranean basin. Animals 2019, 9, 979. [Google Scholar] [CrossRef]
  34. Daban, İ.B. Age, Growth, Mortality and Reproduction Biology of the Black Seabream, Spondyliosoma cantharus in North Aegean Sea, Turkey, Mediterranean Basin. Turk. J. Fish. Aquat. Sci. 2022, 22, TRJFAS21016. [Google Scholar] [CrossRef]
  35. Khalfallah, M.; Zylich, K.; Zeller, D.; Pauly, D. Reconstruction of domestic marine fisheries catches for Oman (1950–2015). Front. Mar. Sci. 2016, 3, 152. [Google Scholar] [CrossRef]
  36. Froese, R.; Demirel, N.; Coro, G.; Kleisner, K.M.; Winker, H. Estimating fisheries reference points from catch and resilience. Fish Fish. 2017, 18, 506–526. [Google Scholar] [CrossRef]
  37. Al-Marzuqi, A.S.M. Biology, Stock Assessment and Fishery Management of the Santer Seabream Cheimerius nufar (val. 1830) from the Arabian Sea of Oman. Ph.D. Thesis, Universität Bremen, Bremen, Germany, 2011. [Google Scholar]
  38. Plummer, M. JAGS: A program for analysis of Bayesian graphical models using Gibbs sampling. In Proceedings of the 3rd International Workshop on Distributed Statistical Computing, Vienna, Austria, 20–22 March 2003; Volume 124, pp. 1–10. [Google Scholar]
  39. Myers, R.A.; Barrowman, N.J. Time series bias in the estimation of density-dependent mortality in stock-recruitment models. Can. J. Fish. Aquat. Sci. 1995, 52, 223–232. [Google Scholar] [CrossRef]
  40. Hilborn, R.; Amoroso, R.O.; Anderson, C.M.; Baum, J.K.; Branch, T.A.; Costello, C.; De Moor, C.L.; Faraj, A.; Hively, D.; Jensen, O.P.; et al. Effective fisheries management instrumental in improving fish stock status. Proc. Natl. Acad. Sci. USA 2020, 117, 2218–2224. [Google Scholar] [CrossRef] [PubMed]
  41. Froese, R.; Pauly, D. (Eds.) FishBase. World Wide Web Electronic Publication. 2023. Available online: www.fishbase.org (accessed on 6 March 2023).
  42. Memon, A.M.; Liu, Q.; Memon, K.H.; Baloch, W.A.; Memon, A.; Baset, A. Evaluation of the fishery status for King Soldier Bream Argyrops spinifer in Pakistan using the software CEDA and ASPIC. Chin. J. Oceanol. Limnol. 2015, 33, 966–973. [Google Scholar] [CrossRef]
  43. Memon, A.M.; Liu, Q.; Baloch, W.A.; Memon, K.H.; Mohsin, M.; Karim, E.; Liao, B. Assessment of maximum sustainable yield of Acanthopagrus berda from Pakistani marine waters by applying surplus production models. Indian J. Geo Mar. Sci. 2017, 46, 1410–1416. [Google Scholar]
  44. Palomares, M.L.D.; Froese, R.; Derrick, B.; Nöel, S.-L.; Tsui, G.; Woroniak, J.; Pauly, D. A Preliminary Global Assessment of the Status of Exploited Marine Fish and Invertebrate Populations; A Report Prepared by the Sea Around Us for OCEANA; The University of British Columbia: Vancouver, Canada, 2018. [Google Scholar]
  45. Al-Beak, A.M.; Ghoneim, S.I.; El-Dakar, A.Y.; Salem, M. Population dynamic and stock assessment of white seabream Diplodus sargus (Linnaeus, 1758) in the coast of North Siani. Fish. Aquac. J. 2015, 6, 1000152. [Google Scholar] [CrossRef]
  46. Varghese, E.; Sathianandan, T.V.; Jayasankar, J.; Kuriakose, S.; Mini, K.G.; Muktha, M. Bayesian State-space Implementation of Schaefer Production Model for Assessment of Stock Status for Multi-gear Fishery. J. Indian Soc. Agric. Stat. 2020, 74, 33–40. [Google Scholar]
  47. Gebremedhin, S.; Bruneel, S.; Getahun, A.; Anteneh, W.; Goethals, P. Scientific methods to understand fish population dynamics and support sustainable fisheries management. Water 2021, 13, 574. [Google Scholar] [CrossRef]
  48. Sale, P.F.; Feary, D.A.; Burt, J.A.; Bauman, A.G.; Cavalcante, G.H.; Drouillard, K.G.; Kjerfve, B.; Marquis, E.; Trick, C.G.; Usseglio, P.; et al. The growing need for sustainable ecological management of marine communities of the Persian Gulf. Ambio 2011, 40, 4–17. [Google Scholar] [CrossRef]
  49. Engelhard, G.H.; Howes, E.L.; Pinnegar, J.K.; Le Quesne, W.J.F. Assessing the risk of climate change to aquaculture: A national-scale case study for the Sultanate of Oman. Clim. Risk Manag. 2022, 35, 100416. [Google Scholar] [CrossRef]
  50. Yang, J.; Shin, J.; Cha, E.; Kim, H.; Lee, Y.; Kim, S.; Choi, I.; Yang, J. Analysis of metabolites of red seabream (Pagrus major) from different geographical origins by capillary electrophoresis time-of-flight mass spectrometry. PLoS ONE 2022, 17, e0270280. [Google Scholar] [CrossRef] [PubMed]
  51. Palomares, M.L.D.; Pauly, D. On the creeping increase of vessels’ fishing power. Ecol. Soc. 2019, 24, 31. [Google Scholar] [CrossRef]
  52. Han, Q.; Shan, X.; Jin, X.; Gorfine, H. Contrasting stock status trends obtained from survey and fishery CPUE, taking Larimichthys polyactis in Yellow Sea Large Marine Ecosystem as an example. Ecol. Indic. 2023, 147, 110032. [Google Scholar] [CrossRef]
Figure 1. Map of fishing grounds of the seabream in Arabian Gulf, Sea of Oman, and Arabian Sea. Red line denotes Oman’s boundary.
Sustainability 15 15692 g001
Figure 2. Results of the Monte Carlo Catch–Maximum Sustainable Yield method (CMSY) and Bayesian Schaefer model (BSM) analyses for the seabream fisheries in Oman waters. (A) Time series landings during 1988–2021 (blue line is the three-year moving average, maximum and minimum landings are denoted with red dots), (B) analysis of the viable r-k pairs identified by the CMSY (blue) and BSM (red) methods.
Sustainability 15 15692 g002
Figure 3. Seabream catch (tons), effort (number of boats) and catch per unit effort (CPUE) (tons/boat) of Oman from 1988 to 2021.
Sustainability 15 15692 g003
Figure 4. Catch and CPUE data fit in the CMSY and BSM analyses for the seabream fisheries in Oman waters. (A) Time series of observed and predicted catch fit during 1988–2021 with the gray area indicating the 95% confidence interval, (B) CPUE fit observed vs. predicted with the gray area indicating the 95% confidence interval, (C) deviation of the log Biomass with the gray area indicating the 95% confidence interval, (D) residual plot of observed and predicted CPUE.
Sustainability 15 15692 g004
Figure 5. (A) Seabream catch relative to the BSM estimate of maximum sustainable yield (MSY) (dash line) from 1988 to 2021 with the gray area indicating the confidence interval. (B) Estimated relative biomass trajectory (B/BMSY), with the gray area indicating the confidence interval. (C) F/FMSY time series in slewed black line, with the 95% confidence interval in gray. (D) The ratio of catch to MSY and relative biomass (B/k) over years, BSM estimates are indicated by red lines and CMSY estimates are indicated by blue lines.
Sustainability 15 15692 g005
Figure 6. Stock status (F/FMSY and B/BMSY) of seabream from 1988 to 2021 in Oman as depicted on the Kobe plot. The black dots are the years. The credibility intervals of 50%, 80%, and 95% for the last evaluation years are represented by various grey-colored areas. The fisheries’ safe zone is indicated by the green area, which generates MSY with a steady fishing pressure and a healthy biomass. Due to heavy fishing pressure, the stock biomass in the orange zone is on the verge of being overfished. The biomass from the depleted stock that cannot yield MSY because of ongoing over-exploitation is shown in red. Also, the yellow zone denotes the stock’s reduced fishing pressure recovery phase.
Sustainability 15 15692 g006
Table 1. Estimations of the key parameters of the seabream fisheries of Oman using Monte Carlo Catch–Maximum Sustainable Yield method (CMSY) and the Bayesian Schaefer model (BSM) approaches along with confidence limits.
Key ParametersCMSYBSM
Carrying capacity (k)
(103 tons)
611 (446–1031) *363 (97.2–1079) *
Population growth rate (r)0.0772 (0.0443–0.109) *0.121 (0.0448–0.318) *
Maximum Sustainable Yield
(103 tons/year)
11.8 (7.93–17.2) *11 (6.96–16.7) *
Relative biomass in last year
(B2021/k)
0.36 (0.211–0.52) #0.481 (0.347–0.622) #
Exploitation F/(r/2) in last year1.58 (0.821–3.77) #1.25 (0.687–2.36) #
Catchability coefficient (q)-0.00497 (0.00163–0.0162) *
*—95% CI; #—97% CI.
Table 2. Biological reference points of the seabream fisheries in Oman based on Bayesian Schaefer model (BSM) analysis.
Biological Reference PointsValue
BMSY (103 tons)181 (48.6–539) *
FMSY0.0607 (0.0224–0.159) *
BNOW (103 tons)172 (45–534) #
B/BMSY in last year0.962 (0.695–1.24) #
Exploitation F/FMSY1.25 (0.687–2.36) #
Fishing mortality in last year (2021)0.0747 (0.0226–0.298) #
*—95% CI; #—97% CI.
Table 3. Definition of fish stock status based on B/BMSY in the final year of a time series [44].
B/BMSYF/FMSYStock Status
≥1<1Healthy
0.5–1>1Overfished
0.2–0.5>1Grossly overfished
<0.2>1Collapsed
Disclaimer/Publisher’s Note: The statements, opinions and data contained in all publications are solely those of the individual author(s) and contributor(s) and not of MDPI and/or the editor(s). MDPI and/or the editor(s) disclaim responsibility for any injury to people or property resulting from any ideas, methods, instructions or products referred to in the content.

