Article

The Long-Term Performance of a Rainwater Harvesting System Based on a Quasi-Bicentennial Rainfall Time Series

Department of Civil, Chemical and Environmental Engineering, University of Genova, 16145 Genoa, Italy
*
Author to whom correspondence should be addressed.
Sustainability 2023, 15(21), 15619; https://doi.org/10.3390/su152115619
Submission received: 31 August 2023 / Revised: 17 October 2023 / Accepted: 30 October 2023 / Published: 4 November 2023
(This article belongs to the Special Issue The Impact of Climate Change on Future Water Storage)

Abstract

:
The University of Genova (Italy) maintains a historical meteorological station that has provided daily rainfall measurements over a quasi-bicentennial period since 1833. The daily rainfall series is analyzed here to assess the impact of long-term precipitation trends on the performance of a rainwater harvesting system. The collected rainwater is used for the irrigation of urban green areas. A behavioral model is applied, involving a dedicated procedure to evaluate the actual soil water content available for vegetation and its decay over time. Non-dimensional indicators are obtained to support adaptation strategies and the sustainable design of the required storage tank. Since both irrigation demand and available water storage depend on the amount of rainfall received, fluctuations in daily rainfall and their trend do affect the performance of the system in a non-trivial way. The results demonstrate that the installation of an RWH system for landscape irrigation is a reliable and resilient solution, at least considering the measured rainfall variations of the last 200 years. In the town of Genoa, no specific adaptation seems necessary in terms of the design of the storage tank other than the usual oversizing, typical of engineering design, to account for uncertainties in the hydrological assessment of any RWH system.

1. Introduction

The impact of possible long-term trends in the amount of rainfall (caused by projected scenarios of global temperature trends) on the behavior of rainwater harvesting (RWH) systems is generally addressed by simulating and comparing modeled future scenarios of rainfall based on assumptions about the expected anthropogenic emissions of greenhouse gases (e.g., see [1,2]). However, unlike temperature, rainfall is not an explicit variable in general circulation models (GCMs) and is only obtained after additional parameterization, therefore introducing additional uncertainties in the prospective scenarios. The space and time scales of simulated rainfall patterns often do not match the scale needed for their application to RWH systems, therefore requiring the implementation of further rainfall-downscaling models.
The need to rely on hardly validated climate models of future scenarios arises from the very limited availability of long-term series of actual rainfall measurements, as most of the available rainfall records are usually shorter than a century. A literature review about the optimization of the size of RWH systems for domestic water usage is provided in [3]. The authors highlight that both the quantity and frequency of rainfall are critical design variables in an RWH system and that the sizing of the storage tank is identified as the most important objective of optimization.
By using daily records with a duration of at least thirteen years, in [4], the influence of rainfall time series on the performance of RWH systems was assessed. The study showed that the performance of RWH systems is influenced by the seasonality of rainfall and indicators related to the length of dry periods, a result that might be influenced by the limited length of the available rainfall records.
Subcentennial time series of measured rainfall are often used in the literature, based on the minimum duration of 30 years defined by the World Meteorological Organization (WMO) to characterize climatic timescales. This is the case for the 50-year records exploited by the authors of [5] to investigate the impact of climate change on RWH systems. Observed daily rainfall amounts from numerous stations with ten to one hundred consecutive years of data prior to the year 2000 were used by the authors of [2] to infer downscaling parameters for rainfall scenarios derived from GCMs; the authors used these data in a simplified RWH model, which was applied to various climatic zones.
A few years earlier, a complete behavioral model was applied in [6] to about fifty time series in five European climatic zones with durations ranging from 50 to 150 years; the authors concluded that the Antecedent Dry Weather Period (ADWP) is the main hydrological parameter affecting a system’s behavior, while rainfall event characteristics (including the event rainfall depth, intensity, and duration) revealed a weak correlation. However, in that work, the rainwater demand was limited to toilet flushing, with the demand being independent of the rainfall amount and assumed to occur at a constant daily rate, while in the present study we address the supply of water for the irrigation of urban green areas (where the demand and the amount of rainfall are intrinsically linked).
The performance of RWH systems was analyzed by the authors of [7] in five different locations in the Greater Sydney region of Australia, using daily rainfall data ranging in duration from 28 to 84 years with an average of 50 years. Both indoor and outdoor non-potable water demand were considered within a behavioral model, assuming toilet and laundry demand as indoor usages and garden watering as outdoor usage. The authors concluded that a given tank size at the selected locations would not be able to supply the expected volume of water, with a reduction of 2% to 14% in water savings and a reduction of 3% to 16% in system reliability for a small-size tank for indoor water demand. However, the average duration of the rainfall records investigated was much lower than the one used in the present work (about 25%) and similar to the duration of wet and dry spells detected from the long-term series used in this work.
Climate model results were recently employed in [8] to quantify the long-term performance of RWH systems in Greece, using historical data for a period of 24 years (from 1980 to 2004) and future predictions for two further periods of the same duration (2025–2049 and 2075–2099). The authors concluded that RWH systems will play a vital role as a renewable water resource, although climate projections indicate that RWH should be complemented with alternative resources due to the increasing impact of tourism on water demand in the Mediterranean region.
Continuous simulation based on 71 years of historical data was used in [9] to estimate how RWH systems and demand-side interventions would offset the demand for external sources of water in San Francisco (Texas, US). A time-series model of rainfall was also implemented to extend the simulation period and assess how to reduce water consumption in large hospitals. In the present work, real rainfall measurements are used instead of simulated rainfall scenarios.
The limited extension of the rain series adopted in the abovementioned works in the literature may affect their conclusions since the total time coverage is, in most cases, comparable to either expected or unknown fluctuations and the natural cycles of wet and dry periods. A long-term time series of measured rainfall able to cover several cycles would be desirable to avoid the misinterpretation of subtrends and natural variability, but such data are still rare in most parts of the world.
The availability of nearly two hundred years of daily rainfall measurements taken continuously at the historical weather station of the University of Genova (Italy) makes it possible to use measured rather than modeled long-term trends to draw conclusions about the behavior of man-made freshwater resource management systems in the region. In this work, an RWH system recently implemented in the city of Genoa in a former military settlement is targeted to assess whether design strategies should be adapted to deal with observed long-term rainfall trends.
In a previous work [10], we developed a behavioral model to simulate the operation of the target RWH system (where rainwater is used for landscape irrigation of public areas), which included a dedicated algorithm to simulate the amount of water available for vegetation in the soil and its decrease over time based on the existing soil type and vegetation. The model is adapted here to simulate the performance of the system over a long-term climate horizon and to provide non-dimensional indicators (i.e., parameters that can be readily applied to other contexts) that would support adaptation strategies and sustainable design of the required storage to provide adequate water supplies for irrigation.
For the first time, nearly two centuries of daily rainfall measurements are used here to infer the long-term behavior of an RWH system and to calculate possible trends in water resource availability from measured data rather than from atmospheric model outputs.

2. Materials and Methods

2.1. Long-Term Daily Precipitation Record

The University of Genova maintains a historical series of temperature and rainfall measurements spanning a period of about two centuries. The Meteorological Observatory of the University of Genova has been in operation since January 1, 1833, and was recognized by the World Meteorological Organization (WMO) in June 2021 (Resolution 5—EC73) as a long-term observing station for more than 100 years of meteorological observations. The series of measurements is uninterrupted, and the instrument has been located on the terrace of the University Building in the historic center of Genoa since the beginning of the observations.
The observatory was staffed by its own personnel until 1994, when an automatic meteorological station SIAP UM7525 was installed. The station includes a rain gauge with a gravity-based tipping-bucket measurement principle with a collector area of 1000 cm2 and a measurement resolution of 0.2 mm. Previously, a fully mechanical tipping-bucket rain gauge (SIAP UM8100) was used, which recorded the reading of each tip of the bucket on time charts with daily or weekly durations. The collector area was still 1000 cm2 and each step of the pen arm recorded every 0.2 mm of rainfall. Each complete up and down stroke of the pen arm totaled 10 mm of rainfall. Daily rainfall records are available for the entire observation period; data were recorded with a temporal resolution of 1 h from 2002 to July 2021 and 5 min since August 2021.
The full time series collected at the University of Genova is shown in Figure 1a, along with the overall linear trend, from 1833 to 2022. The linear trend has a negative slope of −1.23 mm y−1 and an intercept of 3618.14 mm. It can be seen from the graph that an outlier occurred in 1872, with an extreme positive value of 2764 mm. It is very difficult to judge whether this value is real or due to a measurement error (e.g., see [11]). The occurrence of such a large value in the first quarter of the time series dominates the trends calculated for the entire series and for most subperiods; therefore, we decided to remove this outlier from the statistics calculated for the historical series, although the original value is retained for the analysis of the RWH system in the following sections. The main statistics for the entire series (mean and standard deviation, coefficient of variation, and maximum and minimum values) are shown in Table 1 after removal of the outlier. The statistics calculated for the partial period 1833–1992, which shows the lowest trend in the series (0.006 mm y−1) after removal of the outlier, are also given. The trend of progressively increasing partial durations, starting from 1833 and excluding the outlier, is shown in Figure 1b and indicates that the trend was barely distinguishable from zero until about the year 2000.
Interestingly, the two periods display very similar statistics—with the exception of their trend—suggesting that the low values observed in the last 20 years may be due to some natural variability, which is not yet fully detectable. This is also confirmed by the fact that the standard variate for the maximum value is much larger than the standard variate for the minimum value in both cases, suggesting that the lower values observed so far are not yet deep enough to compensate for the observed higher values, at least under the hypothesis of symmetric variability around a constant mean.
The WMO states (see e.g., [12]) that its own recommended thirty-year period of reference for studying climate-related variables was set as the standard because only about thirty years of data were available for summarization at the time of the initial recommendation. However, it seems more scientifically sound to assume that this value is widely used since a sample size of thirty is assumed to be the minimum necessary to obtain significant statistical values (the Student’s t-distribution is close enough to a Gaussian distribution for any practical purpose).
Therefore, a smoothed behavior of the series is obtained here by plotting the thirty-year moving average of annual rainfall (see Figure 2a). The smoothed series makes it clear that the 1940s and 1950s were, on average, quite dry decades, while the 1980s and 1990s were quite wet decades, similar to the first quarter of 1900. A periodic oscillation of about 60 years is evident, with the last 15 years (starting around 2007) being the driest of the entire series.
The cumulative standard variate is shown in Figure 2b, with two additional annual time series included for comparison, measured at two sites in the Netherlands for which centennial rainfall records are available. These data show opposite behavior to the series recorded at the University of Genova, suggesting that the observed recent minimum in annual rainfall totals in Genoa may be a local rather than a general feature. In the graph, for readability, a fictitious match between the values of the standard deviate in the initial year is assumed, which does not change the comparison of the recent trend sign.
Whatever the cause of such high variability and trends in observed rainfall, the operation and performance of any water resource management system, including RWH, is clearly affected and the use of the long-term average of annual rainfall alone seems unlikely to provide adequate reliability. An example RWH system is tested below, using the long-term daily rainfall data from the University of Genova as input. The resulting trends in selected reliability indicators are presented and discussed along with possible technical countermeasures.

2.2. Modeling of the RWH System

The targeted RWH system, using rainwater to irrigate public green spaces, is part of a reconversion initiative for a former military settlement in the city of Genoa, Italy, characterized by a temperate Mediterranean climate and classified as Csa in the Köppen–Geiger classification [13]. A public park has been created where various green spaces, playgrounds, picnic areas, and orchards have replaced sheds and open areas where weapons used to be stored. Rainwater is collected and used to irrigate the park. Nature-based solutions (NBS) have been installed to manage stormwater runoff. Collected rainwater from roofs and impervious surfaces is combined with water from vegetated and semi-permeable areas, such as porous pavements.
The targeted RWH system is described in [10], and the reader is referred to that work for details of the behavioral model implemented to simulate the performance of the system as a function of the size of the storage volume. In [10], different scenarios were simulated, where rainwater was collected either from roof runoff or from drainage of ground surfaces. A dedicated model for irrigation demand depending on the actual availability of water for vegetation was also introduced, where the water demand for irrigation is calculated based on the actual soil water content according to the daily rainfall.
To understand factors that influence the operation of an RWH system, a behavioral model is usually implemented that describes a set of states and events responsible for changes in the state of the system. Recently, a comparison between the results of a daily water balance model and those of other models [14] showed that this model is superior in modeling the performance of RWH systems. The model used here operates on a daily scale and simulates the volumetric balance between collected rainwater and water used for irrigation, using the Yield After Spillage (YAS) algorithm (e.g., see [15]). As mentioned in [16], the use of the YAS algorithm provides a conservative assessment of the water supplied through a simplified approach in which storage is calculated at the end of each selected time interval.
The water demand for irrigation is calculated on a daily scale and supplied to the green areas. The variables used to describe the different components of the behavioral model (see equation (2) in [10]) are the simulation interval t, the rainfall amount Pt (L), the volumetric rainwater inflow to the storage tank Qt (L3), the storage capacity of the system (or tank volume) S (L3), the actual rainwater volume stored in the system Vt (L3), the released volume Yt (L3), the overflow volume Ot (L3), and the water demand Dt (L3).
In general, appropriate performance indicators for RWH systems (i.e., indices that can quantify the system’s ability to meet water demand) are used [10]. In this work, we use two volumetric reliability indicators, overall efficiency ET and overflow ratio OT, defined as
E T = t = 1 N Y t t = 1 N D t
O T = t = 1 N O t t = 1 N Q t
where ET is the ratio between the rainwater volume provided by the RWH system and the associated water demand during the simulation period, and OT is the ratio between the overflow volume and the total rainwater volume collected during the simulation period.
Following the authors of [17], who found that the economic benefit of an RWH system decreases as the tank capacity increases, because the increased cistern capacity is only partially used depending on the water demand, the general indicator of the economic benefit of an RWH system is calculated as the annual usage volume per unit of tank capacity (U), which is defined as follows:
U = Y T S
Finally, the quality of the collected resource is evaluated by calculating the rainwater detention time (τ), expressed in days, assuming that the rainwater inflow to the storage tank (Qt) and the rainwater volume stored in the tank at the previous time step (Vt−1) are completely mixed at every time step. To evaluate the performance of the RWH system in terms of water quality, a reference value τ*, (which is assumed to be three days) is used here and the normalized value τ/τ* is calculated.

3. Results

We applied the behavioral model to the target RWH system using long-term daily rainfall measured at the University of Genova as input. Rather than calculating an overall average behavior, as is the case in most literature, here we examine the temporal variability of the assumed performance indicators to identify possible trends of their thirty-year average that could affect the design of the system (essentially, the storage volume).
Of the three rainwater collection scenarios studied in [10], we focus on Scenario 2, where rainwater is collected only from a sheet metal roof with a total area Atot = 1800 m2 and a runoff coefficient ϕeq = 0.95. This is more typical of RWH systems and allows the uncertainty of the collected rainwater to be limited to rainfall variability. For this study, the overall demand fraction D/Q is 0.56, where D represents the annual water demand and Q represents the annual inflow. The tank sizes considered range from 30 m3 to 500 m3, resulting in an annual storage fraction S/Q that varies from 0.014 to 0.234.
The annual demand fraction fluctuates yearly and has notably risen during the last two decades due to a recent period of drought. It is important to note that this dimensionless measure takes into account both the changes in soil water content and the rainfall variability, according to the algorithm described in [10], but excludes the variability and trend of daily average temperature from our present investigation.
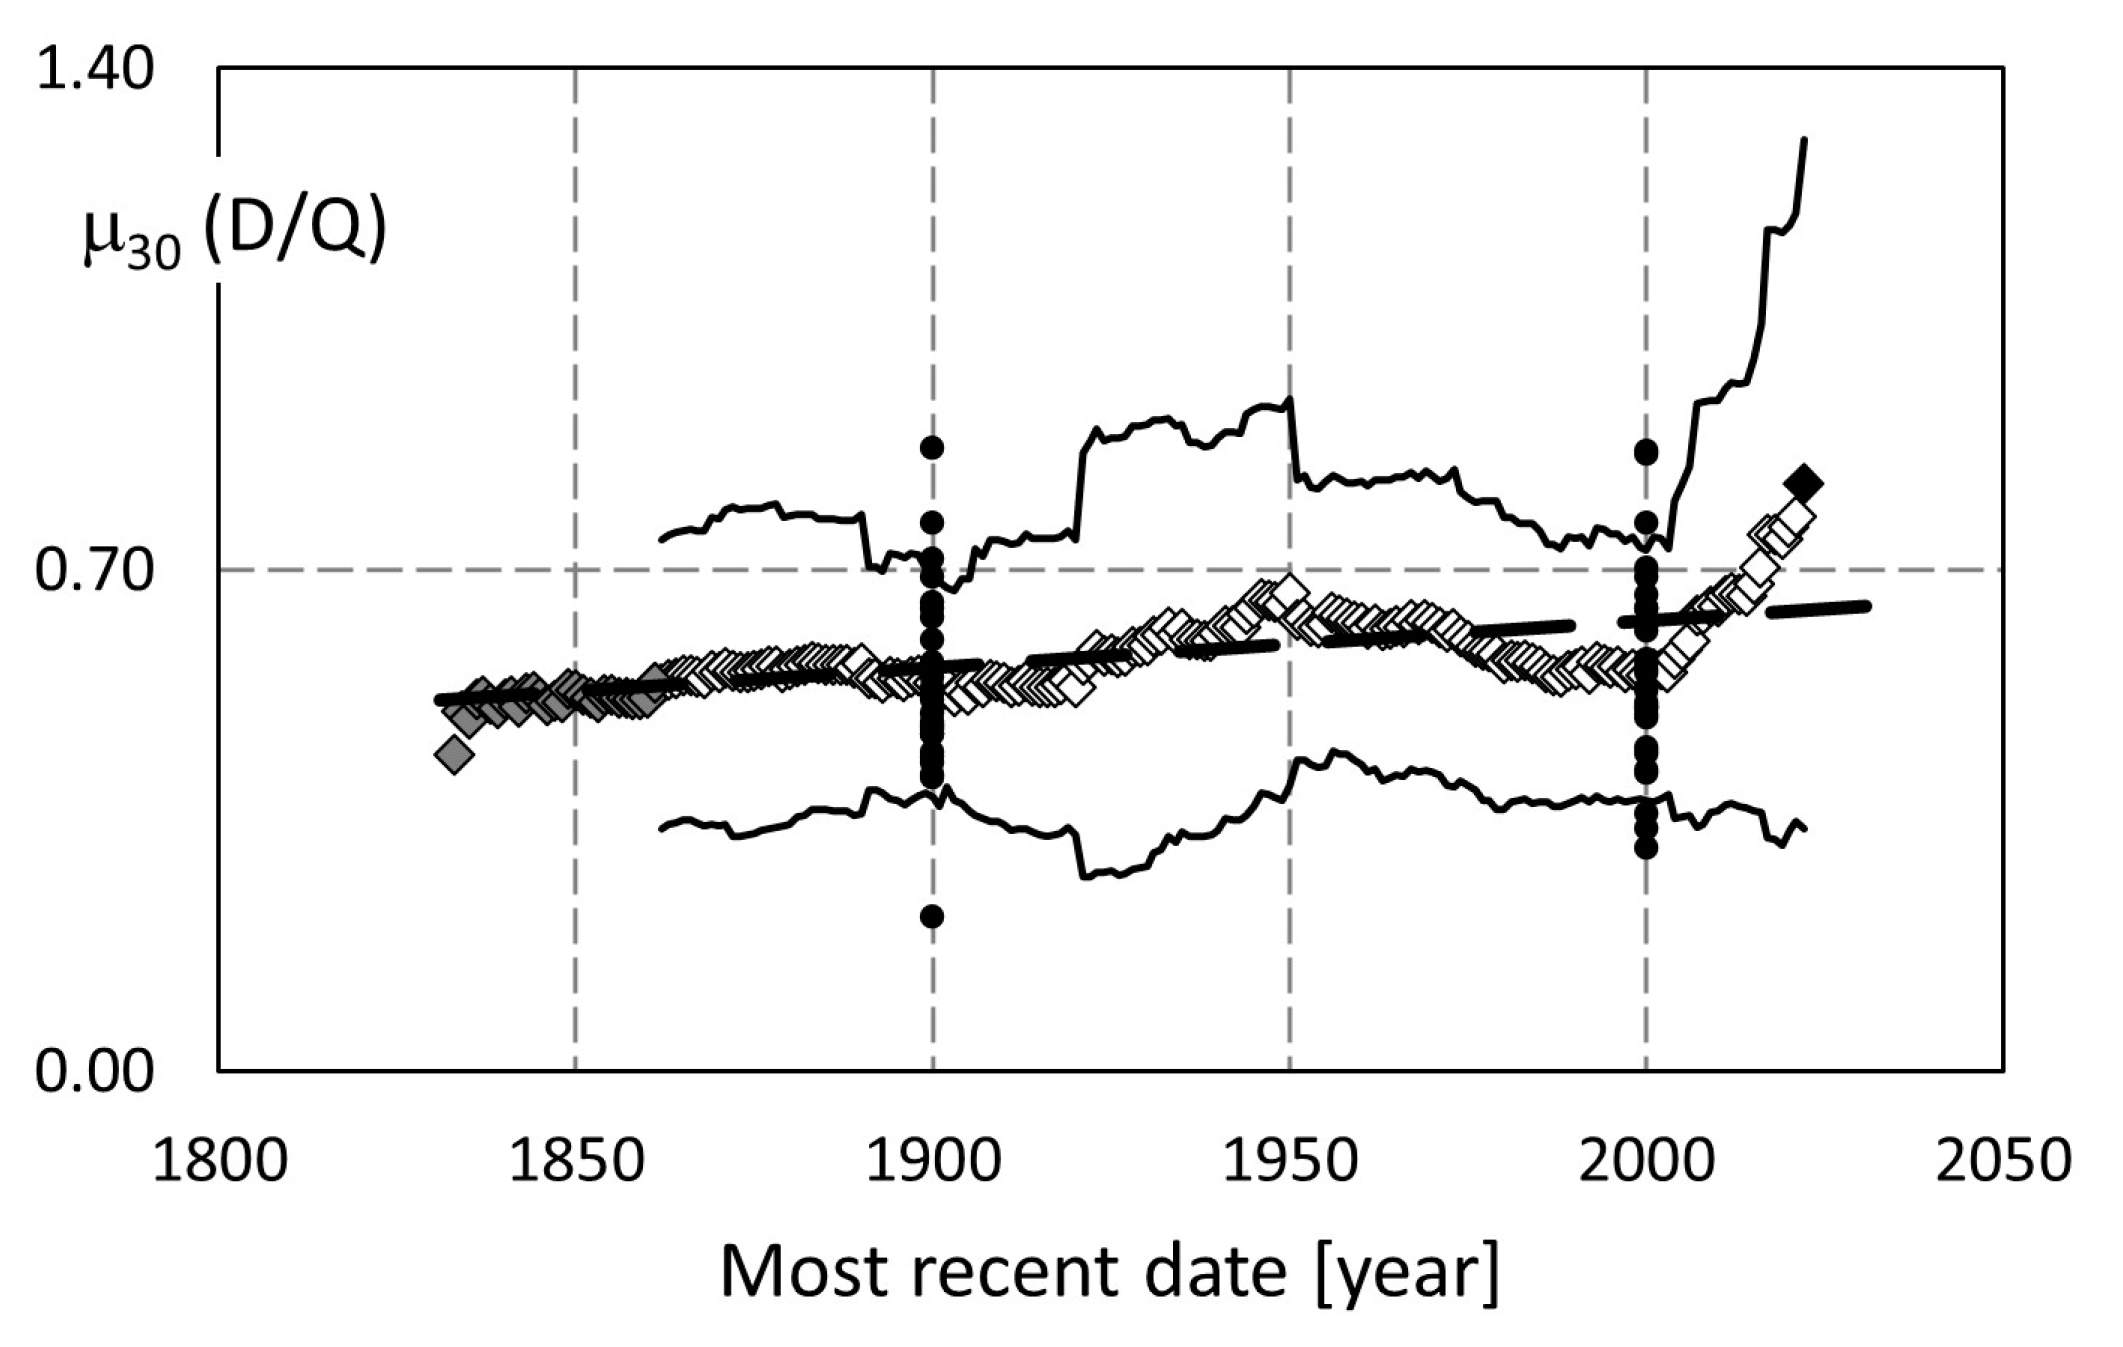
Figure 3 depicts the thirty-year moving average of the demand fraction along with the distribution of individual values obtained for two sample years, corresponding to the centennial dates. The thin black lines represent the 80% interval of the sample for each subperiod. The latest value of the series is indicated by the black diamond.
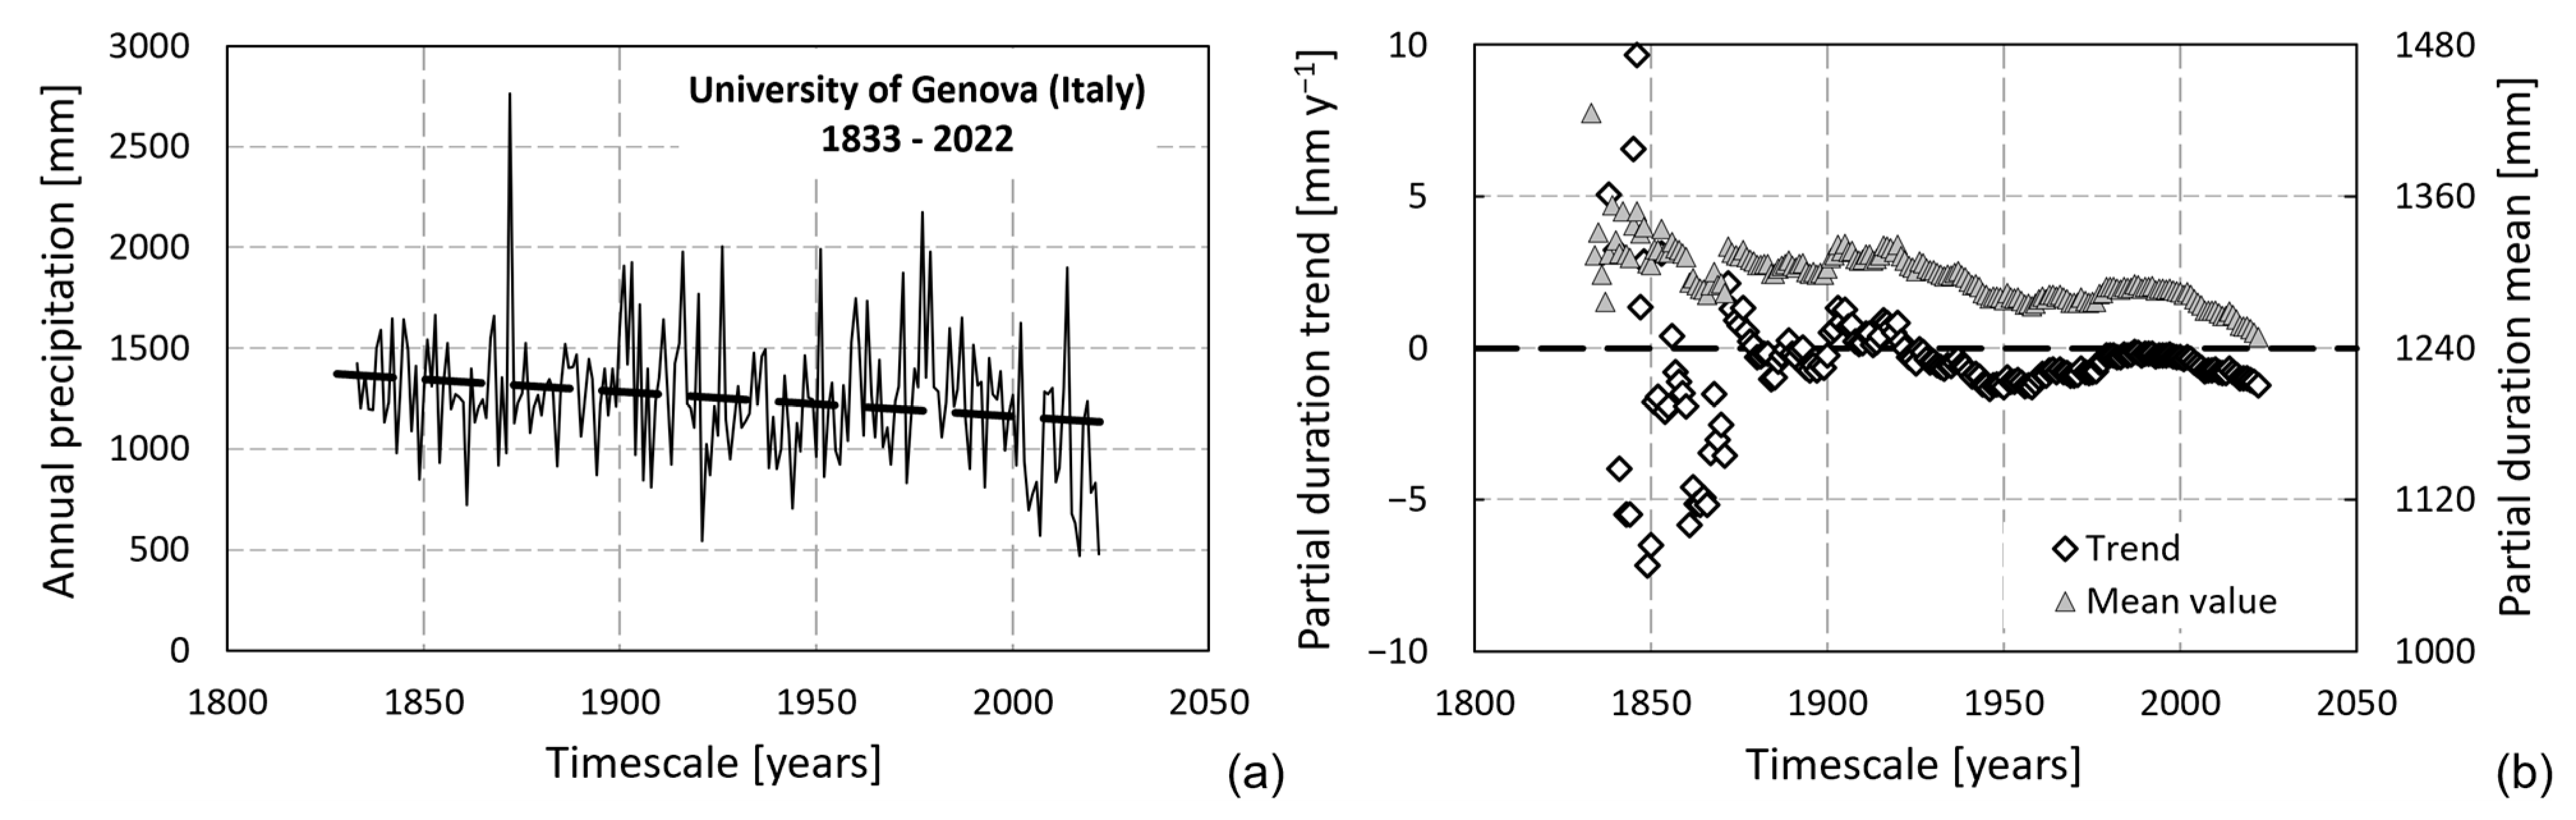
The linear trend of the thirty-year averaged demand fraction has a slope of 0.7‰. Interannual variability is generally stable throughout the examined time series, with the exception of periods heavily impacted by individual dry or wet years. Notably, the graph reflects a sudden leap caused by an extremely dry spell in 1921. This effect is visible until the effect of the thirty-year average terminates in 1950. After the year 2000, there has been a significant increase, which can be attributed to the most recent period of aridity, as seen in Figure 1a.
The rising demand fraction suggests that watering the park’s green spaces now requires a greater portion of the annual rainfall, potentially reducing the capacity of the RWH system to ensure vegetation survival. If additional usages of the collected rainwater were to be included, such as the flushing of public restrooms in the vicinity, a fixed daily amount would be incorporated into the demand fraction. This component is omitted in the present work since it is unrelated to the amount of rainfall.
Figure 4 illustrates the overall trend and interannual variability of the four performance indicators used in this study over the quasi-bicentennial period, obtained with a storage size S = 120 m3. The trend for all indices generally reflects a mild decline observed in daily rainfall, mainly driven by the dry period of the last two decades. Table 2 presents the linear trend parameters of the four indices.
All indicators point to a slight decline, attributable to an increase in the demand fraction, which negatively impacts overall efficiency and usage volume per unit tank capacity. As such, the value for money of the RWH system is progressively diminishing. The reduced overflow ratio and normalized detention time positively impact the efficient design of the RWH system since a lower portion of the collected rainwater remains unused and the deterioration of the stored water volume is limited due to the reduced detention.
The normalized detention time decreases more steeply than the other indicators, suggesting a significant improvement in the quality of the rainwater supplied to the vegetation. Nevertheless, the detention time is already below twice the reference value for most of the simulated time series, and the quality requirements for landscape irrigation are typically low. As a result, the observed enhancement is not substantial.
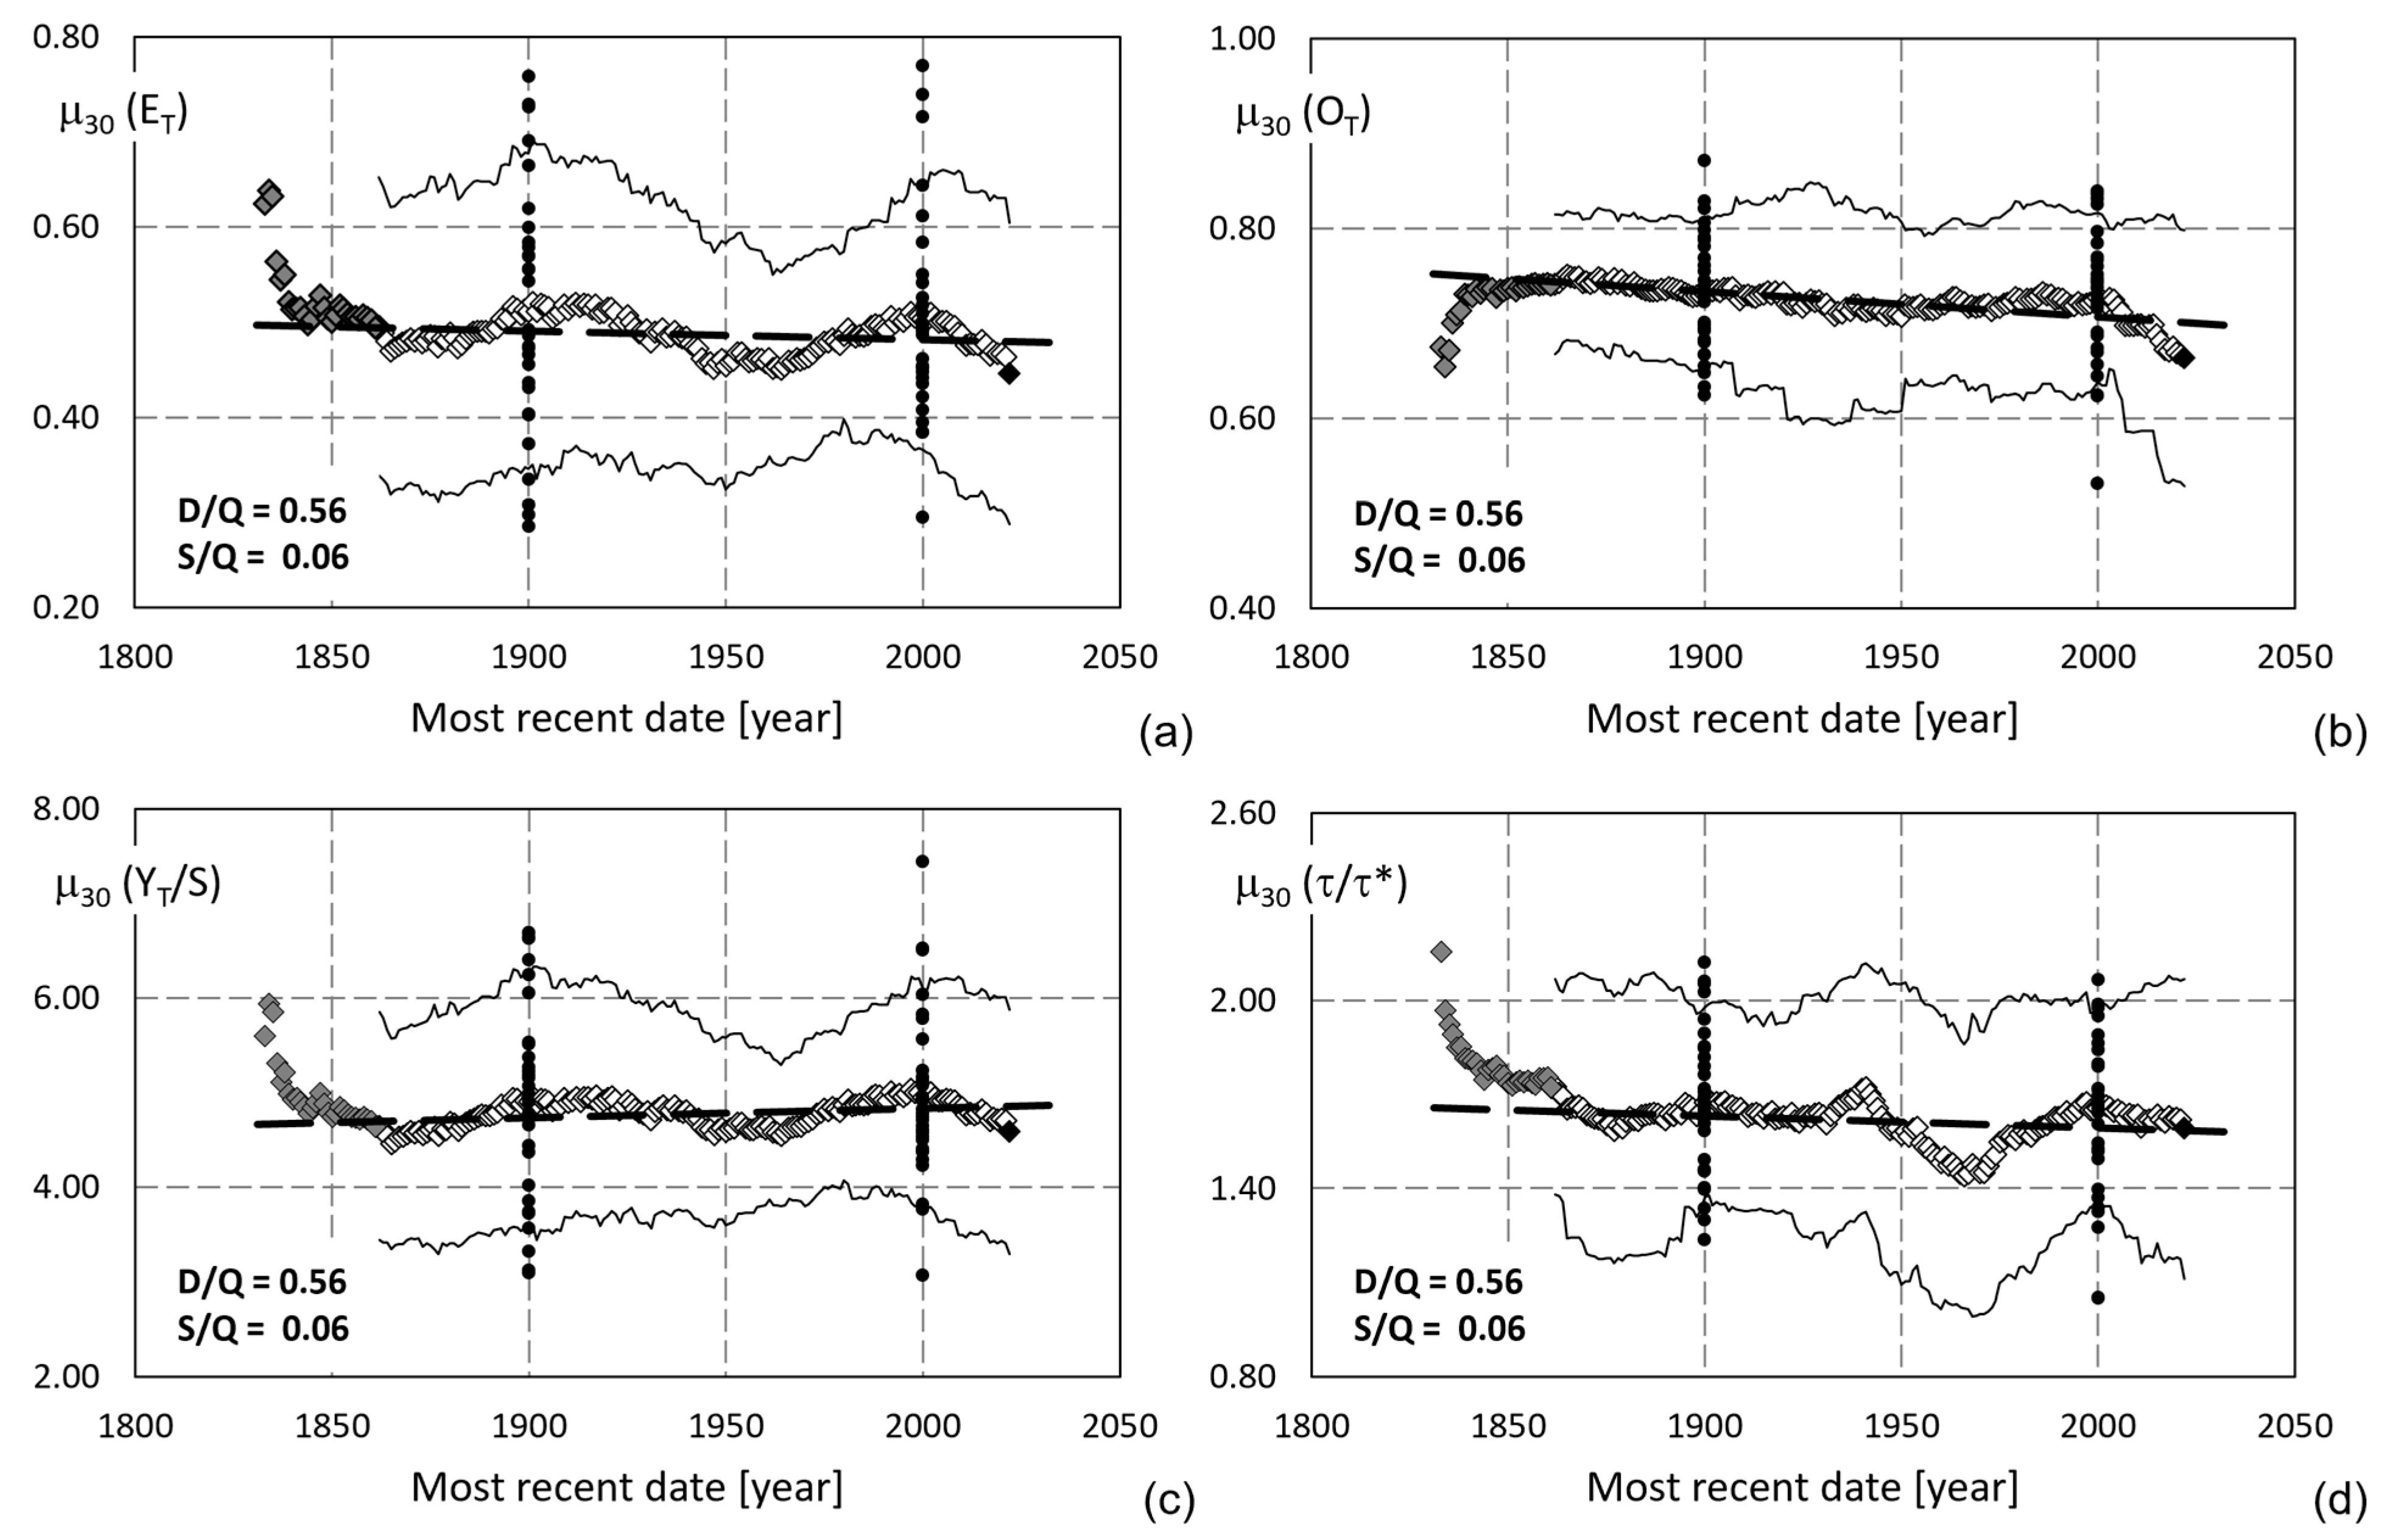
Figure 5 shows the thirty-year moving average (white diamonds) of each indicator plotted against the last year of each subperiod, accompanied by the linear trend. Dark grey highlights denote the initial values, calculated over a shorter duration than the rest of the data series and, hence, deemed unreliable due to being less than 30 years.
The graphs include thin black lines indicating the interval encompassing 80% of the sample per each subperiod, accompanied by the sample distribution of individual values obtained for two sample years, which correspond to the centennial dates. The black diamond denotes the latest value in each series.
The overall efficiency is evidently influenced by alternating wet and dry spells that have been previously identified in the daily rainfall record. Nonetheless, interannual variability that is small, such as in the second half of the last century, and large, such as around centennial dates, is observed. A substantial variation in the overall efficiency points to potential underperformance of the storage tank design during dry years and overperformance during wet years. However, for the two years sampled on the centennial dates, in which the entire set of individual annual efficiency figures are reported, there were more instances of wet spells compared with dry spells, resulting in a greater frequency of positive deviations than negative ones (the frequency distribution is not symmetric). Lower efficiency values similar to those witnessed in contemporary times were previously observed in thirty-year periods in the third quarter of the century.
Similar long-term fluctuations can be seen in the series of thirty-year averaged overflow ratios, with a notable decrease in the most recent values related to the latest dry period. Despite the presence of oscillations due to the moving average process, the interannual variability is less significant compared with the annual efficiency. This means that daily rainfall fluctuations are offset by the corresponding variation in the water demand for irrigation. The most recent values constitute the lowest of the entire series.
The thirty-year average of the usage volume per unit tank capacity has increased steadily, indicating that the RWH system provides better value for money than the year-by-year analysis suggests. This is due to a higher water demand for irrigation in recent years caused by limited daily rainfall, as evidenced by the demand fraction trend outlined in Figure 3. Moreover, the outliers in the distribution of yearly figures in the year 2000 indicate the favorable impact of the tank during certain arid years. Nonetheless, the minimum values in the series, witnessed in the third quarter of the last two hundred years, have not been attained in the present few decades.
This suggests that the stored water for irrigation is more frequently replaced, leading to improved water quality. The detention period gradually shortens as the available inflow of rainwater reduces. Nevertheless, the third quarter of this century saw a more favorable period from this perspective, with a thirty-year average of the detention time equal to about 1.4.
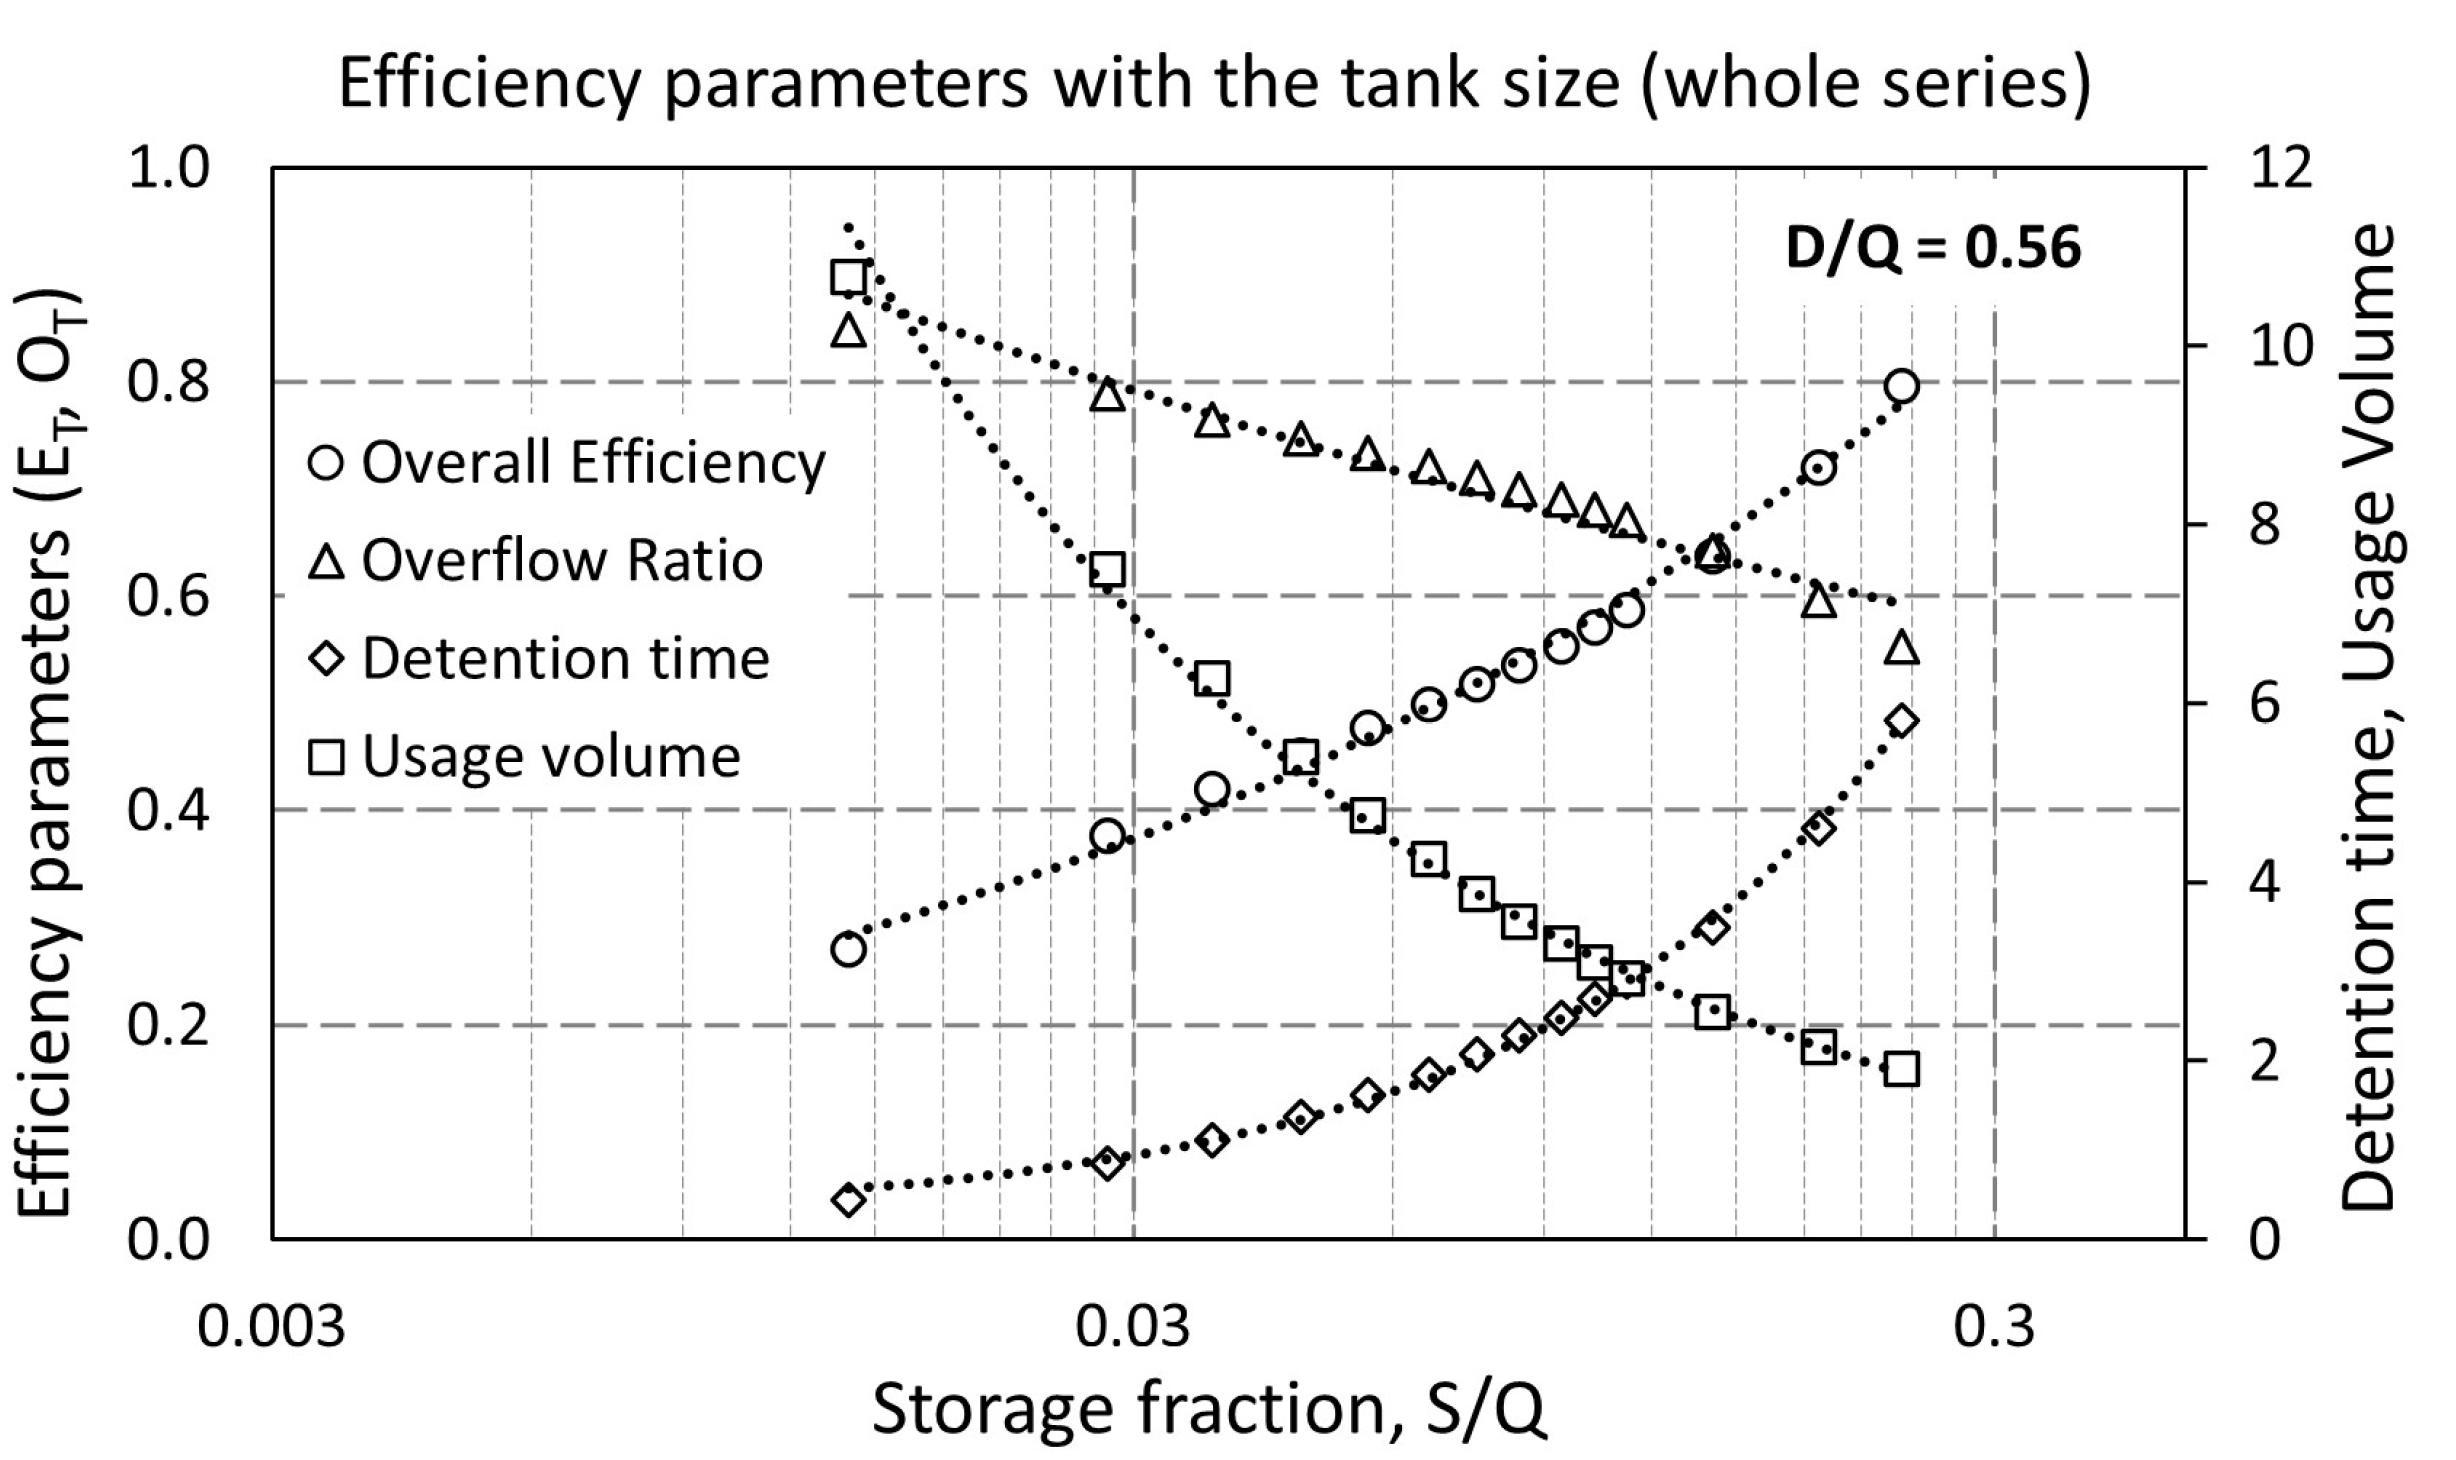
To provide context on the variability of the performance indicators, we calculated their variability with respect to tank size. This allows for assessment of the potential impact of climatic trends and enables evaluation of design recommendations for adaptation. We tested several volumes of the storage tank ranging from 30 to 500 m3. The steps were variable, with 30 initially, 20 from 60 to 240, and then 60 and 100 m3. For each volume, we calculated the four performance indicators used in this study, utilizing the entire series of daily rainfall data as input. The results are plotted in Figure 6 as a function of the (now variable) storage fraction S/Q, while the demand fraction is fixed and equal to the average value calculated for the entire time series.
According to Figure 5a, the thirty-year averaged efficiency with a tank of 120 m3 (S/Q = 0.06) ranges from 0.45 to 0.52, excluding the initial periods when the sample period is less than thirty years.
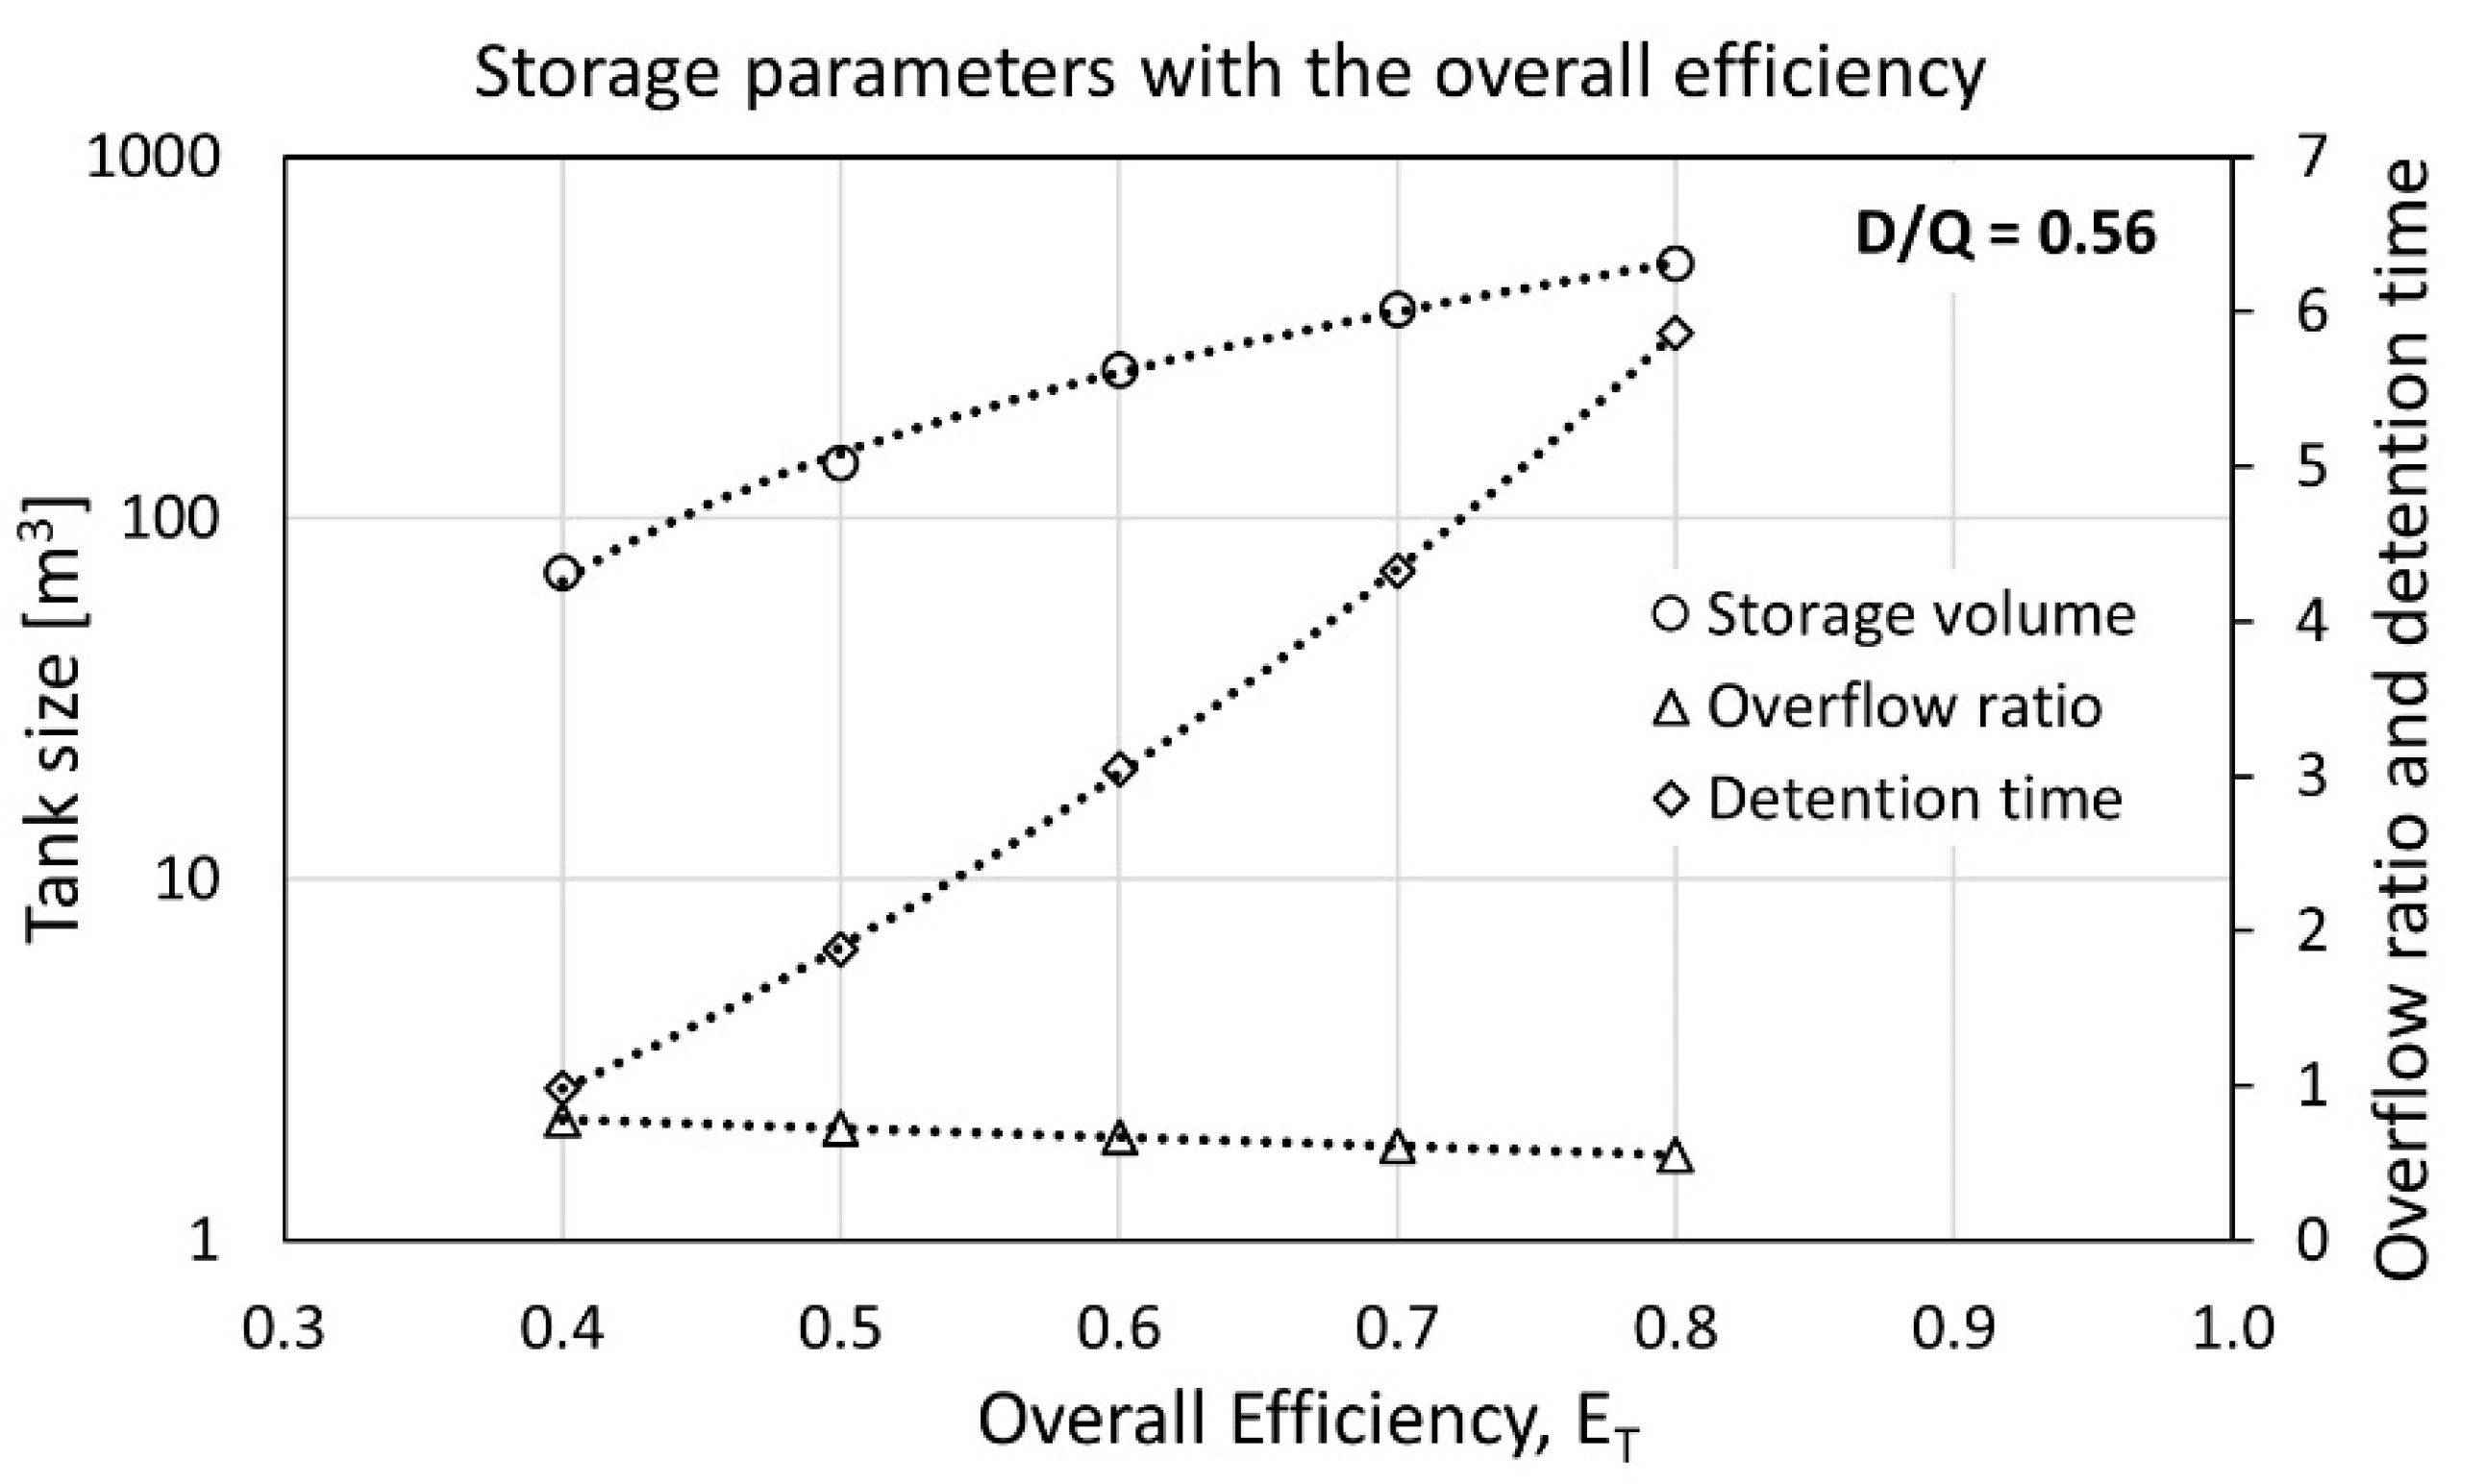
The graph presented in Figure 7 demonstrates that enlarging the tank size to improve the overall efficiency and the overflow ratio leads to a marked rise in detention time accompanied by a decrease in water quality. Consequently, designing an optimal approach requires careful consideration of various factors rather than focusing solely on achieving the desired efficiency levels.
Although water quality is less relevant for landscape irrigation than for other usages, the graph illustrates that a design storage of 120 m3, with an associated overall efficiency ET = 0.5, results in a detention time approximately twice the target value. Therefore, doubling the storage size to achieve an overall efficiency of ET = 0.6 would result in a detention time greater than three times the target value and is not recommended.

4. Discussion

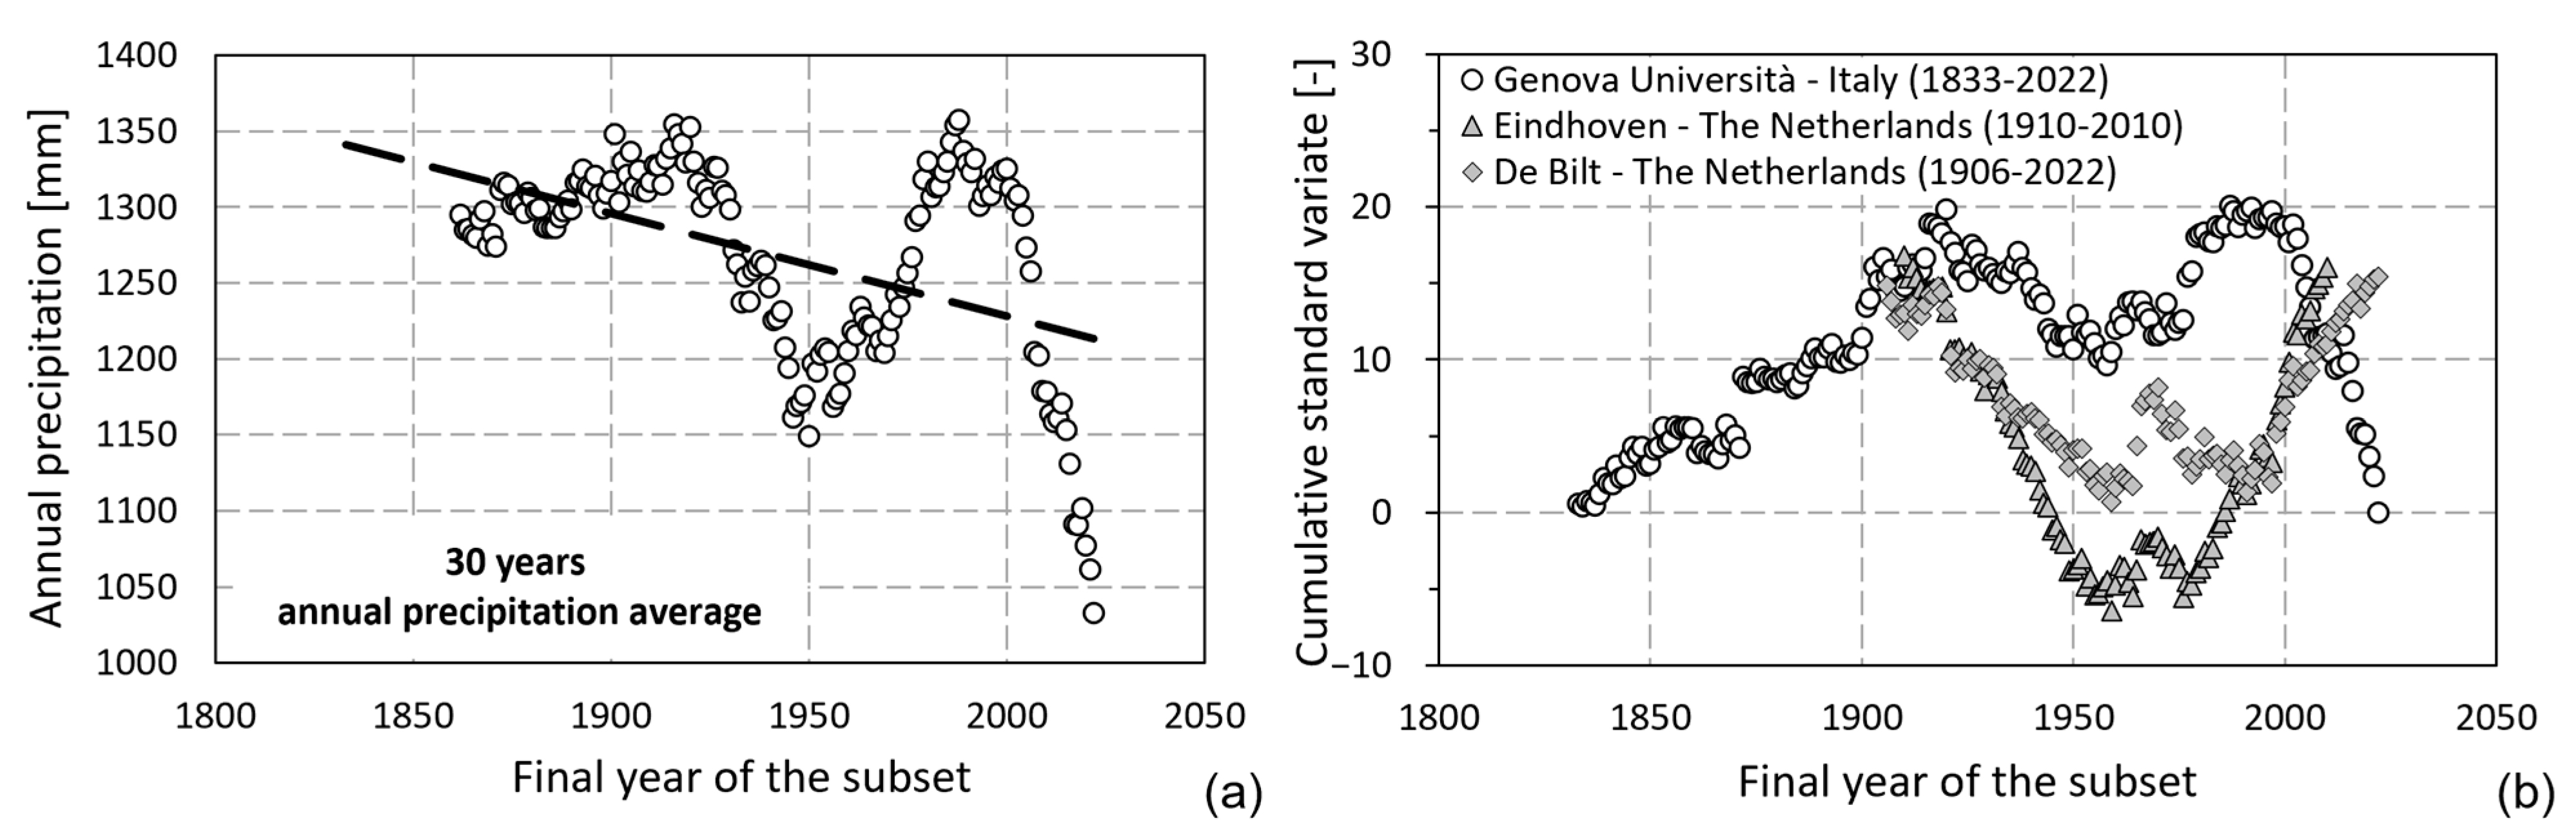
The bicentennial series of annual rainfall records from the University of Genova displays a lack of trend until approximately 2000, albeit with a notable decrease of 18% in the last three decades. The recent observed decline in the latest years appears to be a weather pattern confined to local areas, as contrasting trends have been recorded in other European regions. This event results in a temporary decrease of the long-term trend, which cannot be projected for future estimates based solely on statistical considerations.
After using the long-term series of daily rainfall as input to the behavioral model of the target RWH system, the thirty-year moving average of the selected performance indicators closely tracks the variability in rainfall due to the system’s sole usage for landscape irrigation and limited demand fraction.
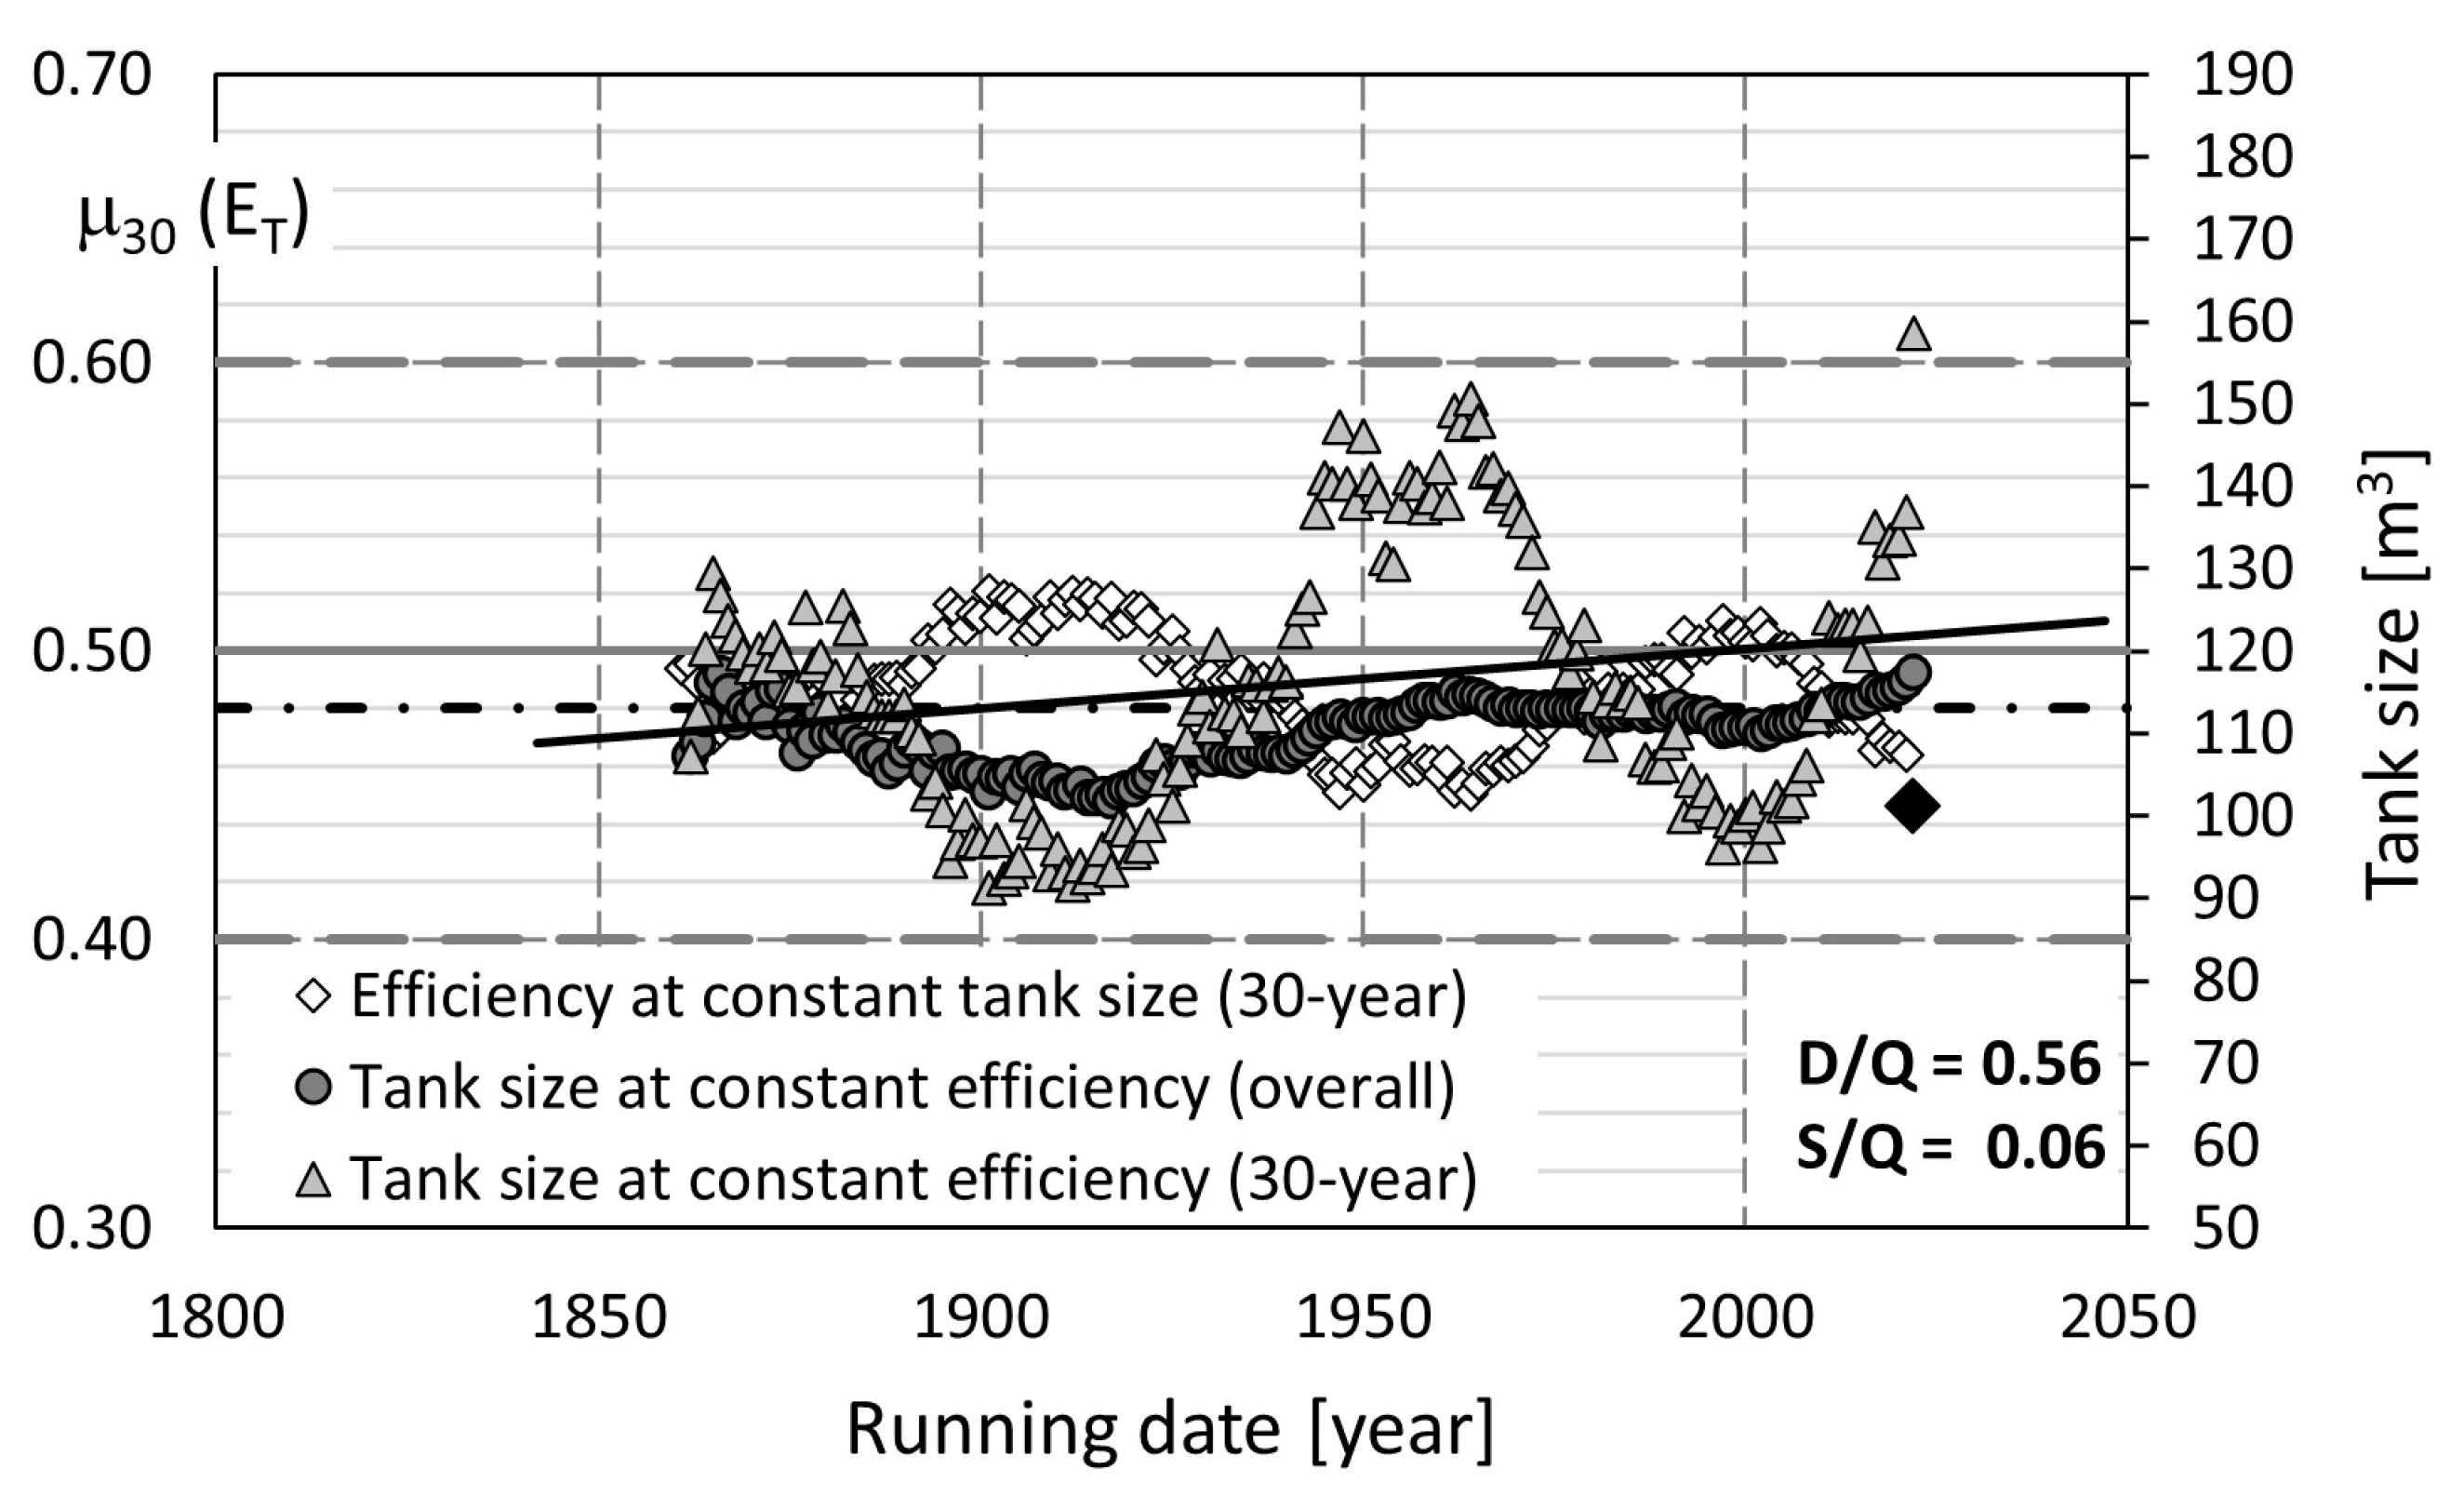
In terms of a simplified evaluation of possible design cues to improve resilience resulting from the long-term simulation, an interesting aspect to consider is whether and to what extent the size of the storage tank that we hypothetically obtained from an initial design would maintain its suitability over time. To answer this question, we calculated, for each year, the size of the storage tank that would ensure a constant overall efficiency over time, taking into account both the thirty-year moving average μ30(ET) and the overall value calculated using the increasingly long complete time series ET.
The resulting time series are shown in Figure 8, along with the thirty-year moving average of the overall efficiency based on a fixed tank size of 120 m3 (as in Figure 5a). The calculated mean value of the overall efficiency at S = 120 m3 is ET = 0.48, and we have calculated the tank volume required to achieve a target value of 0.48 in each reference period, whether the overall series since 1833 or the moving average over subperiods of thirty years.
Looking at the overall efficiency calculated over the increasingly long time series from 1833 to the present, the required changes in the tank size to ensure constant ET are limited, albeit subject to some random fluctuations that cannot be easily extended in future projections. The percentage increase in tank size required to maintain a constant overall efficiency of 0.48 for an original storage design of 107 m3 is about 4% per year. If we assume that the RWH system was built in 1917, the year when overall efficiency was highest, the corresponding tank size to ensure ET = 0.48 is 102 m3, so the required increase in storage size at the present time (117 m3) would be about +15%.
Looking at the thirty-year moving average of the overall efficiency index calculated for each year, the variability in system performance over time is obviously enhanced and the tank size changes required to ensure that ET remains constant are significantly greater (about 7% per year). Again, since 1901, when the thirty-year average efficiency was highest with a tank size of 91 m3, the required increase in tank size at the present time (158 m3) would be about +74%. However, this would mean that, at any specific date, the history of measured rainfall data would be neglected except for the last 30 years, which is a limited approach yielding a less-informed design of the RWH system than is currently possible.
The typical design practice included in the European published standard on the design and maintenance of RWH systems (e.g., see [18]) suggests precautionary oversizing of the tank volume (up to 50% in simplified calculations) to account for several uncertainties, including the variability of annual precipitation. The tank size corresponding to a precautionary deviation of ±30% from the original design is given in Figure 8 to show that the required changes due to the rainfall variability observed in about the last 200 years are mostly contained within such values (the only exception being the exceptional dry period of the last few years).
The impact of such changes on the design of the RWH system is, therefore, smaller or comparable to other uncertainties that are inherent to the simulation, such as the role of evapotranspiration, rainfall measurement biases (e.g., see [11]), runoff coefficient estimation, etc.
This work demonstrates that the design and construction of an RWH system for landscape irrigation is a reliable and resilient solution to address temporal variations in daily rainfall over time, at least when measured variations over the past 200 years are considered. The scarce rainwater availability over the last 20 years needs to be further studied in light of weather patterns over the next few years, and no final considerations can be made based on measured data alone.
Regarding the design of the storage tank, no special adjustment seems to be necessary, apart from the usual oversizing typical of engineering design to account for uncertainties in the hydrological assessment of the RWH system.
It should be noted that the present analysis is limited to observed changes in rainfall, while temperature changes and their effects on vegetation evapotranspiration (and, thus, landscape irrigation needs) are not considered. These are the subject of further refinements to this study and will be presented in future work. However, it is important to consider that increased evapotranspiration could increase the water demand for irrigation, thereby increasing the use of collected rainwater and decreasing the performance of the RWH system studied over time. More demanding usage scenarios could also have a greater impact on the long-term performance of the RWH system and are currently under further investigation.

Author Contributions

Conceptualization, A.C. and L.G.L.; Methodology, A.C. and L.G.L.; Software, A.C. and L.G.L.; Formal analysis, A.C. and L.G.L.; Investigation, A.C. and L.G.L.; Data curation, A.C. and L.G.L.; Writing—original draft, A.C.; Writing—review & editing, L.G.L. All authors have read and agreed to the published version of the manuscript.

Funding

This research received no external funding.

Data Availability Statement

The data produced in this study are available upon request from the corresponding author. The daily rainfall series are available upon request to DISTAV, University of Genova. For more information: www.distav.unige.it/meteo (accessed on 16 October 2023).

Acknowledgments

The daily rainfall measurements were provided by DISTAV, University of Genova. Many thanks to G. Ferretti and D. Scafidi for providing the data, the ancillary information, and discussing the measurement accuracy.

Conflicts of Interest

The authors declare no conflict of interest.

References

  1. Lo, K.F.A.; Koralegedara, S.B. Effects of Climate Change on Urban Rainwater Harvesting in Colombo City, Sri Lanka. Environments 2015, 2, 105–124. [Google Scholar] [CrossRef]
  2. Musayev, S.; Burgess, E.; Mellor, J. A global performance assessment of rainwater harvesting under climate change. Resour. Conserv. Recycl. 2018, 132, 62–70. [Google Scholar] [CrossRef]
  3. Semaan, M.; Day, S.D.; Garvin, M.; Ramakrishnan, N.; Pearce, A. Optimal sizing of rainwater harvesting systems for domestic water usages: A systematic literature review. Resour. Conserv. Recycl. X 2020, 6, 100033. [Google Scholar] [CrossRef]
  4. Istchuk, R.N.; Ghisi, E. Influence of rainfall time series indicators on the performance of residential rainwater harvesting systems. J. Environ. Manag. 2022, 323, 116163. [Google Scholar] [CrossRef] [PubMed]
  5. Gwoździej-Mazur, J.; Jadwiszczak, P.; Kaźmierczak, B.; Kózka, K.; Struk-Sokołowska, J.; Wartalska, K.; Wdowikowski, M. The impact of climate change on rainwater harvesting in households in Poland. Appl. Water Sci. 2022, 12, 15. [Google Scholar] [CrossRef]
  6. Palla, A.; Gnecco, I.; Lanza, L.G.; La Barbera, P. Performance analysis of domestic rainwater harvesting systems under various European climate zones. Resour. Conserv. Recycl. 2012, 62, 71–80. [Google Scholar] [CrossRef]
  7. Haque, M.M.; Rahman, A.; Samali, B. Evaluation of climate change impacts on rainwater harvesting. J. Clean. Prod. 2016, 137, 60–69. [Google Scholar] [CrossRef]
  8. Zarikos, I.; Politi, N.; Gounaris, N.; Karozis, S.; Vlachogiannis, D.; Sfetsos, A. Quantifying the Long-Term Performance of Rainwater Harvesting in Cyclades, Greece. Water 2023, 15, 3038. [Google Scholar] [CrossRef]
  9. Fulton, L.V. A Simulation of Rainwater Harvesting Design and Demand-Side Controls for Large Hospitals. Sustainability 2018, 10, 1659. [Google Scholar] [CrossRef]
  10. Cauteruccio, A.; Lanza, L.G. Rainwater Harvesting for Urban Landscape Irrigation Using a Soil Water Depletion Algorithm Conditional on Daily Precipitation. Water 2022, 14, 3468. [Google Scholar] [CrossRef]
  11. Lanza, L.G.; Cauteruccio, A. Accuracy assessment and intercomparison of precipitation measurement instruments. In Precipitation Science; Michaelides, S., Ed.; Elsevier: Amsterdam, The Netherlands, 2021; Chapter 1; pp. 3–35. ISBN 978-0-12-822973-6. [Google Scholar] [CrossRef]
  12. World Meteorological Organization (WMO). Guide to Climatological Practices (WMO-No. 100); WMO: Geneva, Switzerland, 2011. [Google Scholar]
  13. Peel, M.C.; Finlayson, B.L.; McMahon, T.A. Updated world map of the Köppen-Geiger climate classification. Hydrol. Earth Syst. Sci. 2007, 11, 1633–1644. [Google Scholar] [CrossRef]
  14. Imteaz, M.A.; Shadeed, S. Superiority of water balance modelling for rainwater harvesting analysis and its application in deriving generalised equation for optimum tank size. J. Clean. Prod. 2022, 342, 130991. [Google Scholar] [CrossRef]
  15. Mitchell, V.G. How important is the selection of computational analysis method to the accuracy of rainwater tank behaviour modelling? Hydrol. Process. 2007, 21, 2850–2861. [Google Scholar] [CrossRef]
  16. Raimondi, A.; Quinn, R.; Abhijith, G.R.; Becciu, G.; Ostfeld, A. Rainwater Harvesting and Treatment: State of the Art and Perspectives. Water 2023, 15, 1518. [Google Scholar] [CrossRef]
  17. Jones, M.P.; Hunt, W.F. Performance of rainwater harvesting systems in the southeastern United States. Resour. Conserv. Recycl. 2010, 54, 623–629. [Google Scholar] [CrossRef]
  18. UNI/TS 11445:2012; Ente Italiano di Normazione (UNI) Impianti per la Raccolta e Utilizzo Dell’acqua Piovana per usi Diversi dal Consumo Umano—Progettazione, Installazione E Manutenzione. UNI: Milano, Italy, 2012. (In Italian)
Figure 1. (a) Long-term time series (190 years) of the total annual rainfall measured at the weather station of the University of Genova over the period 1833–2022 (solid grey line) and the corresponding linear trend (black dashed line). (b) Trend of the partial duration series starting in 1833 and ending in any year, and the corresponding value of the partial duration mean (scale on the right-hand axis).
Sustainability 15 15619 g001
Figure 2. (a) Thirty-year moving average of annual rainfall (circles) over the entire series (after removal of the outlier) with the associated linear trend (thick black dashed line). (b) Cumulative standard variate of annual rainfall in Genova compared with that of two locations in the Netherlands (Eindhoven and De Bilt) with approximately one hundred years of daily rainfall records.
Sustainability 15 15619 g002
Figure 3. Thirty-year moving average (white diamonds) of the demand fraction and its linear trend (thick black dashed line). The grey diamonds indicate initial values with a limited sample size (therefore, less reliable), while the black diamond is the current year value. Thin black lines encompass 80% of the sample per year and black dots indicate individual annual values for two sample years, which correspond to the centennial dates.
Sustainability 15 15619 g003
Figure 4. Annual variation (thin grey lines) of the performance indicators: (a) overall efficiency ET, (b) overflow ratio OT, (c) usage factor YT/S, and (d) normalized detention time τ/τ*. The thick black dashed lines represent the linear trend of each time series.
Sustainability 15 15619 g004
Figure 5. Thirty-year moving average (white diamonds) of the performance indicators: (a) overall efficiency ET, (b) overflow ratio OT, (c) usage factor YT/S, and (d) normalized detention time τ/τ*. The grey diamonds indicate initial values, which were based on a small sample, while the black diamond depicts the most recent year’s value. The thin lines encompass 80% of the sample for each year, with black dots indicating the annual values for two sample years, which correspond to the centennial dates. The thick black dashed line indicates the linear trend.
Sustainability 15 15619 g005
Figure 6. Pattern of the four performance indices implemented, demonstrating the influence of storage tank size ranging from 30 to 500 m3, expressed in terms of the corresponding storage fraction. This is based on the adopted behavioral model and a fixed demand fraction.
Sustainability 15 15619 g006
Figure 7. Changes of the storage parameters with the overall efficiency, including tank size, overflow ratio, and detention time, under a fixed demand fraction D/Q = 0.56.
Sustainability 15 15619 g007
Figure 8. Thirty-year averages of the overall efficiency (white diamonds, scale on left axis) for a tank size of 120 m3 (as in Figure 5a, excluding short sample values) and changes in required tank size over time (scale on right axis) to ensure an overall efficiency of 0.48, using both the overall progressively longer time series (dark grey circles) and the thirty-year moving average (light grey triangles) of daily rainfall. The linear trend of the latter time series is indicated by the black solid line, the grey horizontal dashed lines indicate the ±30% range around the reference tank size, and the black dot dashed line represents the target efficiency value.
Sustainability 15 15619 g008
Table 1. Basic statistics of the entire time series (1833–2022) and the subperiod 1833–1992 with the lowest trend in the series (0.006 mm y−1) after removal of the outlier.
PeriodDuration
(Years)
Mean
(mm)
Std. dev.
(mm)
CV
(-)
Max
(mm)
Std Variate
Max (-)
Min
(mm)
Std Variate
Min (-)
Trend
(mm y−1)
1833–20221891240.4304.30.2452174.43.07469.4−2.53−1.080
1833–19921591279.3280.30.2192174.43.19543.4−2.620.006
Table 2. Linear trend parameters of the adopted performance indicators for the investigated RWH system over the entire simulation period.
ETOTYT/Sτ/τ*
Intercept (-)1.0281.4155.6283.265
Slope (‰)−0.23−0.17−0.25−1.01
Disclaimer/Publisher’s Note: The statements, opinions and data contained in all publications are solely those of the individual author(s) and contributor(s) and not of MDPI and/or the editor(s). MDPI and/or the editor(s) disclaim responsibility for any injury to people or property resulting from any ideas, methods, instructions or products referred to in the content.

