1. Introduction
The agricultural sector of South Africa carries the historical legacy of apartheid, which contributed to the country’s dualistic agricultural landscape. As documented by Greyling and Vink [
1], entrenched dualism can be traced back to apartheid-era land confiscations. Although this dualism has perpetuated inequality in the sector, the land reform programme was designed to facilitate transformation [
2]. The primary intervention of the land reform programme is the provision of land to establish black commercial farmers. The government identifies commercial land, acquires it, and leases it to previously disadvantaged aspiring black farmers through the Proactive Land Acquisition Strategy programme (PLAS), the current strategy for implementing the redistributive land reform program.
Despite efforts to address inequalities in South Africa’s agrarian sector via redistributive land reform and various government support programmes, criticisms persist, including concerns about land market distortions, delayed progress, and a lack of transformative impact [
1,
2]. Budgetary constraints and institutional capacity limitations have added to the complexity of implementing the land reform programme [
3]. These complexities render the PLAS programme ineffective in addressing the dual nature of agriculture in South Africa and promoting inclusive development. The emergence of agricultural digitalisation, which involves the incorporation of contemporary digital solutions into agriculture [
4] presents a promising opportunity to advance inclusive development in the South African agricultural sector. South African farmers participating in PLAS have access to various digital value chain options, which they can customise to meet the specific needs of their agricultural operations. Furthermore, these digital solutions possess a synergistic quality that enables farmers to utilise multiple applications, thereby facilitating their integration of value chains [
5]. The technologies relevant for digitalisation in the value chain include mobile applications, online digital platforms, and blockchain technology for online commerce and the tracking of agricultural products. For example, HelloChoice is a prominent South African online marketplace that connects sellers and consumers of fresh produce. Nevertheless, there are no studies that have investigated the behavioural factors that affect the adoption intention of PLAS farms in the Eastern Cape Province of South Africa.
Literature has investigated the topic of PLAS from various perspectives, including factors associated with the success of redistributed land reform farms [
6], beneficiary selection procedures [
7], and the determination of viable land sizes to improve performance on redistributed land reform farms [
8]. Some studies have attempted to estimate the impact of digitalisation on performance metrics such as financial performance, productivity, and profitability [
9,
10]. The parameters to be considered when devising an agricultural digitalisation policy and the implications for the land reform programme have also been analysed [
5]. However, there is a significant gap in the existing literature regarding the PLAS farmers’ adoption intentions for various value chain technologies in the Eastern Cape, as well as the behavioural factors associated with their adoption intentions. Consequently, this study sought to investigate the role of digitalisation and the adoption of value chain digital technologies in advancing these objectives while also examining the factors influencing a higher adoption rate of these technologies.
Therefore, understanding various digital solutions available for agriculture, their associated costs, infrastructure requirements, and technical demands is crucial, as these factors can significantly impact farmers’ intentions to implement digital solutions for the value chain. This is important for upstream high-tech firms, as their efforts to develop digital agricultural solutions can be matched with farmers’ needs. The absence of scientific evidence regarding the behavioural factors influencing farmers’ intentions to implement such technologies may lead to the development of digital agricultural solutions that do not meet farmers’ requirements. Behavioural factors include what farmers perceive with regards to the performance, infrastructure requirements, social influence, and effort required to use a particular technology [
11]. Farmers have shown limited enthusiasm for most digital agricultural solutions due to a top-down development strategy that frequently disregards their needs [
12].
The Eastern Cape Province is mostly rural and one of the major producers of livestock in South Africa. Poor development of digitalisation among Eastern Cape farmers, particularly PLAS farmers, could lead to the digital divide. Consequently, it is critical to understand how digital technologies in the value chain could assist PLAS farmers in becoming integrated into their respective industry value chains, thereby enhancing their resilience and sustainability. Moreover, it is important to provide valuable insights into how behavioural factors and the identification of behavioural factors that affect farmers’ intentions to adopt value chain digitalisation are crucial for promoting inclusive digital development and effective in mitigating the digital divide within South Africa’s dual agricultural sector. This will ultimately lead to the sector’s long-term sustainability.
The Eastern Cape region predominantly comprises rural inhabitants; a significant portion of them reside in the old homelands that were designated for black individuals during the apartheid period. These areas are known for their dependence on subsistence and small-scale agricultural practices [
7]. The demographic makeup of the province may be a contributing factor to the restricted advancements in digitalisation within the agricultural sector. This phenomenon can be attributed to the fact that the PLAS programme predominantly recruits participants from the pre-existing population of local farmers. Although the government provides support for PLAS farms [
6], the difficulties encountered by small-scale farmers in the area may have an impact on the performance of PLAS farms, as already evidenced by below-average productivity.
The aim of the study is to determine the behavioural factors that affect the adoption intention of value chain digitalisation by Eastern Cape PLAS farmers. It investigates the way in which the adoption and utilisation of value chain digital technologies are impacted by the perceptions of proactive land acquisition strategy (PLAS) farmers with regards to infrastructure, effort, performance, and social influence. The study begins by reviewing related literature on the concept of digitalisation, a perspective on the digitalisation of the South African agricultural sector, available options for PLAS farmers, and the drivers of value chain digital technologies. The next sections present empirical evidence the methods and procedures for sampling and data collection, as well as the data analysis techniques. The results and discussion follow. Then, the conclusion is presented last.
2. Review of Agricultural Digitalisation Literature
This section summarises empirical evidence of the adoption of digitalisation and its impact on agriculture to provide context and to establish relationships between key concepts and methodologies. Due to the nascence of agricultural digitalisation literature, the scope of this review is international and does not confine itself to agricultural businesses but rather encompasses all businesses. However, to provide context, grey literature on digitalisation strategies in the South African agricultural sector is discussed.
Building on the previous section’s definition of digitalisation, this section discusses the similarities and differences between precision agriculture and digitalisation. Second, empirical evidence will be discussed regarding the factors influencing the adoption of digitalisation in agriculture. Finally, the value chain dimensions of digitalisation as well as how agricultural digitalisation ensures long-term sustainability in the agricultural sector of South Africa will be discussed.
2.1. The Concept of Agricultural Digitalisation
The fourth industrial revolution affects all sectors of the economy, including agriculture. This has led to increasing agricultural digitalisation (which is also called agriculture 4.0 or A 4.0) in farms. According to Szalavetz [
12], agricultural digitalisation refers to “the infusion of digital technologies in and the consequent transformation of agricultural pre-production, production, production-related support, and post-production activities.” There are several technologies that enable agricultural digitalisation and application domains within agriculture that have been identified in the literature [
4]. The agricultural digitalisation technologies are the internet of things, data analytics, artificial intelligence and machine learning, image processing, cloud computing–cyber physical systems, unmanned aerial vehicles, geographic information systems, communication technologies, robotics and automation as well as augmented and virtual reality [
4,
13,
14,
15]. Moreover, the relevancy and applicability of these technologies across agricultural-specific domains have also been identified, including but not limited to crop, soil, pest, irrigation, and water management [
4,
14]. Value chain application domains include storage, logistics, yield, and market demand forecasting, as well as digital marketplaces [
4,
13,
14].
Digitalisation has historically occurred in three stages. The first wave of digitalisation entails the technical digitisation of analogue content and services without fundamentally altering the industry structure. Digitalisation’s initial wave makes no major modifications to the tightly connected layer of product architectures. According to Yoo et al. [
16], in the second wave of digitalisation, the decoupling of previously tightly tied devices (networks, services, and content) occurs. Digital content and services may now be delivered over a general-purpose IP network and software-enabled devices, resulting in convergence at numerous levels, including network, device, and market. As a result, established divisions between product categories and industries are continually moving. For example, voice service totally becomes device- and network-independent, with the same level of quality offered regardless of whether the customer is using a fixed-line phone, a desktop computer, or a mobile phone. Similarly, other media services such as music, books, e-mail, and movies can be supplied via a variety of different network types and devices.
The third wave of emerging technologies is distinct from the previous waves. A new fusion of diverse sorts of digital breakthroughs in recent waves of digitalisation is increasingly being witnessed. Likewise, physical and repetitive jobs are being enhanced using rich digital traces and intelligent digitalised tools. In principle, comprehensive digitalisation can incorporate all seven features of digital materiality into every action, behaviour, and activity performed in human daily lives. Digital traces of physical acts, events, and movements in the physical, social, and virtual worlds may be kept, recorded, monitored, analysed, and reprocessed at an unfathomable scale and rate [
16].
The process of digitalisation can be easily illustrated using Bukht and Heeks’s [
17] three-scope approach to the digital economy. The first scope is the digital (IT/ICT sector), comprising hardware manufacture, information services, software, IT consulting, and telecommunications (
Figure 1). ICTs have brought tremendous transformation to the agricultural sector. Evidence of ICT utilisation and impact in agriculture is widely documented [
18,
19,
20]. The ownership of computers, cellphones, etc. is used to measure ICT adoption in these studies. Despite extensive literature on the digital economy, the subtle distinction between ICT, digitisation and digitalisation has not been emphasised. In agriculture, the separate phases of the digital economy remain poorly understood. The second scope is the digital economy, which is based on offering digital services as well as increasing the use of sharing and platform economies. The third and last scope of the digital economy is the digitalised economy, where the technologies of the fourth industrial revolution are integrated within businesses to transform business models. Thus, this three-scope approach distinguishes between the IT/ICT sector, the digital economy, and digitalised economy.
Digitalisation in agriculture has enabled the introduction of new agricultural digital solutions such as mobile applications, blockchain, the internet of things, drones, and big data into a set of existing precision agricultural technologies (PAT). Adoption of precision agriculture has been on the rise [
11]. The economic effect of digitalisation on agriculture is still being debated, but its potential to enhance innovation or create new business opportunities is certain.
Although evidence on the digitalisation of farm processes is still scant, empirical literature on the perspective of IT-enabled organisational capabilities is well established. The IT sector has been around and has been a major focus in literature during the second and third industrial revolutions. The perspectives on IT-enabled organisational capabilities suggest that organisational/process capabilities are a critical mechanism through which IT assists enterprises in creating business value. Organisational learning, knowledge management, talent management, new product development, business agility, and a proactive environment are just a few examples of these intermediate/process (dynamic and operational) organisational competencies. In the literature on the commercial value of IT, this perspective has emerged as the main framework for theoretically and empirically resolving the IT productivity dilemma [
10,
21,
22]. However, questions about the business value of digitalisation remain. Evidence, although still scanty, on digitalisation adoption and impact has emerged.
2.2. Precision Agriculture and Digitalisation
In the agricultural digital solutions adoption literature, Michels et al. [
23] have referred to certain agricultural digital solutions such as drones as recent inventions added to PAT. Nevertheless, agricultural digitalisation includes PAT, which makes the digitalisation context broader than precision agriculture (
Figure 1). Digitalisation in agriculture focuses on the transformative nature of agricultural digital solutions. Agricultural digital solutions are rendered infrastructural under digitalisation and have the potential to optimise the operational, financial, and marketing decisions of farmers. While adoption of PAT has been skewed towards developed and large-scale commercial farms [
24], widespread adoption of agricultural digital solutions is expected even in remote areas of low-income countries because of the rapid expansion of aggrotech.
2.3. Drivers of Digitalisation Adoption
Empirical literature on the drivers of the digitalisation of agriculture takes many different directions. The first one deals with the factors that predict the adoption of agricultural digital solutions. Performance expectancy, effort expectancy, social influence, and facilitating conditions are behavioural factors that are likely to predict adoption of agricultural digital solutions, with exogenous variables such as age, gender, etc. more likely to play a mediating role. Several empirical studies have shown a positive correlation between the intention to adopt digital agricultural solutions and performance expectancy [
11,
24,
25]. There are mixed results on the role that facilitating conditions play in predicting the intention to adopt. While Michels et al. [
11] argued that facilitating conditions are only relevant for determining actual adoption, Molina-Maturano et al. [
24] found the intention to adopt agricultural apps to be strongly associated with facilitating conditions in Mexico.
Although no significant relationship has been found between effort expectancy and the intention to adopt an agricultural app in Mexico [
24], effort expectancy is considered a good indication of the user-friendliness of a particular technology. It is therefore argued to be a strong predictor of the intention to adopt agricultural digital technologies. As these studies are both based on farmers’ perceptions, Mexican farmers may perceive overcoming constraints associated with learning digital solutions as important as opposed to German and Chinese farmers, who may enjoy the dynamic capability associated with their advanced economies. Michels et al. [
11] reported a positive relationship between smartphone crop protection app adoption and social influence (i.e., the extent to which certain individuals influence the adoption belief of the farmer). Similarly, Sun et al. [
25] found that social influence significantly affects adoption of the internet of things in China. Although Molina-Maturano et al. [
24] did not confirm the positive effect of social influence in Mexico, farmers’ social networks are important for the adoption of new technologies. Digital solutions such as agricultural apps are still in development and pilot phases in Mexico [
24], suggesting the poor role played by farmer networks in predicting adoption.
Other studies that have considered the role that farm and farmer characteristics, besides behavioural factors, play in determining adoption have focused on factors influencing actual use. Michels et al. [
23] revealed farm size, age, and literacy on PAT to be the factors that affect the actual adoption of drones by German large-scale farmers. Farmers’ age, farm size, knowledge about specific crop protection apps, potential for crop protection, and potential for reducing negative environmental effects have been identified as significant predictors of willingness to pay for crop protection apps in Germany [
26]. The evidence produced in these studies is inconclusive and varies by context. They demonstrated that while some factors are significant determinants of digitalisation in some regions, they are insignificant in others. Moreover, the evidence produced is only related to the adoption of one dimension of digitalisation, namely the adoption of agricultural digital solutions. Thus, the need for further research is justified, particularly in the context of South Africa.
The most commonly used framework to study digitalisation adoption is the unified theory of acceptance and use of technology (UTAUT) framework. It was developed after an extensive review of eight theoretical frameworks of behavioural adoption and has been cited as the most comprehensive framework [
27]. The basic UTAUT framework considers four constructs: performance expectancy, effort expectancy, facilitating conditions, and social influence [
27]. With reference to agricultural smartphone apps for crop protection, Michels et al. [
11] used the basic UTAUT framework to assess the factors influencing behavioural intention adoption. Extensions of the basic model with additional constructs exist. The mastery approach, goal orientation approach, trust, and personal innovativeness are the additional constructs considered in the investigation of factors affecting agricultural app adoption intention in Mexico [
24]. Exogenous variables are normally included as moderating variables in the model.
Another model that has also been used to understand technology acceptance is the trans-theoretical model of adoption (TTMA). Unlike UTAUT, adoption is viewed as a gradual process under TTMA. In Michels et al. [
23], the idea of considering adoption as binary is abandoned, and a measure that accounts for more than two stages of adoption is considered. With the exception of Mikhail et al. [
9], who estimated the impact of digitalisation on the financial performance of the agro-industrial complex in Russia, the focus in agricultural digitalisation literature has been on the adoption of specific agricultural digital solutions. There are notable attempts to determine the impact of digitalisation in other fields.
2.4. Perspective on the Digitalisation of the South African Agricultural Sector and Available Options for PLAS Farmers
Agricultural digital solutions applications are dependent on the nature of the job that must be performed. Moreover, their synergistic nature accommodates several applications by farmers promoting value chain integration. With different contributions from various agricultural digital solutions, value chain digitalisation in the South African agricultural sector takes several dimensions, including supply chain optimisation and unlocking finance opportunities.
2.4.1. Access to Markets
Participation by smallholder farmers in global supply chains is often difficult in Africa due to associated high participation costs and low productivity levels. Through initiatives that provide farmers with essential services and market access, unlocking and optimising the supply chain solves the problem of exclusion. The combination of AI-powered platforms with physical warehouses and logistical infrastructure by companies enables cost-cutting and expansion of operations by the producers through supply chain optimisation [
28].
Increased consumer demand for the traceability of products has been associated with digital technologies that improve the transparency of the value chain. Blockchain technology for the tracking of agricultural produce allows farmers to access essential accounting information. Moreover, verification of providers’ regulatory compliance is possible through cloud computing technologies. E-commerce offers direct market linkages between the farmer and end-consumers, offering farmers value-proposition opportunities and the exclusion of exploitative intermediaries.
2.4.2. Unlocking Opportunities for Finance
There are several ways in which various government institutions and private commercial banks try to provide funding to South African farmers, particularly smallholder farmers who continue to face start-up or expansion financial constraints. While commercial banks have also attempted to use agricultural data collected by aggrotech companies to provide finance to farmers, a large proportion of farmers remain unbanked in South Africa. Fintech companies are beginning to take advantage of digital technologies such as mobile money to offer unbanked farmers solutions that are related to finance. Crowd farming is one of these solutions and has enabled farmers to access the necessary working capital from people who cannot farm while also giving them an opportunity to own tangible assets such as cows through crowdfunding. Pay-outs are also calculated by the insurance companies based on the satellite information on crops and weather, and this reduces information asymmetries and risk.
2.4.3. Agricultural Digitalisation and Land Reform Sustainability
Technology adoption has always been one of the ways to achieve agricultural sustainability. Particularly, farmers’ adoption of sustainable agricultural technology is espoused in the literature. For example, Hatzenbuehler and Peña-Lévano [
29] have examined a range of sustainability-focused technologies that are applicable to smallholder farmers in the Global South, emphasising their potential to enhance food availability and stability. Dash et al. specifically emphasise the contribution of the most important technologies, renewable energy and ICT, in achieving sustainable farming practices. In Indonesia, the adoption of sustainable rice farming practices has been associated with positive contributions to farmers’ livelihoods and perceptions of change [
30]. Thus, literature widely advocates for the adoption of technology to promote sustainable farming practices. In addition, the type of technology that is adopted is important. Hence, literature has also emphasised how the advent of fourth industrial technologies and their adoption would help foster agricultural value chain sustainability.
Various studies have contended that the implementation of the fourth industrial revolution would facilitate efficient and effective value chain processes leading to economic, environmental, and social sustainability. Arvanitis and Symeonaki [
31] have underscored the significance of interdisciplinary collaboration and the implementation of cutting-edge technologies to facilitate agricultural production and value chain management, thereby promoting sustainable farm management. The significance of digital transformation in agriculture, encompassing data analysis and process automation, in fostering economic, environmental, and social sustainability in supply chains is underscored in Hrustek [
32]. Yahya and Yahya [
33] have emphasised the advantages of Agriculture 4.0, including cost reduction and increased yields. However, there are difficulties associated with implementing these technologies to ensure the long-term viability of crop production. In China, the low adoption rate of sustainable agricultural technologies has been attributed to small-scale production and insufficient market demand [
34].
Digitalisation of the value chain can assist the South African agricultural sector in achieving long-term sustainability by mitigating the sector’s pervasive inequality. The extensive disparities present in the South African agricultural sector have been extensively documented, often stemming from historical land dispossession during the apartheid era [
1]. Efforts to address these inequalities through land redistribution reforms and programmes supporting smallholder farmers in South Africa have yielded limited success [
1,
2]. The enduring disparity in South Africa’s agricultural industry may lead to uneven implementation of digital technology. The existing disparity in the agricultural sector of South Africa has the potential to impede the achievement of the advantages linked to the digitisation of agriculture. However, the implementation of advanced digital technologies to modernise farms would support the long-term viability of land reform. The land reform programme offers an opportunity to address the potential digital divide within South Africa’s agricultural sector [
5].
The redistributive land reform programme can be used to digitally transform South African agriculture. However, the main objective of the land reform programme in South Africa is to address the issue of inequality within the agricultural sector. It is not widely seen as a strategy for facilitating the digital transformation of the agricultural sector in the country. Mazwane et al. [
5] contend that by integrating digital transformation goals into the redistributive land reform policy, it is possible to simultaneously address sectoral inequalities while enhancing efficiency and revitalizing struggling redistributed farms, thereby ensuring long-term agriculture sector sustainability.
Therefore, rising from the historical land dispossession during the apartheid era, attempts to rectify these disparities through land redistribution have yielded limited results. The introduction of advanced digital technologies provides an avenue for the modernisation of farms and the bridging of these gaps, thereby lending support to the enduring viability of land reform in South Africa. By incorporating digital transformation objectives into the redistributive land reform policy, it becomes possible to tackle sector-specific inequalities while simultaneously boosting efficiency and rejuvenating redistributed farms. This, in turn, ensures the long-term sustainability of the agricultural sector. Nevertheless, it is important to consider the adoption intentions of farmers and the influencing behavioural factors thereof.
3. Materials and Methods
A cross-sectional research design was adopted. This means that the time dimension was overlooked in favour of relying on existential differences among farms. Thus, semi-structured questionnaires were used to collect data on farms sampled using multistage and simple random sampling techniques. The list of all active farmers in the selected local municipalities was obtained from the Department of Agriculture, Land Reform, and Rural Development (DALRRD). With respect to ethical considerations that govern the data collection process and results reporting, ethical aspects such as informed consent, respect for dignity, voluntary participation, and confidentiality were adhered to.
3.1. Determination of Sample Size
Several approaches for calculating a sample size exist. The Cochran’s approach was chosen and applied for calculating the desired sample size:
where
n is the required sample size,
p is the percentage of occurrence of a state or condition,
is the percentage of maximum error required, and
is the value that corresponds to the required confidence level.
The adoption of the Proactive Land Acquisition Strategy (PLAS) in 2005–2006 brought about the most important change in land acquisition in South Africa since 1994 [
2]. There are about 2000 PLAS land reform farms. The suitable sample size (100) was chosen based on the projected number of PLAS farms, the maximum error (5%), the assumed percentage of digitalisation occurrence on PLAS farms (50%), and a 1.96 z-score equivalent to a 95 percent confidence level. The target population consists of all the PLAS land reform beneficiaries. The unit of analysis is the farm. PLAS land reform beneficiaries are spread throughout the country, and the implementation of the simple random sampling technique would be costly and time-consuming [
35]. However, to ensure that a representative sample was obtained, the Eastern Cape Province was sampled purposefully. The Eastern Cape is a rural province. Not all the districts’ local municipalities in the province have the same number of redistributed farms. Thus, stratified random sampling, applied to ensure a representative sample, was drawn from the districts’ local municipalities. Consequently, a total of 100 PLAS farms under the local municipalities were sampled and a semi-structured questionnaire was administered.
3.2. Data Collection Instrument and Method
The survey was conducted electronically, telephonically, and through farm visitations. Farmers were contacted first using the list obtained from the Department of Agriculture, Land Reform, and Rural Development (DALRRD) as well as local departments of agriculture and rural development (In instances where contact information for farmers was out-of-date, the database was supplemented with data obtained from local departments) and requested to indicate their preferred choice of completing the survey. Farmers from the following local district municipalities were recruited: Alfed Nzo, Amathole, Buffalo City, Chris Hani, Joe Gqabi, and Sarah Baartman District Municipalities. Farmers with active email addresses and who had indicated email as the preferred choice of contact were requested to complete the questionnaire that was shared via email with frequent reminders. Those farmers who indicated a telephone/phone interview as their preferred choice were contacted at the indicated times, while visitations, with strict adherence to COVID-19 regulations, were paid to farmers who preferred that method. The survey was conducted from January 2023 to February 2023 (which is just after the planting season and before the harvesting season), when farmers were not too busy.
3.3. Data Measures
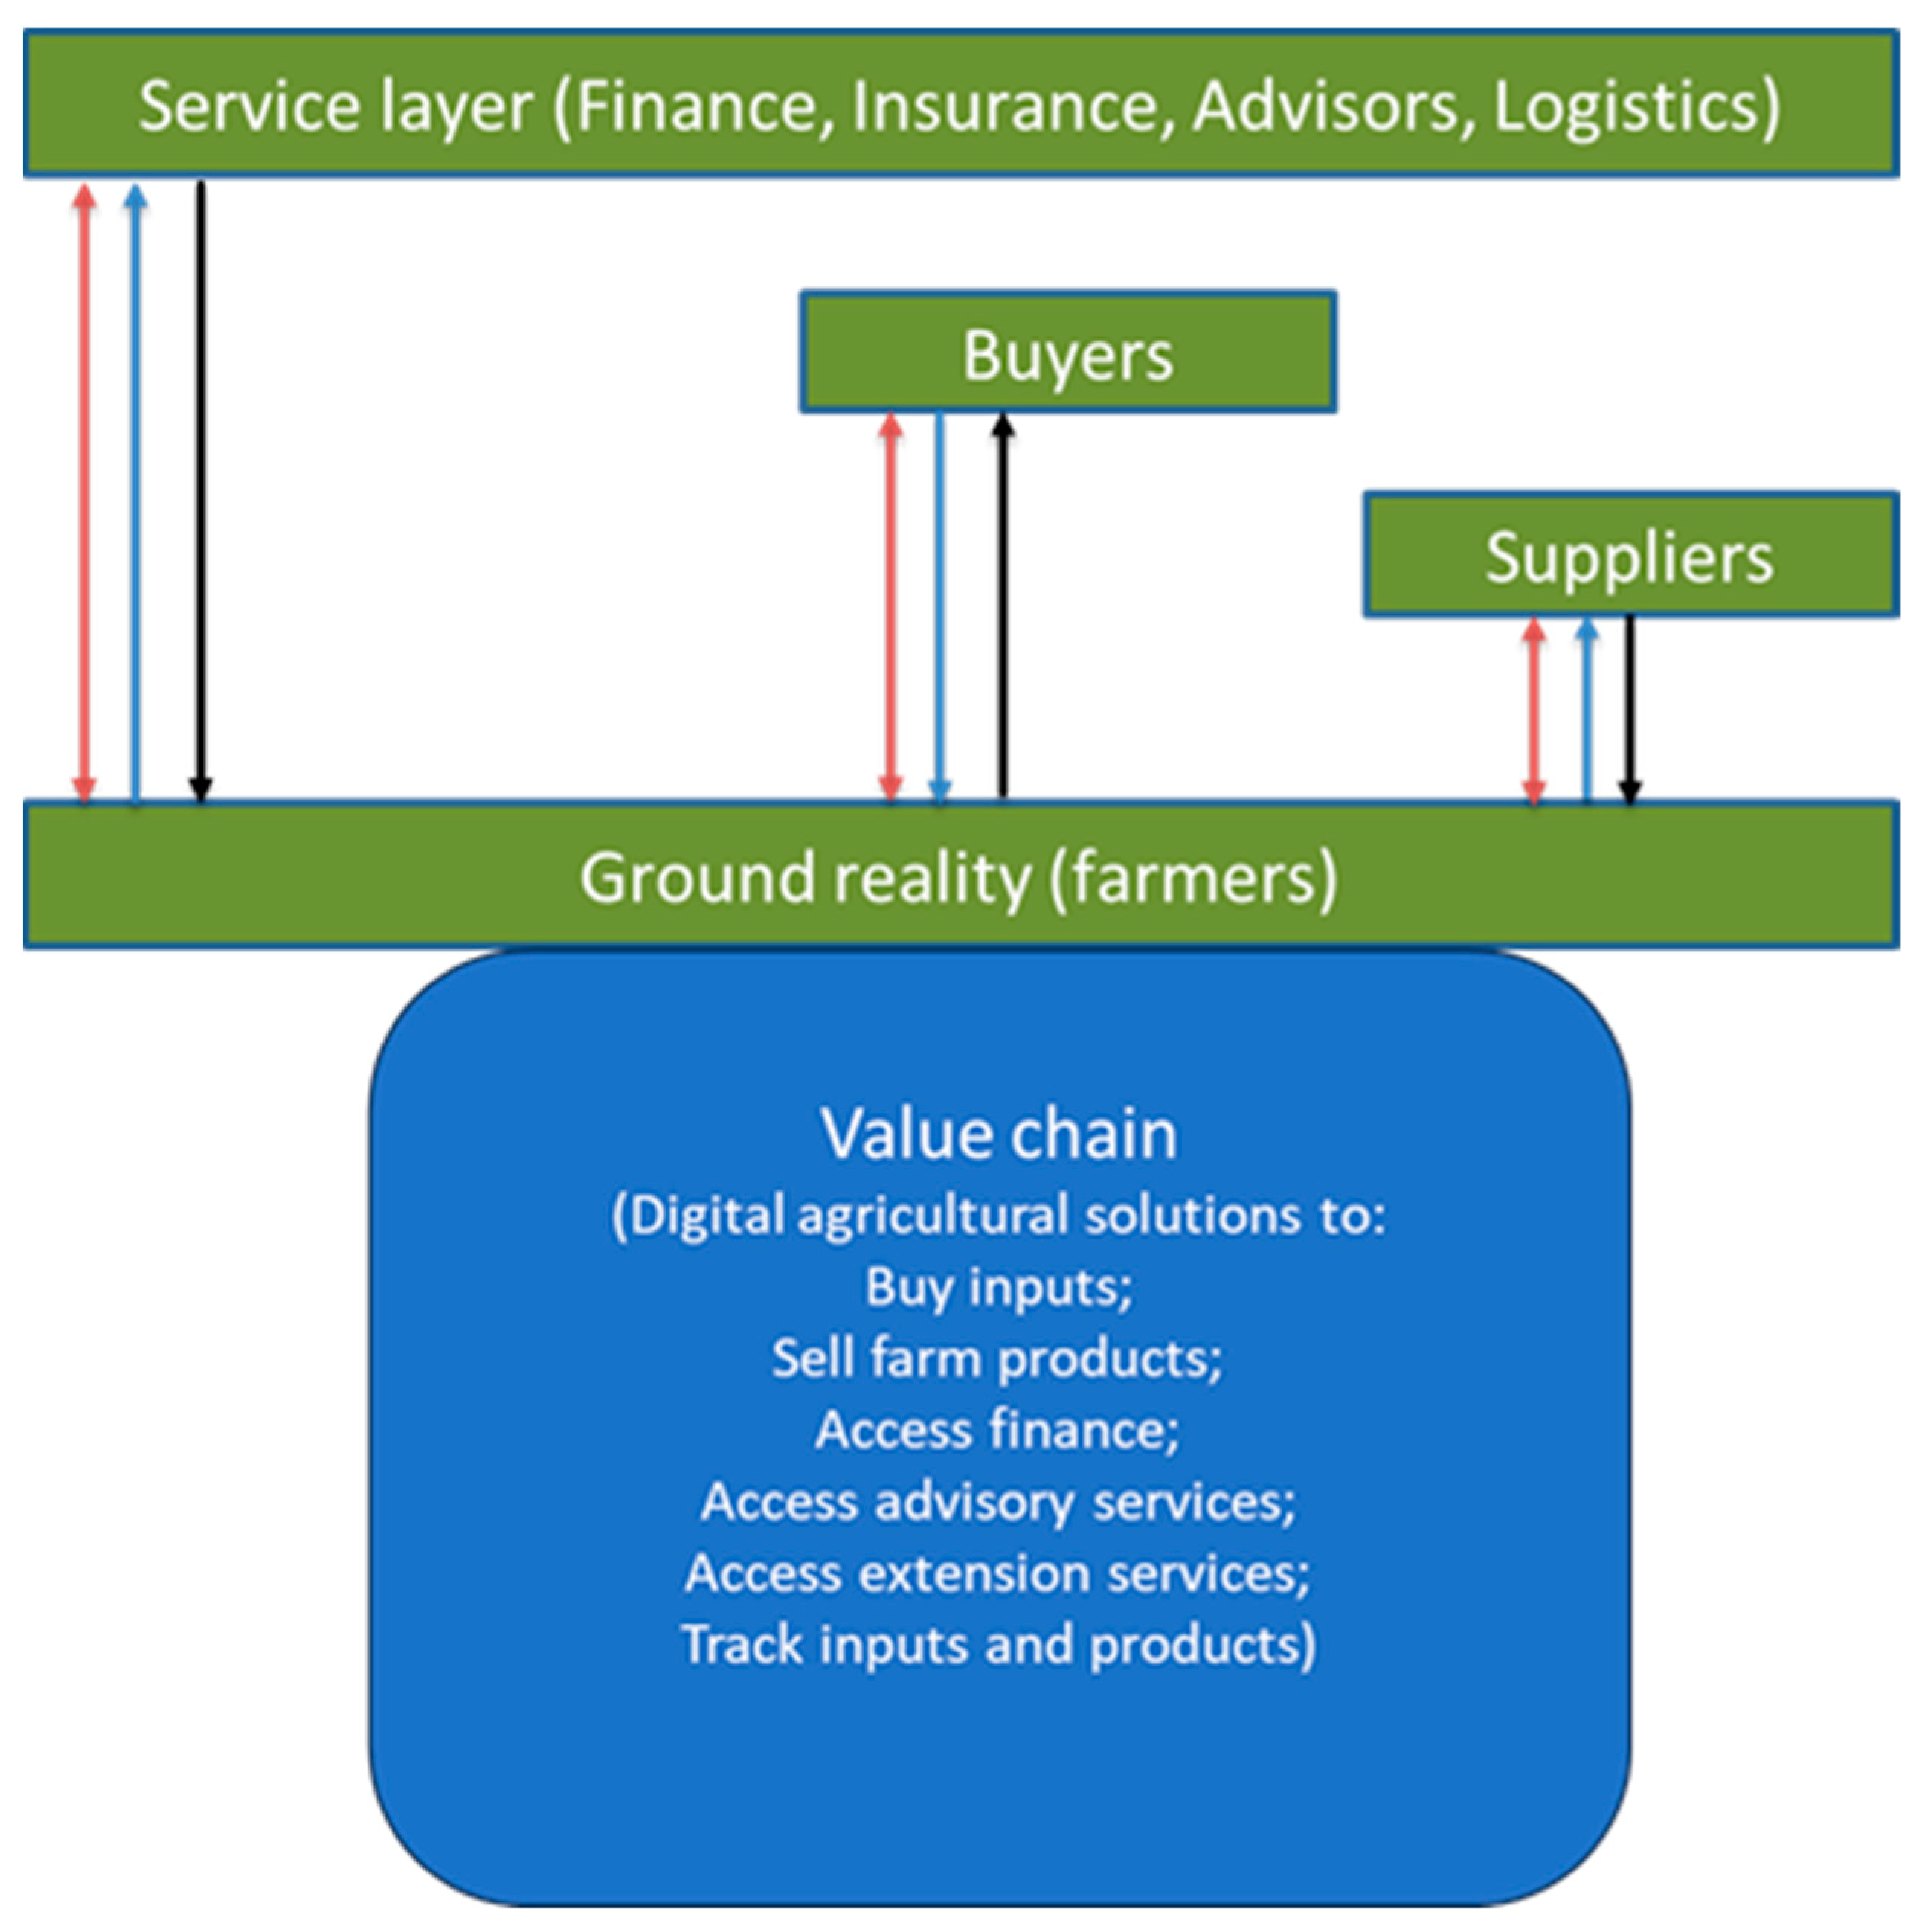
The concept of farm digitalisation was defined in the literature so that it could be correctly measured. It refers to the use of digital technologies in operating a farm enterprise for the improvement of its value. The items for the value chain dimension that Yu et al. [
36] employed to measure enterprise digitalisation were adapted to assess value chain digitalisation and adoption intention of PLAS farmers (see
Appendix A). Farmers’ perceptions about the value chain dimension of digitalisation were assessed in four areas: usefulness, ease of use, social influence, facilitating conditions, and intention to adopt. A Likert scale method was used to develop items with a 5-level scoring method (one indicates “strongly disagree” and five indicates “strongly agree”).
In the context of the current investigation, the term “digital technology” was used to refer to any technology that operates in the digital domain, irrespective of its specific application or use. It functions as an umbrella category for all technologies employing digital components. In contrast, “value chain digital technologies” referred specifically to digital technologies used within the agricultural value chain to carry out the functions enumerated in
Appendix C. These are application domains of digitalisation within the value chain. In essence, value chain digital technologies are a subset of digital technologies (including smart technologies) that optimise and enhance various domains of the value chain, such as data analytics, communication technologies, digital sensors, the internet of things (IoT), and digital marketplaces [
4,
13,
15,
37].
To aid farmers in comprehending and operationalising the concept of digitalisation of the value chain, a comprehensive picture was presented that detailed how these digital technologies are implemented across the various domains of the value chain. The purpose of this visual aid was to assist farmers in comprehending the practical implications and benefits of integrating digital technologies at various phases of agricultural production and distribution. Subsequently, farmers were questioned about their perceptions regarding the adoption of value chain digitalisation, building on their comprehension of digital technology applications within the agricultural value chain as depicted in a visual representation.
3.4. Data Analysis and Method of Estimation
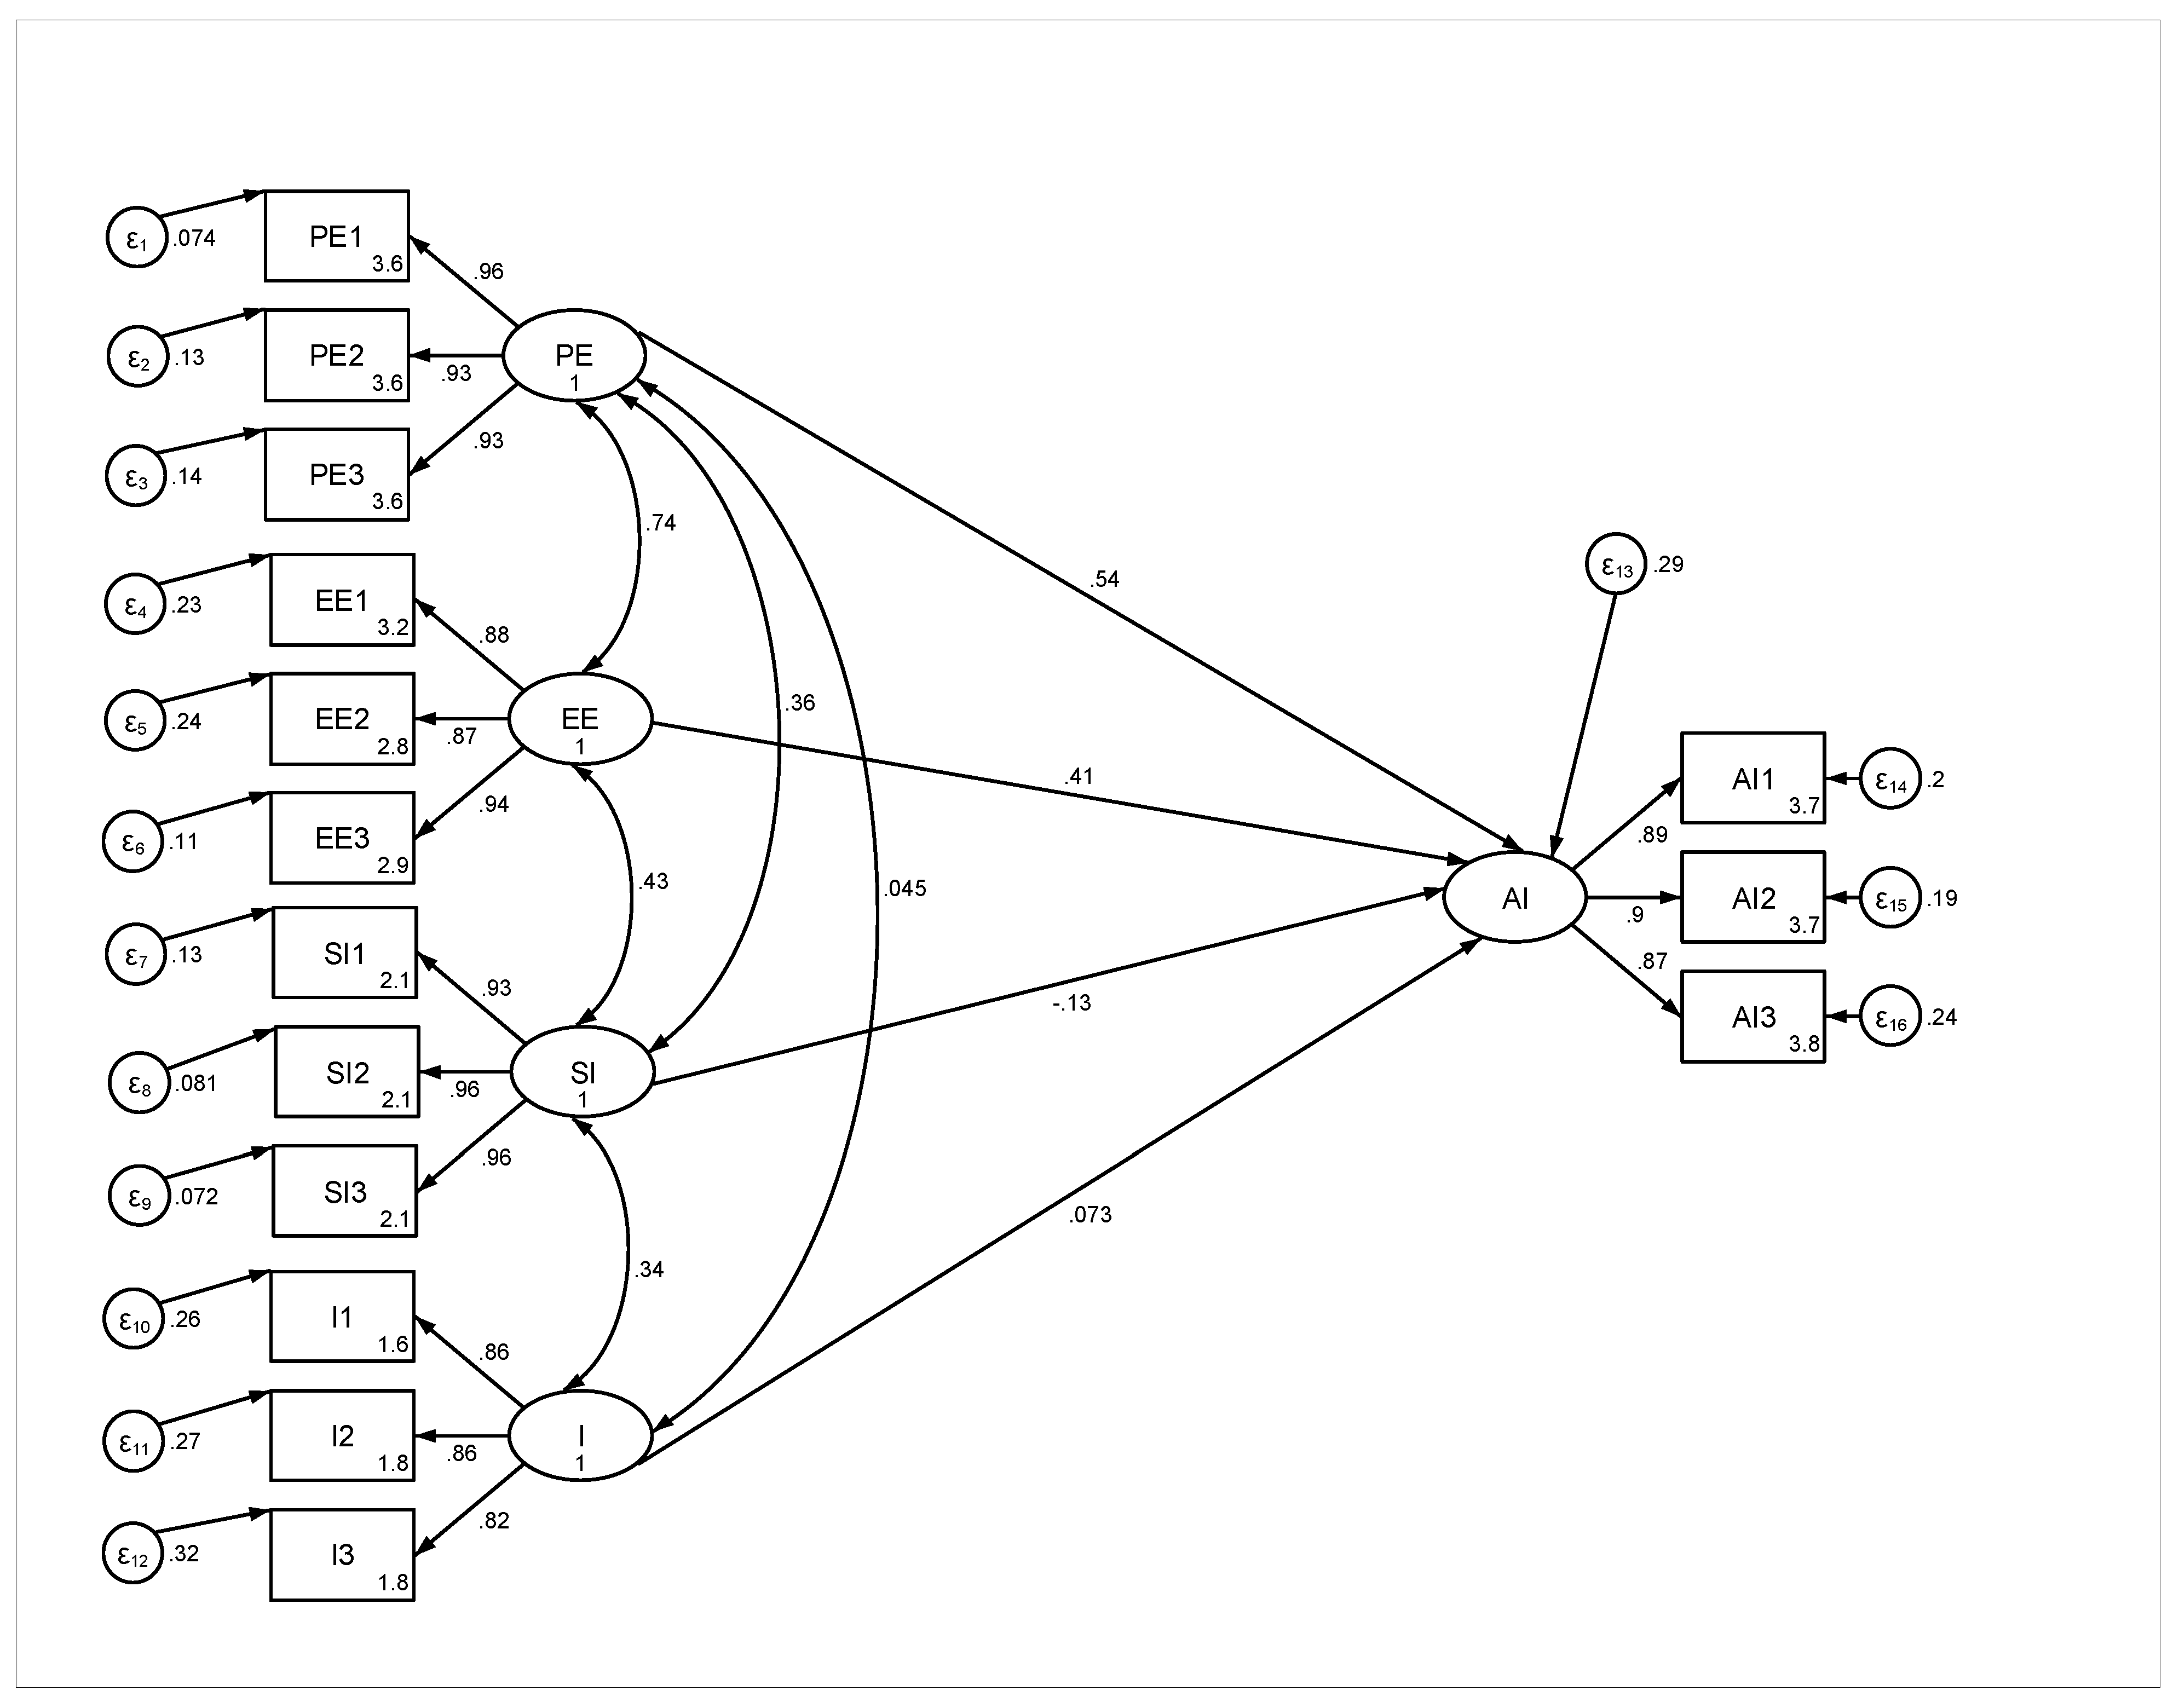
Statistical analyses were performed using the lavaan R and SeminR packages and STAT 14. Demographic data were first analysed using descriptive statistics. Then, structural equation modelling (SEM) was conducted to test the models presented in
Figure 2. A structural equation model is a set of statistical models that seek to explain the relationships between multiple variables; it was used because it allows the simultaneous analysis of all relationships, combining multiple regression with factor analysis, while allowing for both observed and latent variables to be analysed together [
24]. Reflective measurement items were derived from prior research [
11,
23] and adapted to create five constructs: performance expectation, effort expectation, social influence, infrastructure, and adoption intent. As depicted in
Figure 2, the assessment of performance expectancy (PE) relied on items labelled PE1 through PE3, while effort expectancy (EE) was measured by EE1 through EE3. SI1 to SI3 and I1 to I3 were used, correspondingly, to evaluate social influence (SI) and infrastructure. In addition, the adoption intention (AI) of producers was measured using items AI1 through AI3 (also shown in
Figure 2).
Appendix A contains detailed explanations for each of these measurement elements.
There is a lack of a prescribed optimal number of items for measuring a construct in the existing literature. Thus, a set of three items for each construct were used to reduce respondent fatigue and keep questionnaires brief. In addition, Schubert [
38] argues that removing one observed variable from reflective measurement models does not alter the construct because these observed variables serve as reflections of the construct itself, not vice versa. STATA allows simultaneous estimation of the structural equation model and confirmatory factor analysis (CFA) using a maximum likelihood estimation. This allows both the evaluation of the reliability and validity of the measurement model and the path analysis of the structural model estimates to test the significance of our hypotheses and the predictive items of the proposed model to be conducted together.
4. Results and Discussion
The descriptive statistics results are shown in
Table 1. This includes the important demographic and economic variables of PLAS farmers (see
Appendix B for detailed description and measurement type of each variable). The typical Eastern Cape PLAS farms are generally middle-aged, with an average age of 55 years and a standard deviation of 11 years. This is not surprising, as the average farmer’s experience in years was 20 years, with a standard deviation of about 12 years. The land reform programme normally selects experienced, emerging black farmers as beneficiaries. This indicates a low probability of selecting a younger farmer. The typical PLAS farmer is educated with an average of 12 years of schooling, which is equivalent to South African matriculation. While the number of years of completed schooling averaged five years with a standard deviation of three years, the family size was large at five people per family. PLAS land reform programme beneficiaries are black South Africans, and African families normally have larger families. Average income and land were R511, 808 and 801 hectares, respectively. The standard deviations were very large: 1051 hectares for land size and R761, 401 for income. This suggested the presence of outliers in both variables. Signal strength in PLAS farms was moderate and averaged at 3 with a standard deviation of 1.5.
Construct reliability and validity were assessed before inclusion in the path model (
Table 2). Cronbach’s alpha was used to test for the reliability of the factors. Cronbach’s alpha coefficient is the most common tool for assessing the internal consistency and reliability of factors [
24]. The Cronbach’s alpha coefficients for all the factors (PE, EE, SI, and I) were above the recommended threshold (>0.70). This showed that the scale was reliable, consistent, and stable, and that construct reliability was met. To check if the scale is valid, a Keyser-Meyer-Olkin (KMO) sampling adequacy test and a Bartlett test of sphericity were done. A KMO value of 0.857 and a Bartlett test of sphericity of 1429.937 were obtained from all the indicator variables, indicating the strong validity of the scale. This meant that factor analysis could be performed on the data. This is in line with the findings of Sun et al. [
25], who obtained a KMO value of 0.807 and a Bartlett test of sphericity of 2025.270.
4.1. Model Evaluation
The Chi-square, Root Mean Square Error of Approximation (RMSEA), Comparative Fit Index (CFI), Non-Normed Fit Index (NNFI), Tucker–Lewis Index (TLI), and Standardised Residual Mean Square (SRMR) were used to assess the model fit. The model is acceptable, although some of the results suggest otherwise (
Table 3). The CFI and TLI are within the recommended ranges. The structural equation modelling technique is a large sample technique (≥100). A sample size of 100 was used to estimate the SEM, and this could be the reason for some of the criteria values falling outside the recommended ranges.
Thus, the first fit of the measurement model that included all the items of the constructs was acceptable, as indicated by the CFI and TLI indices of 0.929 and 0.912, respectively.
The factor loadings for all items were greater than the threshold value of 0.7, confirming the good indicator reliability of the instrument (
Table 2). No items needed to be dropped due to low factor loading. The average variance extracted (AVE) was used to test the convergence validity, and all the constructs had an AVE greater than the minimum acceptable value of 0.5, confirming that the convergence validity criterion was met. Thus, the reflectively measured constructs demonstrated reliability and validity and were included in the path model.
4.2. Path Analysis Results
The results of the structural equation modelling are shown in
Figure 3. The standardised factor loadings for all the items are greater than the recommended range of 0.7. This shows the good contributions of all items in explaining the respective factors. After assessing the measurement model, the structural model (path analysis) was assessed. The overall model fit for the structural model was good (
Table 3). The values for the indices CMIN/DF, CFI, TLI, RNI, SRMR, RMSEA, and AGFI were nearly the same as the measurement model. The path analysis showed that adoption attention is significantly affected by performance expectancy (PE) and effort expectancy (EE) (
Table 4). The relationship between adoption intention, performance expectancy, and effort expectancy is positive. This means that the intention to adopt value chain digital technologies increases because farmers believe that these technologies will perform well.
The revealed positive relationship between performance expectancy and adoption intention of value chain digital technologies is in line with existing literature on other digital technologies [
39,
40]. The importance of performance expectancy has been revealed in agricultural studies on decision-support tools, mobile-based communication technologies for agricultural information [
41], and SMS agricultural advice. Similarly, high effort expectations are associated with high adoption intentions. The effect of effort expectancy implies that farmers find the effort required to use the value chain digitalisation technologies important in their intention to adopt them. Thus, training may be necessary for farmers to effectively use value chain digitalisation technologies. Although farmers may accept challenges, they may be unfamiliar with the digital platforms, technologies, and apps used for purchasing farm inputs and selling farm products. This finding is inconsistent with that of Molina-Maturano et al. [
24], who discovered that effort expectancy is not important when using agricultural mobile applications. The discrepancy may be because cell phones are widely available, whereas the opposite is true for digital platforms that are used for the purchase and sale of agricultural products.
The relationship between adoption intention and other constructs (social influence and facilitating conditions) was insignificant. This is an indication of poor awareness and digital infrastructure in farming and rural communities. Friends and acquaintances have no influence on the intention to adopt. Although Sun et al. [
25] found contrasting results, this is consistent with the findings of Molina-Maturano et al. [
24]. The intervention of government through educational awareness programmes and digital infrastructure has been underscored in digitalisation literature [
5,
42]. The average signal strength for the sample of PLAS farms in the Eastern Cape is 3. This is an indication of poor connection, and digital platforms rely on internet connections. Mabaya and Porciello [
43] note high data costs as an indication of poor development of fibre infrastructure.
The sample consisted of 22% of female farmers and 78% of male farmers. This may be indicative of the agricultural landscape in South Africa. While the results are only relevant to the specific sample under investigation, they may raise concern about the gender composition of land reform farms and South Africa’s agricultural population. Multigroup analysis was also examined for gender. A multigroup analysis was conducted to investigate potential gender differences in behavioural factors and to determine whether gender influences farmers’ perceptions of value chain digitalisation. The multigroup analysis results are presented in
Table 5. Performance expectancy was only significant for male farmers (
Table 5). This indicates that male farmers will only adopt value chain technologies if they believe that they are effective. Thus, demonstrations of the effectiveness of value chain technologies may be required for male farmers. However, female farmers do not believe that performance is important for the adoption of value chain technologies. This means that females may not need proof of the performance of a particular technology.
With regards to effort expectancy, although both groups of farmers regard effort expectancy as important for the adoption of value chain digital technologies, it is more important for male farmers. This is an indication that increased adoption will be observed in a situation where farmers feel that value chain digitalisation technologies are easy to operate. This may increase the ability of this group of farmers to learn new technologies that are important for their farming operations. Social influence has a negative relationship with adoption intention. It is also less important for male farmers. This is an indication of poor interactions, as males are normally less social compared to females. Facilitating conditions are also more important for male farmers compared to female farmers (
Table 5). This is an indication of having the infrastructure and knowledge to utilise value chain technologies and could be an early signal of the digital divide, which has been a concern in the digitalisation literature.
5. Conclusions
A series of value chain disruptions necessitates the use and expansion of value chain technologies. Digitalisation is required for the establishment of resilient and, ultimately, substantiable value chains in the Republic of South Africa. Nonetheless, farmers’ willingness to adopt value chain technologies is influenced by their social environment, beliefs, and the nature of technology. Most farmers are unwilling to adopt value chain technologies, while others show little interest. This necessitated the identification and categorisation of behavioural factors influencing PLAS land reform farmers’ willingness to adopt value chain technologies, which increase the resilience of agri-food value chains in the face of disruptions.
PLAS land reform farmers in the Eastern Cape are more likely to adopt value chain technologies. Therefore, performance expectancy and effort expectancy are the influencing behavioural factors. Moreover, the availability of digital technology infrastructure increases the adoption intentions of male farmers. Higher adoption intentions imply greater value chain flexibility. The flexibility of the value chain is critical to the value chain’s resilience. Increased information exchanges through value chain technologies such as mobile applications and trading platforms for farm inputs and products increase transparency and collaborations with the value chain, allowing farmers to better prepare for, adapt to, and adjust to value chain shocks.
Furthermore, as consumers become more involved in the value chain, the level of adoption intention demonstrated by farmers is critical for the establishment of sustainability principles. The more actors involved in the value chain, the more positively the value chain will respond to greener operations. Long-term customer and supplier relationships are critical for the development and achievement of social and environmental goals. Thus, agricultural production can be sustained through value chain technologies, as real-time data collection improves operational efficiency across the entire life cycle (planning, production, manufacturing, distribution, and consumption).
The confluence of technology adoption and land reform, with a particular focus on digital transformation, presents a promising route to attaining sustainable agriculture in South Africa and other areas grappling with comparable challenges. This approach not only addresses historical inequities but also positions the agricultural sector for enduring sustainability and prosperity.


 ,
, 


