Article

A Review of Current Evaluation Urban Sustainability Indicator Frameworks and a Proposal for Improvement

Next Generation Cities Institute, University Concordia, Montreal, QC H3H 2L9, Canada
*
Author to whom correspondence should be addressed.
Sustainability 2023, 15(21), 15425; https://doi.org/10.3390/su152115425
Submission received: 12 August 2023 / Revised: 3 October 2023 / Accepted: 12 October 2023 / Published: 30 October 2023
(This article belongs to the Topic Sustainable Smart Cities and Smart Villages, 2nd Volume)

Abstract

:
This paper addresses the link between data, metrics, and the paths from cause to effect in urban sustainability and livability frameworks. The first section thoroughly discusses the different existing frameworks for evaluating sustainability and livability goals for urban communities. In the results section, a qualitative and quantitative analysis of a comprehensive list of frameworks that evaluate sustainability and livability in cities is elaborated, with a thorough post-process of the different schemes from an epistemological perspective to analyze the subjectivities implicit in any urban-level sustainability framework. Finally, in the discussion section, two main aspects are tackled. The first is the development of a proposal for a set of indicators that incorporates the best of the different frameworks analyzed. The second aspect deals with the methodology of implementation of these frameworks. Here, the authors point out the weaknesses of current urban-level sustainability frameworks and their main components, and they propose a set of criteria to overcome the different detected gaps. All these steps have helped the authors establish a clear roadmap for developing the platform TOOLS4Cities that can help set a future reference methodology for urban sustainability evaluation.

1. Introduction

Defining the metrics, evaluation criteria, and main principles for digital twins and urban energy models (UBEMs) is vital for improving sustainability and livability in communities. The complexity of their goals requires clear definitions of the tools needed, and the document aims to establish the link between data, metrics, and the cause-and-effect paths in UBEM tools. The goal is to describe the most representative criteria for assessing the status of sustainability and livability in communities and neighborhoods [1] and the creation of indicators to be able to create good roadmaps for the necessary changes that will come in the following years, as well as the grounds of how an improved digital twin set of tools should be used. We clearly understand our goals and methodology but must define the appropriate metrics and evaluation criteria. How can we measure if we have achieved our objectives? Which datasets should we use to reach these goals? How can we address data gaps? Additionally, we need to develop new scenarios and test them in our digital twins. To tackle these issues, the authors of this article examine the most significant sustainability and livability frameworks (Section 2) and propose a methodology to analyze them (Section 3). The authors analyze different frameworks for evaluating sustainability and livability goals for urban communities in Section 4. They categorize these frameworks according to their epistemological perspective. In Section 5, they propose a set of integrated indicators that capture the most important criteria from the previously analyzed references. In the last subsection, they address the weaknesses of the current approaches and propose solutions to these gaps. They developed a robust methodology that will be the foundation of the NGCI Virtual Twin Community toolset called TOOLS4Cities.

2. Literature Review

The authors evaluated several recent articles compiling and listing the different frameworks for sustainability and livability [2,3,4,5,6] and performed a critical analysis of the list of the frameworks and each of their indicators.

2.1. General Concepts

Since the Bruntland report, the definition of sustainable development agreed upon by a general sector of society is the one that “meets the needs of the present without compromising the ability of future generations to meet their own needs” [7]. Sustainable development is based on three essential pillars: economics, environment, and society. This is a departure from previous development views, where economics was the only driver of human progress. Today, indicators of sustainable development revolve around these three pillars. The frameworks developed in recent years reflect this approach and focus on these three aspects. However, some frameworks emphasize economics and the environment, while others prioritize societal aspects and well-being. In this article, the authors have analyzed these different frameworks and their weights, dividing them between those with a strict focus on sustainability and those with a more social direction. However, it is important to outline that new perspectives start to consider that the sustainable development perspective is not ambitious enough for the crisis situation we are living in and opt for new conceptual concepts, such as degrowth [8] or regenerative development [9].

2.2. General Measurement-Evaluation Concepts

Developing a certification framework involves three major steps. The first step is the evaluation of the sustainability aspect of urban development. To achieve this, it is essential to create a Key Performance Indicator (KPI) structure that can assess the current status of sustainability. This evaluation process helps to understand the different types of frameworks and their levels of detail and orientation. Once these KPIs are established, we can opt for developing a standard (like ISO 37120:2018 [10] in the case of standards for cities) or establishing a classification and, afterward, a certification system [11,12]. Some frameworks only evaluate sustainability while others certify it.
A wide range of frameworks related to environmental sustainability have been developed in the last few years [2]. However, each of them focuses on different scales (building, neighborhood, community, city) and different scopes of analysis, creating interesting intersection areas that could be exploited, integrated, and developed. Moreover, as mentioned, the concept of sustainability goes beyond the environmental aspect, and some new schemes delving more into social and well-being aspects have appeared recently. Those last schemes try to understand livability concepts, seeking to utilize environmental resources for better living of urban dwellers [13]. In Section 2.3, we concentrated our efforts on understanding more environmental-based frameworks, whilst Section 2.4 deals with livability schemes.

2.3. Current Situation of Environmental-Based Sustainability Evaluation Frameworks for Cities-Communities

Over the past few years, UN-HABITAT has made significant progress in developing the SDG for cities methodologies, which has improved the way the sustainability of cities is evaluated. At the same time, the International Standards Organisation’s Technical Committee ISO/TC 268, which is responsible for Sustainable Cities and Communities, has established a set of indicators for sustainable cities and communities [10]. In the last 20 years, several evaluation, classification, certification frameworks, and newly developed standards have tried to tackle capturing the environmental, social, and economic aspects of sustainability in cities. Table 1 show the list of most relevant frameworks, as filtered by the criteria described in Section 3.

2.4. General Frameworks for Cities Focused on Livability Perspectives
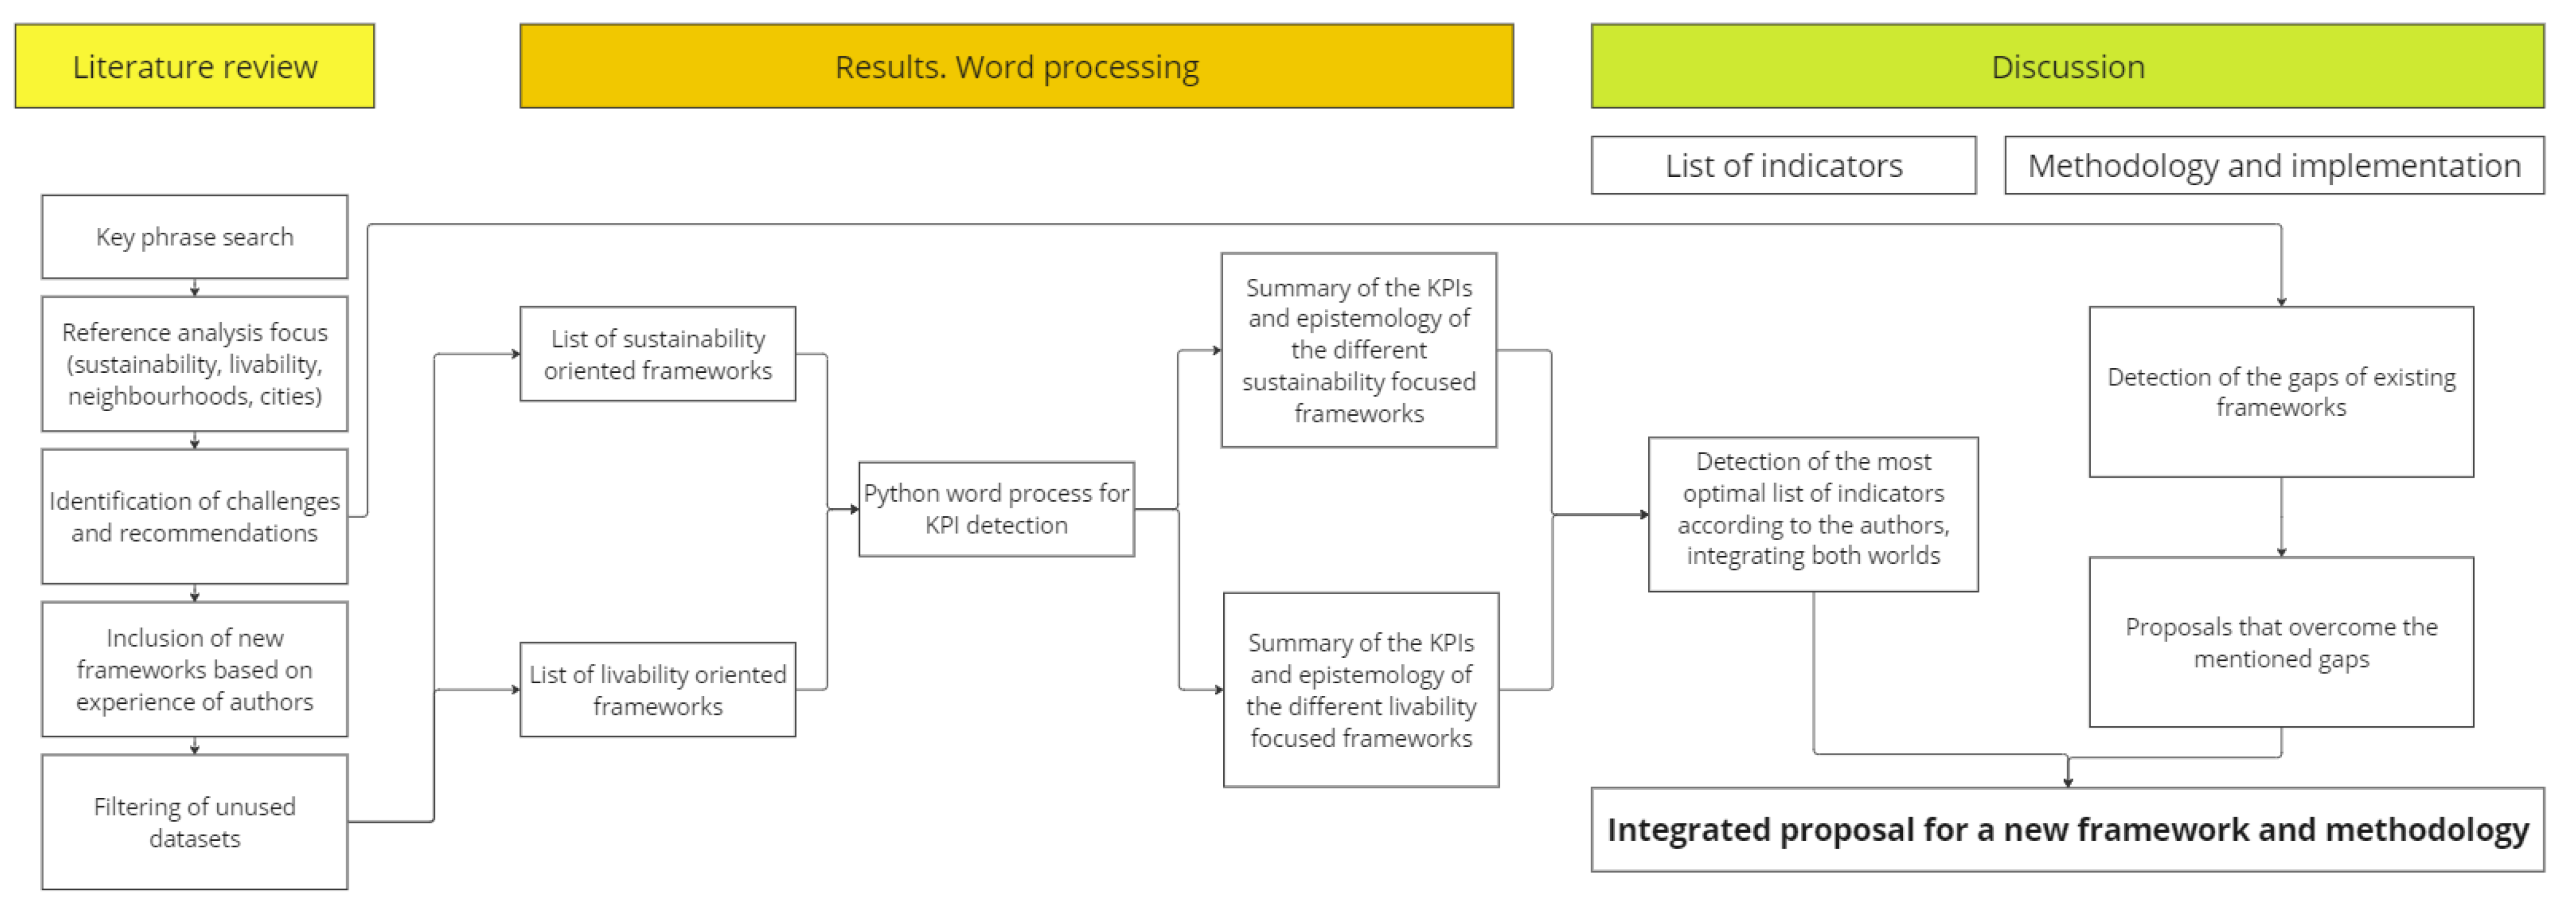
The concept of sustainability has been criticized for being too limited, as it fails to address livability, health, well-being, and happiness. In addition, with the current climate trends, cities must not only sustain their current situation but also regenerate it. This is where regenerative cities come in, as they offer reasonable solutions to help cities become agents of change. However, it is important to establish clear indicators for these cities. Radical approaches have emerged as a more effective solution than the standard sustainability approaches, as they identify the weak points of current models. The document “The shared ingredients for a well-being economy” [14] presents some of the most innovative frameworks to incorporate more livability aspects to the previous list of indicators, which have been listed in Table 2. The scale is not always the urban scale, but the relationship with livability in cities is so close that we include these sets of frameworks in the analysis.

3. Method

The method for the article follows the scheme in Figure 1. The literature review part followed the guidelines from [5,15], where a three-step was followed to pinpoint the most interesting articles that had to be processed. Key phrase search, followed by reference analysis to focus on the framework application and identification of challenges and recommendations. The authors of this study have utilized their extensive experience in the sector to introduce new frameworks, especially in the infrastructure segment. To begin with, a list of frameworks was compiled. The first step involved filtering out frameworks that were not maintained and lacked updated references. From the remaining selection, a web scraping procedure was carried out. This was followed by a word-processing step to capture the main indicators used in the shortlisted frameworks. This process was made more efficient by using Python3.9 and several libraries, such as beautifulsoup, pandas, and wordcloud. Once the complete list of indicators per framework had been captured, several procedures were implemented, as described in Section 4, to compare the frameworks and group them based on similarities. Clustering and word frequency comparison were the primary tools used. Clustering is a technique used to group elements that are similar to each other and dissimilar to others via unsupervised learning methods [16]. In the second subsection of Section 4, the authors focus on the methodologies needed to implement frameworks to develop greener and more sustainable cities. They evaluate the main weaknesses of current methodologies based on their long experience in the sector and identify gaps in different areas of knowledge that frameworks require. These gaps range from data capture to interpreting the processed data and its impact on necessary actions to solve current emergencies. In the second half of Section 4.2, the authors propose solutions to overcome each of these gaps.

4. Results

4.1. Diagnostic of the Sustainability Indicator Frameworks

A preliminary analysis has been carried out to examine various indicators. The analysis involved studying the recurrence of specific words in the definitions of these indicators. Moreover, a word analysis of the titles of the KPIs was also performed. Any words that did not appear at least three times across the different frameworks were removed. As displayed in Figure 2, the findings indicate that the term “Climate Change” appears significantly more frequently than any other combination. However, the results show a strong interdependence between the type of certification and its focus. For example, the word “economy” is a significant factor in ISO, NEOM, SDG, City Resilience Index, and business-related certifications, while it is less significant in others. Furthermore, environmental parameters are the foundation of all these certifications, yet each certification places greater emphasis on different parameters, such as water management, air quality, transportation, or land management. Therefore, it is essential to establish better cooperation between the various frameworks to cover all the necessary criteria without requiring multiple individual frameworks.

4.2. Epistemological Analysis of Frameworks Focused on Sustainable Development

After the initial analysis, we needed a more quantitative approach to determine the priorities of each framework. This was necessary because most frameworks assign different weights to each parameter. To accomplish this, we evaluated the details of each framework to determine the qualitative impact of Figure 2. To conduct this analysis, we assigned each indicator to one of the five general fields of evaluation used in the SDG for cities framework. We used SDG for cities as a baseline because it provided a balanced approach to different parameters. Using the same word capture and comparison methodology, we divided the frameworks’ concepts and importance into different parameters based on the baseline. The result is shown in Table 3 As a first conclusion for this group of frameworks, even if they are essentially oriented on environmental aspects, we see that most of them are focused on environmental and societal aspects. Economy and governance appear in a second group of important factors in some of them, and culture has lesser importance in most of the frameworks. Once this first quantitative analysis was done, we grouped the different frameworks in different clusters, depending on their affinity. Using the elbow (k) method [17], we found a k equal to 3, grouping the frameworks between three big groups, as seen in Figure 3. Most private certifications (except for DGNB and BREEAM) fall into the first group, with indicators with a clearer social and environmental alignment (Green Cities Index, Green Capital Award). A second small group joining the SDG for cities, the Global Cities Indicator Facility and DGNB seem to be the most equilibrate between the parameters considered on the baseline certification. On the last branch, the ISOs, urban audits, and BREEAM, amongst others, seem to be quite close to the equilibrium but with a stronger emphasis on social, environmental, and economic aspects.
In the case of frameworks relating to livability, the same word processing has been implemented. The resulting word frequency can be seen in Figure 4. It shows that although some of the words are similar to Figure 2 (sustainability, environmental), the focus here is put on the perspective of the well-being of the final citizens. Concepts such as democracy, community, equality, and health have a strong influence on the development of these indicators, while they do not appear practically in the more environmental-based frameworks mentioned in Section 2.4. Those frameworks still have a lower level of development than the more established references, but their goal is less to be complete and cover all the different areas of sustainability than to push the most holistic perspectives to add some essential indicators that incorporate well-being criteria as indicators.

5. Discussion

5.1. Proposal for a Set of KPIs for Sustainability and Livability

From the authors’ perspective, all those frameworks represent a good starting point to cope with the most critical indicators to consider, and we propose using part of its indicators, but they all present weaknesses, given their static approach to reality. The proposal of the authors is to couple the KPIs proposed by ISO 37120:2018 with the Thriving Places Index frameworks, substituting the economy-related KPIs from the former with the human-centered vision of the latter and incorporating indicators from own experience and other more environmental-based sources (EPA [18] and nine planet boundaries [19]). This can be seen in the list from Table 4, which will be the basis for creating a new integrated framework.
However, indicators are not the sole problems related to frameworks. The current frameworks present important structural deficiencies regarding the capture and process of data to be able to bring them into action. Therefore, in Section 5.2 and Section 5.3, the authors will discuss the gaps that arise in implementing current frameworks and the proposals to solve those gaps, so as to create a coherent framework, not only with the right indicators but also with the adequate methodologies to implement them.

5.2. Gaps in Current Methodologies for Evaluation of Sustainability and Livability

Gap 1 refers to the adequacy and completeness of actual data structure for city SDG evaluation. Data science has become one of the leading sectors of research environment development in recent years. The Data Life Cycle (DLC) concept [20], including a circular concept involving, amongst others, planning, collection, preservation, integration, analysis, publishing of data, and replanning, is essential for any measurement process. Its full development is valid for diagnostics on status quo and invariable situations. However, the actual moment is far from invariable, and the need to speed up changing processes significantly complicates data planning and the creation of indicators and requires continuous feedback loops and new methodologies to develop better data schemes. The main reason for this complexity is that we are dealing with a climate emergency that requires a drastic change. This brings the clash between continuously rethinking the measurement plan and establishing structures of data capture that are as stable as possible. In this field, getting good raw data is key for developing indicators that can lead our cities to reach, at least, the planned and compromised goals. Extensive studies [21] (in this case, for the US) have shown that, even for indicators as established as the SDGs, “only 19 percent of the 161 relevant UN indicators across the SDG framework are measurable in US cities or metros using existing national data sources”. Geospatial datasets are another essential aspect that needs to be addressed in cities, and they are far from homogeneous. As an example, in one of the first test cases from the OGC Testbed18 (http://www.opengis.net/doc/PER/T18-D012, (accessed on 27 June 2023)), located on Nun’s Island in Montréal, a team from the NGCI tried to process a small CityGML dataset initially perceived as clean and of high quality. Even in this case, though, important problems were found related to incoherences of ID assignation and Coordinate Reference Systems.
Gap 2 is indiscriminate data capture. The decision about capturing data has been more aligned with a problem of capture capacity in recent years than a genuine will to select the data. Quoting Debra Brass [22], many agents suffer from “Info-obesity.” Data saturation is a real problem that causes a need to work harder in processing, consume more resources, and not always reach the desired objectives. We capture data because we can, not because we need it. And that brings serious problems related to the need for more capacity to understand and process this data because it directly impacts our measuring indicator. More than ever, the Heisenberg principle appears here: the more data we capture to reduce energy consumption, the more energy consumption we cause [23]. One of the reasons for this indiscriminate data capture is the lack of data ontologies. In city-wide sustainability indicators, data hierarchies are necessary to understand dependencies between parameters and structure data accordingly. Capturing data indiscriminately without referencing the relationship between the building ID, the consumption associated with the building, and certain timestamps can create a need for a cumbersome data post-process that, in most cases, may seem an almost impossible effort.
Gaps 3 and 4 refer to the applicability of black box models for sustainability frameworks. Gap 3 is the ability of these models for data filling. The DLC concept mentioned in Gap 1 shows that gap-filling is critical in data postprocessing. We often get grouped data that hides very different aspects of one phenomenon. For example, electricity consumption hides the different types of use of this consumption (lighting, plug loads, heating, cooling, domestic hot water), and we need to be able to segment this data. Segmented data is only sometimes available, and models must be created to understand the implications of this data. Black box models use existing detailed data sets to extrapolate their structure to segment the unknown areas. However, this raises two vital issues. The first is how we decide that the enrichment we are using to create a model to segment this data is significant and for which reason. The second, which will also be applied to the next gap, is that using a static dataset embodying some user behavior for the continuous filling of a phenomenon that requires urgent action may implement a lag in interpreting results. If we use datasets developed when people were less environmentally conscious, we may give the wrong picture and cause things to move slower. Given the disruptive economic and behavioral changes, we cannot derive present-future scenarios from historical data alone.
Gap 4 is black box models’ adequacy for future scenario creation. Artificial Intelligence and its subset Machine Learning have been used in the last years to create urban platforms for planning and sustainability purposes [24]. However, as mentioned in Gap 3, we must assume those tools are only based on existing information. In that case, they cannot show the potential for societal change. We are sure they will soon incorporate more physical and representative models, but for now, they focus on understanding what happened in the past to project what will happen in the future. For the sustainability sector, this needs to be revised. As all the climate reports [25] show, the status quo will only lead us to the destruction of the ecosystems and an unbearable temperature increase. Scenario creation is based on the development of what-if situations. And those what-if situations can only be developed using more detailed physical models (either white box models or grey box models using the best of both worlds).
Gap 5 is the use of GHG-focused Metrics. Some of the ground-breaking reports that changed the vision around climate change, like [7,26], dealt with all the different aspects of the environmental hazards that need to be tackled in this century. However, a robust, unavoidable problem has recently attracted the most public attention. Climate change and its significant impact have focused most of the efforts of the communities and cities. Nevertheless, this significant effort in decarbonization and GHG reduction is pushing toward significant developments in implementing renewable energy and fossil fuel reduction strategies. Still, focusing on carbon emissions can make us forget other important indicators (biodiversity, rare materials scarcity …). This effect is called carbon tunnel vision. It tries to tackle the fact that addressing only one indicator can adversely affect others, like rare materials scarcity or biodiversity loss caused by certain large-scale renewable energy implementations. So, which are those aspects that we should consider, apart from Carbon emissions? A group of researchers came up in 2015 [19] with an epistemology of boundaries that more or less account for all the limits that the natural ecosystems work. Biosphere integrity, climate change, novel entities, stratospheric ozone depletion, atmospheric aerosol loading, ocean acidification, biogeochemical flows, freshwater use, and land-system change should not be forgotten in any environmental KPIs we are dealing with. Using dashboards and metrics only focused on decarbonization will prevent us from seeing the big picture of the problem.
Gap 6 is using metrics for all areas of reality. There is an essential tension between what is the territory and what is the map. Here, it deals with how to create constructs of the natural world and the relationships between them. And obviously, there is a substantial gap. As [27] points out, maths can explain almost everything if you restrict everything to what maths can define. That is valid for all sectors of reality. The question is, “Can we measure everything?”. Is the difference between the map and the territory only a matter of scientific development, and will we, at some point, reach this exactitude? In this line, we are firm defendants that to develop solutions in the decarbonization and sustainability sector, all the metrics in a neighborhood must be measured using the most coherent, complete, and universal methodologies. However, here, the difference between evaluation and metric appears. Is evaluation the same as metric? When we talk about metrics, we define the application of some measurement procedure that can be executed by different kinds of people in other locations. A metric is, by definition, exportable across societies and contexts. It is, therefore, trans-contextual. However, when measuring livability indices and different aspects, we realize that many social evaluation standards cannot be exportable, even between nearby neighborhoods or communities. Therefore, believing in the necessity of measuring is consistent with knowing that there are areas where the metrics such as we know them are not applicable. And we need to step up and find new methodologies.
Another important gap that we number as Gap 7 is the inability of compound indicators to capture everything. Compound indicators are powerful tools to be able to measure different concepts at the same time and allow the comparison between indicators. Some evaluation frameworks listed in Table 1, like LEED, ENVISION, BREEAM, and WELL, incorporate important epistemological evaluation criteria and give compound values integrating many aspects (environmental sustainability, economics, social aspects) to give a concrete number. This concrete number embodies lots of different calculations with strong weighting factors. If the framework developers have decided to give more importance to one aspect (economics) than another (environmental impact), the results of the framework can be quite skewed. For example, from the well-known and extended LEED methodology from the Green Building Council, the weight given to each parameter in an evaluation can bring significant differences between projects. In the case of LEED, using the concrete and clear example of energy consumption, several studies prove that although, on average, LEED-rated buildings are better than standard baseline buildings, at least a third of the conventional buildings did better than their conventional counterpart [28,29]. Even from a user’s well-being perspective, from [28]’s graphs, we can see that some LEED-certified buildings do worse in some aspects of user satisfaction than baseline conventional buildings.
This implies two significant issues: the importance of indicators and the epistemology associated with these indicators. In the first case, choosing the variables, most of which might have clear covariances between them, is an epistemological statement. If you include many variables dealing with one subject, you may give them excessive importance by repeating them and not considering the collinearity between them. Regarding the second, weighting is a decision. In the City Resilience Index framework, as an example, a doughnut diagram showing how a city behaves in different segments is plotted. This clearly states that each indicator is as important as the other. The same happens with metabolic analyses, a recent urban planning resource analysis trend. In this case, all the different areas of sustainability (i.e., water, waste, energy, emissions) are shown with the same degree of importance, and that might be true for some locations but not for others.
Gap 8 is a problem associated with static and siloed indicators. We mentioned that the indicators could have interdependencies, and the ethical choice of repeated indicators can quickly bring wrong conclusions. But, apart from that, it can lead to the need for more consideration of certain virtuous cycles or specific negative processes. This deals with system model levels versus micro or macro scale model levels. If we only analyze the data from a sectorial perspective, we can miss some hidden relationships between different parameters and act wrongly by focusing on only one parameter and ignoring its effects on the rest of them. An excellent example of this in the sustainability world is the lack of analysis of the impacts that certain policies in decarbonization can have on other sectors. For instance, the abundance of oil companies declaring themselves carbon neutral by offsetting their emissions ignores the side effects of oil on air pollution and health [30]. In one of the recent projects from the NGCI, as an example, related to “Spaces for Health and Aging in the City: Livability, Biodiversity, Decarbonization,” we discovered that plotting the indicators individually could bring the loss of perspective in some of the interesting cross-sectorial effects if the indicators were evaluated separately. One of the cross-sectorial effects was that creating community gardens around aging people facilities could bring a better quality of life while allowing adaptation and mitigation strategies to climate change, increasing biodiversity, and increasing the health of people in residence.
Gap 9 is the lack of global scope of certain frameworks when dealing with city-only indicators. Cities (and the neighborhoods and communities that shape them) are colossal resource consumers and, in most cases, substantially impact the surrounding spaces. If we only analyze the cities’ immediate surroundings and do not consider the necessary space required in other areas to produce the resources to be used in those cities, we are missing an essential part of the problem. The high-intensity requirements of most cities make them rely on external sources of energy, food, water, and waste management strategies. This has a potentially significant impact on non-urban communities. Any framework dealing with a city scale should be able to detect these interactions from inside to outside the city, detecting “hidden” relationships and strong dependencies between urban and non-urban communities and even geopolitical implications of some of the decisions made inside the city’s boundaries.
Gap 10 is the obtention of wrong conclusions from indicators. There is a substantial difference between metrics, evaluations, and shared values. We can confidently say that one scenario has less CO 2 consumption than the other, but we cannot conclude that this scenario is better. For example, designs of high urban densification can bring undesired effects to neighbors, reducing their livability indices and their impact and footprint. The reason is that different groups have different perceptions. However, the greatness of diversity is that each community/sector pursues different values, and we can evaluate the impact of each of them [31]. People will change their values when observing the results of drastically changing environmental situations. For example, the severe droughts from the last years and temperature increases have put climate change in the central point of the equation in the previous years. For instance, values aligned with climate change perception have continuously changed from 2013 to 2018 [32], with people being incrementally conscious of climate change. If we kept a very fixed relationship between indicators and relationships, we would not be able to capture the new values from society.
Gap 11 is the seduction of clarity in city sustainability and livability indicators. In science, we must be cautious to avoid the effect that the deployment of metrics and indicators is used to deploy political agendas [33]. This sense of having reached a perfect way to evaluate things, of a clear view of what is happening, is sometimes counterproductive because it gives us the signal to tell us we have thought enough. It is called hostile epistemology [27]. It includes the intentional efforts of stakeholders who want to manipulate the quantities and amounts of indicators to prove their theses or to justify their actions. The exact nature of the objectives we are working with (decarbonization) that require managing large and complex datasets and increasing accountability makes them more vulnerable to manipulation; therefore, intense care must be put into designing sustainability and livability measurement frameworks.

5.3. Proposal for a New Methodology to Analyze Cities and Communities

Several methodological proposals to overcome the different detected gaps have been developed. Each of them will counter one or several gaps detected in the previous section.
Proposal 1 counters Gap 1. The authors believe the fundamental criteria for good data management is the necessity for open digital infrastructures. With this objective, the NGCI has initiated an endeavor in Montréal to get all the researchers around climate change together to create an adequate structure to share data. This initiative, called Data Studio [34], has to guide the development of indicators and the deployment of a shared data environment. After the first development of a vision of the NGCI together with OpenNorth (https://opennorth.ca/, (accessed on 13 June 2023)) the main criteria for data management around cities and sustainability have been established:
  • Maintain an open digital infrastructure;
  • Data hosting function;
  • Ecosystem knowledge repository capacity;
  • General and initiative-specific collaborative governance framework;
  • Commitment to sharing knowledge and data;
  • Education and training opportunities;
  • Curated coordination amongst ecosystem and initiative partners;
  • Promote an innovation culture;
  • Community and public interest guardian.
To attain these objectives, it is crucial to start working with agreed methodologies and common standards. It is essential to follow the recommendations of international bodies to develop indicators for cities. For example, all geospatial data (and cities are examples of that) should promote OGC protocols. For the geospatial aspect mentioned in the gaps in current methodologies, in 2015, ref. [35] summarized applications that use 3D City Models from interactive visualization, urban planning, shadow, and viewshed analysis to urban analytics and simulation. These applications have very different requirements for the input data. For interactive visualization, it is sufficient to represent a building geometry by a set of non-overlapping polygons with no further constraints. In contrast, urban analytics and simulation usually include calculating building volumes. In this case, a solid geometry of the building is mandatory. These different requirements must be considered in the quality management of 3D City Models. CityGML is an XML format, so any CityGML document can be validated against the XSD schema. However, this does not include any geometry validation or can consider application-specific requirements. Therefore, maybe a first step out of the conclusions of the NGCI out of the experience with the Testbed 18 from the OGC, is that dealing with 3D models should be performed with a step-by-step methodology, and maybe CityGML is not the first step because of its complexity. A first suggestion, already implemented in the NGCI platform, is to use a step-by-step approach, beginning with the use of geojson-type files, with precise building functions, footprints, and building heights, as a first step towards something more complex.
Proposal 2 deals with the need for data-sharing structures and visualization tools. As previously mentioned in Gap 1, the datasets on buildings and their characteristics are incomplete worldwide. This reduces the capacity of sustainability indicators to share information and validate the usefulness and comparability of metrics along the different countries and urban areas. For this reason, an initiative was born in the Alan Turing Institute called Colouring Cities [36]. This initiative aims to provide twelve types of datasets at the building level. These datasets are permanently open databases “to be collaboratively maintained and enriched, by citizens, academia, government, industry, and the voluntary sector” [36]. The NGCI will lead the Montreal Colouring Cities Initiative, the first of its kind in a North American city, sharing all the necessary information and developing new indicators and datasets to be able to share with the Colouring Cities community. Besides the interesting aspect of sharing common data structures, Colouring Cities offers an exciting approach to metrics. In some cases, spatial metrics benefit much more from a visual than a number, as shown with the Walkability Index in Colouring Melbourne [37]. Visuals show the concentration of certain typologies of buildings, differences between neighborhoods, or even unevenness inside certain areas.
Proposal 3 is to implement good data planning and develop adequate metadata and data ontologies. As pointed out in Gap 2, every day, more data is captured, but at the same time, more interesting data is needed. The lack of coordination between different agents creates a massive amount of data that, because of its lack of trustworthiness or its incoherence and incompleteness, is not useful for creating indicators. Hence, data planning is crucial in capturing the correct indicators, no more, no less. Good development of the foreseen indicators, as proposed in the first section of this document, will limit the required datasets and focus on what is necessary as far as data is concerned. The temporality of datasets is also key and depends drastically on the final use case we give to the tools. For example, when dealing with static indicators that can help us analyze the sustainability of cities, datasets with a significantly reduced time step are not helpful and will imply extenuating computing times to be processed and stored. Therefore, capturing only the data necessary for our planned indicators (and for model calibration) is essential. Urban Energy Models with very rough calculations won’t use very small timesteps but can, on the other hand, benefit from very long historical datasets to detect trends and climate dependencies. On the other hand, if our goal is to use digital twins for transactive energy strategies, IoT elements, and Demand Response strategies, we need much more detailed datasets. Still, maybe they do not need to store long-term values. In the case of Montréal, the open data portal endeavor from the city, which is a good example, still has very different and overlapping sources of information, and key information is missing or contradictory. For example, data about the number of stories and households are not aligned with the census, which can create havoc when developing digital twins. However, the principles around which data is addressed in the portal (completeness, primacy, timeliness, ease of access, machine readability, non-discrimination, standards, licensing, permanence) seem adequate. Once a good data planning strategy is in place, creating commonly structured repositories, like CKAN, is a good example of how to incorporate metadata and sources of information. The NGCI, as an example, holds all the clean datasets in CKAN, with a clear description of the methodologies used to clean the sourced datasets. Last but not least (and maybe considered inside data planning), data ontology is the key to establishing the links between different datasets and avoiding extremely exhausting post-processing times. Structuring data according to certain ontologies is necessary for multiple data sources with timestamps and geospatially assigned to IDs. Developing ontologies such as SAREF [38] can help lay the grounds for a good data-capturing structure. After the first step of gathering and ingesting raw data that would be needed for any service, a necessary step of mapping and harmonizing data following some clear ontologies is necessary. This will establish a pipeline that can even help, in the future, deal with internal zones of the buildings and elements in the city and capture IOT elements with the necessary metadata and hierarchies between the values of the obtained datasets.
Proposal 4 is to create a good white and grey box modeling methodology. As explained in our critique of black box models in Gaps 3 and 4, using historical trends and statistical data to infer sustainability indices and indicators and develop future trends is similar to insisting on looking at a GPS that has driven us to a dead-end road. If we want to develop new ways to deal with a climate crisis, we need to go to the roots of the problem, which are the basic physics models of the phenomena we want to project into the future. Top-down models, statistical models, and even AI-based ones will only reply to what was once replied. Of course, we could create test benches and try new strategies in each of them, but it is an order of magnitude slower and more expensive than dealing with simulation models. This is why the vision of the NGCI incorporates the development of detailed simulation models to evaluate future impacts. How detailed? The devil is indeed in the details, and the level of detail of the simulations should be applied to the addressed scale. As a common say in simulation environments tells us, if you enter garbage into a simulation model, you obtain garbage as an output. Therefore, although we can worry about the model development, the detail in this model must be as thorough as the best trustworthy input in the model. For example, in the case of buildings, LOD4 simulation models incorporating detailed internal zones would imply a lot of work with more information to enrich the models at an urban level. A usual question is always about the methodology and tools to simulate cities. The Institute has taken an approach that is software-skeptical. The idea of the tools from the NGCI is to capture all the necessary information that any simulation tool would need and store them in city instances that, at the same time, contain buildings, networks, and generation systems, which are at the same time divided into subcomponents. This structure is prepared to export any input file to the most common building simulation tools (INSEL, Energyplus, TRNSYS, …) and is also evolving to feed and store the necessary data to and from transportation simulation tools (MATSim, SUMO, …). This data capturing and exporting structure has been developed under opensource criteria and is hosted in an open github (https://nextgenerations-cities.encs.concordia.ca/gitea/CERC/hub, (accessed on 2 May 2023)), and developed as a Python library to be able to be coupled with the development of other endeavors from the scientific community. This strategy is used to develop scenarios, establish their costs and benefits, engage multiple stakeholders, and create innovative toolsets to model communities, focusing on a zero-emission built environment and sustainable mobility.
Proposal 5 is to develop a combined development of tools that capture technical and social data. So, as mentioned in Gap 6, knowing that epistemology is complicated, what do we do? Do we stop digging, falling into the ambiguity paradox, and letting the main stakeholders in power (and especially those in control of media and communication) control storytelling and manipulate data? Science is necessary, and reducing ambiguity is one of the objectives of establishing indicators for sustainable cities and communities. So, the goal is to calculate the metrics that can be evaluated as accurately as possible and let the epistemology be incorporated later. One of the nicest methodologies to incorporate epistemology is through gaming. Serious gaming offers an excellent tool for citizens to understand the impacts of the different elements in decarbonization properly and give weight to the value people assign to each of the metrics and evaluation criteria that can happen in the framework of decarbonization in their cities. Though initially focused on developing computer games, engines such as the Unreal Engine and the Unity Engine have demonstrated the unique ability to visualize all the elements of a built environment in real time and with collaborative interaction. This is because such software products can turn urban digital twins into immersive 3D simulations that users can freely explore and understand from different perspectives [39]. In the last months, the team from the NGCI presented several urban development use cases demonstrating the use of 3D city models inside game engines and showed that such tools can be instrumental in developing applications using urban digital twins, for example, in public participation and planning processes, where it is essential to give the participants an understanding of the projects that are as detailed and realistic as possible. With this goal, the NGCI has developed a set of tools around serious gamification (Figure 5) that capture user feedback on the changes in the built environment. These changes include questions about balancing increasing buildability (in commercial or residential areas) with heritage retention and evaluating the carbon footprint of each set of solutions. These tools allow the investigation, study, and simulation of changes to the built environment to help citizens understand the complex impacts they will have on this historical urban environment and the area’s carbon footprint using the serious gaming tool.
Proposal 6 is to promote a system dynamics methodology that considers cross-sectoral effects of different variables in cities, and that adds not only GHG indicators. Silos mentioned in Gaps 7 and 8 are relevant when dealing with complex systems. Cities are complex systems, following the definition of Donella Meadows, of complex systems being “an interconnected set of elements that is coherently organized in a way that achieves a purpose” [40]. In a city, we find stock variables, entities, and flow variables, i.e., the relationship between entities. The relation between all these entities and these flows follows clear cause-effect in very limited cases. In most situations, the root causes of some problems, including sustainability aspects, do not come directly from certain entities but from the feedback loops of these entities. System dynamics helps us link all the parameters and understand the covariance effects between them since it gets to the root of the problem, finding the unexpected effects of multilayer strategies. For this, we need to understand the different elements in the city and create a formal systems model [41] that can help us understand the reasons behind emergent behaviors in cities. Moreover, to overcome Gap 5, it is important to overcome the reductionist view on CO 2 , adding other important aspects, such as LCA, using all current methodologies and indicators. An exciting example of addressing these complexities in cities that can be followed is the Cities and Urbanization System Model [42], from the Singapore University of Technology and Design (SUTD). For this reason, the NGCI is dealing with two levels of models: detailed white box models presenting bottom-up tools to evaluate the impacts on concrete building physics features, shown in the front-end Citylayers (https://citylayers.ca/, (accessed on 1 September 2023)) and system dynamics models, which make use of the detailed models to create simplifications, to feed the serious gaming tool Cityplayer.
Proposal 7 is to use a methodology that understands the impacts of cities on their environment. Another critical aspect that will be addressed using virtual tools is the impact of urban communities on other non-urban spaces (Gap 9). The high-intensity requirements of most cities make them rely on external sources of energy, food, water, and waste management strategies. This has a potentially significant impact on non-urban communities. The platform would hence help to detect these interactions from inside a city to outside the city, detecting “hidden” relationships and strong dependencies between urban and non-urban communities. Can a city like Montréal be sustainable because it uses electricity from a 99% renewable energy grid [43]? Partially, yes, but vital considerations of the effects of this type of energy far from the city should be considered and shown in indicators. Effects such as the environmental impact on indigenous communities of big hydro dams should be considered, in the case of Canada, and clearly shown at the same level as indicators of localized impacts of sustainability [44].
Proposal 8 is to adequately combine methodologies and indicators. After all that has been mentioned (Gaps 811), it seems that the solution to address the problems related to sustainability indicators is a cul-de-sac. However, the proposal for indicators from Section 5.1 and a structured methodology to develop them can be the first step to an answer. Adding those two elements with the integration of a multiplicity of social engagement solutions (like the proposed gaming or public hearings) should be able to capture the most important aspects of sustainability and livability in communities, neighborhoods, and cities. For this combination of indicators, methodologies, and other tools, the essential criteria should be:
  • There will not be a compound metric to capture all the essential information, but a set of agreed metrics (as described in Section 5.1) to incorporate all the necessary criteria;
  • The interpretation of the results is not a task universities should do. Political work should be left to politicians and civil society; therefore, the weighting factor given to each indicator should never be mentioned in a good indicator set. A counter-example is metabolic analysis, which is an interesting way to plot data but can bring misled interpretations;
  • The separation between metrics and evaluation should be made evident, and the different platforms should aim at capturing final users’ perspectives and determine some of the indicators, helping capture the importance given by each community, neighborhood, or city to certain factors. However, this does not prevent scientists from being able to use these tools as educational tools and trying to help people understand the greater goals of sustainability;
  • Measuring is not the last will of indicator frameworks for cities and communities. Scenario creation is. Scenarios can bring future impacts of present decisions into reality, and this should be used to educate people about the strong impacts of present decisions in future cities;

6. Conclusions

The NGCI is developing a set of open-source, collaborative, and modular tools with the goal of understanding sustainability and livability in cities. These tools will use indicators and methodologies to define environmental sustainability and represent it through a set of mutually exclusive, contributory indices. The selected indices will be based on two criteria: the most impact on the fight against climate change and the most affected by user actions in the future. The chosen indicators will be aligned with ISO 37120:2018 and the Thriving Places Index, which evaluate both sustainability and livability sociocultural aspects. Each index will be rated from 0 to MaxValue, where 0 indicates the least possible contribution to environmental sustainability, and MaxValue represents the greatest possible contribution. To assess perceived livability, the NGCI’s tools will allow users to walk around the city virtually and experience it firsthand. Users will see, hear, and emotionally feel the city as they attempt to achieve everyday objectives. For example, the tools will help users determine how safe an area is at night, how accessible transport options are, or how conducive a public space is for social gatherings. The NGCI aims to educate users on the impact of their decisions while also allowing them to have a say in the future development of cities and aligning the necessary climate change transition with their cultural and personal needs.

Author Contributions

Conceptualization, O.G. and U.E.; Methodology, O.G.; Formal analysis, O.G.; Investigation, O.G.; Resources, O.G. and C.G.; Data curation, O.G.; Writing—original draft and review, O.G.; Writing—review & editing, C.G. and U.E. All authors have read and agreed to the published version of the manuscript.

Funding

This research was funded by the NSERC under the Canada Excellence Research Chair of Professor Ursula Eicker, and by the UNIVER/CITY2030 initiative from Concordia University, funded by the McConnell Foundation.

Data Availability Statement

All data used in this project are available in the CKAN dataset from the Next Generation Cities Institute. Please contact the authors to have access to the necessary folders and the open-source tools from the NGCI.

Conflicts of Interest

The authors declare no conflict of interest.

Abbreviations

The following abbreviations are used in this manuscript:
BREEAMBuilding Research Establishment Environmental Assessment Method
CERCCanada Excellence Research Chair in Sustainable Cities and Communities
CityGMLCity Geography Markup Language
CKANComprehensive Knowledge Archive Networks
DLCData Life Cycle
GHGGreenhouse Gas
GPTGenerative Pre-trained Transformer
INSELblock diagram simulation system
IOTInternet Of the Things
ISOInternational Organization for Standardization
LEEDLeadership in Energy and Environmental Design
LODLevel of Detail
MATSIMMulti-Agent Transport Simulation
NGCINext Generation Cities Institute
NRCANNatural Resources Canada
OGCOpen Geospatial Consortium
KPIKey Performance Indicators
SDGSustainable Development Goals
SUMOSimulation of Urban MObility
SUTDSingapore University of Technology and Design
TRNSYSTRaNsient SYstem Simulation program
UBEMsUrban Building Energy Models
UNUnited Nations
UN-HABITATUnited Nations Human Settlements Programme
WELLWELL Building Standard
XSDXML Schema Definition

References

  1. Flint, J. Neighborhoods and Community. In International Encyclopedia of Human Geography; Elsevier: Amsterdam, The Netherlands, 2009; pp. 354–359. [Google Scholar] [CrossRef]
  2. Michalina, D.; Mederly, P.; Diefenbacher, H.; Held, B. Sustainable Urban Development: A Review of Urban Sustainability Indicator Frameworks. Sustainability 2021, 13, 9348. [Google Scholar] [CrossRef]
  3. Huang, L.; Wu, J.; Yan, L. Defining and Measuring Urban Sustainability: A Review of Indicators. Landsc. Ecol. 2015, 30, 1175–1193. [Google Scholar] [CrossRef]
  4. Huovila, A.; Bosch, P.; Airaksinen, M. Comparative analysis of standardized indicators for Smart sustainable cities: What indicators and standards to use and when? Cities 2019, 89, 141–153. [Google Scholar] [CrossRef]
  5. Verma, P.; Raghubanshi, A. Urban sustainability indicators: Challenges and opportunities. Ecol. Indic. 2018, 93, 282–291. [Google Scholar] [CrossRef]
  6. European Commission. Directorate General for the Environment. University of the West of England (UWE), Science Communication Unit. In Indicators for Sustainable Cities; Publications Office: Luxembourg, 2015. [Google Scholar]
  7. Brundtland, G.H. Our Common Future; Oxford Paperbacks; Oxford University Press: Oxford, UK, 1987. [Google Scholar]
  8. Robra, B.; Heikkurinen, P. Degrowth and the Sustainable Development Goals. In Decent Work and Economic Growth; Leal Filho, W., Azul, A.M., Brandli, L., Lange Salvia, A., Wall, T., Eds.; Springer International Publishing: Cham, Switzerland, 2021; pp. 253–262. [Google Scholar] [CrossRef]
  9. Mang, P.; Reed, B. Regenerative Development and Design; Elsevier: Amsterdam, The Netherlands, 2020; pp. 115–141. [Google Scholar] [CrossRef]
  10. ISO/TC 268; Sustainable Cities and Communities. International Organization for Standardization: Geneva, Switzerland, 2020. Available online: https://www.iso.org/committee/656906.html (accessed on 1 January 2023).
  11. Adewumi, A.S.; Onyango, V.; Moyo, D.; Alwaer, H. A Review of Selected Neighbourhood Sustainability Assessment Frameworks Using the Bellagio STAMP. Ecol. Econ. 2019, 37, 108–118. [Google Scholar] [CrossRef]
  12. Sala, S.; Ciuffo, B.; Nijkamp, P. A systemic framework for sustainability assessment. Ecol. Econ. 2015, 119, 314–325. [Google Scholar] [CrossRef]
  13. Medayese, S.; Magidimisha-Chipingu, H.; Chipungu, L. Conceptual nexus of urban liveability and sustainability. IOP Conf. Ser. Earth Environ. Sci. 2021, 654, 012027. [Google Scholar]
  14. Zeidler, L.; Cairns, M.; Laurence, R.; Wallace, J.; Paylor, H. The Shared Ingredients for a Wellbeing Economy. Discussion Paper. Available online: https://whatworkswellbeing.org/resources/the-shared-ingredients-for-a-wellbeing-economy/ (accessed on 1 March 2023).
  15. Guzman, P.; Pereira Roders, A.; Colenbrander, B. Measuring links between cultural heritage management and sustainable urban development: An overview of global monitoring tools. Cities 2017, 60A, 192–201. [Google Scholar] [CrossRef]
  16. Alhawarat, M.; Hegazi, M. Revisiting K-Means and Topic Modeling, a Comparison Study to Cluster Arabic Documents. IEEE Access 2018, 6, 42740–42749. [Google Scholar] [CrossRef]
  17. Marutho, D.; Hendra Handaka, S.; Wijaya, E.; Muljono. The Determination of Cluster Number at k-Mean Using Elbow Method and Purity Evaluation on Headline News. In Proceedings of the 2018 International Seminar on Application for Technology of Information and Communication, Semarang, Indonesia, 21–22 September 2018; pp. 533–538. [Google Scholar] [CrossRef]
  18. U.S. Environmental Protection Agency. Chicago O’Hare International Airport. Environmental Quality Index (EQI). 2017. Available online: https://www.epa.gov/healthresearch/environmental-quality-index-eqi (accessed on 15 February 2023).
  19. Steffen, W.; Richardson, K.; Rockström, J.; Cornell, S.; Fetzer, I.; Bennett, E.; Biggs, R.; Carpenter, S.; Vries, W.; de Wit, C.; et al. Planetary Boundaries: Guiding Human Development on a Changing Planet. Science 2015, 347, 1259855. [Google Scholar] [CrossRef]
  20. GFBio|German Federation for Biological Data. Available online: https://www.gfbio.org/training/material/data-life-cycle/ (accessed on 10 April 2023).
  21. Greene, S.; Meixell, B. Hacking the Sustainable Development Goals: Can US Cities Measure Up? Urban Institute, Washington. 2017. Available online: https://www.urban.org/sites/default/files/publication/92946/2001490-hacking-the-sustainable-development-goals-corrected.pdf (accessed on 23 April 2023).
  22. Whitler, K. Why Too Much Data Is a Problem and How to Prevent It. Forbes. 2018. Available online: www.forbes.com/sites/kimberlywhitler/2018/03/17/why-too-much-data-is-a-problem-and-how-to-preventit (accessed on 7 January 2023).
  23. Petit, O. Digital Economy and Climate Impact; Sustainability Research Institute: Fairfield, IA, USA, 2021. [Google Scholar]
  24. Koutra, S.; Ioakimidis, C.S. Unveiling the Potential of Machine Learning Applications in Urban Planning Challenges. Land 2023, 12, 83. [Google Scholar] [CrossRef]
  25. AR6 Synthesis Report: Climate Change. 2023. Available online: https://www.ipcc.ch/report/ar6/syr/ (accessed on 17 July 2023).
  26. Meadows, D. The Limits to Growth: A Report for the Club of Rome’s Project on the Predicament of Mankind; Universe Books: New York, NY, USA, 1972. [Google Scholar]
  27. Nguyen, C.T. The Seductions of Clarity. R. Inst. Philos. Suppl. 2021, 89, 227–255. [Google Scholar] [CrossRef]
  28. Reinhart, C. Daylighting Handbook—Book, 2nd ed.; Building Technology Press: New York, NY, USA, 2020; Volume 1. [Google Scholar]
  29. Scofield, J. Do LEED-certified buildings save energy? Not really …. Energy Build. 2009, 41, 1386–1390. [Google Scholar] [CrossRef]
  30. Wang, Z.; Li, S.; Jin, Z.; Li, Z.; Liu, Q.; Zhang, K. Oil and gas pathway to net-zero: Review and outlook. Energy Strategy Rev. 2023, 45, 101048. [Google Scholar] [CrossRef]
  31. Kitcher, P. The Division of Cognitive Labor. J. Philos. 1990, 87, 5–22. [Google Scholar] [CrossRef]
  32. Fagan, M.; Huang, C. A Look at How People around the World View Climate Change. Pew Research Institute. 2019. Available online: https://www.pewresearch.org/short-reads/2019/04/18/a-look-at-how-people-around-the-world-view-climate-change/ (accessed on 27 March 2023).
  33. Merry, S.E. The Seductions of Quantification: Measuring Human Rights, Gender Violence, and Sex Trafficking; Chicago Series in Law and Society; University of Chicago Press: Chicago, IL, USA, 2016. [Google Scholar]
  34. Concordia’s Data Studio Allies with the Montreal Climate Partnership to Better Track the City’s Greenhouse Emissions—Concordia University. Available online: https://www.concordia.ca/content/shared/en/news/stories/2023/05/16/concordia-s-data-studio-allies-with-the-montreal-climate-partnership-to-better-track-the-citys-greenhouse-emissions.html (accessed on 10 May 2023).
  35. Sulistyah, U.D.; Hong, J.H. The use of 3D building data for disaster management: A 3D SDI perspective. Int. Arch. Photogramm. Remote Sens. Spat. Inf. Sci. 2019, 42, 395–402. [Google Scholar] [CrossRef]
  36. Colouring London and the Colouring Cities Research Programme. Available online: https://www.turing.ac.uk/research/research-projects/colouring-london-and-colouring-cities-research-programme (accessed on 27 June 2023).
  37. Colouring Melbourne. Available online: https://colouring.london (accessed on 27 June 2023).
  38. SAREF: The Smart Applications REFerence Ontology. Available online: https://saref.etsi.org/core/v3.1.1/ (accessed on 1 July 2023).
  39. Santhanavanich, T.; Padsala, R.; Würstle, P.; Coors, V. The Spatial Data Infrastructure of AN Urban Digital Twin in the Building Energy Domain Using Ogc Standards. Isprs Ann. Photogramm. Remote Sens. Spat. Inf. Sci. 2022, 10, 249–256. [Google Scholar] [CrossRef]
  40. Meadows, D.H. Thinking in Systems: A Primer; Chelsea Green Publishing: Chelsea, VT, USA, 2008. [Google Scholar]
  41. Towards the Formal Systems Model. 2022. Available online: https://www.futurelearn.com/info/courses/systems-thinking-complexity/0/steps/20378#:~:text=Building%20a%20Formal%20Systems%20Model,influences%20that%20exist%20among%20them (accessed on 30 May 2023).
  42. Forum, W.E. Strategic Intelligence|World Economic Forum. 2023. Available online: https://intelligence.weforum.org (accessed on 15 June 2023).
  43. Hydropower, a Clean and Renewable Energy Source. 2023. Available online: https://www.hydroquebec.com/fclean-energy-provider/clean-energy.html (accessed on 13 March 2023).
  44. Hendricks, R. First Nations and Hydropower: The Case of British Columbia’s Site C Dam Project. Just Environments, Items for Social Sciences. 2017. Available online: https://items.ssrc.org/just-environments/first-nations-and-hydropower-the-case-of-british-columbias-site-c-dam-project/ (accessed on 12 February 2023).
Figure 1. General description of method.
Sustainability 15 15425 g001
Figure 2. Word comparison between the different indicators of the frameworks.
Sustainability 15 15425 g002
Figure 3. Clustering analysis for the different methodologies based on own preprocessing.
Sustainability 15 15425 g003
Figure 4. Frequency analysis for the different frameworks based on livability concepts.
Sustainability 15 15425 g004
Figure 5. Screenshots of TOOLS4Cities Cityplayer, a tool developed by the NGCI to capture user’s perspectives on urban planning).
Sustainability 15 15425 g005
Table 1. List of environmental-based frameworks for sustainability.
Indicator/ToolkitOrganizationRead MoreStage
Green StarGreen Building Council of Australiahttp://www.gbca.org.au/green-star/ (accessed on 1 September 2023)Certification Framework
LEED for Neighbourhood Development (LEED-ND)Leadership in Energy and Environmental Design (LEED)https://www.usgbc.org/leed/rating-systems/neighborhood-development (accessed on 1 September 2023)Certification Framework
NeomNEOM Saudi Arabiahttps://www.neom.com/en-us/our-business/sectors/design-and-construction (accessed on 1 September 2023)Certification Framework
ENVISIONInstitute for Sustainable Infrastructureshttps://sustainableinfrastructure.org/envision/overview-of-envision/ (accessed on 1 September 2023)Certification Framework
Urban Indicators GuidelinesUN Human Settlements Programmehttps://unhabitat.org/urban-indicators-guidelines- monitoring-the-habitat-agenda-and-the- millennium-development-goals/ (accessed on 1 September 2023)Design
China Urban Sustainability IndexUrban China Initiativehttps://urbanchinainitiative.typepad.com/files/usi.pdf (accessed on 1 September 2023)Diagnostics
City BlueprintWaternet Amsterdam; KWR Water Cycle Research Institutehttps://www.kwrwater.nl/en/tools-producten/city-blueprint// (accessed on 1 September 2023)Diagnostics
EEA Urban Metabolism FrameworkEuropean Environment Agencyhttps://www.eea.europa.eu/publications/urban-sustainability-in-europe-a/download (accessed on 1 September 2023)Diagnostics
European Green Capital AwardEuropean Commissionhttps://environment.ec.europa.eu/topics/urban-environment/european-green-capital-award_en/ (accessed on 1 September 2023)Diagnostics
European Green City ToolEuropean Unionhttps://errin.eu/news/self-assess-green-city-tool (accessed on 1 September 2023)Diagnostics
European Green City IndexEconomist Intelligence Unit; Siemenshttps://assets.new.siemens.com/siemens/assets/api/uuid:fddc99e7-5907-49aa-92c4-610c0801659e/european-green-city-index.pdf (accessed on 1 September 2023)Diagnostics
European Green Leaf AwardEuropean Unionhttps://environment.ec.europa.eu/topics/urban-environment/european-green-capital-award_en (accessed on 1 September 2023)Diagnostics
Global City Indicators ProgramGlobal City Indicators Facilityhttps://openknowledge.worldbank.org/server/api/core/bitstreams/e20c1329-26c0-5c43-b04b-cbccb56dbb10/content (accessed on 1 September 2023)Diagnostics
Indicators for SustainabilitySustainable Cities Internationalhttps://documents1.worldbank.org/curated/en/339851517836894370/pdf/123149-Urban-Sustainability-Framework.pdf (accessed on 1 September 2023)Diagnostics
Reference Framework for Sustainable Cities (RFSC)RFSChttp://rfsc.eu/ (accessed on 1 September 2023)Diagnostics
Urban Audit Cities StatisticsEurostathttp://ec.europa.eu/eurostat/web/cities (accessed on 1 September 2023)Diagnostics
Urban Ecosystem Europe—Informed CitiesInternational Council for Local Environmental Initiatives (ICLEI); Ambiente Italiahttps://informedcities.eu/home/ (accessed on 1 September 2023)Diagnostics
Urban Sustainability IndicatorsEuropean Foundation for the Improvement of Living and Working Conditionshttps://www.eurofound.europa.eu/en/publications/2012/urban-sustainability-indicators (accessed on 1 September 2023)Diagnostics
City Resilience IndexArup and supported by The Rockefeller Foundationhttps://www.cityresilienceindex.org/#/ (accessed on 1 September 2023)Diagnostics
SDGs for citiesUN-Habitathttps://www.sdg-cities.org/ (accessed on 1 September 2023)Diagnostics
BREEAM CommunitiesBuilding Research Establishment Environmental Assessment Methodology (BREEAM)https://www.breeam.com/ (accessed on 1 September 2023)Diagnostics
Climate+ Development ProgramClinton Foundation; US Green Building Councilhttps://www.c40.org/wp-content/uploads/2022/02/C40-Good-Practice-Guide-Climate-Positive-Development.pdf (accessed on 1 September 2023)Diagnostics
Covenant of MayorsCovenant of Mayorshttp://www.covenantofmayors.eu/ (accessed on 1 September 2023)Diagnostics
DGNB Certification SystemGerman Sustainable Building Councilhttp://www.dgnb.de/en/ (accessed on 1 September 2023)Diagnostics
ECO 2 Cities InitiativeWorld Bankhttps://www.citiesalliance.org/resources/publications/cities-alliance-knowledge/eco2-cities-ecological-cities-economic-cities#:~:text=Eco2%20Cities%3A%20Ecological%20Cities%20as%20Economic%20Cities%20is%20a%20programme,greater%20ecological%20and%20economic%20sustainability. (accessed on 1 September 2023)Diagnostics
Eurostat Sustainable Development IndicatorsEurostathttps://ec.europa.eu/eurostat/web/sdi/database/sustainable-cities-and-communities (accessed on 1 September 2023)Diagnostics
Green Cities ProgrammeOECDhttps://www.oecd.org/regional/greening-cities-regions/46811501.pdf (accessed on 1 September 2023)Diagnostics
SynCityImperial College Londonhttps://www.researchgate.net/publication/255625483_SynCity_An_integrated_tool_kit_for_urban_energy_systems_modelling (accessed on 1 September 2023)Diagnostics
GREEN Cities IndexEconomist Intelligence Unit; Siemenshttps://assets.new.siemens.com/siemens/assets/api/uuid:cf26889b-3254-4dcb-bc50-fef7e99cb3c7/gci-report-summary.pdf (accessed on 1 September 2023)Diagnostics
ISO 37120:2018International Standard Organisationhttps://www.iso.org/standard/68498.html (accessed on 1 September 2023)Diagnostics/
 Standard
Table 2. List of sustainability-livability frameworks.
Indicator/ToolkitOrganizationRead More
Thriving places indexCentre for Thriving Placeshttps://www.centreforthrivingplaces.org/ (accessed on 1 September 2023)
Seed ModelCarnegie UKhttps://www.carnegieuktrust.org.uk (accessed on 1 September 2023)
Doughnut economicsDoughnut Economics Action Labhttps://doughnuteconomics.org/ (accessed on 1 September 2023)
WELL-BEING OF FUTURE GENERATIONS (WALES) ACTGovernment of Waleshttps://www.futuregenerations.wales/about-us/future-generations-act/ (accessed on 1 September 2023)
Scottish National Performance FrameworkGovernment of Scotlandhttps://nationalperformance.gov.scot/ (accessed on 1 September 2023)
OFFICE FOR NATIONAL STATISTICS WELLBEING DASHBOARDUK Governmenthttps://www.ons.gov.uk/peoplepopulationandcommunity/wellbeing/articles (accessed on 1 September 2023)
OECD BETTER LIFE INDEXOECDhttps://www.oecdbetterlifeindex.org/#/11111111111 (accessed on 1 September 2023)
Table 3. Epistemological analysis of frameworks.
FrameworkCultureEconomyEnvironmentGovernance and ImplementationSociety
China urban sustainability index0%10%70%0%20%
City blueprints0%13%25%13%50%
EEA Urban metabolism0%0%83%0%17%
Green Capital awards0%10%50%10%30%
European Green City Tool0%13%47%0%40%
European Green City Index0%0%54%8%38%
European Green Leaf Award0%0%54%0%46%
Global Cities Indicator Facility0%17%17%33%33%
Indicators for sustainability0%18%18%7%57%
Reference framework for Sustainable Cities0%0%0%0%0%
Urban Audit Cities Statistics0%14%14%0%71%
Urban Ecosystem Europe0%8%32%8%52%
Urban Sustainability Indicators6%6%44%6%38%
BREEAM Communities0%30%28%10%33%
Leed ND0%17%38%9%36%
DGNB11%23%28%28%11%
Envision0%18%62%10%10%
Urban Indicators Guidelines0%0%0%0%0%
NEOM11%17%61%6%6%
Green Cities Index0%11%56%0%33%
City Resilience Index0%24%12%12%53%
ISO 37120:201816%0%16%5%63%
SDGs for cities20%20%20%20%20%
CEEQUAL11%6%39%22%22%
AGIC10%10%50%20%10%
The color coding of this table shows the relative epistemological weight that each of the parameters has in the different frameworks with respect to the SDG for cities, which is equilibrated between the five parameters.
Table 4. A first proposal for KPIs for an integral sustainability-livability framework.
TopicProposed Areas of IndicatorsProposed IndicatorsSource
Environmental sustainabilityEnergy relatedTotal final energy consumption per capita(LEVELs)
Final energy consumption per source per capita(ISO371202018)
Final energy consumption per uses per capita(ISO371202018)
Final energy consumption for public buildings(ISO371202018)
% final energy coming from renewable energy(ISO371202018)
% final energy coming from onsite renewable energy(ISO371202018 adapted)
Electrical energy produced from renewable energy sources(Own)
Thermal energy produced from renewable energy sources(Own)
Local energy communities(Own)
GHG relatedCO 2 emissions (operational), divided by sector and scope(ISO371202018)
CO 2 emissions (embodied), divided by sector(ISO371202018)
Resource relatedUTCI difference in interurban spaces(Own)
CO 2 concentration difference(Own)
Green area (hectares) per 100,000 population(ISO37122018)
Total urban agricultural area per 100,000 population(ISO37122018)
Water relatedFreshwater use(9 planetary boundaries)
Percentage of city population with potable water supply service(ISO37122018)
Total water consumption per capita (litres/day)(ISO37122018)
Percentage of city population with sustainable access to an improved water source(ISO37122018)
Percentage of city’s wastewater receiving centralized treatment(ISO37122018)
Air-quality relatedAtmospheric aerosol leading(9 planetary boundaries)
Stratospheric ozone depletion(9 planetary boundaries)
Air Quality Index(EPA)
Particle Concentration(9 planetary boundaries)
Ground level ozone(EPA)
Carbon monoxide(EPA)
Sulfur dioxide(EPA)
Nitrogen dioxide(EPA)
Resilience relatedUTCI difference in interurban spaces(Own)
CO 2 concentration difference(Own)
Urban Resilience Index(Own, based on City Resilience Index)
Green area (hectares) per 100,000 population(ISO37122018)
Total urban agricultural area per 100,000 population(ISO37122018)
Land use relatedImpact of city in land use change(9 planetary boundaries)
Biodiversity relatedOcean acidification(9 planetary boundaries)
Biogeochemical flows(9 planetary boundaries)
Transport relatedKilometres of public transport system per 100,000 population(ISO37122018)
Percentage of commuters using a travel mode other than a personal vehicle(ISO37122018)
Annual number of public transport trips per capita(ISO37122018)
Kilometres of bicycle paths and lanes per 100,000 population(ISO37122018)
Transportation deaths per 100,000 population(ISO37122018)
Percentage of population living within 0.5 km of public transit running at least every 20 min during peak periods(ISO37122018)
Average commute time(ISO37122018)
Exposure to transport-related noise(Thriving places index)
Noise complaints(Thriving places index)
Use of active transport(Thriving places index)
Traffic accidents rate(Thriving places index)
Livability-local conditionsPlace and environment-relatedPrivate outdoor space(Thriving places index)
Public outdoor space(Thriving places index)
Access to woodland(Thriving places index)
Primary youth offenders(Thriving places index)
Crime severity index(Thriving places index)
Domestic abuse rates(Thriving places index)
Safety at dark(Thriving places index)
Poor housing(Thriving places index)
Housing affordability ratio(Thriving places index)
Homelessness numbers(Thriving places Index)
Mental and physical health-relatedChild obesity rate(Thriving places index)
Conceptions in under 18s(Thriving places index)
Physical activity 5-a-day(Thriving places index)
Activity-limiting disability(Thriving places index)
Illness and disability(Thriving places index)
Life expectancy(Thriving places index)
Years of potential life lost(Thriving places index)
Preventable mortality(Thriving places index)
Depression prevalence(Thriving places index)
Long term mental health(Thriving places index)
Severe mental illness(Thriving places index)
Suicide rate(Thriving places Index)
Education and learningAdults with no qualifications(Thriving places index)
Life-long learning(Thriving places index)
Number of apprenticeship starts(Thriving places index)
Educational attainment of children(Thriving places index)
School readiness(Thriving places index)
Childcare quality(Thriving places Index)
Work and local economyUnwillingly out of work(Thriving places index)
Good jobs(Thriving places index)
Income deprivation affecting older people index(Thriving places index)
Income deprivation affecting children index(Thriving places index)
Percentage with low income(Thriving places index)
Local business(Thriving places Index)
People and communityGeneral election turnout(Thriving places index)
Volunteering related to sport and activity(Thriving places index)
Clubs and societies(Thriving places index)
Organization membership(Thriving places index)
Participation in heritage(Thriving places index)
Heritage assets(Thriving places index)
Neighborhood belonging(Thriving places index)
Social fragmentation index(Thriving places Index)
Livability-equalityHealthSlope index of inequality (SII) in life expectancy at birth - average (SII years)(Thriving places Index)
Income80/20 percentile weekly earnings difference (Thriving places Index)
GenderGender pay gap(Thriving places Index)
SocialSocial mobility(Thriving places Index)
EthnicityBAME representation of local councillors(Thriving places Index)
Disclaimer/Publisher’s Note: The statements, opinions and data contained in all publications are solely those of the individual author(s) and contributor(s) and not of MDPI and/or the editor(s). MDPI and/or the editor(s) disclaim responsibility for any injury to people or property resulting from any ideas, methods, instructions or products referred to in the content.

