Article

Do Local Socio-Economic Structures Determine the Spatial Distribution of Human Capital? Analysis of Connections for Rural Areas in Poland

by
Maria Klonowska-Matynia
Department of Economics, Faculty of Economic Sciences, Koszalin University of Technology, 75-453 Koszalin, Poland
Sustainability 2023, 15(21), 15194; https://doi.org/10.3390/su152115194
Submission received: 15 September 2023 / Revised: 14 October 2023 / Accepted: 19 October 2023 / Published: 24 October 2023

Abstract

:
The article has an empirical nature. The subject of detailed analysis is the variations in spatial distribution of human capital in rural areas of Poland and the analysis of the correlation of this phenomenon with local structures of the socio-economic development process. The diagnosis and assessment of variations in the spatial distribution of human capital were performed based on an author’s indicator—a synthetic measure of human capital level (HCI—human capital index). The characterisation of local socio-economic structures was based on the typology of rural areas according to Rural Development Monitoring (RDM 2014 and 2023). The study was conducted for rural areas in Poland defined by the Main Statistical Office based on the administrative criteria of rural and rural-urban municipalities. A total of 2172 municipalities were covered by the study. The data analysis was conducted spatially at the NUTS 5 level and comparatively at the NUTS 2 level for the years 2013–2018. The assumption was verified that the processes of human capital concentration in rural areas in Poland are related to local socio-economic structures of development processes, and the local structure factor that influences the existing differences is the degree of use of agricultural functions. The results of statistical tests positively verify this relationship as statistically significant. Moreover, the article provides strong arguments for shaping regional and rural policy and its implementation. The assumption about the need to change the approach to the study of rural space was positively verified; it is suggested to move away from analyses conducted at the level of the NUTS 2 region to the level of the NUTS 5 municipality. Research on rural areas makes sense only from a local perspective; it allows for a more accurate illustration of the specificity of local communities, revealing their development potentials and barriers, and, as a result, more effective programming of instruments supporting local development, dedicating specific support programs individually for each municipality, while the regional approach presents the state of differences too generally and may often lead to incorrect interpretation. In the empirical part of the article, taxonomic methods of hierarchy (patternless) and classification of multi-featured objects were used. As a result, each object (municipality) was assigned a synthetic measure—the relative human capital level index (HCI). Based on the HCI index, an ex-post hierarchical classification of municipalities was carried out. The main sources of data (diagnostic variables) for the construction of the HCI index were the Local Data Bank of the Central Statistical Office (BDL GUS), the national census of NSP 2011, the Ministry of Finance, the Ministry of Family and Social Policy, and District Examination Boards. The source of data on local socio-economic structures expressed based on the typology of rural areas according to the Rural Development Monitoring (RDM) methodology was the European Fund for the Development of Polish Villages (EFRWP).

1. Introduction

Modern research on local (rural) spatial systems in Poland proves that their socio-economic development is the result of many factors acting simultaneously, which, regardless of the classification adopted, remain in constant dynamic interaction. For years, the main role in this process was attributed to historical factors, which, as it turns out, still significantly determine the conventional lines of spatial differentiation of the level of development in Poland on the east-west line [1]. Many classicists, economists, and local development specialists consider the location of a given unit in space as a key factor in development [2]. J. Wilkin partially agreed, arguing that geographical location favours but does not guarantee success in economic development, just as a spatially peripheral location does not necessarily mean economic marginalisation [3].
More detailed opinions indicate that the socio-economic development of a given rural area is a direct result of its location in the vicinity of urban agglomerations, in areas with good transport connections and attractive for tourists, or close to border crossings [4,5,6,7,8,9]. It has been emphasised that the location of a given unit in the zone of influence of the largest metropolises is particularly advantageous, as it creates very favourable conditions for development and the area can be successful, as it depends only to a limited extent on the activity of local government authorities. Conversely, in an unfavourable situation, progress may be very limited, even with the wisest local government policies [10]. Still other authors point out that the key development factor is the functional structure [2,11] ecological agriculture [12,13], tourism [14], including cultural tourism [15].
A comprehensive review of rural development factors, in both classical and modern approaches, has been presented by M. Klonowska-Matynia [16]. In this monograph, but also in many recent documents and studies, including the World Bank [17], it is emphasised that nowadays one of the most important developmental factors determining the multifunctional development of rural areas is human capital [18,19,20,21,22,23], which has the strongest interaction with all other capitals, i.e., natural capital, cultural capital, social capital, political capital, technical capital, or financial capital [24,25,26]. In addition to human capital, modern development factors that are highly interdependent include social capital [27,28,29] and social innovation [30,31,32,33].
It is important that all elements of its structure interact with other socio-economic factors that determine the condition and development of each spatial unit, regardless of the chosen level of analysis, i.e., country, region, or municipality [34,35,36]. It should be emphasised that their role in the development of a given area depends on the type of rural area, its functions, existing development barriers, and connections with urban centres [37].
The article tries to expand the existing knowledge by trying to empirically verify the assumption that human capital and the processes of its concentration in rural areas are related to local structures of socio-economic development and that these factors determine the level and dynamics of the development processes of a given unit. This issue is the main research problem of this article; it is extremely important from the perspective of designing the optimal local development policy in the coming years.
The role of human capital in shaping the socio-economic space of rural areas has for years found its practical dimension in the European Union’s policy for rural areas. Its strategic goal is to counteract the ineffective use of local development potential and to prevent social exclusion [38,39,40,41]. The recent long-term vision of the European Commission is based on the implementation of four complementary action lines to create stronger, connected, resilient, and prosperous rural areas by 2040 [42]. Similar assumptions for rural development policy are presented in the OECD position [43]. However, in many circles (academic, political, and local government), European development policy in recent years has been criticised for having a territorial approach that is too weak and does not deeply affect socio-economic structures at the local level.
As a result, the strategies and the resulting programmes are usually considered to be territorially blind. It turns out that interventions are neither targeted to a specific area nor adapted to its needs, as a result of which aid funds are directed to everyone and do not solve the problems of specific areas with similar development deficits. The introduction to the latest RDM report [1] emphasised that different areas of Poland need different perspectives and development paths in order to achieve the goal of improving the well-being of citizens [1]. This position is increasingly supported by recent publications, which also provide evidence that local development can result from, among other things, locally different potentials, including the key resource, human capital, and social capital, which are closely related to it [44,45,46]. When studying rural space and its socio-economic structures and potentials, it is important to emphasise the fact that nowadays rural areas have been transformed into much more diverse and complex socio-economic systems, and therefore their study requires an individual, local approach. This is one of the main premises for the research in this article, which determines the research conceptualisation adopted by the author.
The strong differentiation of rural space in Poland is very well described in the literature e.g., [47,48,49,50]. For years, research on rural development has been making difficult attempts to diagnose the causes of this diversity and identify the key factors responsible for the existing situation. An important place in this discussion is occupied by considerations of human capital, treated as a key endogenous resource responsible for the development of rural areas in relation to their socio-economic situation. This article responds to the need to gather objective knowledge in this area, which will allow a better understanding of the regularities in the distribution of human capital and its consequences for the development of rural areas. In the practical dimension, however, the article can provide the necessary knowledge for programming a more effective European policy for rural areas, a new approach to be implemented at the local level in the near future.
The point of reference for research in this direction has been the results of previous research, which have verified the assumption that the level of development of a given unit is determined by the human capital accumulated in a given unit. Therefore, knowledge of the state and structure of this resource and of the mechanisms that explain the processes of its unequal accumulation in the socio-economic space at the local level seems to be crucial. Equally important seems to be knowledge about the role of the local socio-economic structure in these differentiation processes and which factors of this structure most strongly determine the level of existing inequalities. The above conditions form the basis for planning programmes that effectively support development processes at the local level [16,51]. This article fills the existing research gap in several aspects. The empirical analysis was carried out for rural areas in Poland, spatially at the NUTS 5 level and comparatively at the NUTS 2 level, for the years 2013–2018. The subject of detailed analyses are differences in the spatial distribution of human capital in rural areas in Poland in connection with local structures of the socio-economic development process, which are highly diversified. The state of these differences is reflected in numerous typologies and classifications of rural areas [16,47,49,50,52,53,54].
However, the research results presented do not always reflect the specificity of local communities and their potentials, nor do they allow a proper description of the local socio-economic structure. For this reason, this article attempts to demonstrate, through empirical research and the presentation of data from the perspective of two levels—NUTS 2 and NUTS 5—that rural areas should be studied at the lowest, i.e., local level. The justification for this research approach is that the regional approach often used by researchers does not allow for the detection of significant differences between units, treating individual municipalities as elements of a larger, homogeneous set of municipalities (e.g., in a region of the country), while a deeper exploration of local structures strongly questions the validity of this approach to the study of rural areas. This is a response to recent challenges in rural policy. The scope of the study and the research questions are described in detail in the next section of the article.
In justifying the choice of human capital in relation to rural areas, it was found that locating rural areas in the theory of place and space is justified because research on regions and the theory of regional development do not exhaust the need to study rural areas (especially at the local level). Moreover, they represent a very promising field of research [55,56], and the importance and attractiveness of rural research can be demonstrated by the number of scientific publications that refer to the theory of rural development at the intersection of economics, sociology (especially rural sociology), or socio-economic geography [16]. The empirical research carried out in this article is part of the latest socio-geographical research, the subject of which is the differentiation of socio-economic space and its determination of the causes of this phenomenon and process at the same time [57,58].

2. Method and Scope of Data

2.1. Conceptualisation of Research. Method and Scope of Data

The subject of the empirical analyses was the extent of differences in the spatial distribution of human capital in rural areas in Poland and its connection with the socio-economic structures of a given administrative unit. The article tries to explain the role of socio-economic structures, including the use of the agricultural function (but also other factors), in shaping these disparities and influencing the level of development achieved in rural areas. Two questions have been empirically tested: 1. How differentiated is the spatial distribution of human capital in rural areas of Poland? 2. Are there any links between the spatial distribution of human capital and the structure of the socio-economic development processes of individual administrative units (municipalities), and what is their nature? In addition, an attempt was made to analyse and evaluate possible regularities and to identify factors that could explain the current state of differences in the socio-economic space of rural areas in Poland. In addition to the above-mentioned questions, the article raises another issue.
The assumption of the justified need to change the approach to the study of rural areas at the level of the NUTS 2 region and to move to a lower, more rural, i.e., local level of NUTS 5 data aggregation was verified. An attempt has been made to show that the regional approach commonly used (e.g., in current regional policy, rural policy) is too general and does not allow to capture the characteristics that significantly differentiate the units studied or to identify local potentials and barriers to development. More importantly, treating municipalities as a homogeneous set administratively assigned to a region can often lead to misinterpretation of diagnostic results and false conclusions, resulting in an ineffective policy for the development of local spatial systems. For this reason, the empirical analysis was carried out at the lowest local (rural) level of aggregation (NUTS 5) and a comparative analysis was applied at the regional level (NUTS 2). The study covered rural areas in Poland, defined according to the nomenclature of the Central Statistical Office on the basis of the administrative criterion [59] as rural and rural-urban municipalities. Spatially, the study covered the entire population of rural and rural-urban municipalities in Poland, a total of 2172 municipalities.

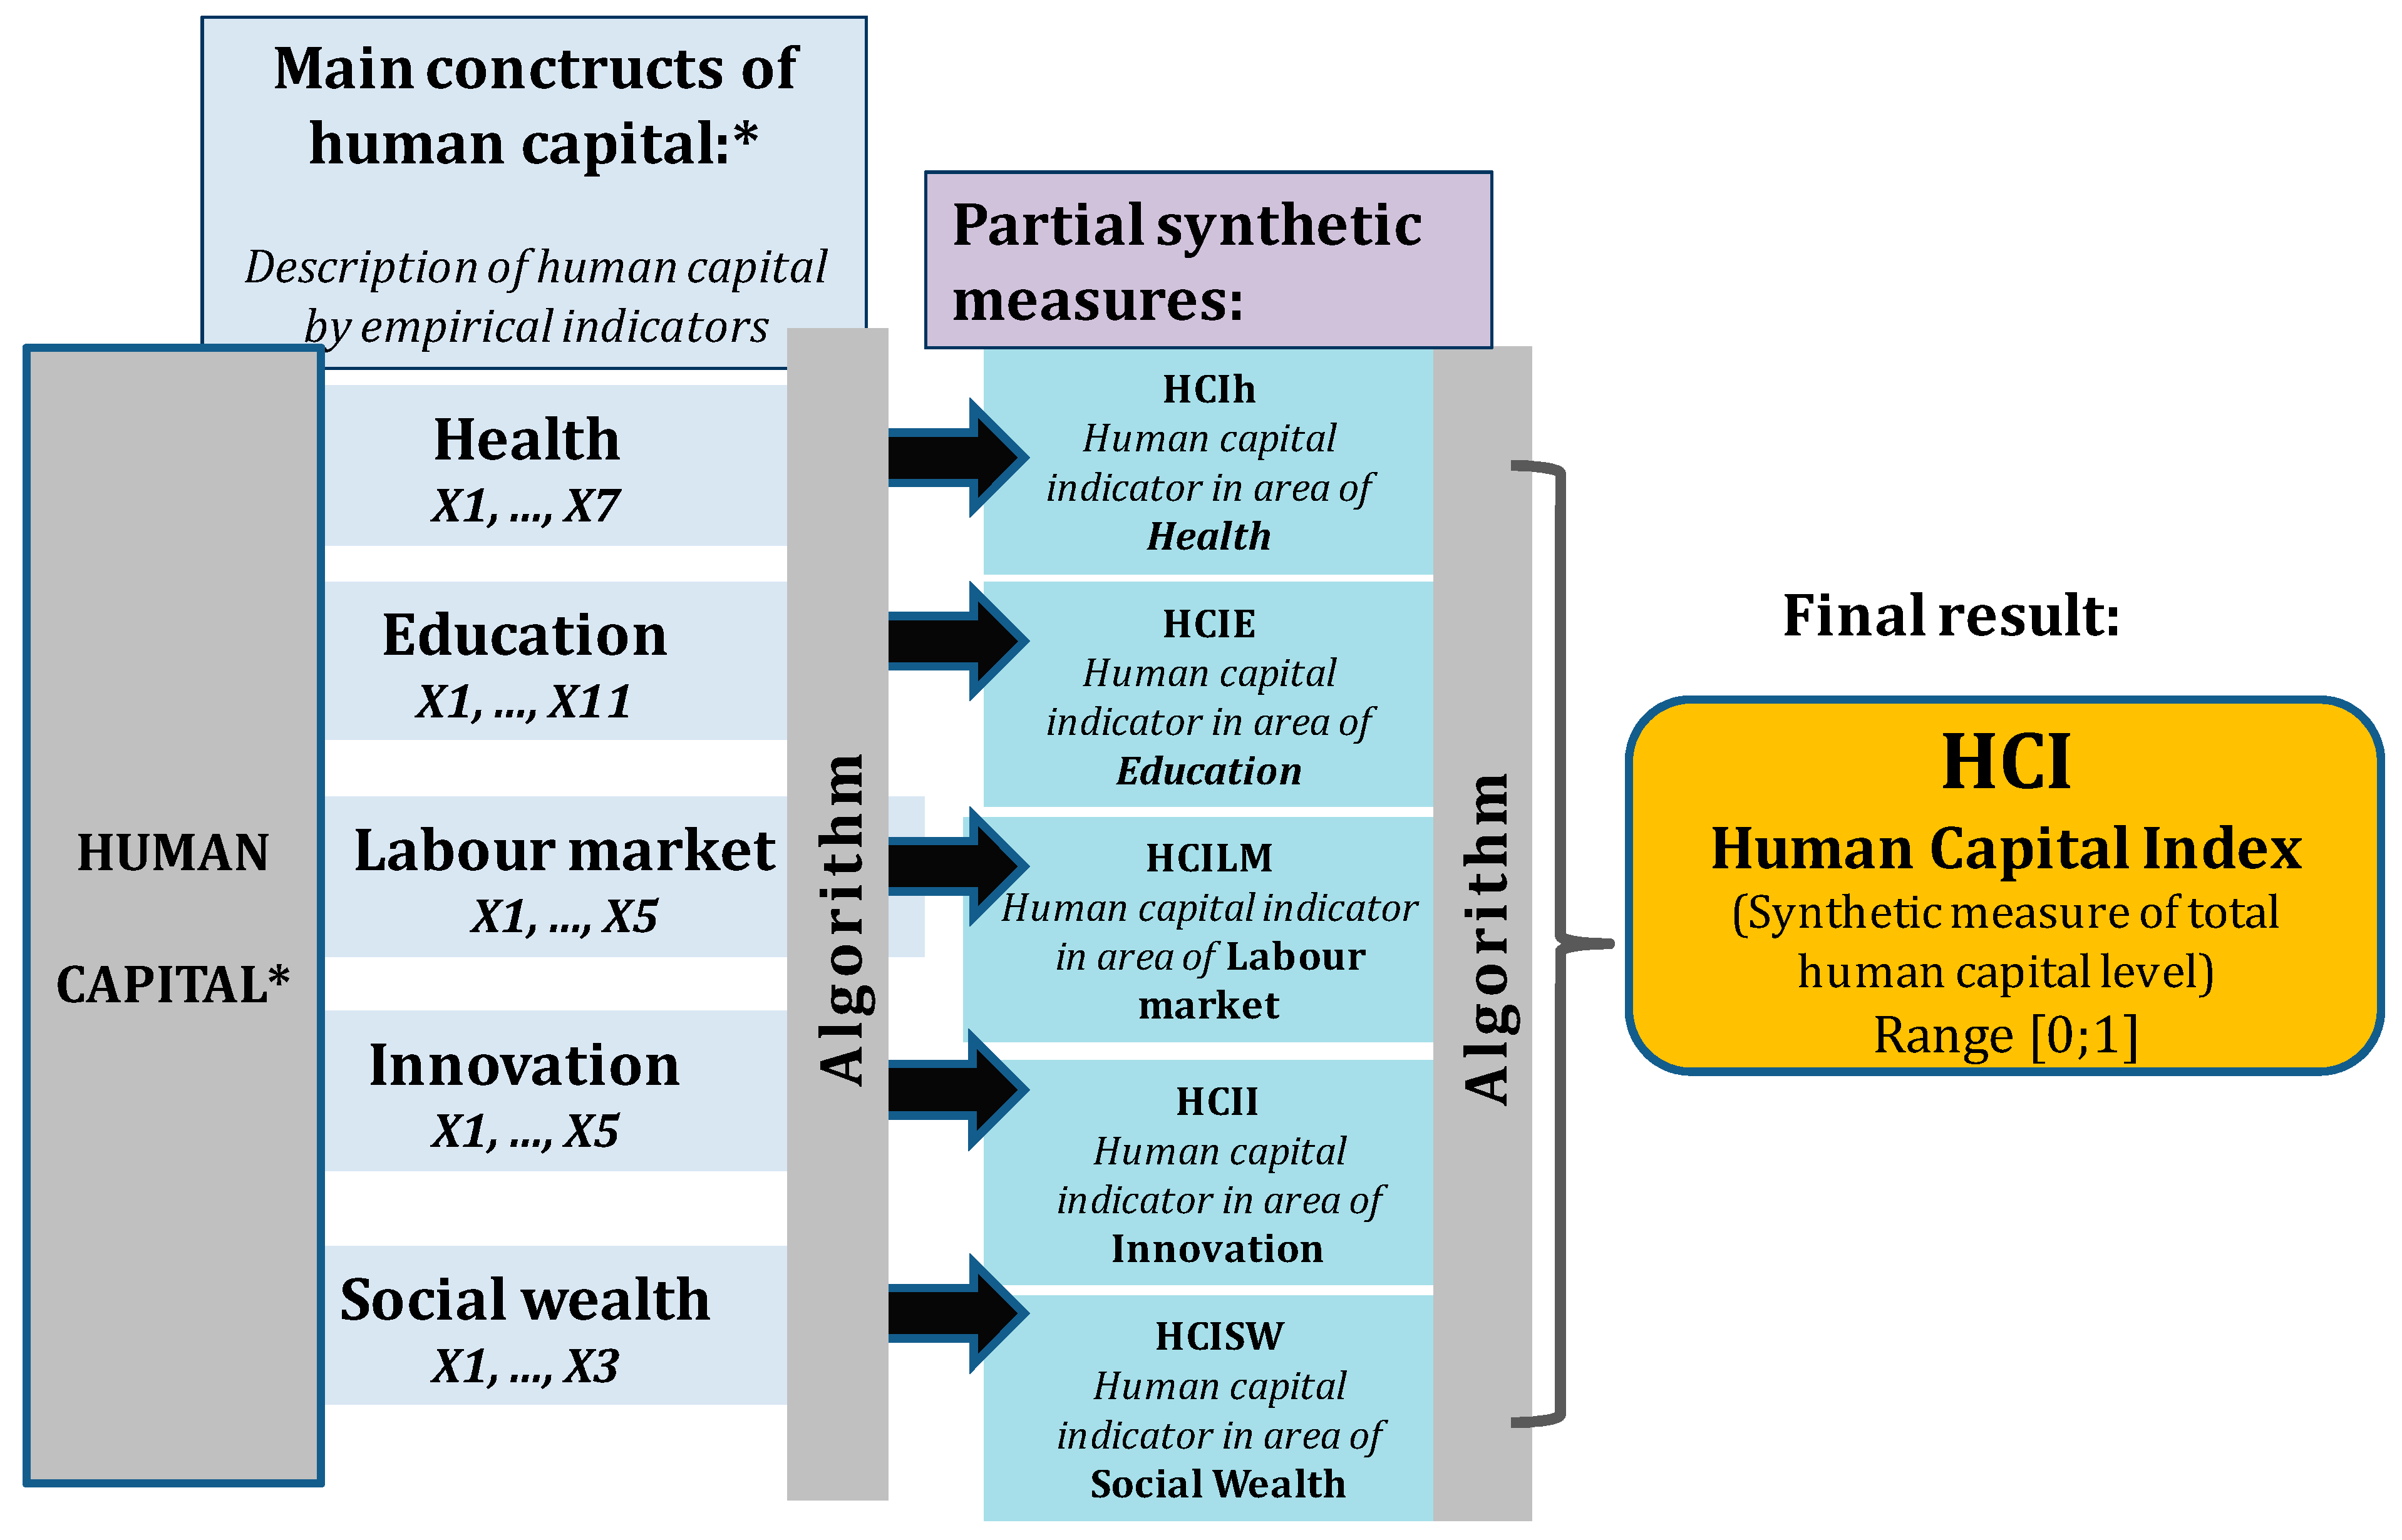
2.2. Definition of Human Capital and Its Operationalisation

In this article, the expression of the essence of human capital and its measurement was modelled on the methodology described in works dealing with the issue of measuring and diagnosing human capital in rural areas of Poland [16]. The subject of the analysis was the general level of the Human Capital Index (HCI). The reference point for the development of the synthetic measure (HCI) were the multi-criteria (synthetic) measures characterising the quality of human capital developed separately by researchers from the Department of Statistical and Economic Research of the Central Statistical Office and the Polish Academy of Sciences [60], but above all the methodology of the World Bank [17].
In the research conducted, the fundamental issue was to define what human capital is and to express its essence through appropriate empirical characteristics (so-called diagnostic indicators), as well as to adopt an appropriate measure for its measurement. The conceptual approach adopted was a broad definition of human capital [34]. To express its essence, five components of its structure were considered in the following areas: innovation and creativity, health, education, social welfare, and the labour market (see Figure 1). In the author’s opinion, they seem to best reflect the potential of human resources necessary for the implementation of all socio-economic processes that should lead to the development and improvement of the well-being of both individuals and entire societies (cf. [61]).

2.3. Method and Scope of Data. Description of the Synthetic Measure of the General Level of Human Capital (HCI)

The analysis of the level and distribution of human capital was carried out based on the taxonomic method of hierarchisation (patternless) and classification of multi-featured objects, adequate to the study of complex phenomena, which undoubtedly is human capital [62,63,64].
The essence of human capital in each of the components of its structure was expressed through the selection of selected diagnostic features (x1, …, xn), based on extensive literature and the empirical experience of other authors. In the first stage of the study, the selection and selection of diagnostic variables were made to express the essence of human capital (Table 1) in order to create a matrix in the form of X = [xij] [64]:
X = x i j   = x 11 x 12 x 1 n x 21 x 22 x 2 n x r 1 x r 2 x r n       i = 1 ,   ,   r j = 1 ,   ,   n ,
where
i—site (municipality),
j—diagnostic variable.
Table 1. Main empirical variables used to describe human capital in each structural component.
Main Components of the Human Capital StructureEmpirical VariablesSource
Innovation (HCI)X1 Share of newly registered creative sector entities in the total number of newly registered business entities in the REGON systemLocal Data Bank
Central Statistical Office
X2 Share of entities in section M in the total number of economic entities in the REGON systemLocal Data Bank
Central Statistical Office
X3 Number of applications in the Human Capital operational program per 10 thousand inhabitantsLocal Data Bank
Central Statistical Office
X4 Number of applications in the Innovative Economy operational program per 10 thousand inhabitantsLocal Data Bank
Central Statistical Office
X5 Number of European Union applications per 10 thousand inhabitants, 2007–2013 Local Data Bank
Central Statistical Office
Labour Market [HCLM]X1 Entities entered in the REGON register per 10 thousand population of working ageLocal Data Bank
Central Statistical Office
X2 Migration attractiveness index for internal migration, presenting the relationship of migration balance to migration turnoverInstitute of Rural Development and Agriculture, Polish Academy of Sciences
X3 Youth potential index expressed as the share of the number of people of pre-working age to the total number of people of post-working ageLocal Data Bank
Central Statistical Office
X4 Population of post-working age per 100 people of pre-working ageLocal Data Bank
Central Statistical Office
X5 Percentage of unemployed people in the number of people of working ageLocal Data Bank
Central Statistical Office
Health [HCH]X1 Average number of medical consultations in the field of outpatient health care regarding primary and specialised health care, including consultations provided in clinics of the Ministry of National Defence and the Ministry of Internal Affairs per 1 thousand inhabitantsLocal Data Bank
Central Statistical Office
X2 Live births per 1000 population—birth rateLocal Data Bank
Central Statistical Office
X3 Deaths per 1000 population—death rateLocal Data Bank
Central Statistical Office
X4 Share of disabled people in the total populationLocal Data Bank
Central Statistical Office
X5 Natural increase per 1000 populationLocal Data Bank
Central Statistical Office
X6 Share of people aged 0–14 in the number of people aged 60+Local Data Bank
Central Statistical Office e
X7 Share of people aged up to 14 in the number of people aged 15–29 (generation replacement rate)Local Data Bank
Central Statistical Office
Education [HCE]X1 Gross enrolment ratio for primary schoolsLocal Data Bank
Central Statistical Office
X2 Gross enrolment coefficient for junior high schoolLocal Data Bank
Central Statistical Office
X3 Lending book collections per reader in volumesLocal Data Bank
Central Statistical Office
X4 Declared readers of public libraries per thousand inhabitantsLocal Data Bank
Central Statistical Office
X5 Percentage of children aged 3–5 receiving pre-school educationLocal Data Bank
Central Statistical Office
X6 Percentage of councillors with higher educationNational Census 2011
X7 Percentage of population with higher educationLocal Data Bank
Central Statistical Office
X8 Results of the Primary School test—mathematics and science partDistrict Examination Boards
X9 Results of the junior high school exam—average in the mathematics and science moduleDistrict Examination Boards
X10 Results of the secondary school examination in a foreign language at the basic levelDistrict Examination Boards
X11 Results of the secondary school examination in a foreign language at the advanced levelDistrict Examination Boards
Social wealth [HCSW]X1 Average number of people in families covered by social assistance per 1 thousand populationLocal Data Bank
Central Statistical Office
X2 Share of registered long-term unemployed in the working-age populationMinistry of Family and Social Policy
X3 Average annual income of the taxpayer in the municipality (PIT tax)Ministry of Finance
Source: own elaboration.
Each object was characterised by a vector of diagnostic variables in the form:
x i = x i 1 , x i 2 , x i 3 , x i 4 ,   , x i n      i = 1 ,   ,   r ,
The variables were verified for variability (V > 0.1) and correlations in order to avoid duplicating too much similar information. The condition for establishing synthetic variables was to bring all the initial features to mutual comparability by subjecting them to normalisation.
For stimulants:
z i j = x i j min k = 1 ,   , r x k j max k = 1 ,   , r x k j min i = k ,   , r x k j ,
for destimulants:
z i j = max k = 1 ,   , r x k j x i j max k = 1 ,   , r x k j min k = 1 ,   , r x k j ,
z i j 0,1 ,   i = 1,2 , , r ,   j = 1,2 , , n ,
As a result, the original features of X were transformed into normalised Z features. The X matrix with dimensions (r × n) goes into the Z matrix with the same dimensions in the form:
Z = ( z i j ) = z 11 z 12 z 1 n z 21 z 22 z 2 n z r 1 z r 2 z r n ,
Each object is described with a vector of normalised features in the following form:
z i = z i 1 ,    z i 2   z i n      i = 1 ,   ,   r ,
In the next step, partial variables were aggregated according to the formula:
q i = j = 1 n z i j       i = 1 ,   ,   r ,
As a result of dividing the value of Qi by the number of diagnostic variables n, the synthetic variables Qi in the i-th object were obtained, expressing the assessment of each of the studied objects (municipalities) and falling within the range [0;1]. On the basis of the estimated values of the synthetic index Qi, the objects were linearly ordered according to the level of a given complex phenomenon in such a way that the first place was taken by the object with the highest Qi value and the last place by the object with the lowest Qi value.
The so-called partial synthetic measures were estimated for each component of the structure. These measures could be used separately to characterise rural areas, but this was not the subject of the research in this article. However, they were subjected to a further algorithm to obtain the overall level of the Human Capital Index (HCI) (see Figure 1). Specific expert weights were applied to each of the sub-measures in order to avoid excessive subjectivity on the part of the author.
The synthetic measures expressing the level of human capital (HCI) formed the basis for the hierarchisation and classification of municipalities, as well as for further analyses and comparisons regarding the links with the structure of socio-economic development achieved by municipalities. The classification of spatial units (municipalities) was carried out using an ex-post approach [2,47,48].
The main sources of data (diagnostic variables) for the construction of the Human Capital Index (HCI) were the Local Database of the Central Statistical Office (BDL GUS), the National Population Census (NSP 2011), the Ministry of Finance, the Ministry of Family and Social Policy (current name), and the District Commission Examinations in Poland.

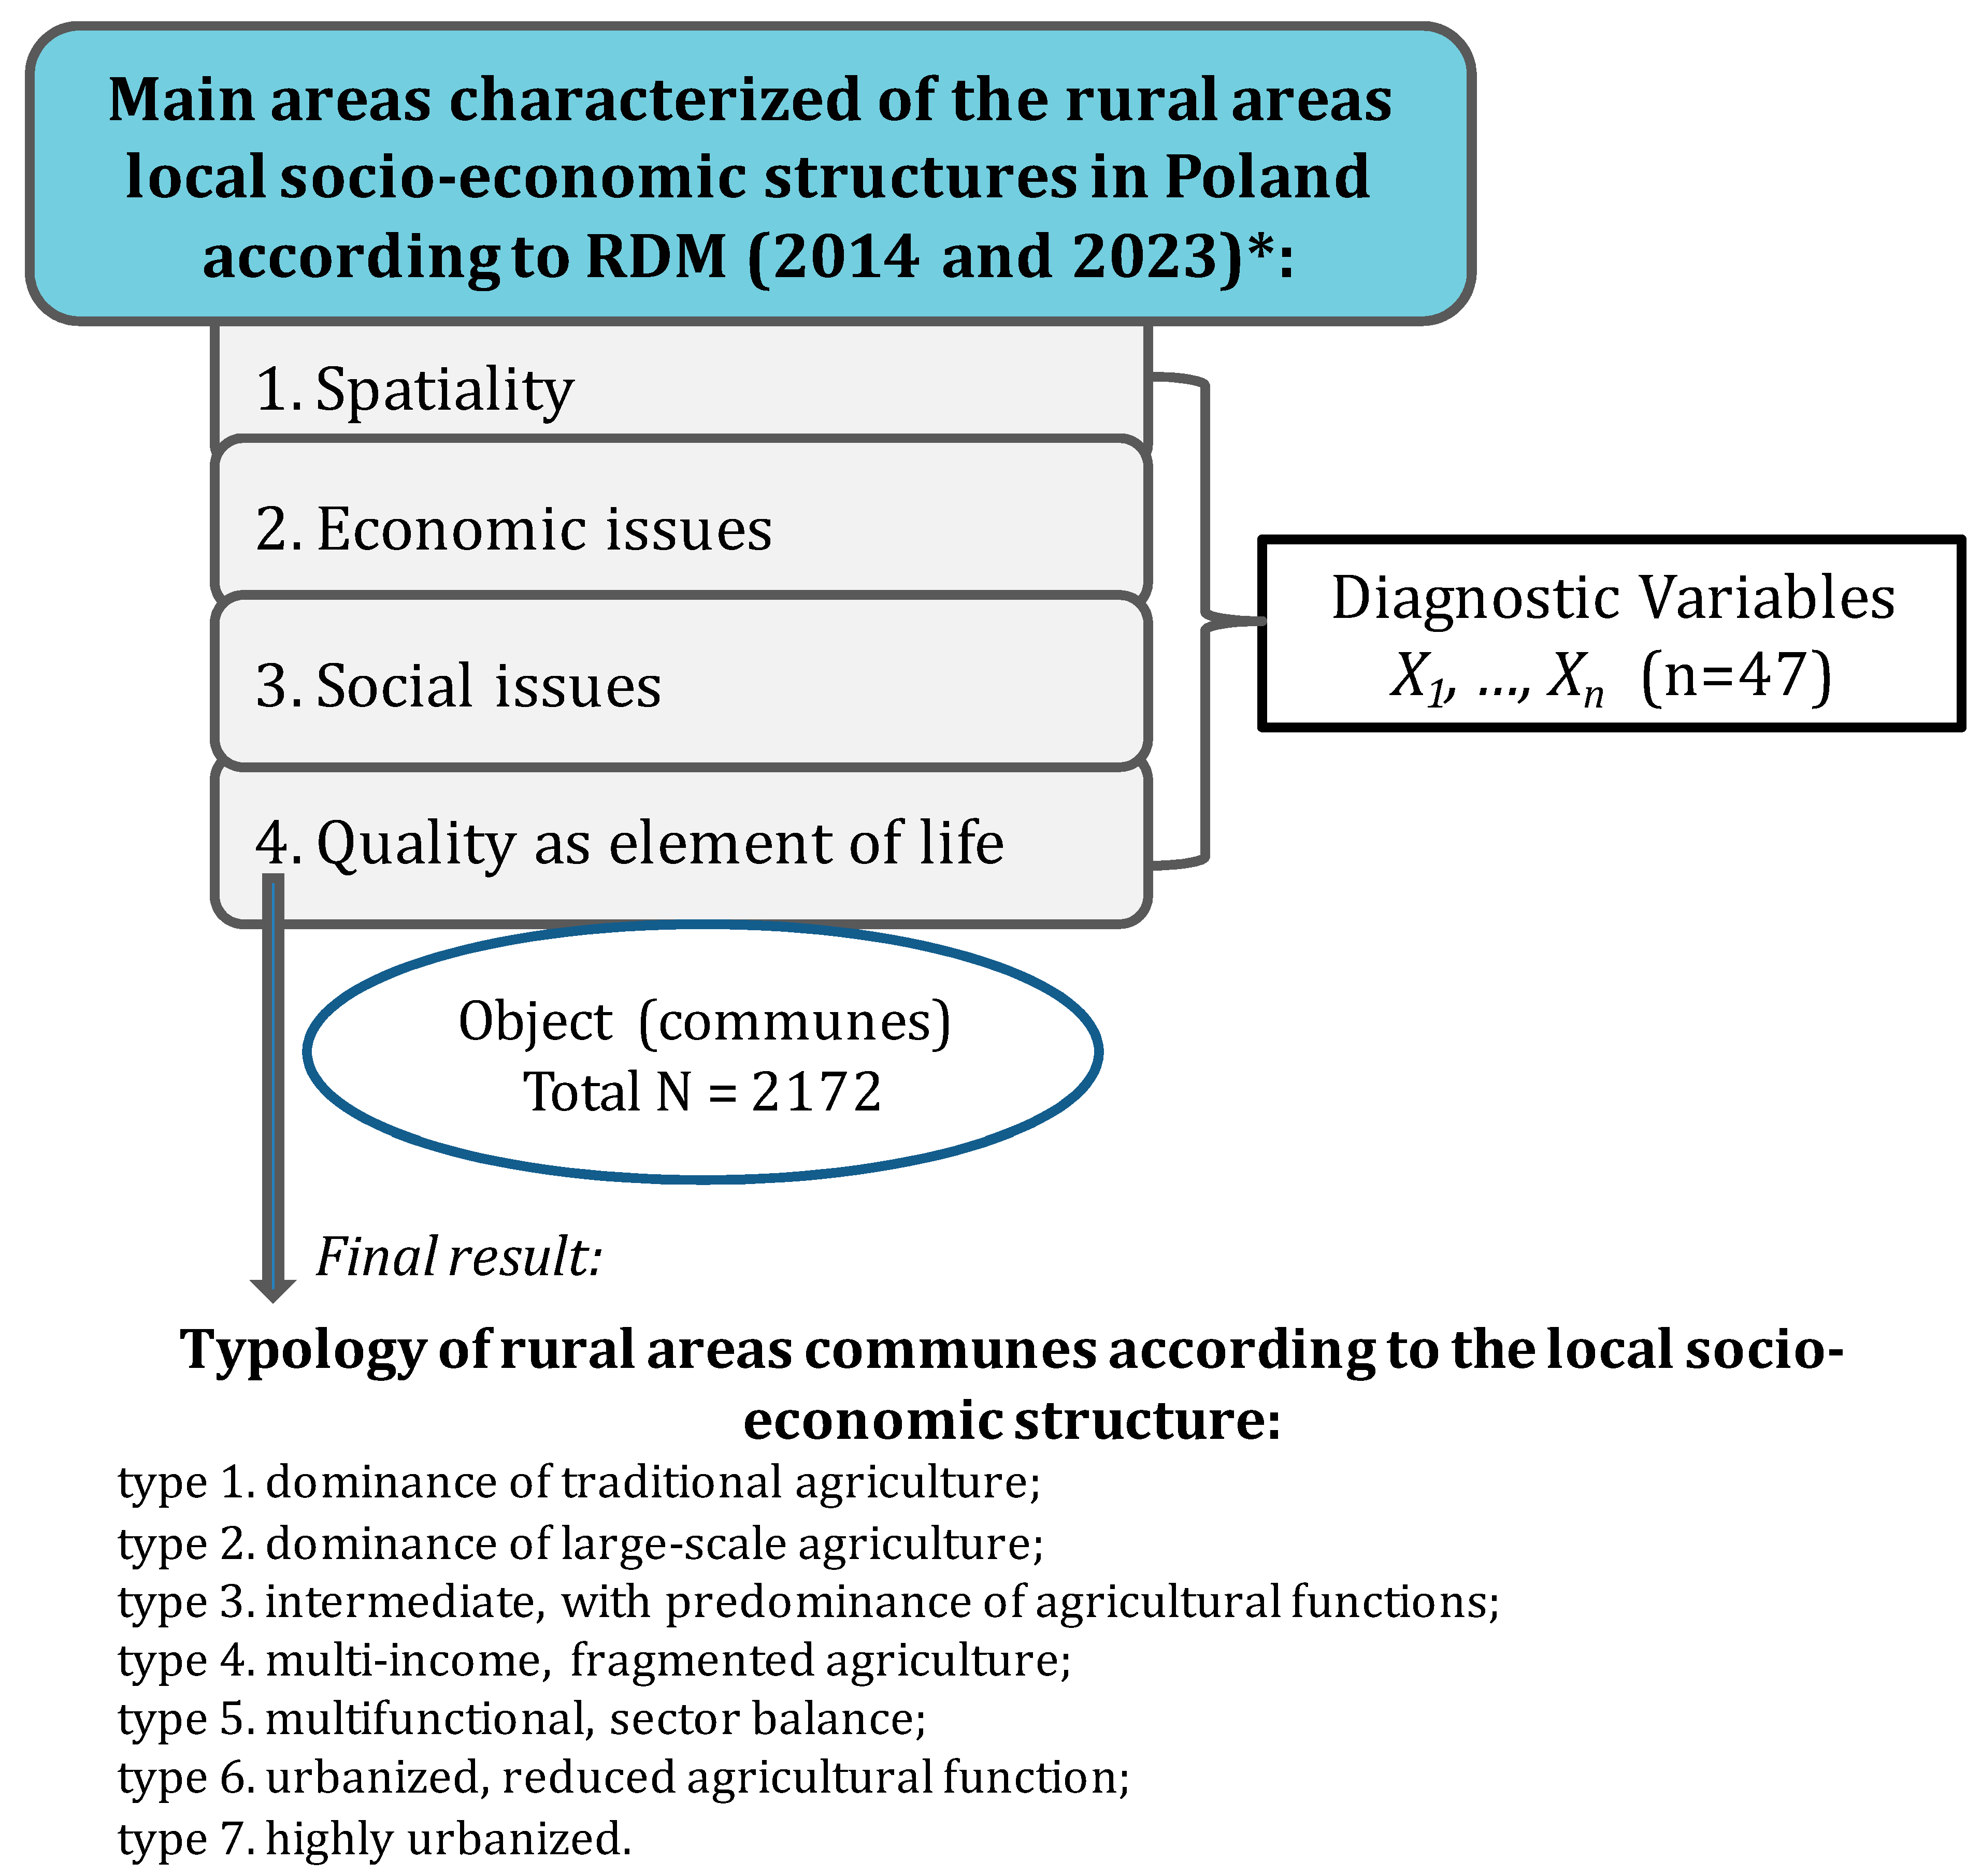
2.4. Definition and Characterisation of the Structure of Socio-Economic Development Processes in Rural Areas in Poland According to the RDM Methodology

In the conceptual approach used, both the definition of the level of socio-economic development and the characteristics of socio-economic structures in rural areas were based on the methodology of monitoring rural development (RDM stage 1 2014) and 2023 (RDM stage 4 2023) developed by scientists from the Institute of Rural Development and Agriculture of the Polish Academy of Sciences in Poland [1,65]. In this project, which was developed over 10 years, the structure of socio-economic development processes in rural areas was expressed on the basis of seven characterological types of municipalities, which differ in terms of socio-economic structure (i.e., proportions of development components). These are as follows:
Type 1 municipalities, dominance of traditional agriculture;
Type 2 municipalities, dominated by large-scale agriculture;
Type 3 municipalities: intermediate, with a predominance of agricultural functions;
Type 4 municipalities: multi-income, fragmented agriculture;
Type 5 municipalities: multifunctional, sectoral balance;
Type 6 municipalities: urbanised, reduced agricultural function;
Type 7 municipalities: highly urbanised.
A total of 47 empirical measures were used to typologise rural areas in Poland according to RDM in the following areas: 1. spatiality: spatial accessibility; 2. economic issues: degree of deagrarianisation of the local economy, agricultural sector, non-agricultural sector, local public finances, degree of labour market sustainability; 3. social issues: demographic issues, educational issues, social activity, wealth, and cohesion of the local community; and 4. quality of life element: elements of housing conditions. Detailed data and the methodology used to develop them, as well as the characteristics of each type of rural area in the RDM, were obtained from the FEFRWP. The implications of the typologisation in the form of a graphical representation of the spatial analysis can be found in published reports and scientific publications ([16,65,66]).

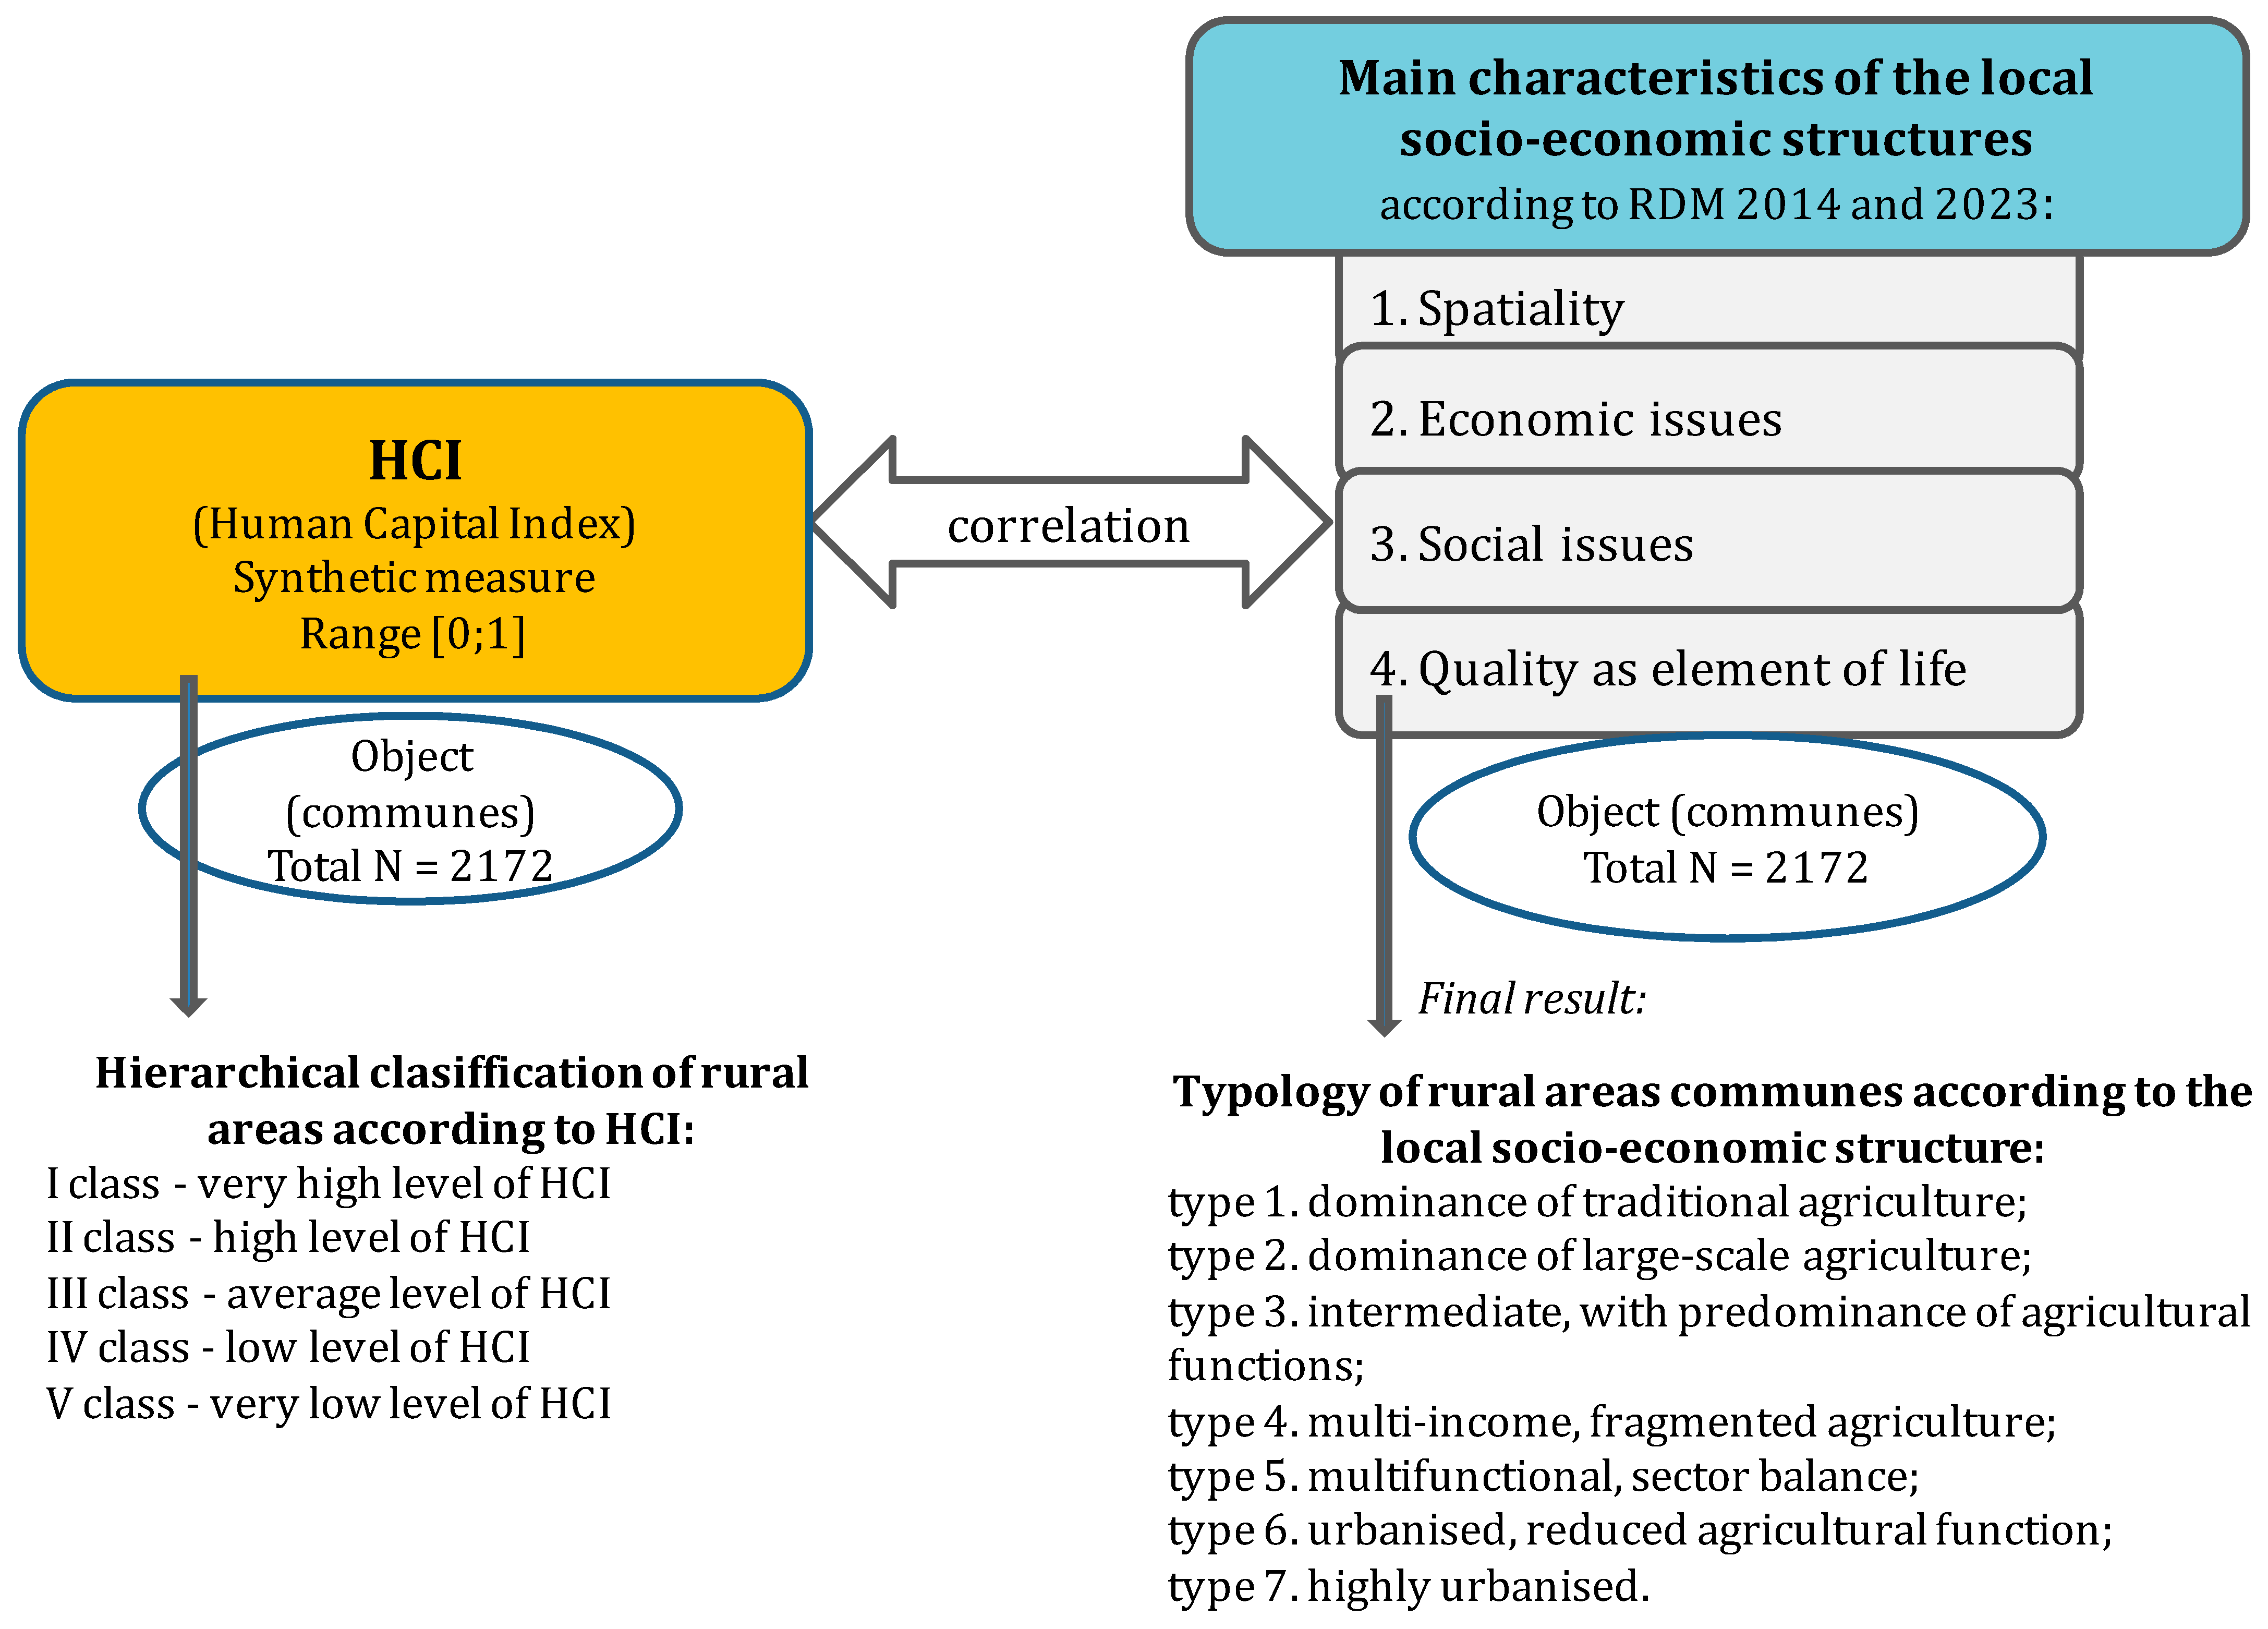
2.5. Analysis of the Connections between the Level of Human Capital and the Structure of Socio-Economic Development Processes

In order to verify the hypothesis about the existing relationship between the level of human capital expressed by the level of the synthetic measure (HCI) and the type of rural area due to the structure of socio-economic development according to the RDM typology, the chi-square statistical test of independence of the community with the Yates correction was used. Czuprow’s convergence coefficient was used to assess the strength of the relationship [67].
Both projects used the lowest rural level of data aggregation. This was a necessary condition for the success of the study and for ensuring the comparability of data at the level of each municipality. In the article, the concept of region is treated in the same way as the concept of voivodship. The terms village and rural area are used interchangeably.

3. Results

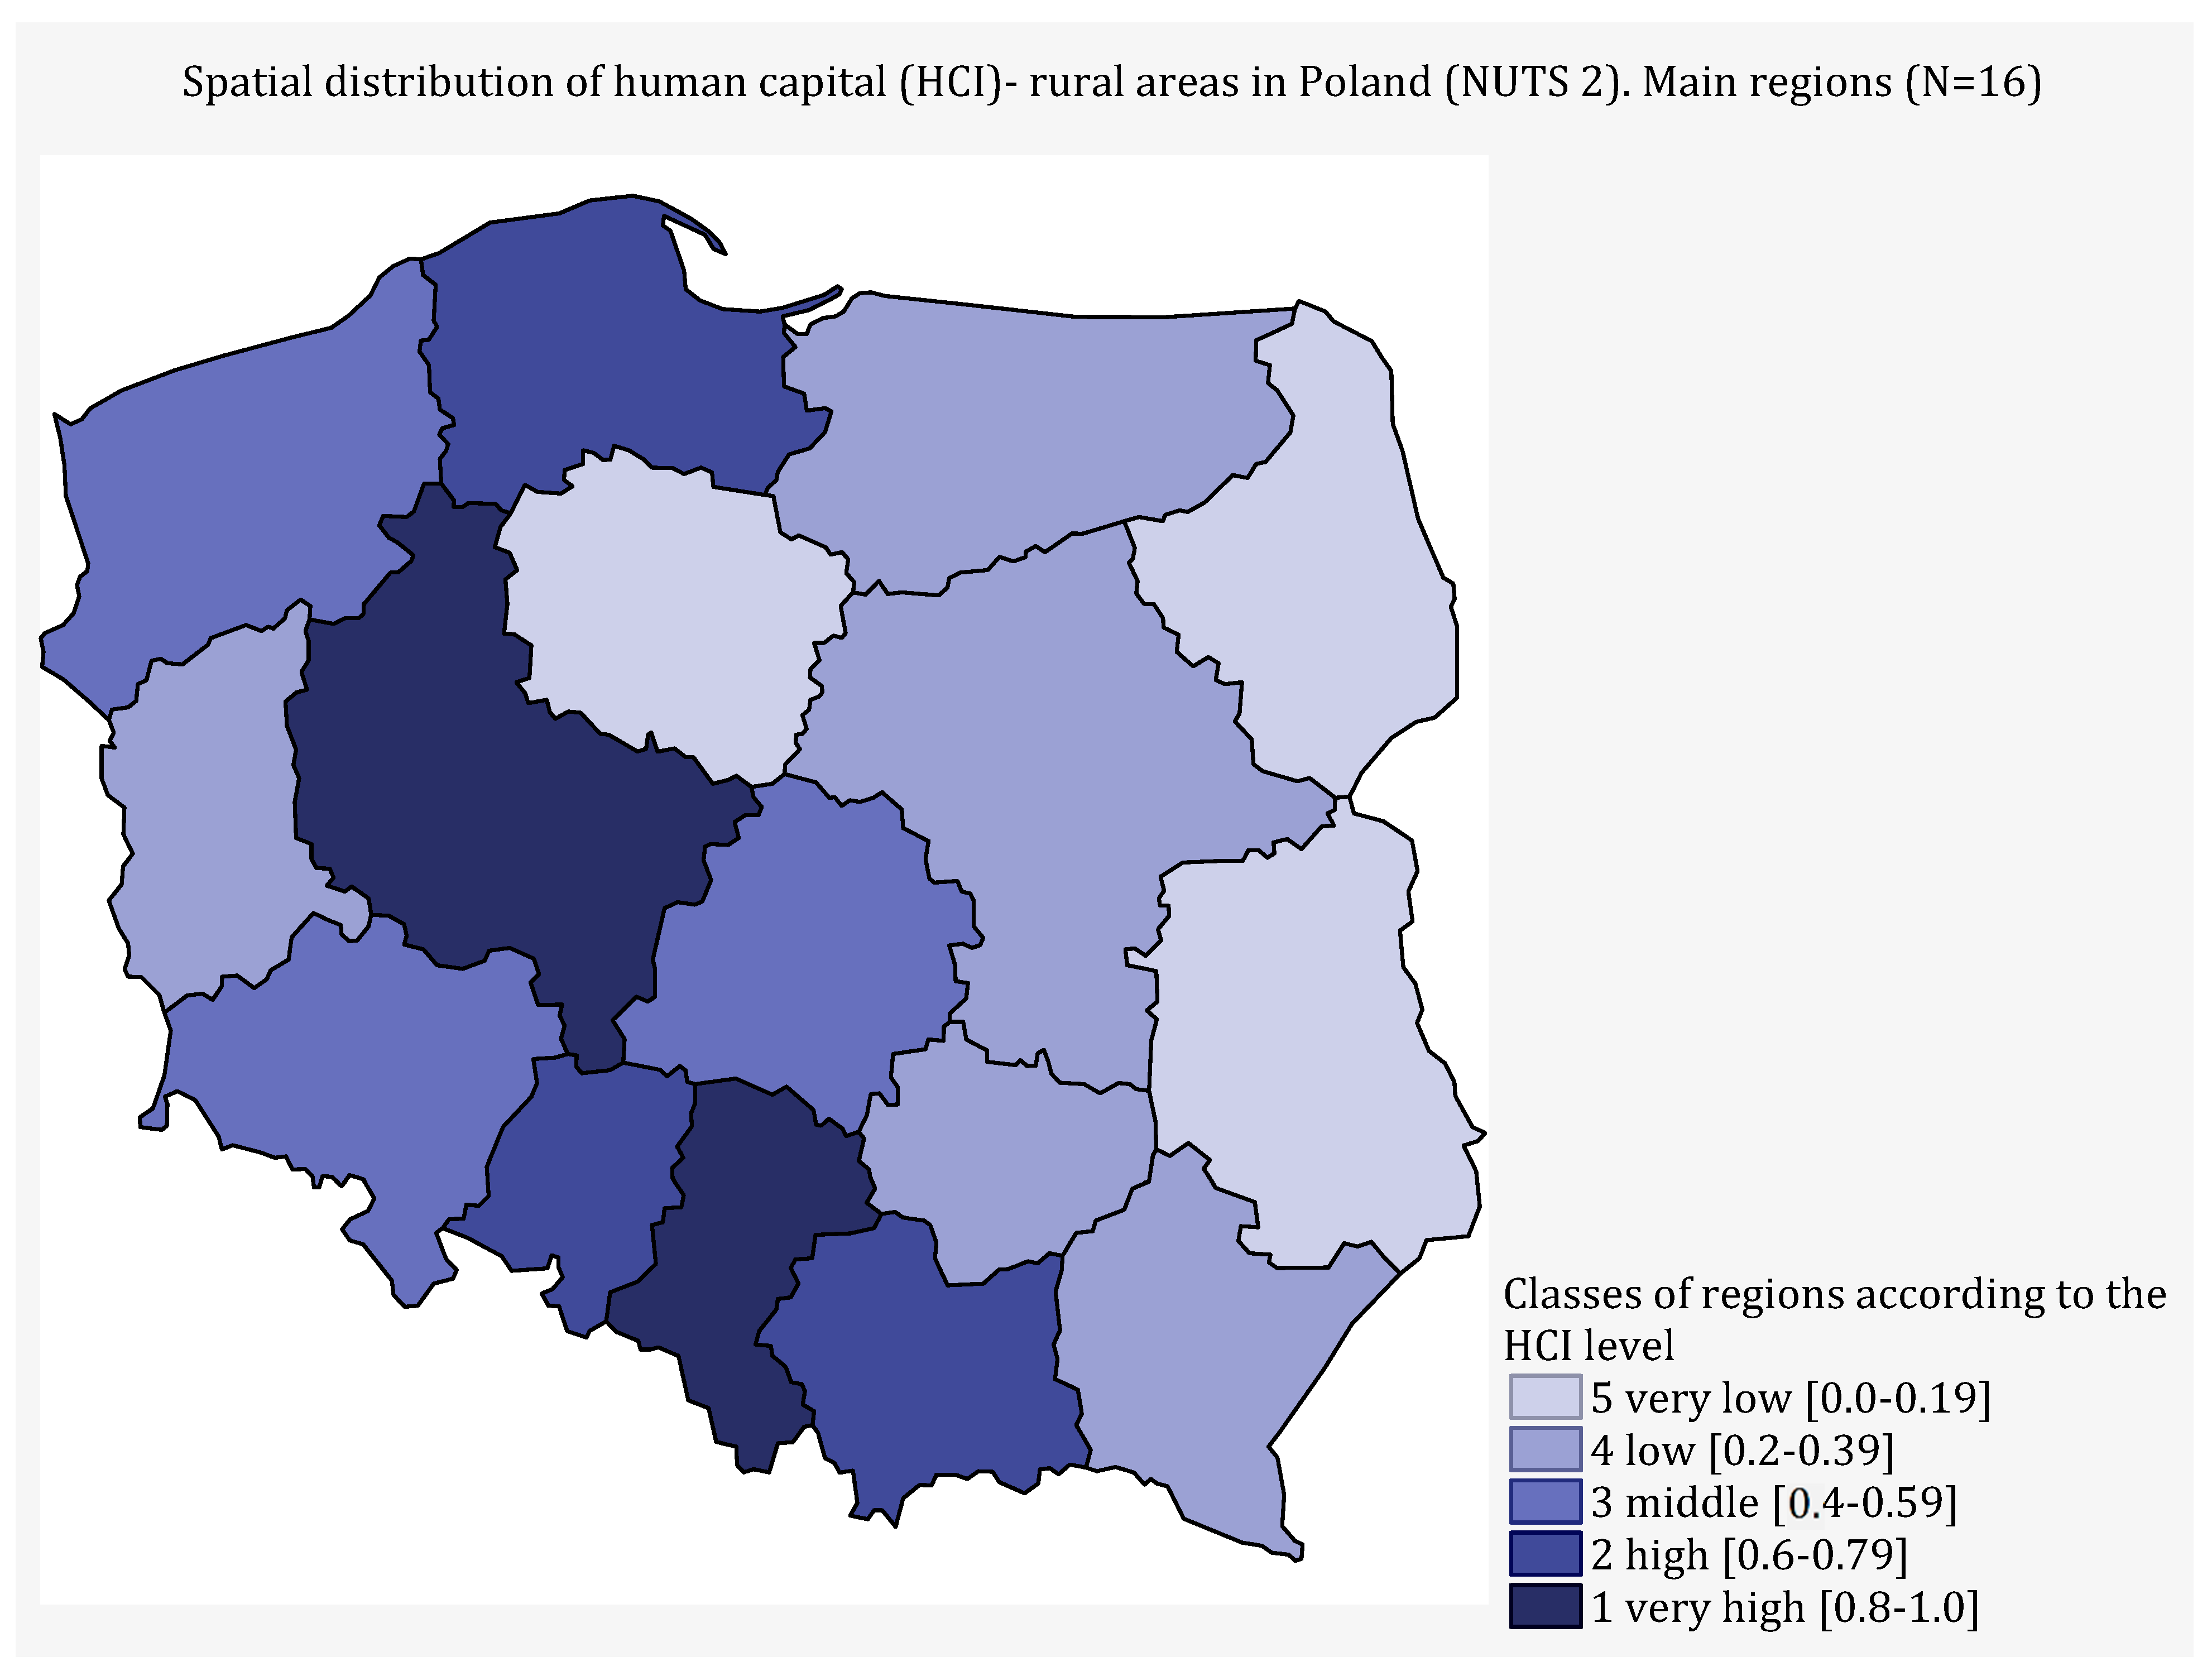
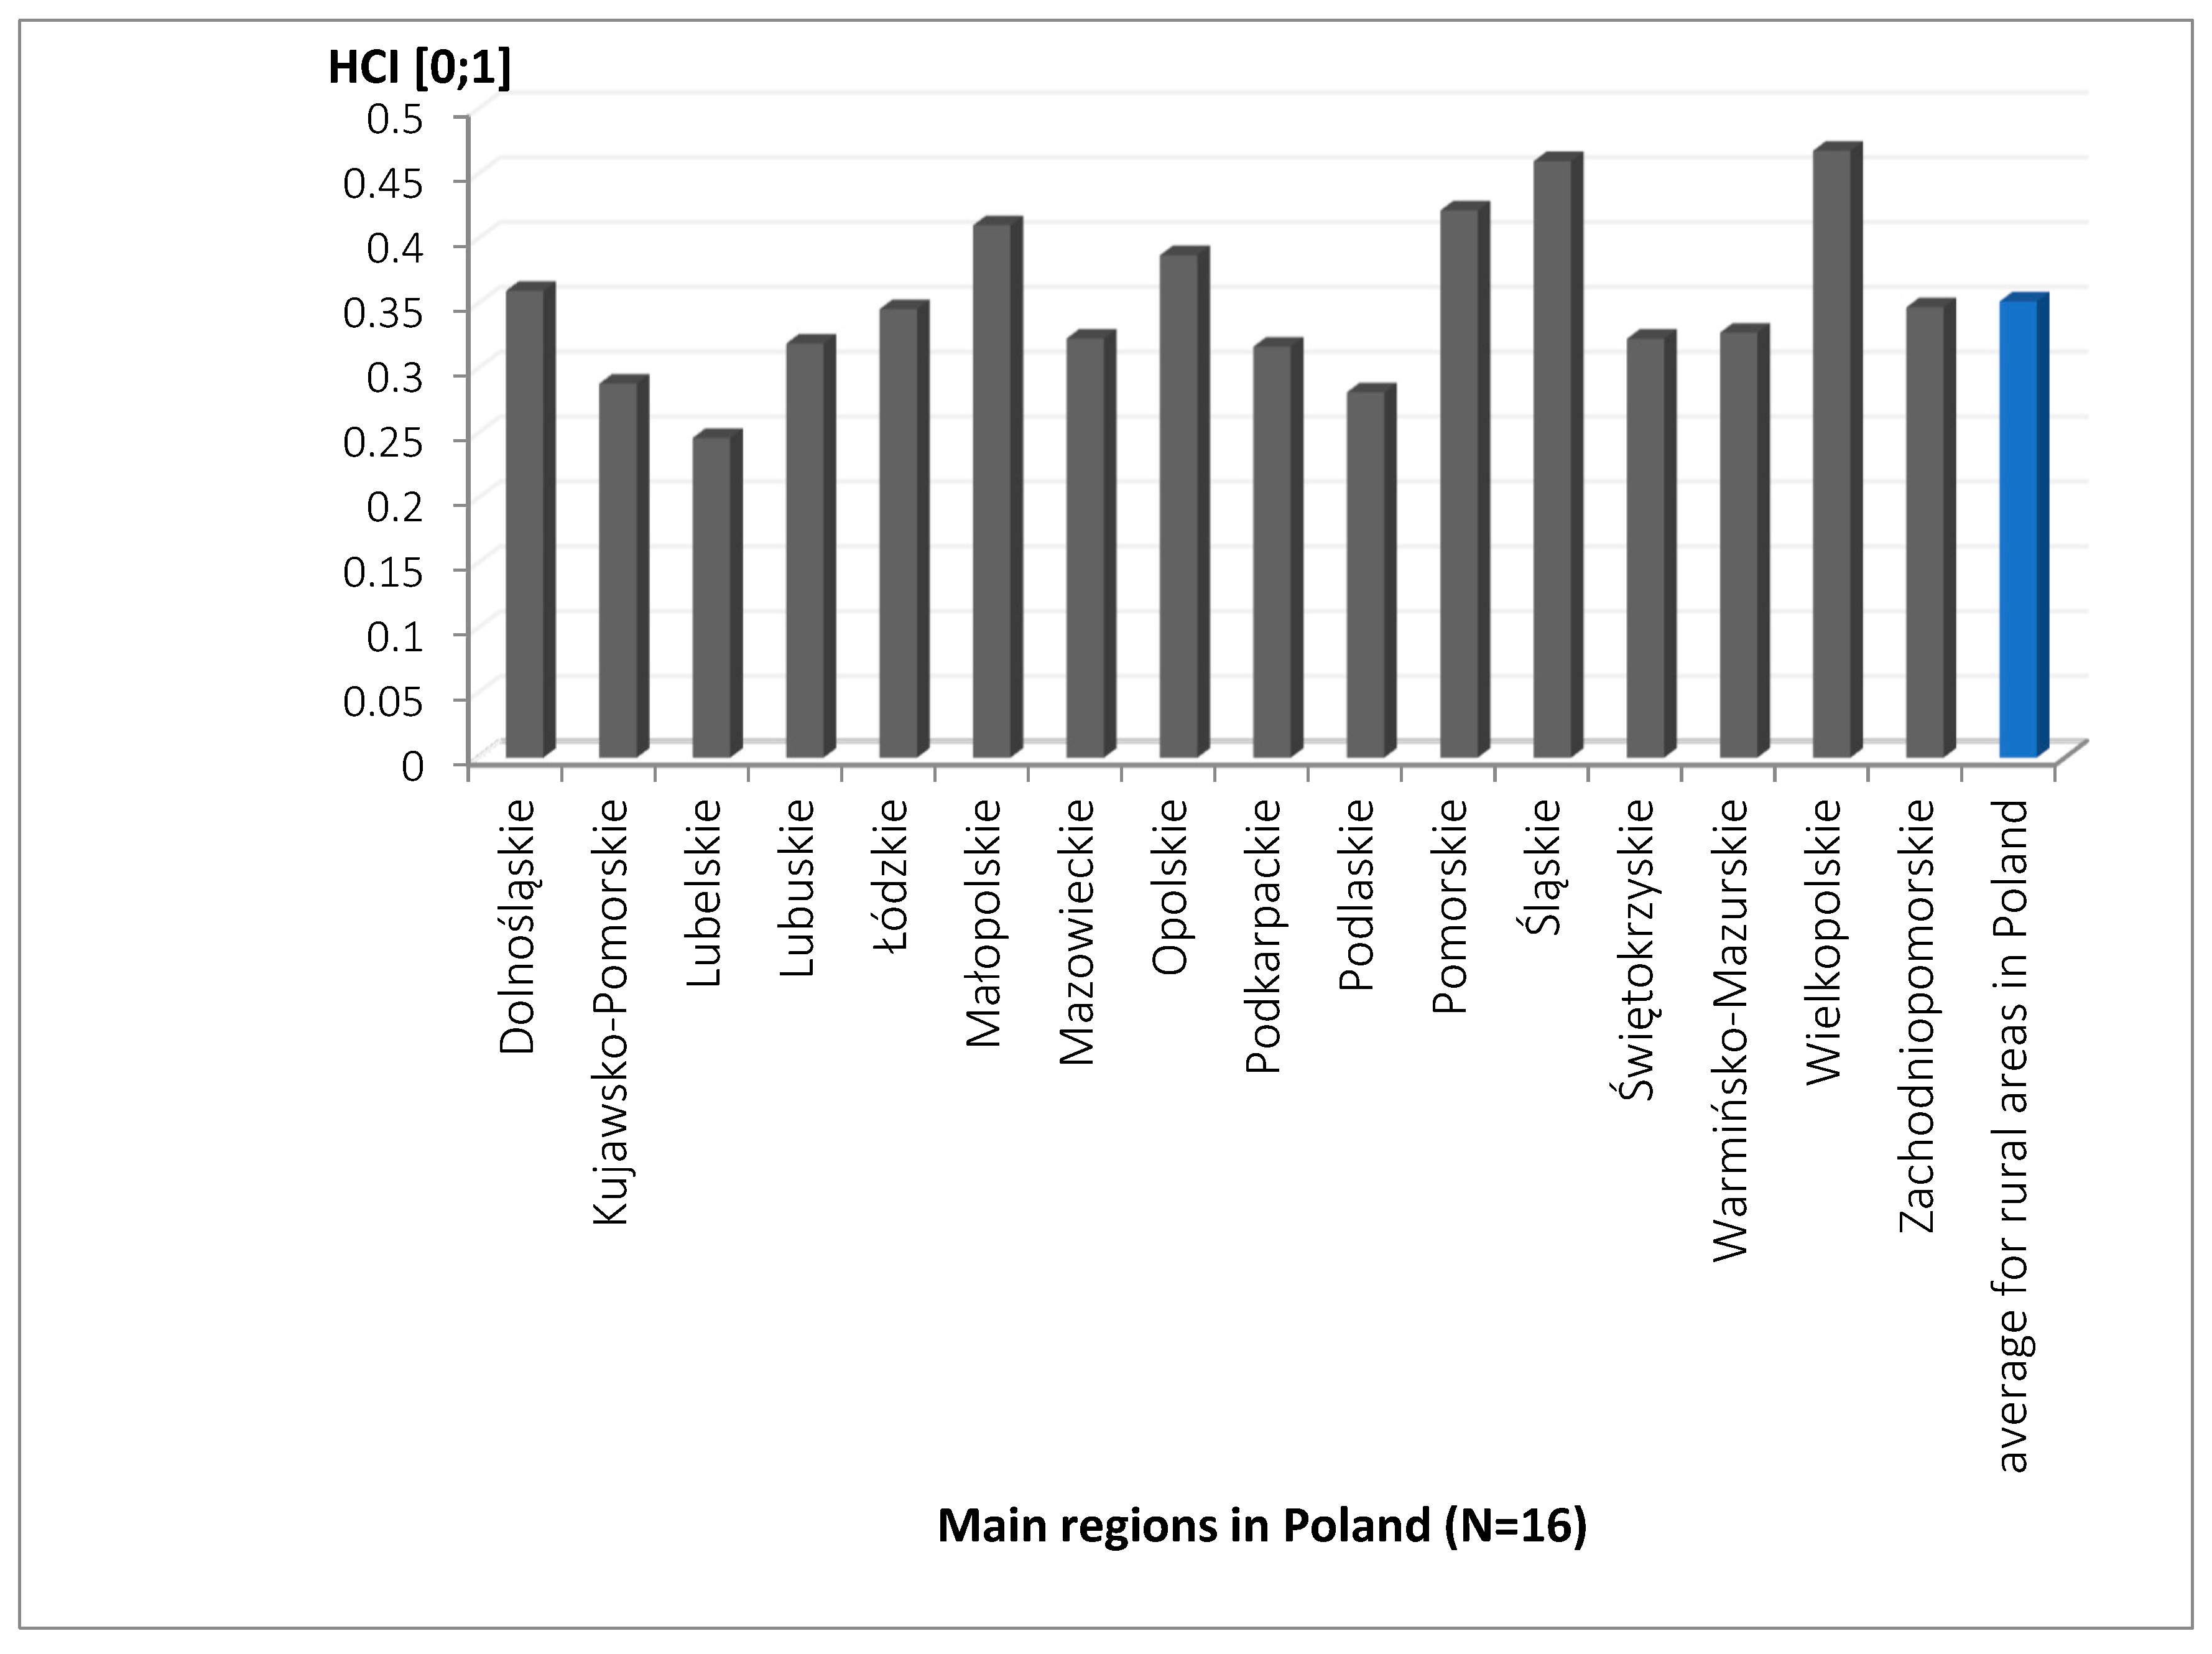
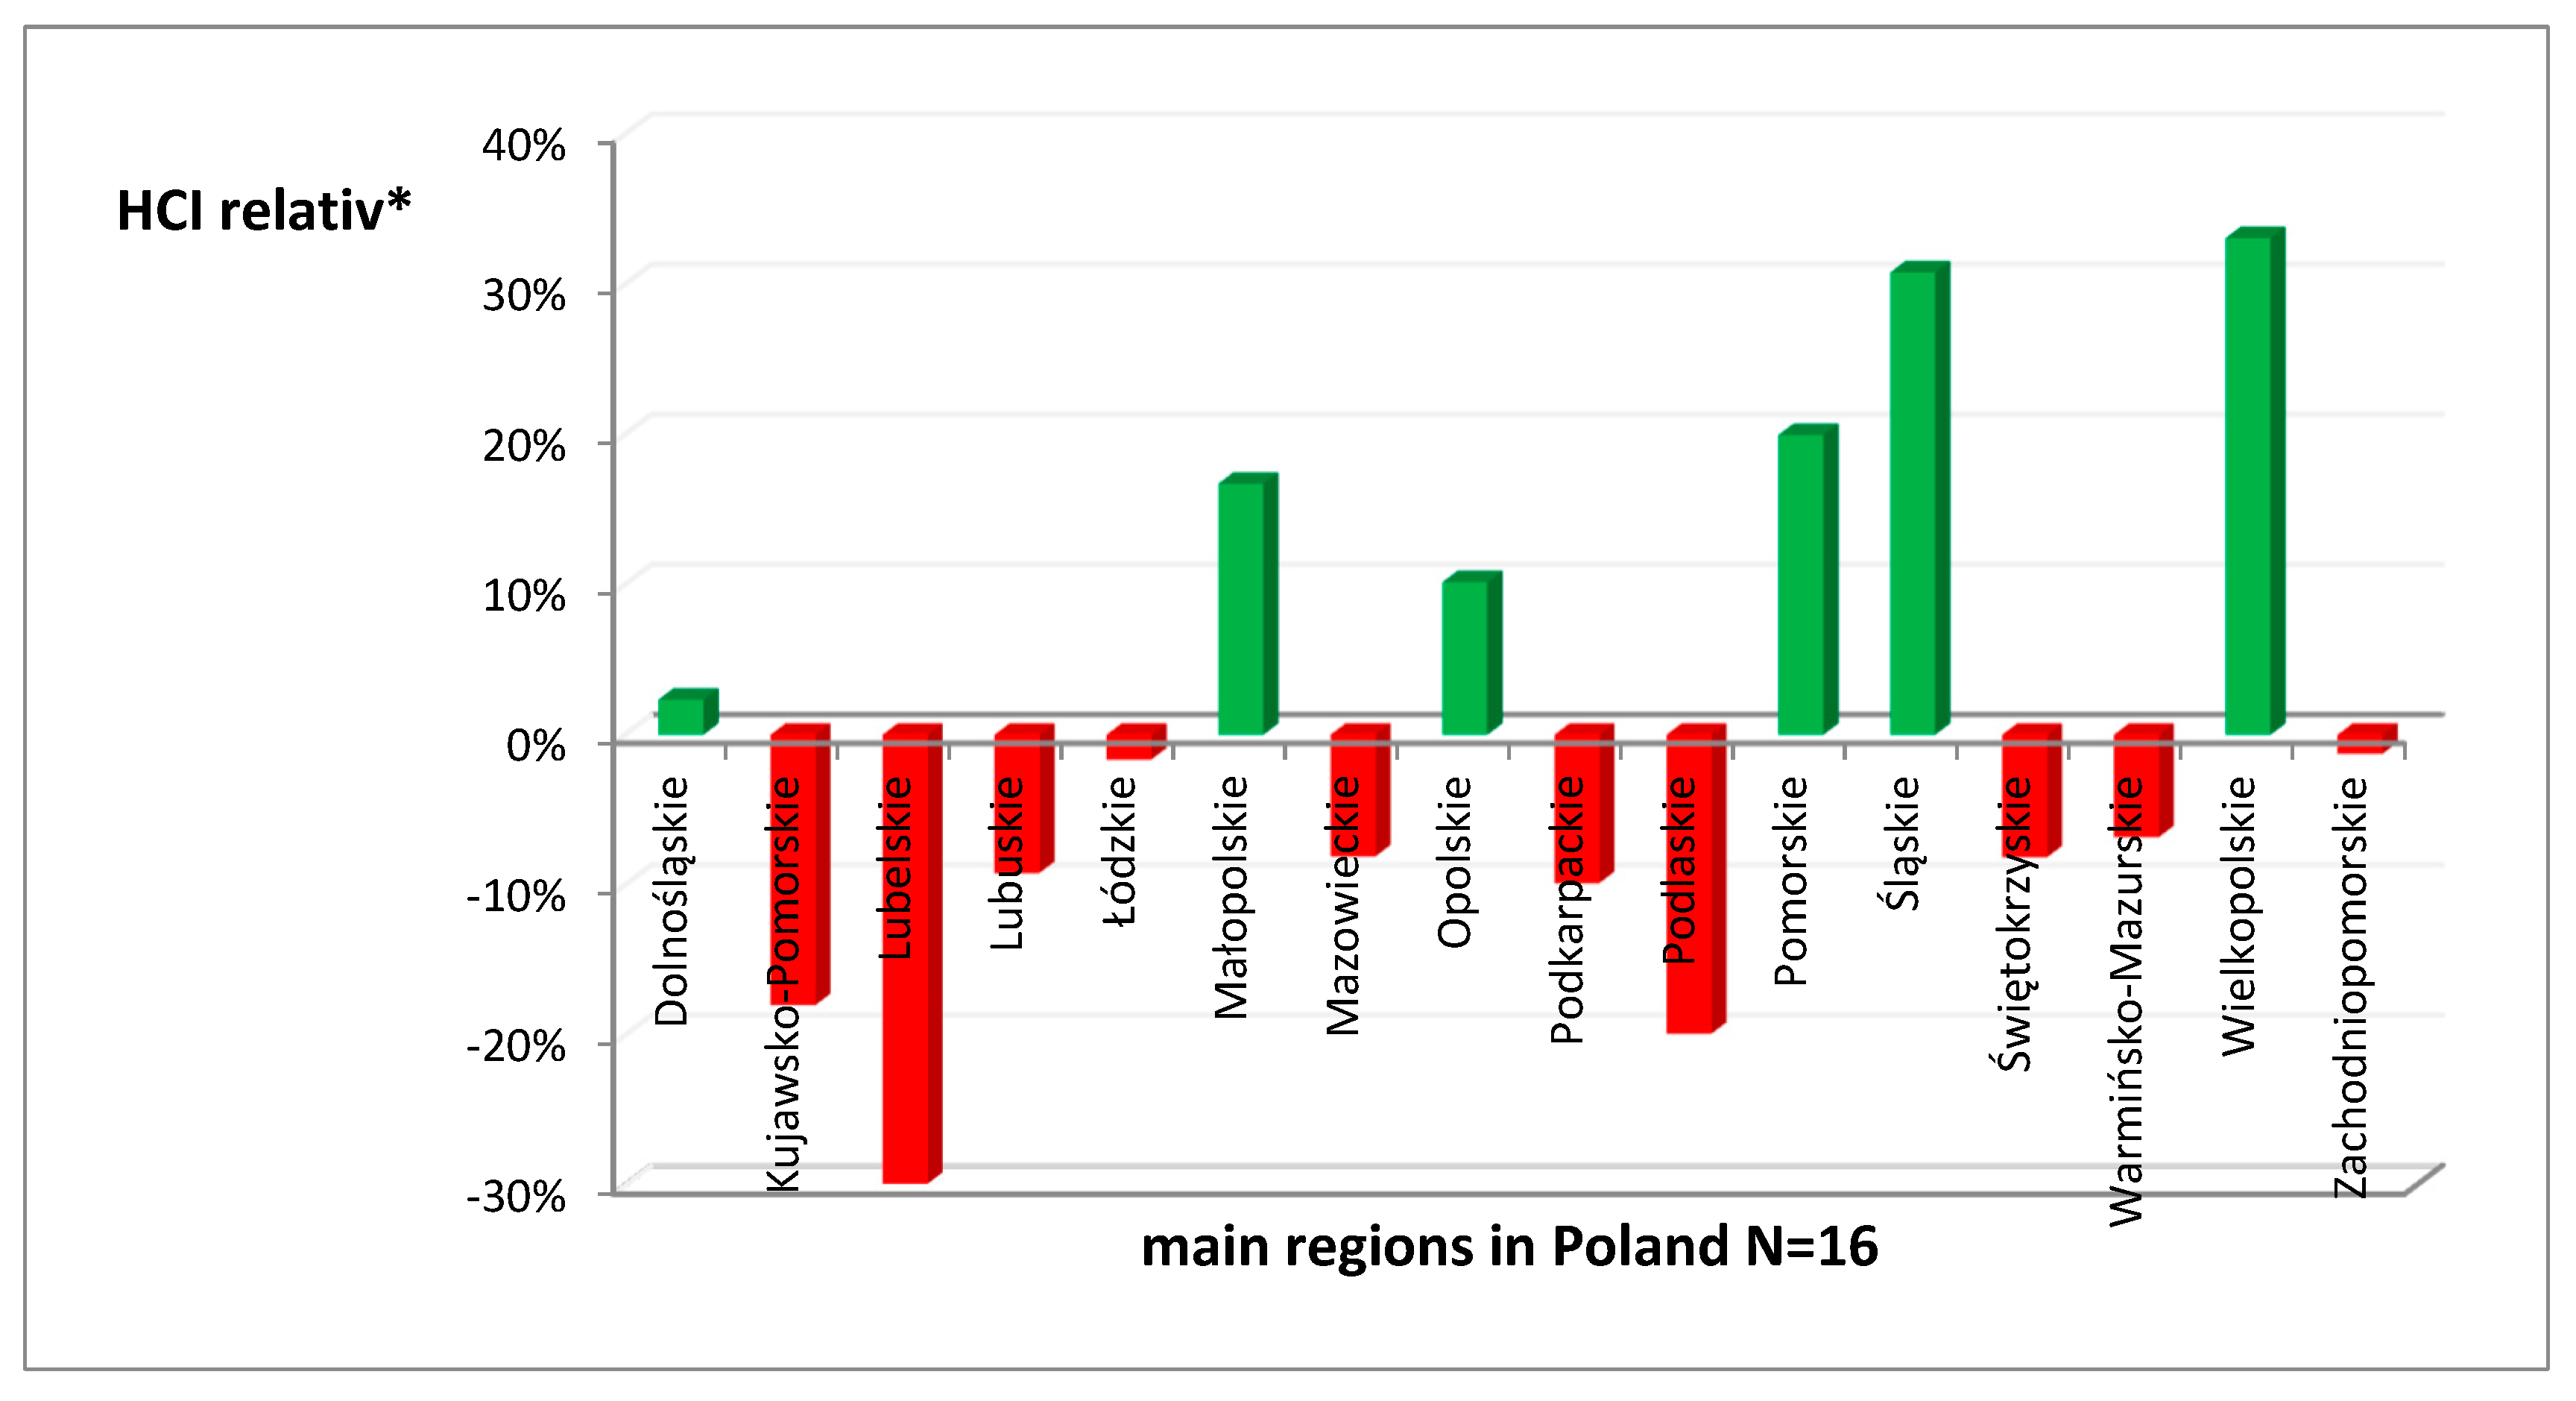
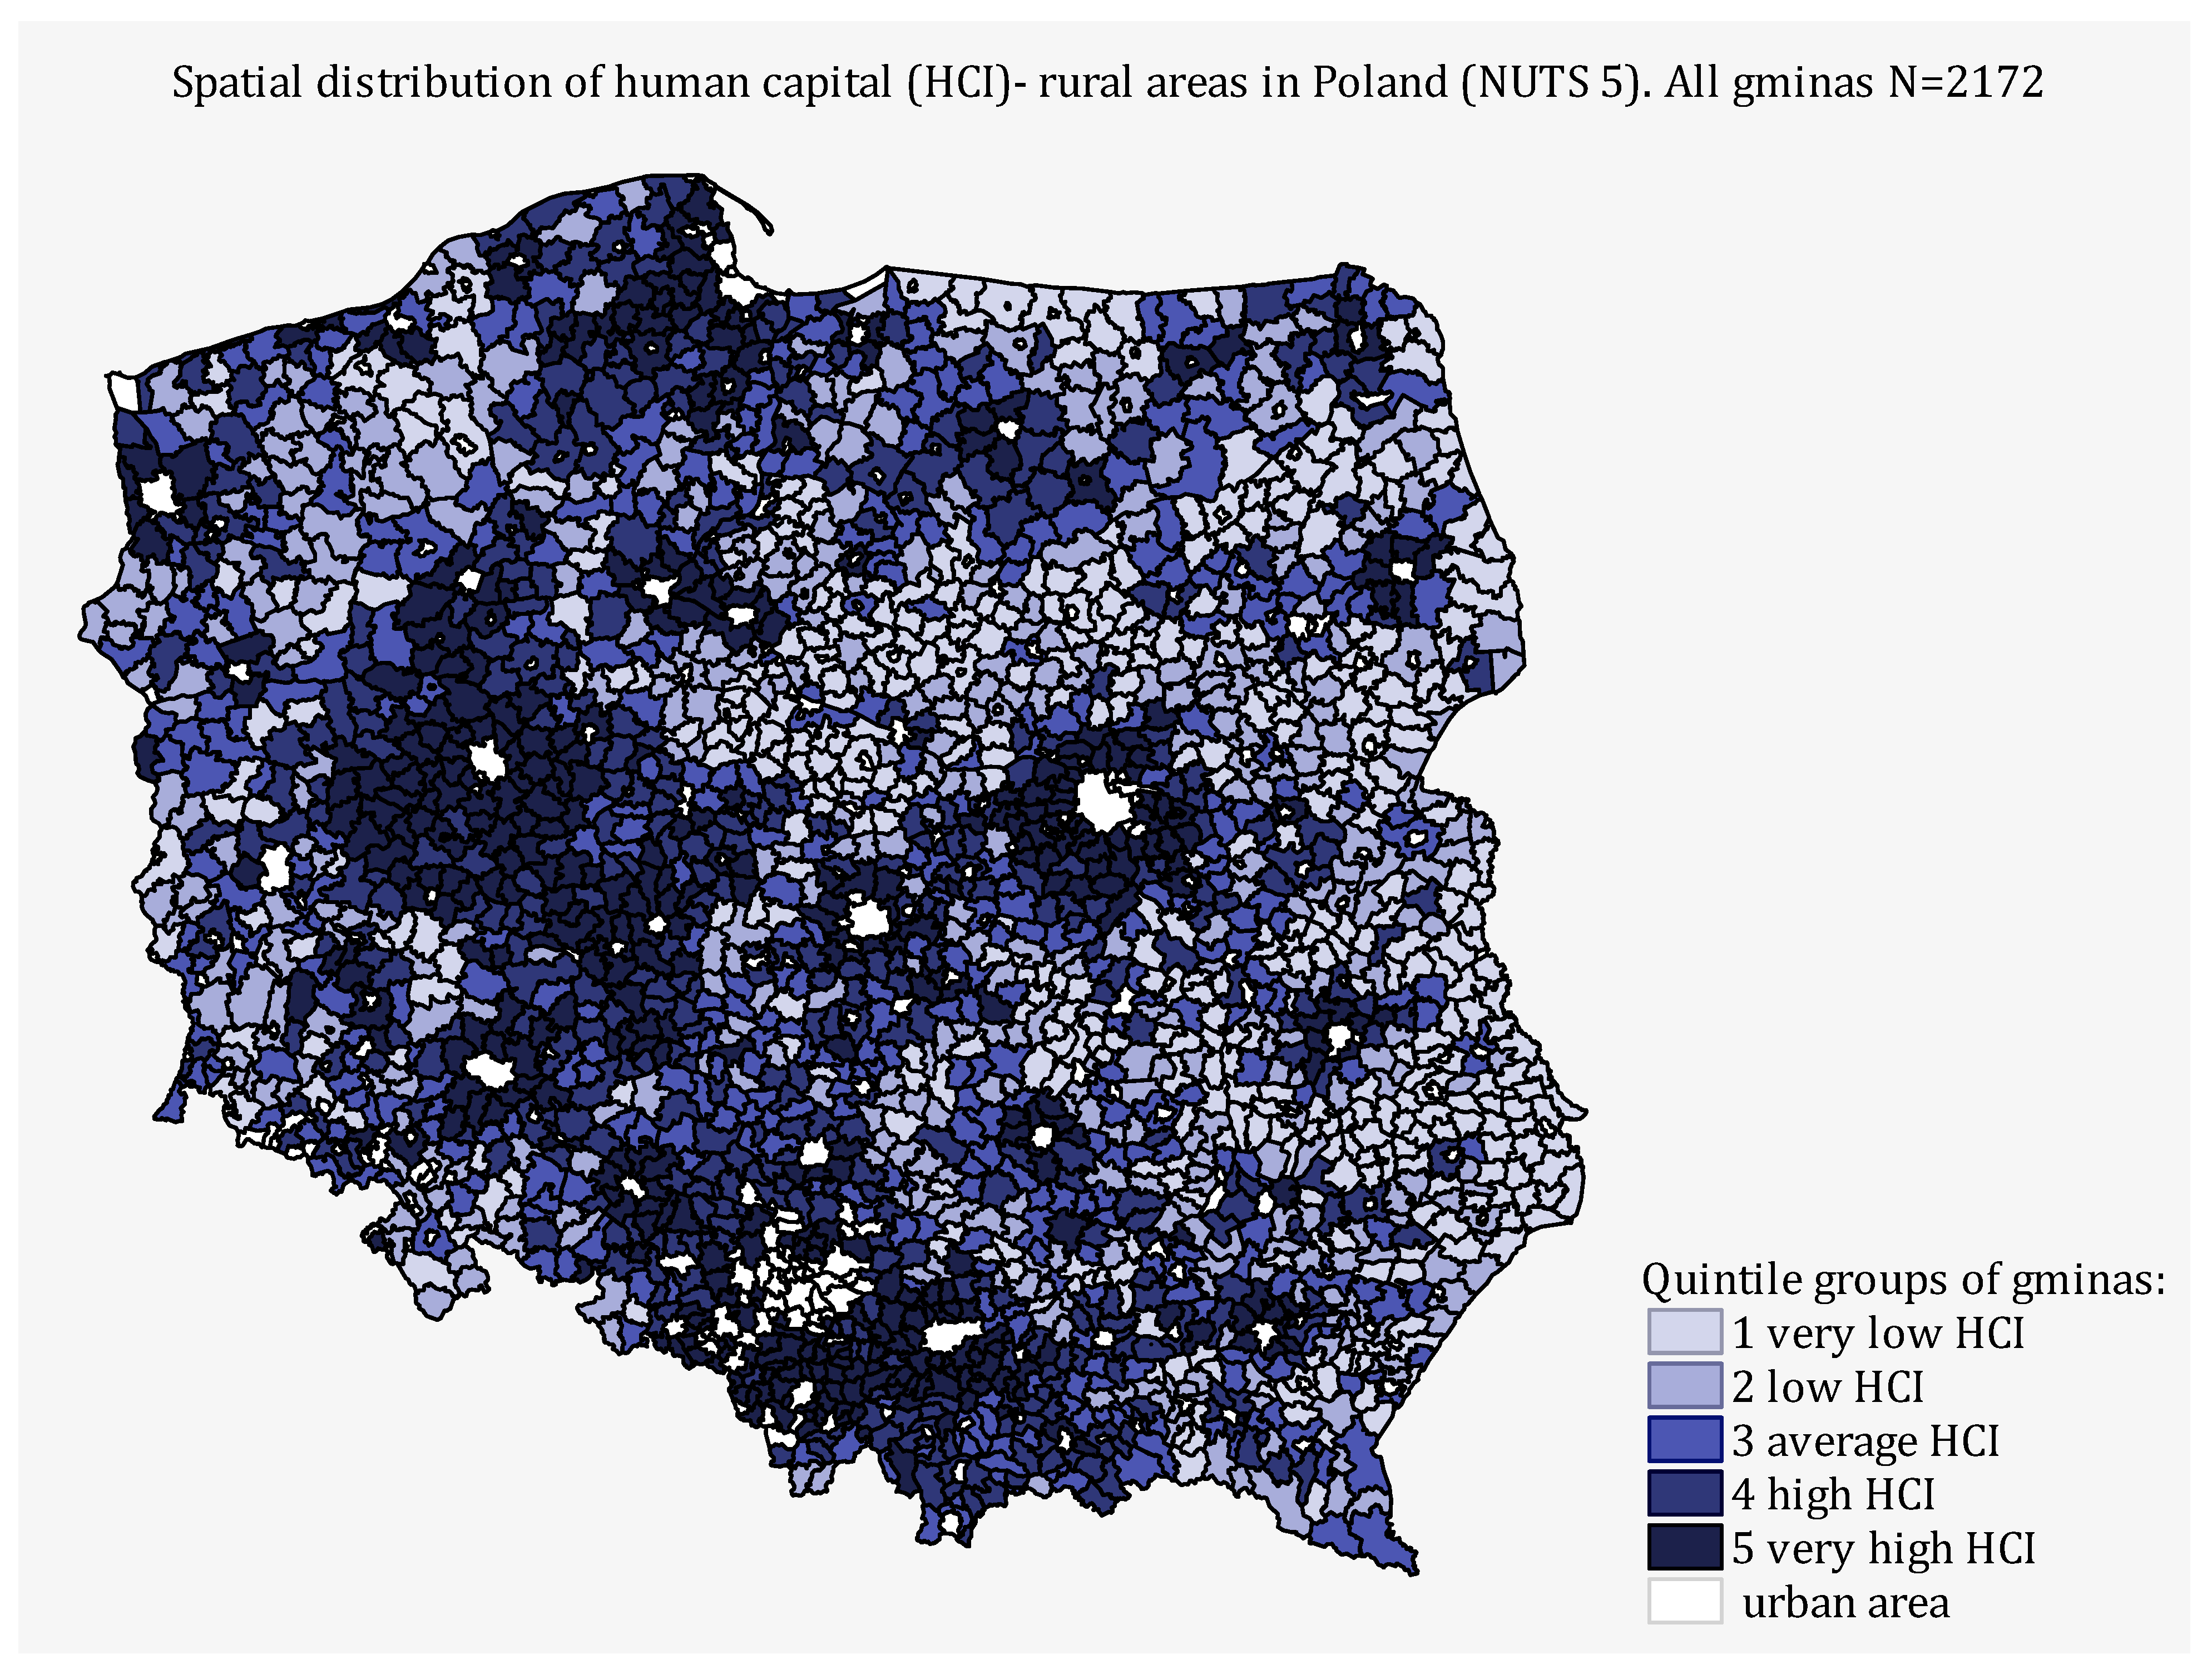
3.1. Diagnosis and Assessment of Differences in the Spatial Distribution of Human Capital in Rural Areas of Poland at NUTS 2 and NUTS 5 Levels

The analysis and assessment of differences in the spatial distribution of human capital were based on a synthetic measure (HCI) expressing the general level of this resource, estimated individually for each municipality in the country. The grouped data of the HCI level are presented in an interregional approach (Figure 1, Figure 2 and Figure 3) at the NUTS 2 level, as well as the extent of the differences from a local perspective at the NUTS 5 level (Figure 4; Table 1). The approach used was intended to show how different the interpretation of the research results obtained can be and what the practical consequences can be for the implementation of development programmes for a given spatial unit.
The analysis of the spatial distribution of the level of human capital at the NUTS 2 regional level was carried out on the basis of the hierarchical classification of 16 regions in Poland into 5 classes. In the adopted hierarchical classification of regions based on the level of the HCI index, five classes of objects with the same range of the index (HCI) were adopted, where 1 represents a group of regions with a very high level of the index (HCI) and 5 represents a group of regions with a very low level (HCI).
The effects of classifying rural areas at the NUTS 2 level are shown in the graphs (Figure 4). A preliminary analysis of the spatial distribution of the HCI index reveals spatial differences in the distribution of human capital along the east-west axis. This means that rural areas in regions located in the so-called “eastern wall” of the country are characterised by low and very low levels of the Human Capital Index (HCI), while better-quality resources are concentrated in rural areas in regions located in the meridian system through the centre of the country along the western border of the country. The exception is the Kujawsko-Pomorskie Voivodeship, which administratively belongs to the Pomeranian macro-region, i.e., the western part of the country. The rural areas of this region are very similar to those in eastern Poland in terms of their characteristics in terms of the level of the index (HCI).
The interregional analysis, based on the hierarchical classification of regions according to the level of the HCL index, shows that as many as six voivodships in eastern Poland (44%) are characterised by a very low level of human capital: Lubelskie, Podlaskie, Warmińsko-Mazurskie, Mazowieckie, Podkarpackie, and Świętokrzyskie. These voivodships are also characterised by a very low index (HCI). Kujawsko-Pomorskie Voivodeship and one voivodeship in the western part of the country (Lubuskie Voivodeship). For inter-regional comparison, the average values of the general indicator (HCI) for rural areas in individual voivodships are shown in Figure 5.
The graphs in Figure 4 and Figure 5 show the conventional but long-established territorial division of Poland into Poland A (better developed in the western part) and Poland B (underdeveloped and characterised by a low level of socio-economic development in the eastern part). This may indicate links between human capital, its spatial distribution, and socio-economic structures.
A slightly different, deeper look at the extent of differences at the NUTS 2 level is provided by data on the indicator (HCI) in relative terms, i.e., in relation to the average level of the HCI indicator for rural areas throughout the country (Figure 6).
Assuming that the ‘zero’ level determines the average level of human capital for rural areas in Poland (HCI = 0.351), it can be seen that most of the country (up to 63%) consists of areas with a lower level of human capital than the national average (Figure 3). The extent of the disparities between regions is also evident. It can be read that the most favourable assessment is given to rural areas from two voivodships, i.e., Wielkopolskie (HCI = 0.468) and Śląskie(HCI = 0.459), which are characterised by a higher level of human capital than the national average (by 33% and 31%, respectively). It should be added that these are the two most developed regions in Poland, but with different specific structures and the use of dominant functions in the processes of socio-economic development.
Rural areas in two other regions are characterised by a relatively high level of human capital: Pomorskie (HCI = 0.421) and Śląskie (HCI = 0.410). Spatially, these regions are located at opposite poles of the country (North vs. South). The HCI level in these areas is 20% and 17% higher than the national average. Rural areas of two other voivodships, Opolskie (HCI = 0.387) and Dolnośląskie (HCI = 0.359), have a lower but relatively favourable rating. The level of the HCI index for these regions was 10% and 2% higher than the national average, respectively. These six regions are all located in the western part of the country.
Figure 6 also shows that rural areas in no less than ten regions in Poland are characterised by a human capital deficit, with the most severe deficit affecting rural areas in the following voivodships: Lubelskie (HCI = 0.246), Podlaskie (HCI = 0.319), Kujawsko-Pomorskie (HCI = 0.288), Świętokrzyskie and Mazowieckie (HCI = 0.322 equally), Podkarpackie (HCI = 0.316), Warmińsko-Mazurskie Voivodship (HCI = 0.327), which have HCI indices lower than the national average by −30%, −20%, −18%, −8%, −10% and −7% respectively.
All these regions (with the exception of the Kujawsko-Pomorskie Voivodship) are regions with the so-called Polish B. Due to the influence of past (historical) factors, the rural areas in these regions are treated as those with the least developed socio-economic development structures and are characterised by a lower than average level of development than other regions in the country. Similar to the above-mentioned regions of eastern Poland, voivodships such as Zachodniopomorskie (−1%), Łódzkie (−2%), and Lubuskie (−9%) are located in the central and western part of the country.
It is worth paying attention to the central region—Mazowieckie Voivodeship. It turns out that the level of the HCI index for rural areas of this region is much lower than the national average and comparable to that of the Swietokrzyskie Voivodeship, one of the poorest and least industrialised and developed regions in the country. This may indicate a strong stratification of the social fabric in this region and a strong polarisation between the entire Warsaw agglomeration and the peripheral areas. The data presented in Table 1 show that the share of municipalities in the lowest (V) rating class is over 20%.
The data presented above provide strong reasons for assuming that the distribution of human capital in rural areas of Poland along the east-west axis is correct. Attempting to assess the causes of these disparities on this basis, one can, among other things, look for them in historical factors that determined the administrative affiliation (or not) of a given region to the country in the past. These are mainly the so-called territories regained by Poland after the Second World War and the effects of the socialised economy implemented in these areas in the years 1945–1989. These are the following regions: Zachodniopomorskie Voivodship, Lubuskie Voivodship, Warmińsko-Mazurskie Voivodship, and Dolnośląskie Voivodship. All rural areas in these regions, with the exception of those in Dolnośląskie, are characterised by a generally lower than average level of socio-economic development and, at the same time, a low level of human capital. It should be noted, however, that the level of deficit is not as high as in the case of rural areas in the so-called eastern wall of the country (Podlaskie, Lubelskie, and Podkarpackie).
The situation is slightly different in the rural areas of the Dolnośląskie Voivodeship, which is also part of the ‘Recovered Territories’. However, unlike these three regions, the Dolnośląskie Voivodeship was the site of a strong influx of intelligentsia from the East after the Second World War, unlike the other “north-western borderlands”, where mainly less educated people settled.
The second historical aspect noticeable in the distribution of human capital and the processes of its concentration on the east-west line is the period of the partition of Poland. Surprisingly, despite the passage of many years, this conventional line still shows the effects of the devastating policy of the partitioners towards the inhabitants of Poland at that time, which today results in a state of deep deficits and low quality of human capital in eastern Poland. This may also explain the lag in development in this part of the country compared to the regions in central and western Poland.
The spatial distribution of rural areas in terms of the level of human capital and the attempt to identify the factors responsible for and explain the state of existing disparities are, in the author’s opinion, only apparently exhaustive and correspond to reality. To confirm this thesis, an analysis of the structure of rural areas was carried out in terms of the level of the general (HCI) index achieved on an interregional basis. Detailed material is presented in Table 2. A detailed analysis of the proportions of municipalities in each region, classified into appropriate classes in terms of HCI index assessment, shows that the approach at NUTS 2 level is too general and does not allow the differentiated structure within regions to be revealed. And they are very clear and have specific consequences for actions taken to support development processes at the local level.
The analysis of individual cases of regions, e.g., Mazowieckie or Dolnośląskie, already casts doubt on the validity of initial conclusions at the NUTS 2 level of analysis. In order to better understand the problem, an analysis at the NUTS 5 level is necessary, which will reveal two issues: 1. the differences between regions; and 2. the diversity within regions. The data presented in Table 2 make it possible to assess the extent of disparities in the level of human capital on the basis of the proportions of municipalities in particular assessment classes in terms of the level of the HCI index.
The analysis of the structure of municipalities in Poland from an interregional perspective in terms of the level of the HCI index, which is an expression of the quality of human capital in a given region, indicates that the condition of human capital resources in rural areas in Poland is generally low. In the light of the presented structure of municipalities, it turned out that in six regions of Poland the percentage of municipalities with a very low and low (HCI) index ratings (i.e., classes 4 and 5) is 80% or more. In three other regions (i.e., Dolnośląskie, Łódzkie, and Mazowieckie), the proportion of low and very low-class municipalities is around 70%. On the negative side, in twelve out of sixteen Polish regions (i.e., 75%) there are no municipalities with a very high level of human capital (i.e., in the first highest class in terms of HCI). This unfavourable hypothesis is confirmed by the fact that nationally, as many as 67% of municipalities are characterised by a low or very low level of human capital, while the proportion of municipalities in the highest rating class should be regarded as marginal.
Interesting results can be read from the share of municipalities classified only in the first, highest, class of assessment in terms of the level of the HCI index, assuming two groups of regions: those with an above-average level of human capital and those with a level below the national average (see Figure 6). Surprisingly, two regions with a lower than average level of human capital (Mazowieckie and Warmińsko-Mazurskie) have municipalities in the first class, while four regions with an above-average favourable rating have none.
The second interesting observation concerns the assessment of the distribution of human capital based on the total shares of municipalities in assessment classes 1 and 2 in terms of the level of the HCI index. The largest share was observed in the Mazowieckie Voivodship, which is a surprising result given that the region as a whole, outside the metropolitan area, is a highly deficient area on a par with the poorest regions of the country.
In conclusion, the structural approach used to characterise rural areas in terms of the level of human capital at the level of municipalities has made it possible to capture the internal specificity of each region, which was not visible only at the NUTS 2 level. This analysis is complemented, or rather detailed, by a graphical presentation of the spatial distribution of human capital in rural areas in Poland at the NUTS 5 level in local terms, as shown in Figure 7.
The territorial approach to the assessment of rural areas in Poland with regard to the issue of human capital in rural areas at the local NUTS 5 level in Poland is illustrated in Figure 7. It highlights, firstly, the uneven distribution of human capital across rural Poland and, secondly, the existence of numerous deficit areas in terms of human capital resources. The extent of these differences is not visible in the analysis at the NUTS 2 level. It turns out that within regions with a similar overall assessment of the level of human capital, there are numerous municipalities with different levels of wealth, e.g., Mazowieckie, Zachodniopomorskie, and Dolnośląskie (Figure 7 and Table 2).
The data on the HCI index level at the local and regional level show that studying rural areas at a level higher than the local level can lead to erroneous conclusions. Within regions with a similar level of the HCI index (average), there are numerous and structurally different units (municipalities) that require individually different planned development paths. This confirms the voices of various groups who accuse the current regional policy for rural areas of being ineffective because it is too general.

3.2. Analysis of Linkages in the Spatial Distribution of Human Capital in Connection with the Structure of Socio-Economic Development Processes in Rural Areas in Poland

In light of the results of the empirical material presented above, the next step of the analysis attempted to determine whether there were any links between the spatial distribution of human capital and the local socio-economic structure. Since the level of inequality in the rural area studied is very high, it seems interesting to identify the causes of these inequalities. The local socio-economic structure, which determines the level and dynamics of development processes, was considered to be one of them. On the basis of the information on the general level of the Human Capital Index (HCI), the municipalities (N = 2172) were grouped in such a way as to maintain the affiliation of each municipality to a given rating class (from the highest I to the lowest V), while at the same time indicating its affiliation to a given type of rural area described by its socio-economic structure according to the RDM methodology (2014 and 2023). The clustering effects are shown in Table 3 and Table 4.
The vertical analysis of the structure of types of rural areas on the basis of their socio-economic structure and the level of human capital (HCI) achieved by each type clearly shows that the higher the share of agriculture in local structures, the lower the level of human capital. Table 3 shows that in the class of municipalities with the lowest level of human capital (IV and V), there are mainly municipalities dominated by traditional agriculture (their share is 23.9% and 78.2%, respectively). Moreover, type 1, 2, 3, and 4 municipalities, i.e., those that base their development on a significant share of agriculture, but to a different extent, do not appear in classes I and II with a high and very high level of HCI. Conversely, the higher the level of urbanisation of the municipalities and the greater the use of multifunctionality in their development, the higher the level of human capital. This is the case for types 5, 6, and 7 municipalities.
A similar observation can be made from the analysis of the data in Table 4. When analysing the shares of the different types of municipalities in relation to the level of human capital achieved in rural areas, it can be seen that the types of rural areas that base their development on the significant use of agricultural functions are more likely to be found in the class with a low level of human capital (mainly IV and V). Moreover, throughout the country, the largest share (55.5%) is accounted for by municipalities classified in class IV, i.e., with a low level of human capital.
In light of the research results presented, the hypothesis that there is a relationship between the distribution of human capital and the type of municipality described in terms of the structure of socio-economic development processes was subjected to statistical verification. To verify this relationship, the typology of rural areas according to the RDM methodology (2014) and the level of the general human capital index (HCI) estimated separately for each municipality were used. The result of the chi-square statistical test of the independence of municipalities with Yates’ correction [67] does not give reason to reject the hypothesis (p = 0.000).
This means that higher levels of human capital are more likely to be accumulated in rural areas with a lower share of agriculture in the economic structure and a relatively higher level of socio-economic development. The assessment of relationships was also carried out for individual structural components of the Human Capital Index (HCI), for which these relationships are not statistically significant (p > 0). The strength of the relationship was estimated on the basis of Czuprow’s convergence coefficient (Table 5).

4. Discussion

In the light of the above empirical material, it can be seen that the share of each type of municipality in the designated classes of the general level of human capital (HCI) varies. More importantly, there are also certain interdependencies that deserve a closer look.

4.1. Human Capital, Location Rent, and the Centre-Periphery Effect

Municipalities described by the RDM methodology as highly urbanised (type 7) are units with a relatively high level of socio-economic development and characterised by a low use of agricultural functions in the structure of the local economy. They dominate the class of municipalities with a high human capital rating. It can be assumed that this is due to the advantageous location and very close proximity of these communes to the largest urban centres in Poland, e.g., cities such as Wroclaw, Warsaw, and Poznan, which are regional and, in the case of Warsaw, central development centres due to their functions. These centres have a relatively strong influence on their suburbs and attract high-quality human capital from the region.
The economic structure of rural areas around such urban centres is different from that of communities far from cities. The proximity of a city, especially a large one, offers them different and better development opportunities, but above all, it gives them access to the urban labour market, to secondary and higher education, and thus to the professional development and upgrading of the skills of their inhabitants. Their proximity to urban centres provides access to cultural, administrative, and health services. Ultimately, all these factors contribute to a greater concentration of “better quality” human resources in these municipalities.
The concentration of type 7 municipalities with a very high degree of urbanisation and, at the same time, a relatively high assessment of human capital resources takes place mainly in areas with population growth, which is the result of migration flows from villages to cities or from cities to adjacent suburban rural areas (cf. [68,69]). In terms of the impact of migration processes, these are the areas that benefit: young, enterprising, and well-educated people come to them. The long-term processes of the inflow of “better” human resources have a positive impact on changing the demographic structure in these places, increasing the potential of labour market resources and the ability to use them for further development.
Rural areas of type 6, according to RDM (2014), which are characterised by a relatively high level of human capital, a high degree of deagrarianisation of local economic structures, and, at the same time, a strong development of non-agricultural functions, also benefit from the location rent. The proximity of these municipalities to the city limits their advantages, not only in terms of access to employment. The city also creates the conditions for them to sell products produced in the countryside, e.g., agricultural products that require quick distribution to the customer and whose transport from distant villages is unprofitable. The location of the village close to the city allows the inhabitants to develop activities not related to agriculture, but that take advantage of the city market. The economic activity may be related to warehouses, shopping centres, wholesalers, transport bases, or other services, and unlike peripheral rural markets, it is not limited only by the level of demand reported by the local market since demand is mainly generated by households and entrepreneurs of the urban market.
The location of the municipality in an attractive coastal area (Baltic Sea) in terms of tourism and income seems to be less important for the concentration of high-quality human capital. As an example, we can take the cases of the richest coastal municipalities in Poland (Zachodniopomorskie Voivodeship), which are characterised by a high level of socio-economic development and a low share of traditional agriculture in their economies. It turns out that in the assessment of the general level of human capital, these municipalities were classified at an average level (e.g., municipalities of Rewal, Ustronie, and Mielno) or even at a low level (Dziwnów and Międzyzdroje). This may have been influenced by, for example, the distance of these communes from the nearest growth centres and the poorly developed road infrastructure. This region of the country still lacks completed motorways and road access to the main cities, and the situation has not improved significantly despite ongoing road investment (e.g., the S6 in Pomerania linking Szczecin and Gdansk). In many rural areas of Poland, these factors are often found together, especially in rural areas affected by peripherality, which is one of the main obstacles to the development of human capital.

4.2. Human Capital, Peripherality, and Spatial Accessibility

In the light of the collected empirical material, it seems that peripherality, as a feature characterising many rural municipalities in Poland, is related to the processes of population migration and the state of their human capital resources. The territorial approach used in the analysis allows us to assess that a stronger concentration of low-quality capital is observed in areas far from larger urban centres, in contrast to rural areas of suburban zones, which concentrate high-quality human capital brought from areas with a weaker socio-economic condition. This phenomenon mainly concerns rural areas of types 3, 2, and 1 according to the RDM methodology, grouped mainly in the Zachodniopomorskie, Warmińsko-Mazurskie, Mazowieckie, and Lubelskie Voivodships (excluding the enclaves around the largest cities in these regions). It turns out that the peripherality and often resulting marginalisation of many municipalities is related to their limited spatial accessibility and even to the transport exclusion of a given municipality [53,70].
The results of research on the issue of spatial accessibility in Poland clearly show that the areas excluded from communication are mainly rural areas from the peripheral parts of these four voivodeships, which are also characterised by the lowest level of human capital in the country [53,71,72]. In the light of human capital theory, it seems that the main obstacle to the development of human capital in peripheral municipalities and, in the long term, in entire local socio-economic systems is the low accessibility of peripheral municipalities to the market of educational services at the preschool, post-primary, and academic levels. The long distance to the nearest academic centres, the difficulty of access and often the need for several transfers, and the resulting longer travel times result in significantly higher education costs for young people from areas affected by the problem of peripherality compared to those from other areas.
Similar problems for residents of peripheral municipalities are related to the provision of pre-primary and post-primary education. The same applies to the availability of other public services, such as health care or local government offices. It can therefore be concluded that not only the distance that separates the inhabitants of these municipalities from regional or even local urban centres, but above all the lack of accessibility, is currently the greatest obstacle to the processes of development and accumulation of human capital in this country. The issue of spatial accessibility and the problem of transport exclusion have relatively recently (2019) become two of the most important social issues strongly influencing local development processes in Poland.

4.3. Human Capital and Labour Markets

The consequences of peripherality can be seen in the state of the local labour market. In contrast to municipalities close to cities, villages far from cities have much more limited opportunities to use the external labour market. The economic activity carried out basically corresponds to the level of activity that corresponds to the needs expressed by the local market. Limited or no job prospects and low spatial availability of employment are factors that often encourage local people to abandon their current place of residence and migrate in search of better living conditions. In the light of ongoing migration processes, the result is that rural suburban areas, which benefit from the proximity of the urban market, are inhabited by younger and better educated people compared to peripheral areas with an old demographic structure and have a higher level of non-agricultural economic initiatives. They create more new jobs outside the traditional agricultural sector and limit employment opportunities on family farms. Younger labour resources in the rural areas of the peripheral zones are characterised by greater activity and a higher level of entrepreneurship in the search for new opportunities to find sources of income, including owning businesses in economic sectors other than traditional agriculture or hired work in agriculture.

4.4. Human Capital and Demographic Processes

In light of the collected empirical material, another regularity comes to mind, which is related both to the distribution of human capital resources, the economic structure of a given municipality, the degree of advancement of deagarisation processes, and also to the ongoing changes in the population status. In order to explain this, the following were used, among others: the typology of municipalities depopulating and concentrating the rural population developed by A. Rosner (2012) and the typology of rural areas according to RDM (2014, 2023). It has been observed that rural areas whose development is based to a significant extent on the use of traditional agricultural functions (type 1), the dominance of large-scale agriculture (type 2), or indirect agricultural functions (type 3) are characterised by a low or very low assessment of human capital. On the other hand, multifunctional (type 5) and multi-income (type 4) rural areas correspond spatially to those areas that have experienced population growth in recent years. The strength of these processes varies according to the region, but also according to the distance of a given unit from the nearest urban centre.
In an attempt to explain this, the vast majority of municipalities of types 1, 2, and 3 according to the RDM typology (2014) are affected by population loss as a result of migration processes and people moving from rural areas to cities, regardless of the fact that the nature (socio-economic structure) of the mentioned types of municipalities is different and caused by a slightly different use of agricultural functions (including employment on family farms and large-scale farms based on hired labour). At the same time, the above-mentioned examples of coastal municipalities constitute a certain refutation of this thesis (in general, this applies to municipalities of types 1, 2, and 3 according to RDM). Agriculture plays a major and sometimes dominant role in the structure of these local economies that are experiencing population decline.
Moreover, it is larger compared to municipalities that do not participate in the processes of changing the spatial distribution of the rural population or increasing their population [68,69]. It should be recalled that agriculture can only provide a limited number of jobs and that increasing employment on family farms may lead to a decrease in income per employee. This is one of the reasons for the “displacement” of young people and migration from rural areas dominated by agricultural functions. In areas of population growth, a clear majority of households do not use farms, and the average farm size in these areas is smaller than the national average.
In conclusion, a thorough analysis reveals the links between the spatial distribution of human capital in rural areas in Poland and their local socio-economic structure. From the regularities described above (i.e., labour market, peripherality, spatial accessibility), the main cause of the existing differences emerges—the agricultural function, the degree of deagrarianisation, and its participation in local development processes. In addition, the results of the analysis suggest that several other factors are strongly related to the agricultural issue and should be treated as co-factors in the process of deagrarianisation. The demographic processes of the past and the established population structure in these areas are also important. Due to the limited employment opportunities in agriculture and the lack of guarantees of economic security for the local population, peripheral areas are exposed to depopulation.
As a result, the population is decreasing, the population density is decreasing, and the demographic structure is changing unfavourably towards a decreasing share of children, generally people of pre-working age, with a simultaneous constant or increasing share of people of post-working age. This shows that the potential labour force is shrinking as a result of the shift of a part of the potential (mainly Zachodniopomorskie, the so-called Middle Pomerania, the eastern part: Warmińsko-Mazurskie, Lubelskie, and Podlaskie) to more attractive regions based on multifunctionality and the marginal importance of agriculture. Other factors related to the fate of municipalities in the period of political transformation may also contribute to the low assessment of the general level of human capital in peripheral rural areas. There are also a number of other social problems that significantly affect the development potential of peripheral municipalities and limit the accumulation of quality human capital in these areas (health problems, the legacy of the socialised market economy and the low level of industrialisation, structural problems of the labour market, unemployment, low mobility, and low resourcefulness). Historical processes taking place in these areas (in the past: the period of partitions and border changes after the First and Second World Wars; the most recent ones related to Poland’s accession to the European Union) reflect the contemporary effect of the concentration of low-quality human capital.

5. Summary

This article presents the author’s research concept and an attempt to explain the causes of existing differences in the spatial distribution of human capital in the rural socio-economic space in Poland in connection with local socio-economic development structures. The questions raised are part of the latest research on the causal factors of rural development, with special emphasis on human capital. The achievements of the theory of human capital, which describes the key role of this resource in the development processes of entire economies and individual regions, were combined with the theory of regional development, but this was performed in relation to rural areas studied at the local level, in accordance with the latest guidelines for the study of rural areas in the countries of the European Union.
The territorial approach used in this article and the transfer of empirical analyses to the lowest possible local (rural) level are great advantages. It makes it possible to obtain more detailed knowledge about the socio-economic processes taking place at the local level. It can explain the causes of existing differences in the level of socio-economic development of individual units.
Within the framework of the research carried out, it was found that the rural area in Poland is characterised by strong differences in the spatial distribution of human capital, which is particularly visible in the analysis at the local level. Regional analyses at the NUTS 2 level do not allow for the capture of significant differences within regions and between municipalities. Thus, a serious argument has been made for the need to study rural areas at the municipal (local) level. The second important conclusion is that rural areas in Poland are characterised by a relatively low level of human capital, which should be seen as a negative phenomenon and a major obstacle to their development.
The article shows that human capital and its spatial distribution in rural areas are related to local socio-economic structures and the achieved level of socio-economic development, which in turn is a derivative of the use of agricultural functions in local economic processes in a given municipality (degree of deagrarianisation of the village). In summary, it is possible to distinguish three groups of municipalities in the Polish rural socio-economic space:
Municipalities with a high level of socio-economic development, high human capital evaluation, a concentrated population, and a reduced agricultural function;
Municipalities with an average level of socio-economic development and an average human capital assessment, a concentrated population based on a multifunctional development path, and multi-income with an indirect role of agriculture;
municipalities with a low level of socio-economic development, low human capital evaluation, declining employment, and a high share of traditional agriculture.
This means that higher-quality human capital is concentrated in rural areas with a reduced agricultural function or whose development is based on multifunctionality, and the best capital is concentrated in highly urbanised municipalities. At the same time, highly urbanised municipalities with a marginal share of agricultural functions are characterised by a high level of social development. It should also be remembered that the agrarian structure of the Polish countryside is spatially diverse and so inertial that in some cases it enables and in others it hinders the development of non-agricultural functions, and it is also linked to the general dynamics of the development of individual municipalities.
It should be emphasised here that, in addition to the factor of socio-economic structure, the general state of differentiation is also influenced by other factors, such as migration processes, the issue of location in connection with the factor of peripherality, and spatial accessibility. All these issues seem to strongly determine both the level and the processes of spatial concentration of human capital in rural areas in Poland.
The approach to the study of rural areas used in the article allows a better understanding of the local specificity of socio-economic structures, and the regularities described are helpful in explaining the causes of emerging development inequalities. Knowledge of these mechanisms can help local authorities in their efforts to prevent certain negative phenomena (e.g., outward migration of workers, emigration of young people from deficit areas) and in the development of local development strategies that take account of the specificity of a given place and local conditions.
The research carried out encountered many limitations, including the lack of a single definition of human capital and, consequently, the diversity of approaches to its expression and the methods used to measure it. However, the greatest difficulty for the researcher was the availability and completeness of data to express the nature of human capital in rural areas. It turned out that very often its determinants are reserved for urban areas, while for rural areas, these data are missing or incomplete. Nevertheless, the practical use of the new knowledge provided will allow, first of all, to better shape regional development practices (including state policy and European regional policy) towards important spheres of the socio-economic life of local communities.
It should be emphasised that the demand for knowledge and human capital in a broad sense in rural areas is not only a result of the pace of civilisational change, but is also linked to activities aimed at implementing the idea of multifunctional but sustainable development [73,74,75,76,77]. Sustainable development aims to support the activities of both residents and local authorities in improving the quality of life and economic growth, with a particular focus on social equity and maintaining the integrity of natural resources. In this way, the competitiveness of companies operating in this environment will be ensured.

Funding

This research received no external funding.

Institutional Review Board Statement

Not applicable.

Informed Consent Statement

Not applicable.

Data Availability Statement

Not applicable.

Conflicts of Interest

The author declares no conflict of interest.

References

  1. Stanny, M.; Rosner, A.; Komorowski, Ł. Monitoring Rozwoju Obszarów Wiejskich. Etap IV. Dekada Przemian Społeczno-Gospodarczych (Monitoring of Rural Development. Stage IV. A Decade of Socio-Economic Changes); Fundacja Europejski Fundusz Rozwoju Wsi Polskiej, IRWIR PAN: Warszawa, Poland, 2023. [Google Scholar]
  2. Bański, J. Wiejskie obszary sukcesu gospodarczego. In Przegląd Geograficzny; Polska Akademia Nauk: Warszawa, Poland, 2008; Volume 80, pp. 199–222. [Google Scholar]
  3. Wilkin, J. Peryferyjność i marginalizacja w świetle nowych teorii rozwoju (nowa geografia ekonomiczna, teoria wzrostu endogennego, instytucjonalizm. In Regiony Peryferyjne w Perspektywie Polityki Strukturalnej Unii Europejskiej; Boltromiuk, A., Ed.; Wydawnictwo Uniwersytetu w Białymstoku: Białystok, Poland, 2003; pp. 44–52. [Google Scholar]
  4. Fujita, M.; Krugman, P.; Venables, A.J. The Spatial Economy. In Cities, Regions and, International Trade; The IT Press: Cambridge, UK, 1999. [Google Scholar]
  5. Nurzyńska, I. Przyczyny i przejawy peryferyjności obszarów wiejskich w Polsce. Wieś I Rol. 2016, 171, 123–139. [Google Scholar] [CrossRef] [PubMed]
  6. Kamińska, W. Pozarolnicza Indywidualna Działalność Gospodarcza w Polsce w Latach 1988–2003; IGiPZ PAN: Warszawa, Poland, 2006; Volume 203, Available online: https://books.google.pl/books?hl=pl&lr=&id=qU0QAwAAQBAJ&oi=fnd&pg=PA11&dq=37.%09Kami%C5%84ska,+W.+(2006).+Pozarolnicza+indywidualna+dzia%C5%82alno%C5%9B%C4%87+gospodarcza+w+Polsce+w+latach+1988-2003+(Vol.+203).+IGiPZ+PAN&ots=3siKE-uwCv&sig=JVBZa2awbWSqDL1hsY1r-ZVeaZo&redir_esc=y#v=onepage&q&f=false (accessed on 13 August 2023).
  7. ŚleszyńskI, P. Dostępność czasowa i jej zastosowania (Temporal accessibility and its applications). Przegląd Geogr. 2014, 86, 171–215. [Google Scholar] [CrossRef]
  8. Rosner, A. (Ed.) Zróżnicowanie Poziomu Rozwoju Społeczno-Gospodarczego Obszarów Wiejskich a Zróżnicowanie Dynamiki Przemian; Problemy Rozwoju Wsi i Rolnictwa, IRWiR PAN: Warszawa, Poland, 2007. [Google Scholar]
  9. Herbst, M.; Piotrowska, P. Gminy odnoszące sukces. In Polska lokalna 2007; Gorzelak, G., Ed.; Wydawnictwo Naukowe Scholar: Warszawa, Poland, 2008; pp. 107–129. [Google Scholar]
  10. Swianiewicz, P. Sukces mijającej kadencji. Wspólnota 2002, 39–40, 10–16. [Google Scholar]
  11. Komornicki, T.; Śleszyński, P. Typologia obszarów wiejskich pod względem powiązań funkcjonalnych i relacji miasto-wieś. Stud. Obsz. Wiej. 2009, 16, 9–37. [Google Scholar]
  12. Belliggiano, A.; Sturla, A.; Vassallo, M.; Viganò, L. Neo-Endogenous Rural Development in Favor of Organic Farming: Two Case Studies from Italian Fragile Areas. Eur. Countrys. 2020, 12, 1–29. [Google Scholar] [CrossRef]
  13. Śpiewak, R.; Jasiński, J. Organic Farming as a Rural Development Factor in Poland–the Role of Good Governance and Local Policies. Int. J. Food Syst. Dyn. 2020, 11, 52–71. [Google Scholar]
  14. Maroto-Martos, J.C.; Voth, A.; Pinos-Navarrete, A. The Importance of Tourism in Rural Development in Spain and Germany. In Neoendogenous Development in European Rural Areas; Springer: Cham, Switzerland, 2020; pp. 181–205. [Google Scholar]
  15. Šťastná, M.; Vaishar, A.; Ryglová, K.; Rašovská, I.; Zámečník, S. Cultural Tourism as a Possible Driver of Rural Development in Czechia. Wine Tourism in Moravia as a Case Study. Eur. Countrys. 2020, 12, 292–311. [Google Scholar] [CrossRef]
  16. Klonowska-Matynia, M. Kapitał Ludzki Jako Czynnik Zróżnicowania Rozwoju Społeczno-Gospodarczego Obszarów Wiejskich (Human Capital as a Factor of Diversification of Socio-Economic Development of Rural Areas); Politechnika Koszalińska: Koszalin, Poland, 2021. [Google Scholar]
  17. WB (World Bank). The Human Capital Index 2020 Update: Human Capital in the Time of COVID-19; The World Bank, International Bank for Reconstruction and Development: Washington, DC, USA, 2021. [Google Scholar]
  18. Yakimova, L.A.; Streltsova, A.V. Human capital as a fundamental determinant of rural development. In IOP Conference Series: Earth and Environmental Science; IOP Publishing: Bristol, UK, 2020; Volume 548, p. 022095. [Google Scholar]
  19. Baldanov, A.; Kiminami, L.; Furuzawa, S. Literature Review on Human Development, Human Capital, Agriculture and Rural Development. In Agriculture and Rural Development in Russia Since the 2000s; Springer: Singapore, 2020; pp. 7–13. Available online: https://link.springer.com/chapter/10.1007/978-981-15-4665-5_2 (accessed on 15 August 2023).
  20. Stathopoulou, S.; Psaltopoulos, D.; Skuras, D. Rural entrepreneurship in Europe. Int. J. Entrep. Behav. Res. 2004, 10, 404–425. [Google Scholar] [CrossRef]
  21. Skuras, D.; Meccheri, N.; Moreira, M.B.; Rosell, J.; Stathopoulou, S. Entrepreneurial human capital accumulation and the growth of rural businesses: A four-country survey in mountainous and lagging areas of the European union. J. Rural Stud. 2005, 21, 67–79. [Google Scholar] [CrossRef]
  22. Tigu, G.; Marinas, L.; Mircioi, I.V. Contribution of EU funds to the development of human capital in rural areas. In International Conference on Competitiveness of Agro-Food and Environmental Economy Proceedings; The Bucharest University of Economic Studies: Bucharest, Romania, 2015; Volume 4, pp. 356–367. [Google Scholar]
  23. Marinas, L.E. Returns on EU funding for human capital development in rural areas. Rev. Manag. Comp. Int. 2015, 16, 491–505. [Google Scholar]
  24. Emery, M.; Flora, C. Spiraling-up: Mapping community transformation with community capitals framework. J. Community Dev. Soc. 2006, 37, 19–35. [Google Scholar] [CrossRef]
  25. Flora, C.; Flora, J.; Fey, S. Rural Communities: Legacy and Hange, 2nd ed.; Westview Press: Boulder, CO, USA, 2004. [Google Scholar]
  26. Jacobs, C. Measuring Success in Communities: Understanding the Community Capitals Framework. Extension Extra. SDSU (South Dakota State University Cooperative Extension Service) (Series 1–6). 2007. Available online: https://openprairie.sdstate.edu/cgi/viewcontent.cgi?article=1516&context=extension_extra (accessed on 12 September 2023).
  27. Pisani, E.; Micheletti, S. Social capital and rural development research in Chile a qualitative review and quantitative analysis based on academic articles. J. Rural. Stud. 2020, 80, 101–122. [Google Scholar] [CrossRef]
  28. Sabet, N.S.; Khaksar, S. The performance of local government, social capital and participation of villagers in sustainable rural development. Soc. Sci. J. 2020, 1–29. [Google Scholar] [CrossRef]
  29. Hwang, Y.S.; Cho, T.B. An influence analysis of the social capital and participation intention by the regional capacity building for rural regional development. J. Korean Soc. Rural Plan. 2021, 27, 43–56. [Google Scholar] [CrossRef]
  30. Noack, A.; Federwisch, T. Social innovation in rural regions: Urban impulses and cross-border constellations of actors. Sociol. Rural. 2019, 59, 92–112. [Google Scholar] [CrossRef]
  31. Zerrer, N.; Sept, A. Smart villagers as actors of digital social innovation in rural areas. Urban Plan. 2020, 5, 78–88. [Google Scholar] [CrossRef]
  32. Richter, R.; Fink, M.; Lang, R.; Maresch, D. Social Entrepreneurship and Innovation in Rural Europe; Routledge: New York, NY, USA, 2020. [Google Scholar]
  33. Castro-Arce, K.; Vanclay, F. Transformative social innovation for sustainable rural development: An analytical framework to assist community-based initiatives. J. Rural Stud. 2020, 74, 45–54. [Google Scholar] [CrossRef]
  34. Domański, S.R. Kapitał Ludzki i Wzrost Gospodarczy; Monografie i Opracowania/Szkoła Główna Planowania i Statystyki; SGH: Warszawa, Poland, 1990; Volume 301. [Google Scholar]
  35. Florczak, W. Kapitał Ludzki a Rozwój Gospodarczy; PWE: Warszawa, Poland, 2007. [Google Scholar]
  36. Kukliński, A. O nowym modelu polityki regionalnej–artykuł dyskusyjny. Stud. Reg. I Lokal. 2003, 4, 9. [Google Scholar]
  37. Rakowska, J.; Wojewódzka-Wiewiórska, A. Zróżnicowanie Przestrzenne Obszarów Wiejskich w Polsce–Stan i Perspektywy Rozwoju w Kontekście Powiązań Funkcjonalnych; Ministerstwo Rozwoju Regionalnego: Warszawa, Poland, 2010.
  38. ESPON. Final Report. PROFECY-Processes, Features and Cycles of Inner Peripheries in Europe. Inner Peripheries: National Territories Facing Challenges of Access to Basic Services of General Interest. Luxembourg. 2017. Available online: https://www.espon.eu/inner-peripheries (accessed on 19 April 2020).
  39. ESPON. Inner Peripheries in Europe. Possible Development Strategies to Overcome Their Marginalising Effects. 2018. Available online: https://www.espon.eu/sites/default/files/attachments/ESPON-Policy-Brief-InnerPeripheries.pdf (accessed on 19 April 2020).
  40. ESPON. ESCAPE−European Shrinking Rural Areas: Challenges, Actions and Perspectives for Territorial Governance. Applied Research. Synthesis Report. 2020. Available online: https://www.espon.eu/escape (accessed on 1 July 2021).
  41. OECD. Rural Well-Being: Geography of Opportunities; OECD Rural Studies; OECD Publishing: Paris, France, 2020; Available online: https://www.oecd.org/regional/rural-well-being-d25cef80-en.htm (accessed on 1 June 2021).
  42. European Commision. A Long-Term Vision for the EU’s Rural Areas, Rural Development. 2020. Available online: https://rural-vision.europa.eu/index_pl (accessed on 12 July 2022).
  43. OECD. Principles on Rural Policy; OECD: Paris, France, 2019. [Google Scholar]
  44. Klonowska-Matynia, M.; Czerwińska-Jaśkiewicz, M.; Zarębski, P.; Sasin, M. Diversity of social potential in a peripheral area. An example of Middle Pomerania Commune. Ann. PAAAE 2021, 23, 76–95. [Google Scholar] [CrossRef]
  45. Klonowska-Matynia, M. Czy Kapitał Ludzki Obszarów Wiejskich Jest Zróżnicowany? Ujęcie typologiczne dla gmin województwa zachodniopomorskiego. Ann. PAAAE 2023, 25, 118–131. [Google Scholar] [CrossRef]
  46. Zarębski, P.; Czerwińska-Jaśkiewicz, M.; Klonowska-Matynia, M. Innovation in peripheral regions from a multidimensional perspective: Evidence from the Middle Pomerania Region in Poland. Sustainability 2022, 4, 8529. [Google Scholar] [CrossRef]
  47. Stanny, M. Przestrzenne Zróżnicowanie Rozowju Obszarów Wiejskich w Polsce; IRWIR PAN: Warszawa, Poland, 2013. [Google Scholar]
  48. Mazur, M.; Bański, J.; Czapiewski, K.; Śleszyński, P. Wiejskie obszary funkcjonalne–próba metodyczna Wyznaczenia ich obszarów i granic. Stud. Obsz. Wiej. 2015, 37, 7–36. [Google Scholar] [CrossRef]
  49. Bański, J. (Ed.) Three Decades of Transformation in the East-Central European Countryside; Springer: Cham, Switzerland, 2019. [Google Scholar]
  50. Bański, J.; Mazur, M.; Kamińska, W. Socioeconomic conditioning of the development of the COVID-19 pandemic and its global spatial differentiation. Int. J. Environ. Res. Public Health 2021, 18, 4802. [Google Scholar] [CrossRef] [PubMed]
  51. Klonowska-Matynia, M. Human Capital as a Source of Energy for Rural Areas’ Socio-Economic Development-Empirical Evidence for Rural Areas in Poland. Energies 2022, 15, 8281. [Google Scholar] [CrossRef]
  52. Stola, J. Klasyfikacja Funkcjonalna Obszarów Wiejskich w Polsce. Próba Metodyczna; IGiPZ PAN, Wyd; Ossolińskich: Wrocław, Poland, 1987. [Google Scholar]
  53. Rosik, P.; Pomianowski, W.; Goliszek, S.; Stępniak, M.; Kowalczyk, K.; Guzik, G.; Kołoś, A.; Komornicki, T. Multimodalna Dostępność Transportem Publicznym Gmin w Polsce (MULTIMODACC); (Multimodal Public Transport Accessibility of Polish Gminas (MULTIMODACC)); IGiPZ PAN: Warszawa, Poland, 2017. [Google Scholar]
  54. Śleszyński, P.; Bański, J.; Degórski, M.; Komornicki, T. Delimitacja Obszarów Strategicznej Interwencji Państwa: Obszarów Wzrostu i Obszarów Problemowych: Delimitation of the State Intervention Strategic Areas: Growth Areas and Problem Areas; IGiPZ PAN: Warszawa, Poland, 2017; Volume 260, Available online: https://books.google.pl/books?hl=pl&lr=&id=VjFNDwAAQBAJ&oi=fnd&pg=PA9&dq=Diagnoza+systemu+zarz%C4%85dzania+rozwojem+Polski+%E2%80%93+g%C5%82%C3%B3wne+wnioski+i+rekomendacje,+Warszawa,+2022&ots=JBitUU_F5c&sig=OVazC1x3n6sXvwqHpeuZNOpKyzo&redir_esc=y#v=onepage&q&f=false (accessed on 15 August 2023).
  55. Marsden, T. Pathways in the sociology of rural knowledge. In Handbook of Rural Studies; Cloke, P., Marsden, T., Mooney, P., Eds.; Sage Publication: London, UK, 2006; pp. 4–5. [Google Scholar]
  56. Wilkin, J. Czy istnieje teoria rozwoju obszarów wiejskich i czy takiej teorii potrzebujemy. Wieś I Rol. 2018, 1, 18. [Google Scholar] [CrossRef]
  57. Churski, P.; Herodowicz, T.; Konecka-Szydłowska, B.; Perdał, P. European Regional Development: Contemporary Regional and Local Perspectives of Socio-Economic and Socio-Political Changes; Springer: Amsterdam, The Netherlands, 2021. [Google Scholar]
  58. Churski, P.; Herodowicz, T.; Konecka-Szydłowska, B.; Perdał, R. Spatial differentiation of the socio-economic development of Poland–“Invisible” historical heritage. Land 2021, 10, 1247. [Google Scholar] [CrossRef]
  59. GUS (Central Statistical Office). Rural Areas in Poland in 2020. Statistical Analyses. 2022. Available online: https://stat.gov.pl/en/topics/agriculture-forestry/agriculture/rural-areas-in-poland-2020,3,5.html (accessed on 12 May 2023).
  60. Czyżewski, A.B.; Góralczyk-Modzelewska, M.; Saganowska, E.; Wojciechowska, M. Regionalne Zróżnicowanie Kapitału Ludzkiego w Polsce (Regional differentiation of human capital in Poland); Zakład Badań Statystyczno-Ekonomicznych GUS: Warszawa, Poland, 2001.
  61. Marvel, M.R.; Davis, J.L.; Sproul, C.R. Human capital and entrepreneurship research: A critical review and future directions. Entrep. Theory Pract. 2016, 40, 599–626. [Google Scholar] [CrossRef]
  62. Balcerzak, A. Taxonomic analysis of the quality of human capital in the European Union in 2002–2008. Pr. Nauk. Uniw. Ekon. We Wrocławiu 2014, 176, 456–467. [Google Scholar]
  63. Stec, M.; Janas, A. Ranking krajów Unii Europejskiej ze względu na zasoby kapitału ludzkiego i intelektualnego. Wiadomości Statystyczne. Pol. Stat. 2005, 9, 70–76. [Google Scholar]
  64. Kukuła, K. Zero unitarisation method as a tool in ranking research. Econ. Sci. Rural Dev. 2014, 36, 95–100. [Google Scholar]
  65. Rosner, A.; Stanny, M. Monitoring Rozwoju Obszarów Wiejskich; Etap I; EFRWP, IRWiR PAN: Warszawa, Poland, 2014. [Google Scholar]
  66. Stanny, M.; Komorowski, Ł.; Rosner, A. The socio-economic heterogeneity of rural areas: Towards a rural typology of Poland. Energies 2021, 14, 5030. [Google Scholar] [CrossRef]
  67. Sobczyk, M. Statystyka; PWN: Warszawa, Poland, 2017. [Google Scholar]
  68. Rosner, A. Zmiany Rozkładu Przestrzennego Zaludnienia Obszarów Wiejskich: Wiejskie Obszary Zmniejszające Zaludnienie i Koncentrujące Ludność Wiejską; Instytut Rozwoju Wsi i Rolnictwa Polskiej Akademii Nauk: Warszawa, Poland, 2012. [Google Scholar]
  69. Rosner, A.; Wesołowska, M. Zmiany zaludnienia obszarów wiejskich w Polsce a ich poziom rozwoju społeczno-gospodarczego (Changes in population in rural areas of Poland as set against their levels of socio-economic development). Przegląd Geogr. 2022, 94, 175–198. [Google Scholar] [CrossRef]
  70. Garbacz, E.; Komornicki, T.; Kowalczyk, K. Daily accessibility among Poland’s voivodeship cities. Przegląd Geogr. 2020, 92, 247–265. [Google Scholar] [CrossRef]
  71. Komornicki, T. Polska Sprawiedliwa Komunikacyjnie (Poland is Fair in Terms of Communication); Fundacja S. Batorego: Warsaw, Poland, 2019; Available online: https://www.batory.org.pl/upload/files/Polska%20sprawiedliwa%20komunikacyjnie.pdf (accessed on 12 July 2023).
  72. Parol, A.R. Dostępność transportowa wybranych ośrodków miejskich Pomorza Środkowego z uwzględnieniem zjawiska wykluczenia komunikacyjnego (Transport accessibility of selected towns in the Middle Pomerania region including the phenomenon of the transport exclusion). Pr. Kom. Geogr. Komun. PTG 2021, 24, 19–35. [Google Scholar]
  73. Elliott, J. An Introduction to Sustainable Development; Routledge: London, UK, 2012. [Google Scholar]
  74. Bruckmeier, K.; Tovey, H. Knowledge in sustainable rural development: From forms of know-ledge to knowledge processes. Sociol. Rural. 2008, 48, 313–329. [Google Scholar] [CrossRef]
  75. Yin, X.; Chen, J.; Li, J. Rural innovation system: Revitalize the countryside for a sustainable development. J. Rural Stud. 2022, 93, 471–478. [Google Scholar] [CrossRef]
  76. Pérez-delHoyo, R.; Mora, H. Toward a new sustainable development model for smart villages. In Smart Villages in the EU and Beyond; Emerald Publishing Limited: Bradford, UK, 2019; pp. 49–62. [Google Scholar]
  77. Adamowicz, M.; Zwolińska-Ligaj, M. The “Smart Village” as a way to achieve sustainable development in rural areas of Poland. Sustainability 2020, 12, 6503. [Google Scholar] [CrossRef]
Figure 1. Operationalisation of the concept of human capital towards the estimation of a synthetic measure of its general level (HCI). * Definition and main constructs of human capital in the wide approach by Domański [34]. Source: own elaboration.
Sustainability 15 15194 g001
Figure 2. Characteristics of the socio-economic structure of rural areas according to the RDM methodology (2014 and 2023). Source: own elaboration. * Description: spatiality: spatial accessibility; economic issues: degree of deagrarianisation of the local economy, agricultural sector, non-agricultural sector, local public finances, degree of labour market sustainability; social issues: demographic issues, educational issues, social activity, wealth, and the cohesion of the local community; quality of life element: elements of housing conditions.
Sustainability 15 15194 g002
Figure 3. The concept of examining the links between the level of human capital (HCI) and the socio-economic structure of rural areas. Source: own elaboration.
Sustainability 15 15194 g003
Figure 4. Synthetic measure of the general level of human capital (HCI) [0;1] for rural areas in Poland. Spatial approach at the level of NUTS 2 regions. Classes with equal ranges. Source: own elaboration.
Sustainability 15 15194 g004
Figure 5. The synthetic measure of the total human capital level (HCI) [0;1]. Interregional approach at the NUTS 2 level. Quintile groups. Source: own elaboration.
Sustainability 15 15194 g005
Figure 6. A synthetic measure of the total level of human capital (HCI) in relative terms Interregional approach at the NUTS 2 level. Description: *—the “zero” level determines the average level of the HCI index for rural areas in the country. Source: own elaboration.
Sustainability 15 15194 g006
Figure 7. Synthetic measure of the general level of human capital (HCI) [0;1] for rural areas in Poland. Spatial approach at the NUTS 5 level (municipalities). Quintile groups. Source: own elaboration.
Sustainability 15 15194 g007
Table 2. Structure of rural areas in Poland in terms of the level of human capital (HCI). The effects of the classification of municipalities in the interregional approach (share of municipalities in %).
HCI [0;1]
Class Ranges
Regions in Poland
DolnośląskieKujawsko-PomorskieLubelskieLubuskieŁódzkieMałopolskieMazowieckiePodkarpackiePodlaskieświętokrzyskieWarmińsko-MazurskieOpolskiePomorskieŚląskieWielkopolskieZachodniopomorskie
12345678910111213141516
Relative to average HCI for rural areas in Poland:
More than average +
Less than average −
++++++
1st class
[0.80–1.00]
1.50.00.00.00.00.01.80.00.00.01.00.00.00.02.90.0
2nd class
[0.60–0.79]
3.81.60.50.01.94.85.40.01.91.01.00.06.15.13.42.9
3rd class
[0.40–0.59]
24.113.47.816.423.948.219.021.510.514.418.047.144.969.572.015.5
4th class
[0.20–0.39]
66.260.657.074.069.245.251.668.860.079.469.052.949.025.421.776.7
5th class
[0.00–0.19]
4.524.434.79.65.01.822.29.727.65.211.00.00.00.00.04.9
All
municipalities
100100100100100100100100100100100100100100100100
Catfish class
I and II
5.31.60.50.01.94.87.20.01.91.02.00.06.15.16.32.9
Catfish class
IV and V
70.785.091.783.674.247.073.878.587.684.580.052.949.025.421.781.6
Source: own elaboration.
Table 3. Structure of the types of rural areas according to RDM in individual classes of the assessment of the level of human capital in HCI. Share of municipalities in %.
(HCI)
(Range)
Type of Municipalities According to RDM
Type 1Type 2Type 3Type 4Type 5Type 6Type 7Total
Dominance of Traditional AgricultureDominance of Large-Scale AgricultureIndirect with Predominance of Agricultural FunctionsMulti-Income Fragmented AgricultureMultifunctional Sector BalanceUrbanised, Reduced Agricultural FunctionHighly Urbanised
1st class
[0.80–1.00]
0.0%0.0%0.0%0.0%0.0%0.0%100.0%100%
2nd class
[0.60–0.79]
0.0%0.0%0.0%0.0%3.3%48.3%48.3%100%
3rd class
[0.40–0.59]
1.2%7.0%11.9%14.9%39.7%24.2%1.1%100%
4th class
[0.20–0.39]
23.9%26.1%31.2%7.5%10.3%0.9%0.2%100%
5th class
[0.00–0.19]
78.2%16.1%5.2%0.4%0.0%0.0%0.0%100%
Total 22.6%18.4%21.5%8.6%17.6%9.0%2.4%100%
Source: own elaboration.
Table 4. Level (HCI) by types of municipalities according to the RDM methodology (2014/2023). Share of municipalities in %.
(HCI)
Ranges
Type of Municipalities According to RDM
Type 1Type 2Type 3Type 4Type 5Type 6Type 7Total
Dominance of Traditional AgricultureDominance of Large-Scale AgricultureIndirect, with Predominance of Agricultural FunctionsMulti-Income, Fragmented AgricultureMultifunctional, Sector BalanceUrbanised, Reduced Agricultural FunctionHighly Urbanised
1st class
[0.80–1.00]
0.0%0.0%0.0%0.0%0.0%0.0%26.9%0.6%
2nd class
[0.60–0.79]
0.0%0.0%0.0%0.0%0.5%14.8%55.8%2.8%
3rd class
[0.40–0.59]
1.6%11.3%16.5%51.3%67.0%79.6%13.5%29.7%
4th class
[0.20–0.39]
58.8%78.7%80.7%48.1%32.5%5.6%3.8%55.5%
5th class
[0.00–0.19]
39.6%10.0%2.8%0.5%0.0%0.0%0.0%11.4%
Total 100%
(490 municipalities)
100%
(399 municipalities)
100%
(466 municipalities)
100%
(187 municipalities)
100%
(382 municipalities)
100%
(196 municipalities)
100%
(52 municipalities)
100%
(2172 municipalities)
Source: own elaboration.
Table 5. Relationships between the type of rural area according to RDM (2014/2023) and the total level of human capital (HCI) and the area of its individual components.
Synthetic Measure (HCI)Innovation [HCI]Labour Market [HCLM ]Health [HCH ]Education [HCE]Social Wealth [HCSW]
Czuprow coefficient
T-value
0.5174140.2026110.4081860.3061790.3406270.391593
Chi square Test2014.31308.871253.62705.345872.9871153.77
p-value0.0006.43483 × 10−594.90344 × 10−2613.16317 × 10−1433.62196 × 10−1791.55932 × 10−239
Source: own elaboration.
Disclaimer/Publisher’s Note: The statements, opinions and data contained in all publications are solely those of the individual author(s) and contributor(s) and not of MDPI and/or the editor(s). MDPI and/or the editor(s) disclaim responsibility for any injury to people or property resulting from any ideas, methods, instructions or products referred to in the content.

