Article

Simulation Experimental Investigations into the Mechanical Response and Failure Mechanisms of Coal–Rock Combinations

1
School of Energy Science and Engineering, Henan Polytechnic University, Jiaozuo 454003, China
2
Henan Key Laboratory for Green and Efficient Mining & Comprehensive Utilization of Mineral Resources, Henan Polytechnic University, Jiaozuo 454003, China
3
State Collaborative Innovative Centre of Coal Work Safety and Clean-Efficiency Utilization, Jiaozuo 454003, China
*
Author to whom correspondence should be addressed.
Sustainability 2023, 15(20), 15175; https://doi.org/10.3390/su152015175
Submission received: 29 June 2023 / Revised: 17 October 2023 / Accepted: 20 October 2023 / Published: 23 October 2023

Abstract

:
The stability of the composite structures formed by coal pillar and roof rock is of great significance to safe production and sustainable development of coal mines. In order to explore the failure and instability mechanisms of coal–rock combinations (CRCs) with varying rock-to-coal height ratios, uniaxial compression tests of CRCs with varying rock-to-coal height ratios were performed via laboratory tests and numerical simulation of particle flow tests, and the mechanical response and failure mechanisms of CRC were comprehensively investigated with regard to their strength, failure characteristics, crack and energy evolution. The results show that the stress thresholds for the crack initiation, uniaxial compressive strength, and elastic modulus of CRCs rose with the decreasing coal-to-rock height ratio, and the fragmentation degree of the coal samples increased with rock-to-coal height ratio. The instability and failure of CRCs are the result of the interaction between the strength of sandstone and coal at the interface and the strength of sandstone and coal far from the interface region; in addition, they are influenced by the distribution range of microfractures during the loading process. The point effect and slip effect formed by coal failure cause sandstone split failure and shear failure, respectively. The number of cracks, macrocrack length, total input energy, elastic strain energy, and dissipated strain energy all reduce first and then increase as the coal thickness reduces. CRCs still have a certain load-bearing capacity in the post-peak stage, mainly due to their strong load-bearing skeleton structure and the friction between particles in the fracturing area, which can resist external forces.

1. Introduction

Coal pillars are left surrounding the mining field to ensure coal resources’ safe and efficient mining. The stability of the combined system of these coal pillars and their overlying rock strata determines the safety of the face, the overlying strata, and even the surface. Once the combined system is damaged and destabilised, it can result in many catastrophic events, including rock bursts [1,2,3,4,5], coal and gas protrusions [6,7], sudden surface collapse [8,9,10,11] and other dynamic hazards. Meanwhile, a large number of mining engineering practices demonstrate that the initiation, propagation, and coalescence of meso cracks in CRCs are essential factors leading to the instability and failure of CRCs, and play a vital role in the macro mechanical behaviour of CRCs [12,13,14,15,16]. Therefore, a better understanding of the crack initiation, propagation, and coalescence process can aid in studying the mechanical characteristics and the progressive failure mechanism of CRCs in underground coal mines.
To study the mechanical behaviour of CRCs, many researchers have simplified the interlayer between the roof and floor rock and coal pillar, including coal–rock composite materials, rock–coal composite materials and rock–coal–rock composite materials. Bai et al. studied the progressive failure characteristics and mechanisms of different types of CRC samples using uniaxial compression experiments [17]. Tan et al. investigated the evolution of microcracks and failure characteristics of roof rock–coal–floor rock sandwich composite samples under uniaxial loading using an acoustic emission system [18]. Yin et al. studied the effect of lithology on strength, macro failure initiation, energy evolution, and failure characteristics by conducting uniaxial compression tests on fine sandstone–coal, coarse sandstone–coal and oil shale–coal biomaterial samples [19,20]. Chen et al. used acoustic emission devices and digital cameras to monitor the fracturing and failure propagation process of coal–oil shale composite samples with high strength and a low elastic modulus under uniaxial compression [21]. Yang et al. constructed rock–coal–rock composite structures with different coal thicknesses, and used theoretical analysis and physical similarity simulations to investigate the influencing law and the mechanism of coal thickness’s effect on compressive strength [22]. Liu et al. established a damage constitutive model of rock–coal and rock–coal–rock composite samples by connecting the damage body with Newtonian body [23]. In addition, the effects of interface angle, prefabricated fractures, confining pressure, and loading rate on the strength and failure characteristics of rock–coal composite samples were studied [24,25,26,27,28]. The lithology, strength, and combined forms of coal and rock bodies have an important influence on the deformation and failure of CRCs. Therefore, the study of the failure characteristics of CRCs with varying rock-to-coal height ratios can reveal the deformation failure mechanisms of CRCs with varying rock-to-coal height ratios from both a macroscopic and microscopic perspective, which is of great significance for coal mine safety.
As the proportion of coal in the combination decreases, the preparation of laboratory test samples is more complex, and the strength and Young’s modulus of coal have significant discreteness, making the randomness of the test results large [29,30]. However, due to its low cost and wide feasibility, the numerical simulation method has become a popular research method for studying the mechanical properties of rock fracture. Compared with theoretical analysis and laboratory tests, numerical simulation can more effectively capture meso mechanical behaviour and crack expansion and evolution in the failure process of CRCs. Hoek and Martin, Yang et al., Luo et al., Wu et al., and Chen et al. studied the failure characteristics of CRCs under uniaxial compression using a three-dimensional discrete element method [31,32,33,34,35]. Wang et al. established a discrete element method model combined with stress–gas coupling, and compared and studied the related mechanics properties of single coal samples and combination samples under stress–gas coupling, such as axial stress, crack generation, and failure mode [36]. Tian et al. used FLAC3D 7.0 numerical simulation software to study the mechanical characteristics of coal–rock composite structures under different interface connection modes [37]. Ma et al. established coal–rock and rock–coal–rock composite samples with different height ratios of coal to rock using PFC 4.0 software, and studied the differences in mechanical and energy evolution characteristics of coal–rock composites with different height ratios of coal to rock [38,39]. Yin et al. investigated the effects of joint length and angle on the uniaxial compressive strength, acoustic emission, and failure characteristics of rock–coal composites using PFC2D 3.0 numerical simulation software [40]. However, previous studies have focused primarily on coal–rock composite models’ overall mechanical properties and macroscopic damage. There are limited investigations into the strength properties and progressive damage mechanisms of CRCs with varying coal-to-rock height ratios, particularly research on the initiation, propagation, coalescence, and penetration of cracks in composite materials with varying coal-to-rock height ratios. Therefore, it is important to understand the influence of varying coal-to-rock height ratios on the destruction and instability mechanisms of CRCs from a microscopic point of view.
In this paper, firstly, we conducted physical experiments to explore the mechanical properties of CRCs with various coal-to-rock height ratios. Then, we constructed a discrete element method (DEM) model of CRCs with varying rock-to-coal height ratios, proposed a method for creating the initial compression stage in the numerical simulation process, and determined the micro-mechanical parameters of the DEM model using physical macroscopic mechanical properties via the trial-and-error method. The impact of the height ratio of coal to rock on the failure mode of CRCs is investigated based on failure characteristics, the evolution process of microcracks, energy characteristics, and contact force chain evolution. In addition, the effect law of the coal–rock height ratio on the failure mode of coal–rock combinations is revealed.

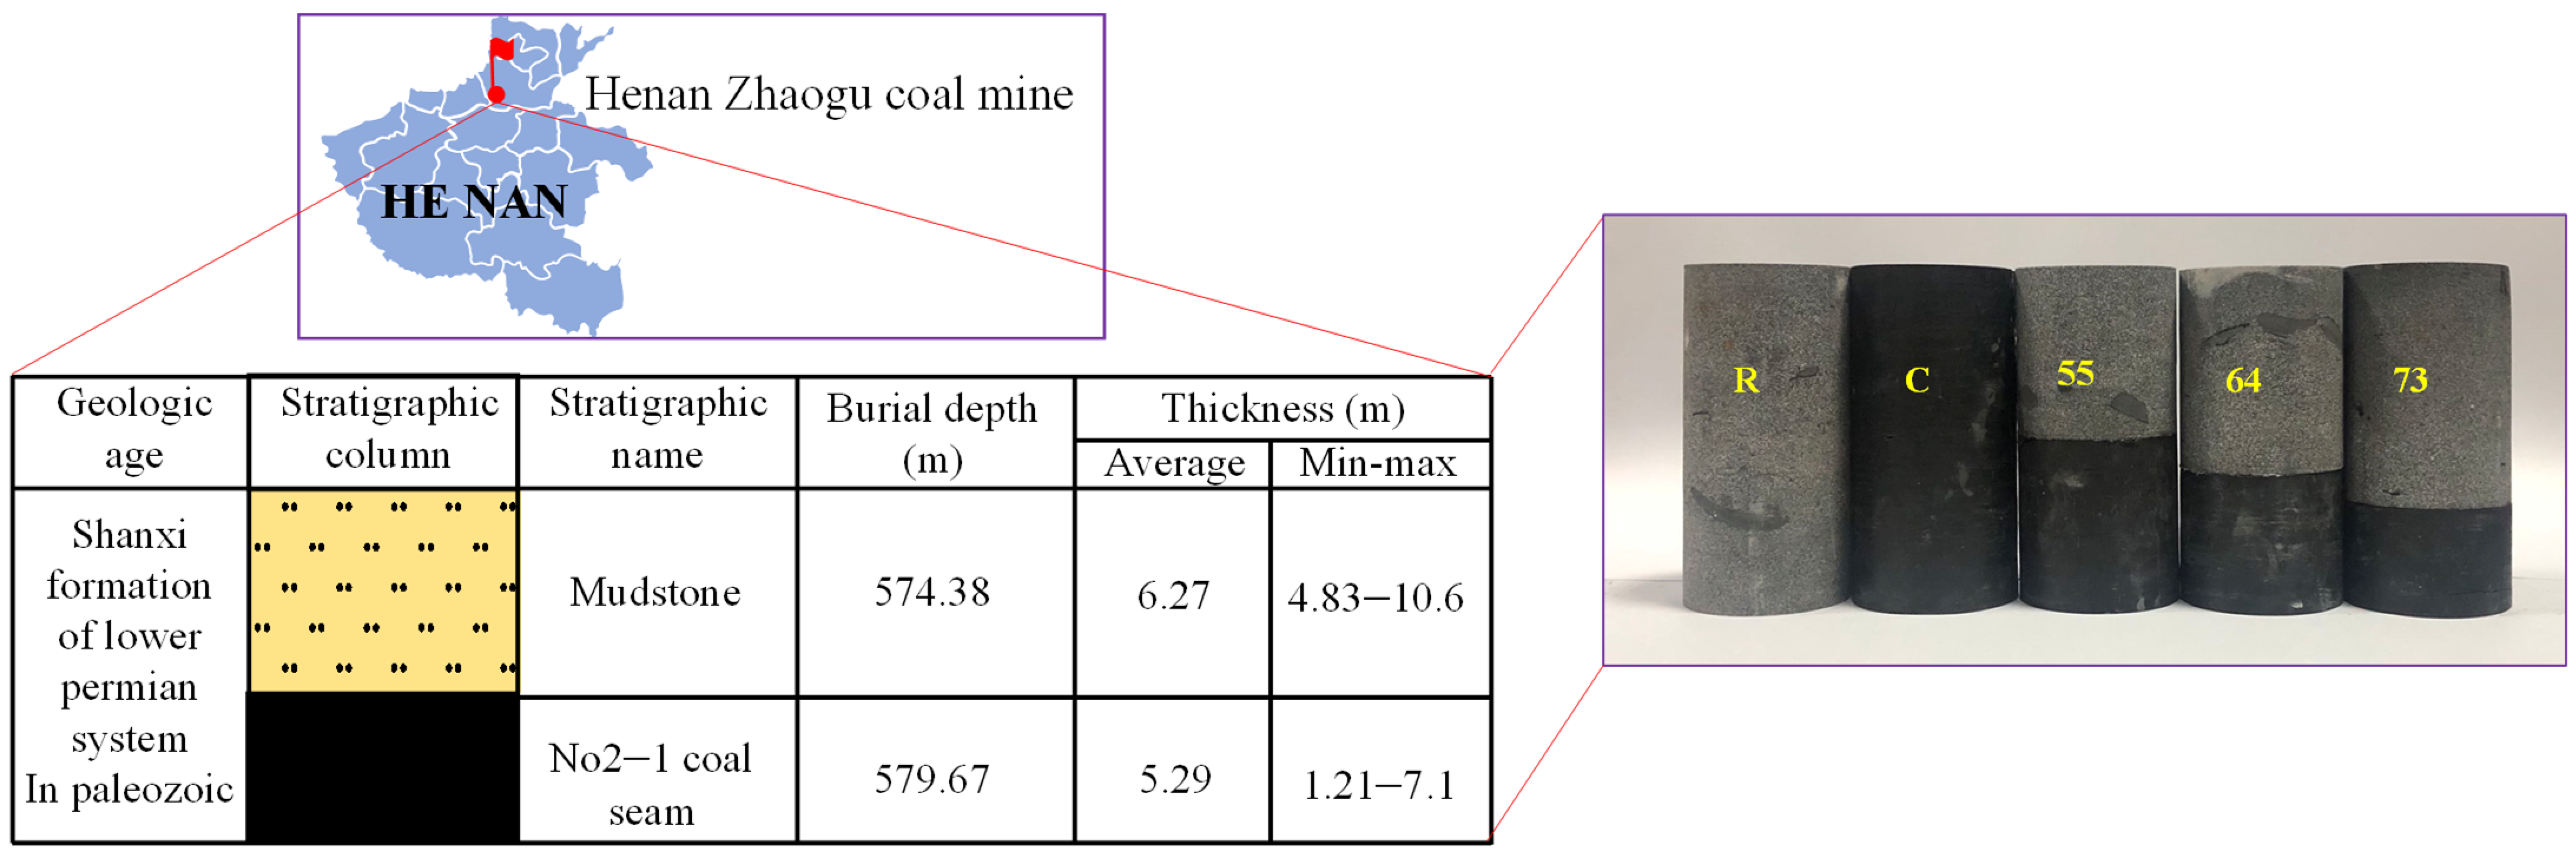
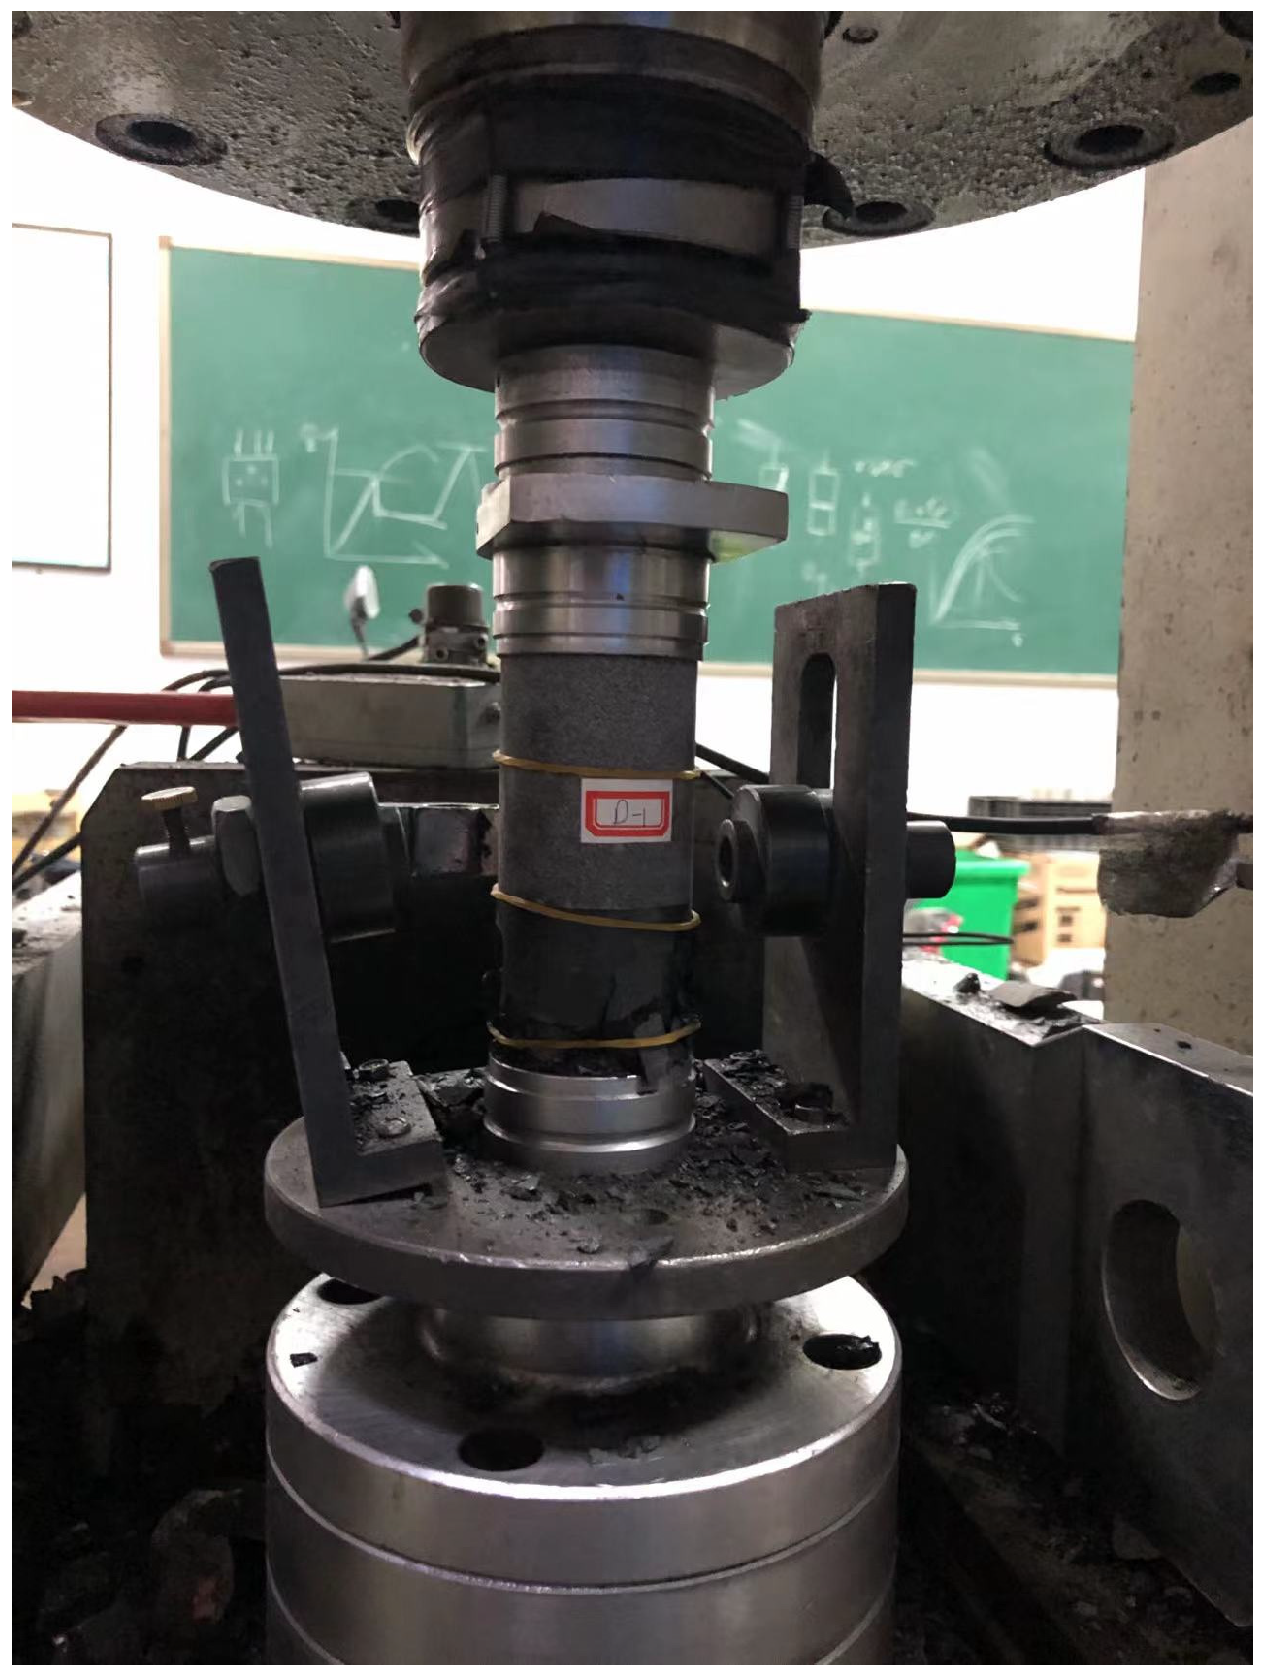
2. Physical Test of CRCs

2.1. Test Equipment and Methods

The field prototype of CRCs came from the Zhaogu coal mine in Henan Province. Figure 1 presents a field geological histogram of the coal seam, which is combined with its roof rock as a structural model of the CRC. The coal seam is mainly hard coal, and its roof is sandstone. The average thicknesses of the coal seam and its roof rock are 5.29 and 6.27 m. The coal–rock combination structure can be categorized into varying rock-to-coal height ratios based on the range of coal thickness and roof thicknesses.
The sandstone and coal samples collected on site were brought to the laboratory. First, 50 mm diameter cylindrical specimens of coal blocks and sandstone were extracted using a drilling coring machine and cut to the required height for the test, utilising a cutting machine; a rock grinder smoothed the specimens’ ends. For the uniaxial compression mechanical test, sandstone and coal samples were cut into ϕ50 × 100 mm standard cylinder pieces and labelled R and C, respectively, including three rock and three coal samples. Based on the high ratios of sandstone–coal (5:5, 6:4 and 7:3), AB super glue ϕ50 × 100 mm standard cylinder pieces were employed to test the mechanical properties of CRC with various height ratios of coal to rock, with three pieces for each sample [19,21]. Figure 1 depicts the samples of each type used in this study.
The uniaxial compression tests were conducted using an RMT-150B electro-hydraulic servo rock mechanics testing system. This testing apparatus is located at the Testing and Analysis Research Center of Henan Polytechnic University, and has a maximum axial load capacity of 1000 kN. During the experiment, the loading platen was moved downwards to apply pressure to the specimen. The loading mode was displacement-controlled, with a loading rate of 0.005 mm/s. The test equipment is shown in Figure 2.

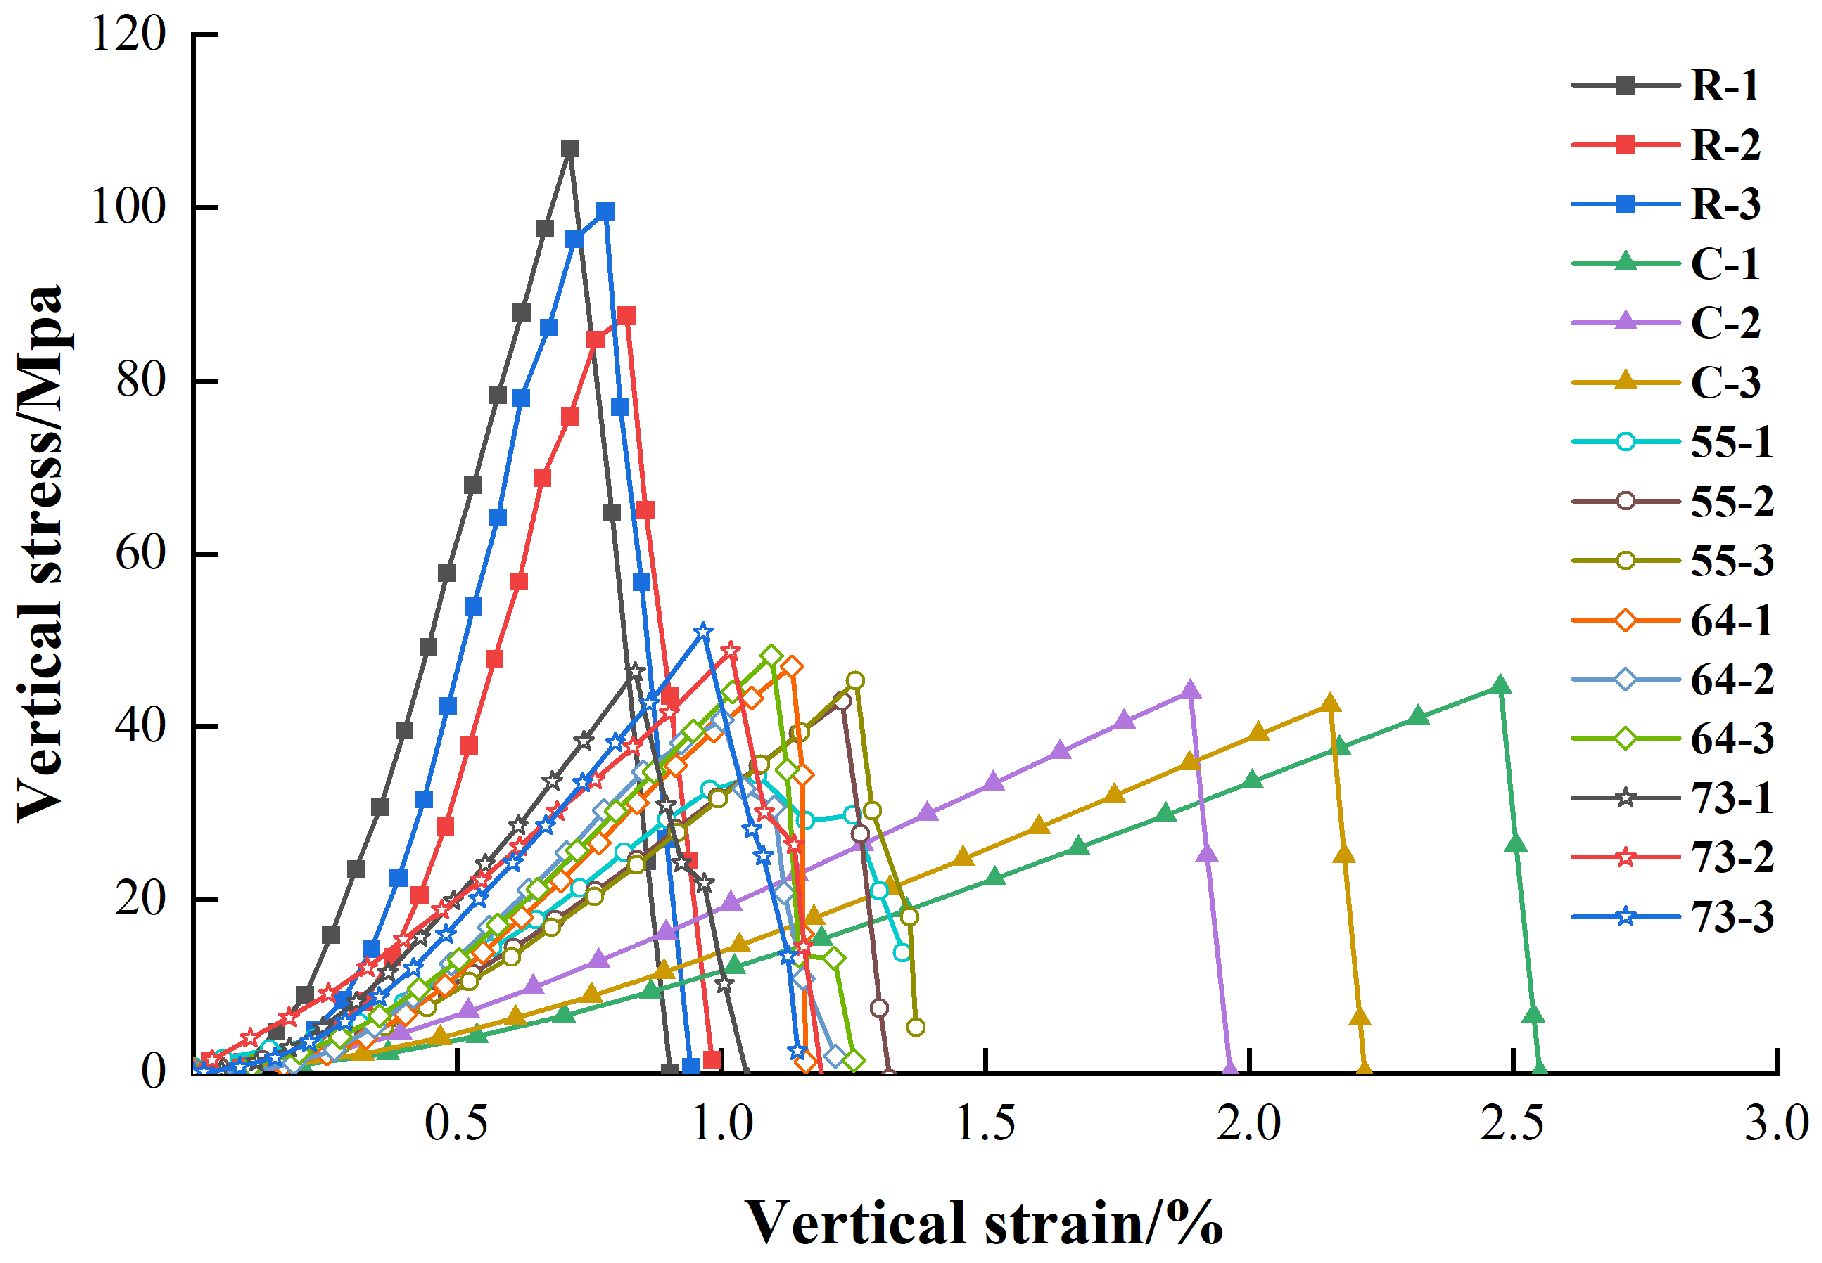
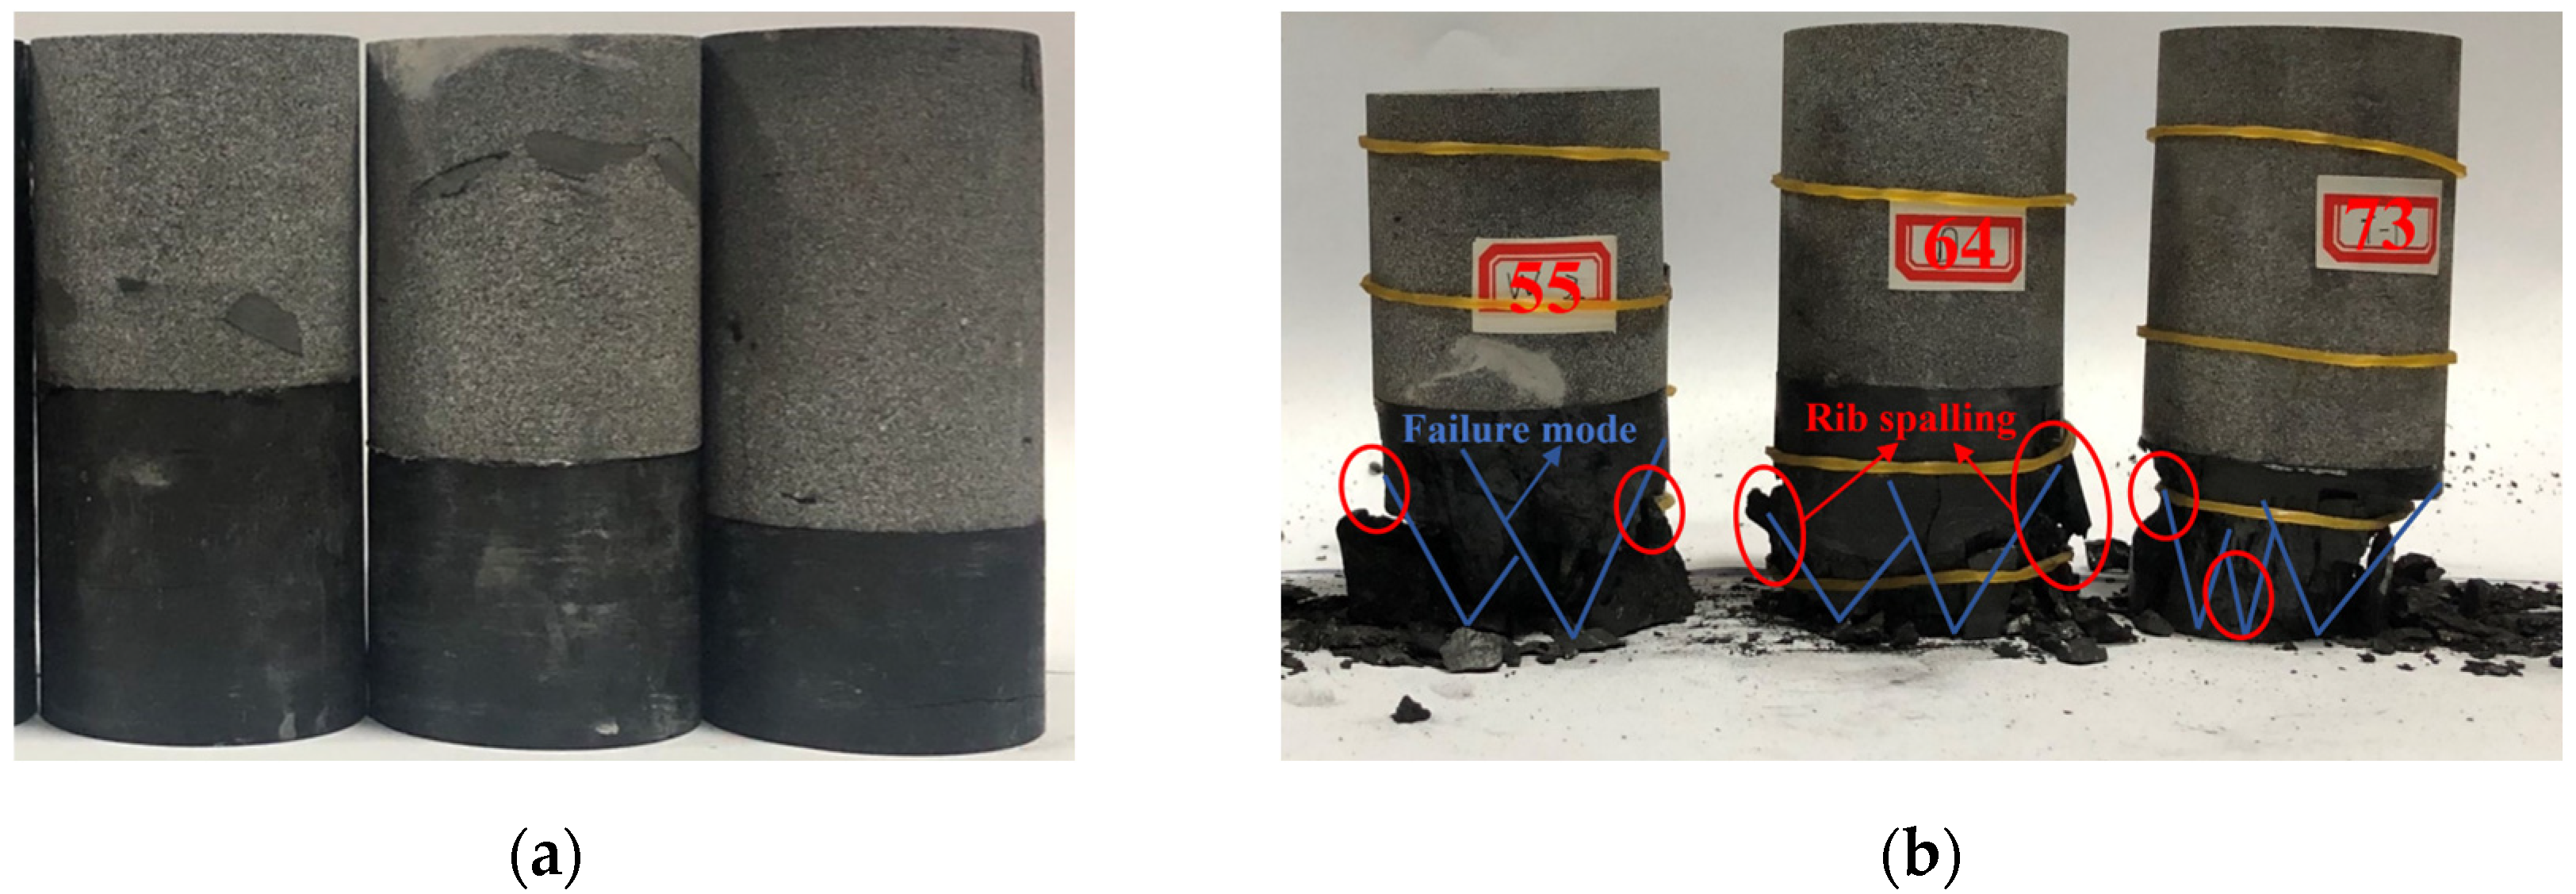
2.2. Experimental Test Results

Table 1 lists the basic physical and mechanical parameters of single standard sandstone and coal samples and CRCs with different height ratios of coal to rock, as determined by a uniaxial compression test. Figure 3 compares the mechanical curves of CRC with various coal-to-rock height ratios.
Table 1 indicates that the coal–rock combinations’ uniaxial compressive strength and elastic modulus grow gradually as the proportion of coal drops. The uniaxial compressive strength and elastic modulus of CRC with varying height ratios of coal to rock are less than those of a single standard sandstone sample, and higher than those of a single standard coal sample. The stress–strain curves of standard sandstone samples, coal samples and coal–rock combination samples were compared, as shown in Figure 2. It can clearly be seen that there are significant differences in the peak axial strain of these three sample types. Among them, the peak axial strain of the standard sandstone sample is the smallest, ranging from 0.72% to 0.82%. The peak axial strain of coal sample is the largest, which is distributed between 1.89% and 2.47%. The peak axial strain of coal–rock composite samples is between 0.84% and 1.33%, and the peak vertical strain of CRC gradually decreases with the increase in the rock–coal height ratio. According to the shape of the stress–strain curve, the rock sample, coal sample, and CRC all experienced the compaction stage, and then entered the elastic stage. When the rock sample is close to the peak strength level, it shows obvious plastic deformation, and when the stress reaches the peak, it drops sharply. Hard coal has a denser structure and fewer micro-structural planes, and the instability duration during the loading process is short and sudden. Similarly, when the stress reaches the peak, it also drops sharply, and the coal sample shows obvious elastic brittleness characteristics throughout the process. After the CRC enters the post-peak stage, the curves of samples 55-2, 64-1, and 73-3 show the same decreasing form as that of coal samples. In addition, samples 55-3, 64-2, 64-3, 73-1, and 73-2 appeared as a transient stress platform, and then the curve decreased rapidly and vertically, indicating that these samples had completely failed.
The uniaxial compressive strength of specimen 55-1 has significantly decreased. This is primarily attributable to the significant growth of the primary flaws in the coal body of the structural sample, which will form a stress concentration around the fracture surface to accelerate the destruction of the structure, thereby reducing the strength of the coal sample in the CRC. Hence, the primary fractures also affect the uniaxial compressive strength of the coal–rock structure to some degree.

3. Generation Method of CRC Models and Calibration of the Microscopic Particle Parameters

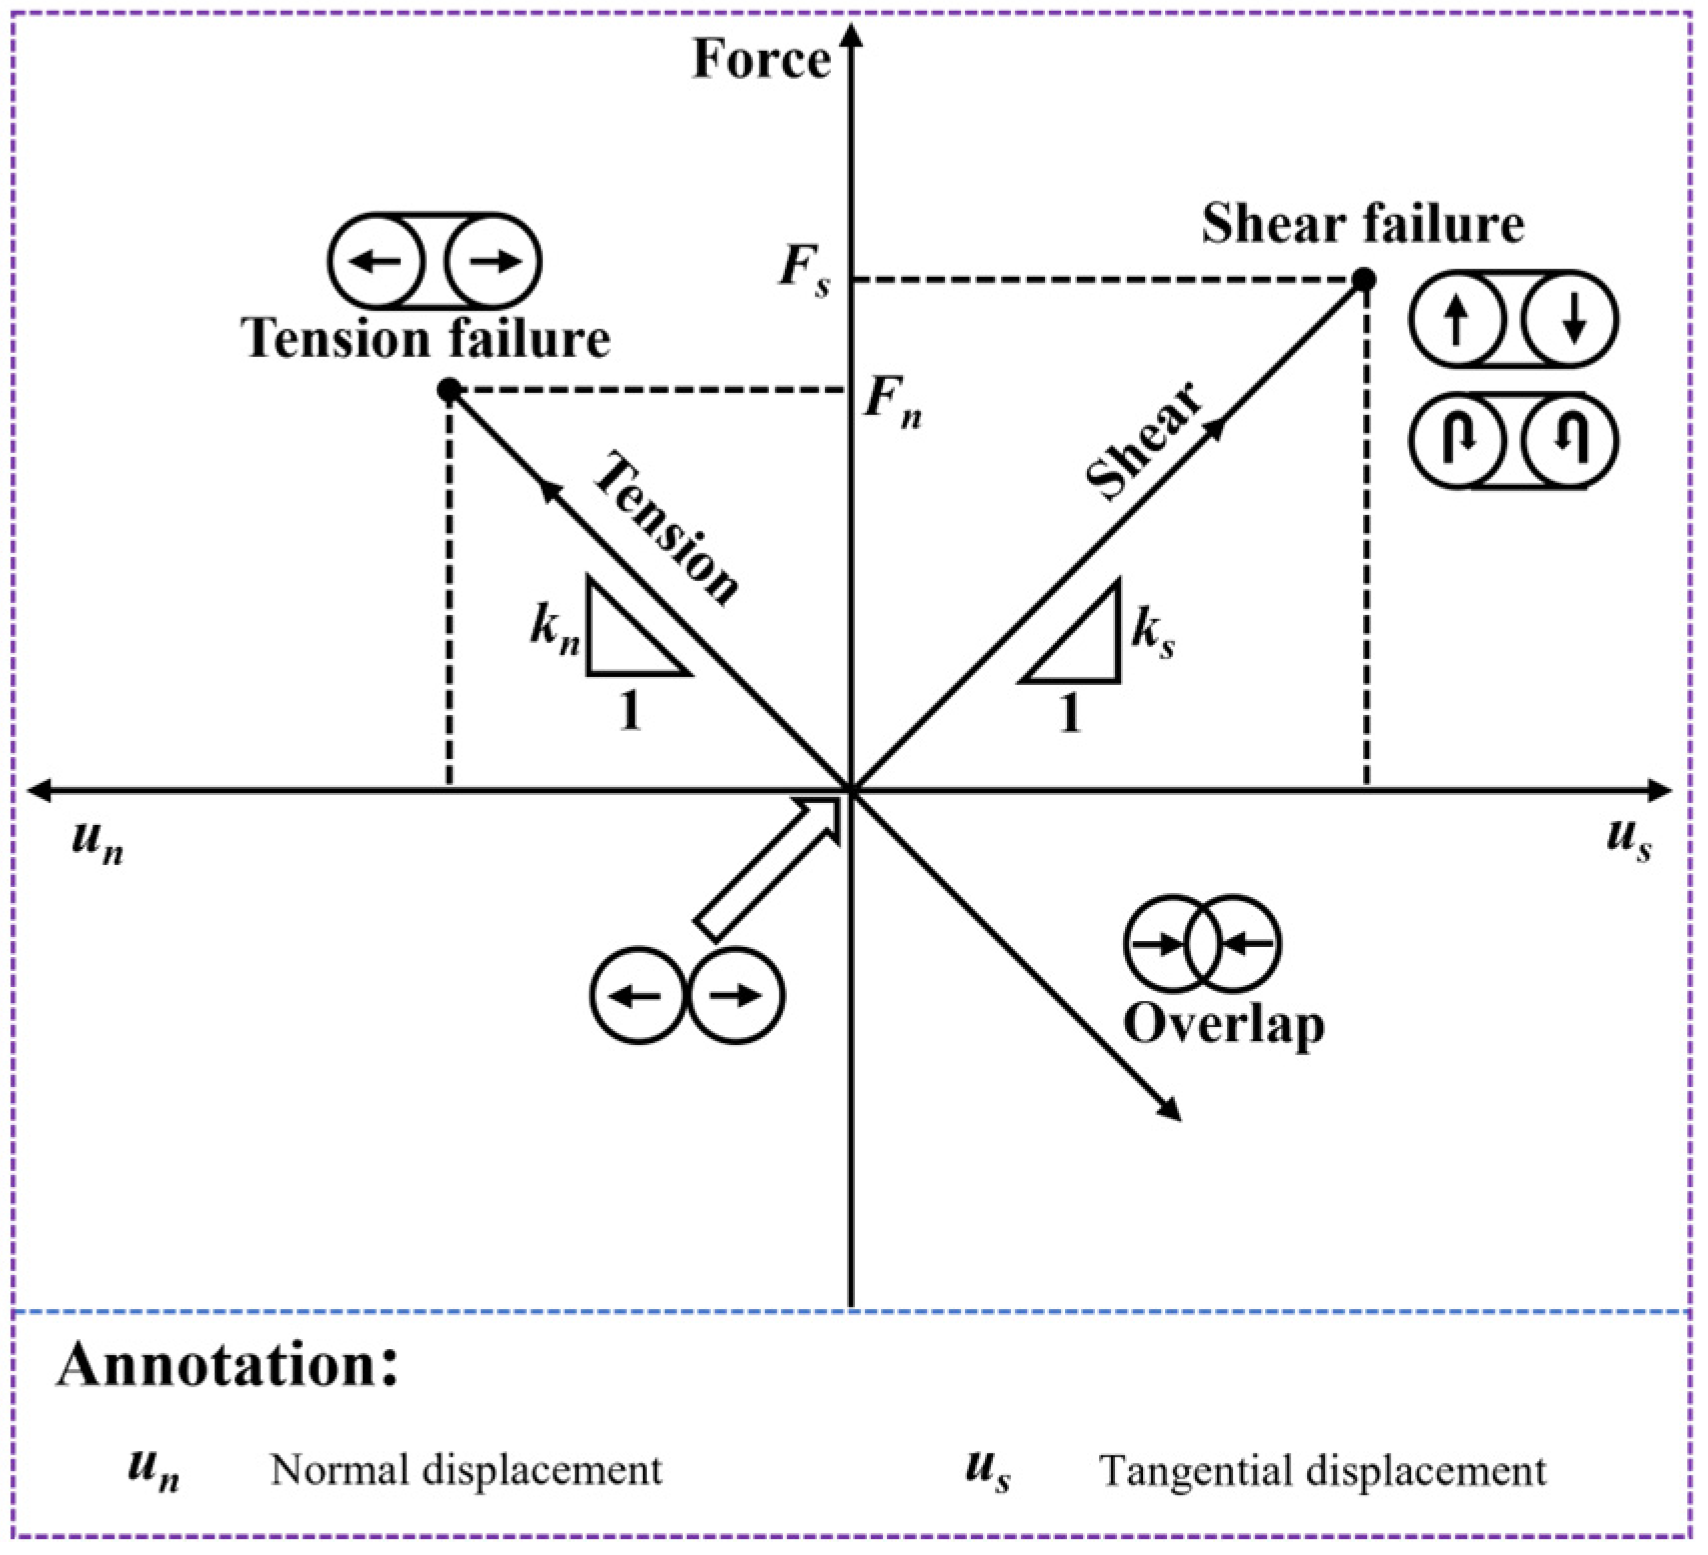
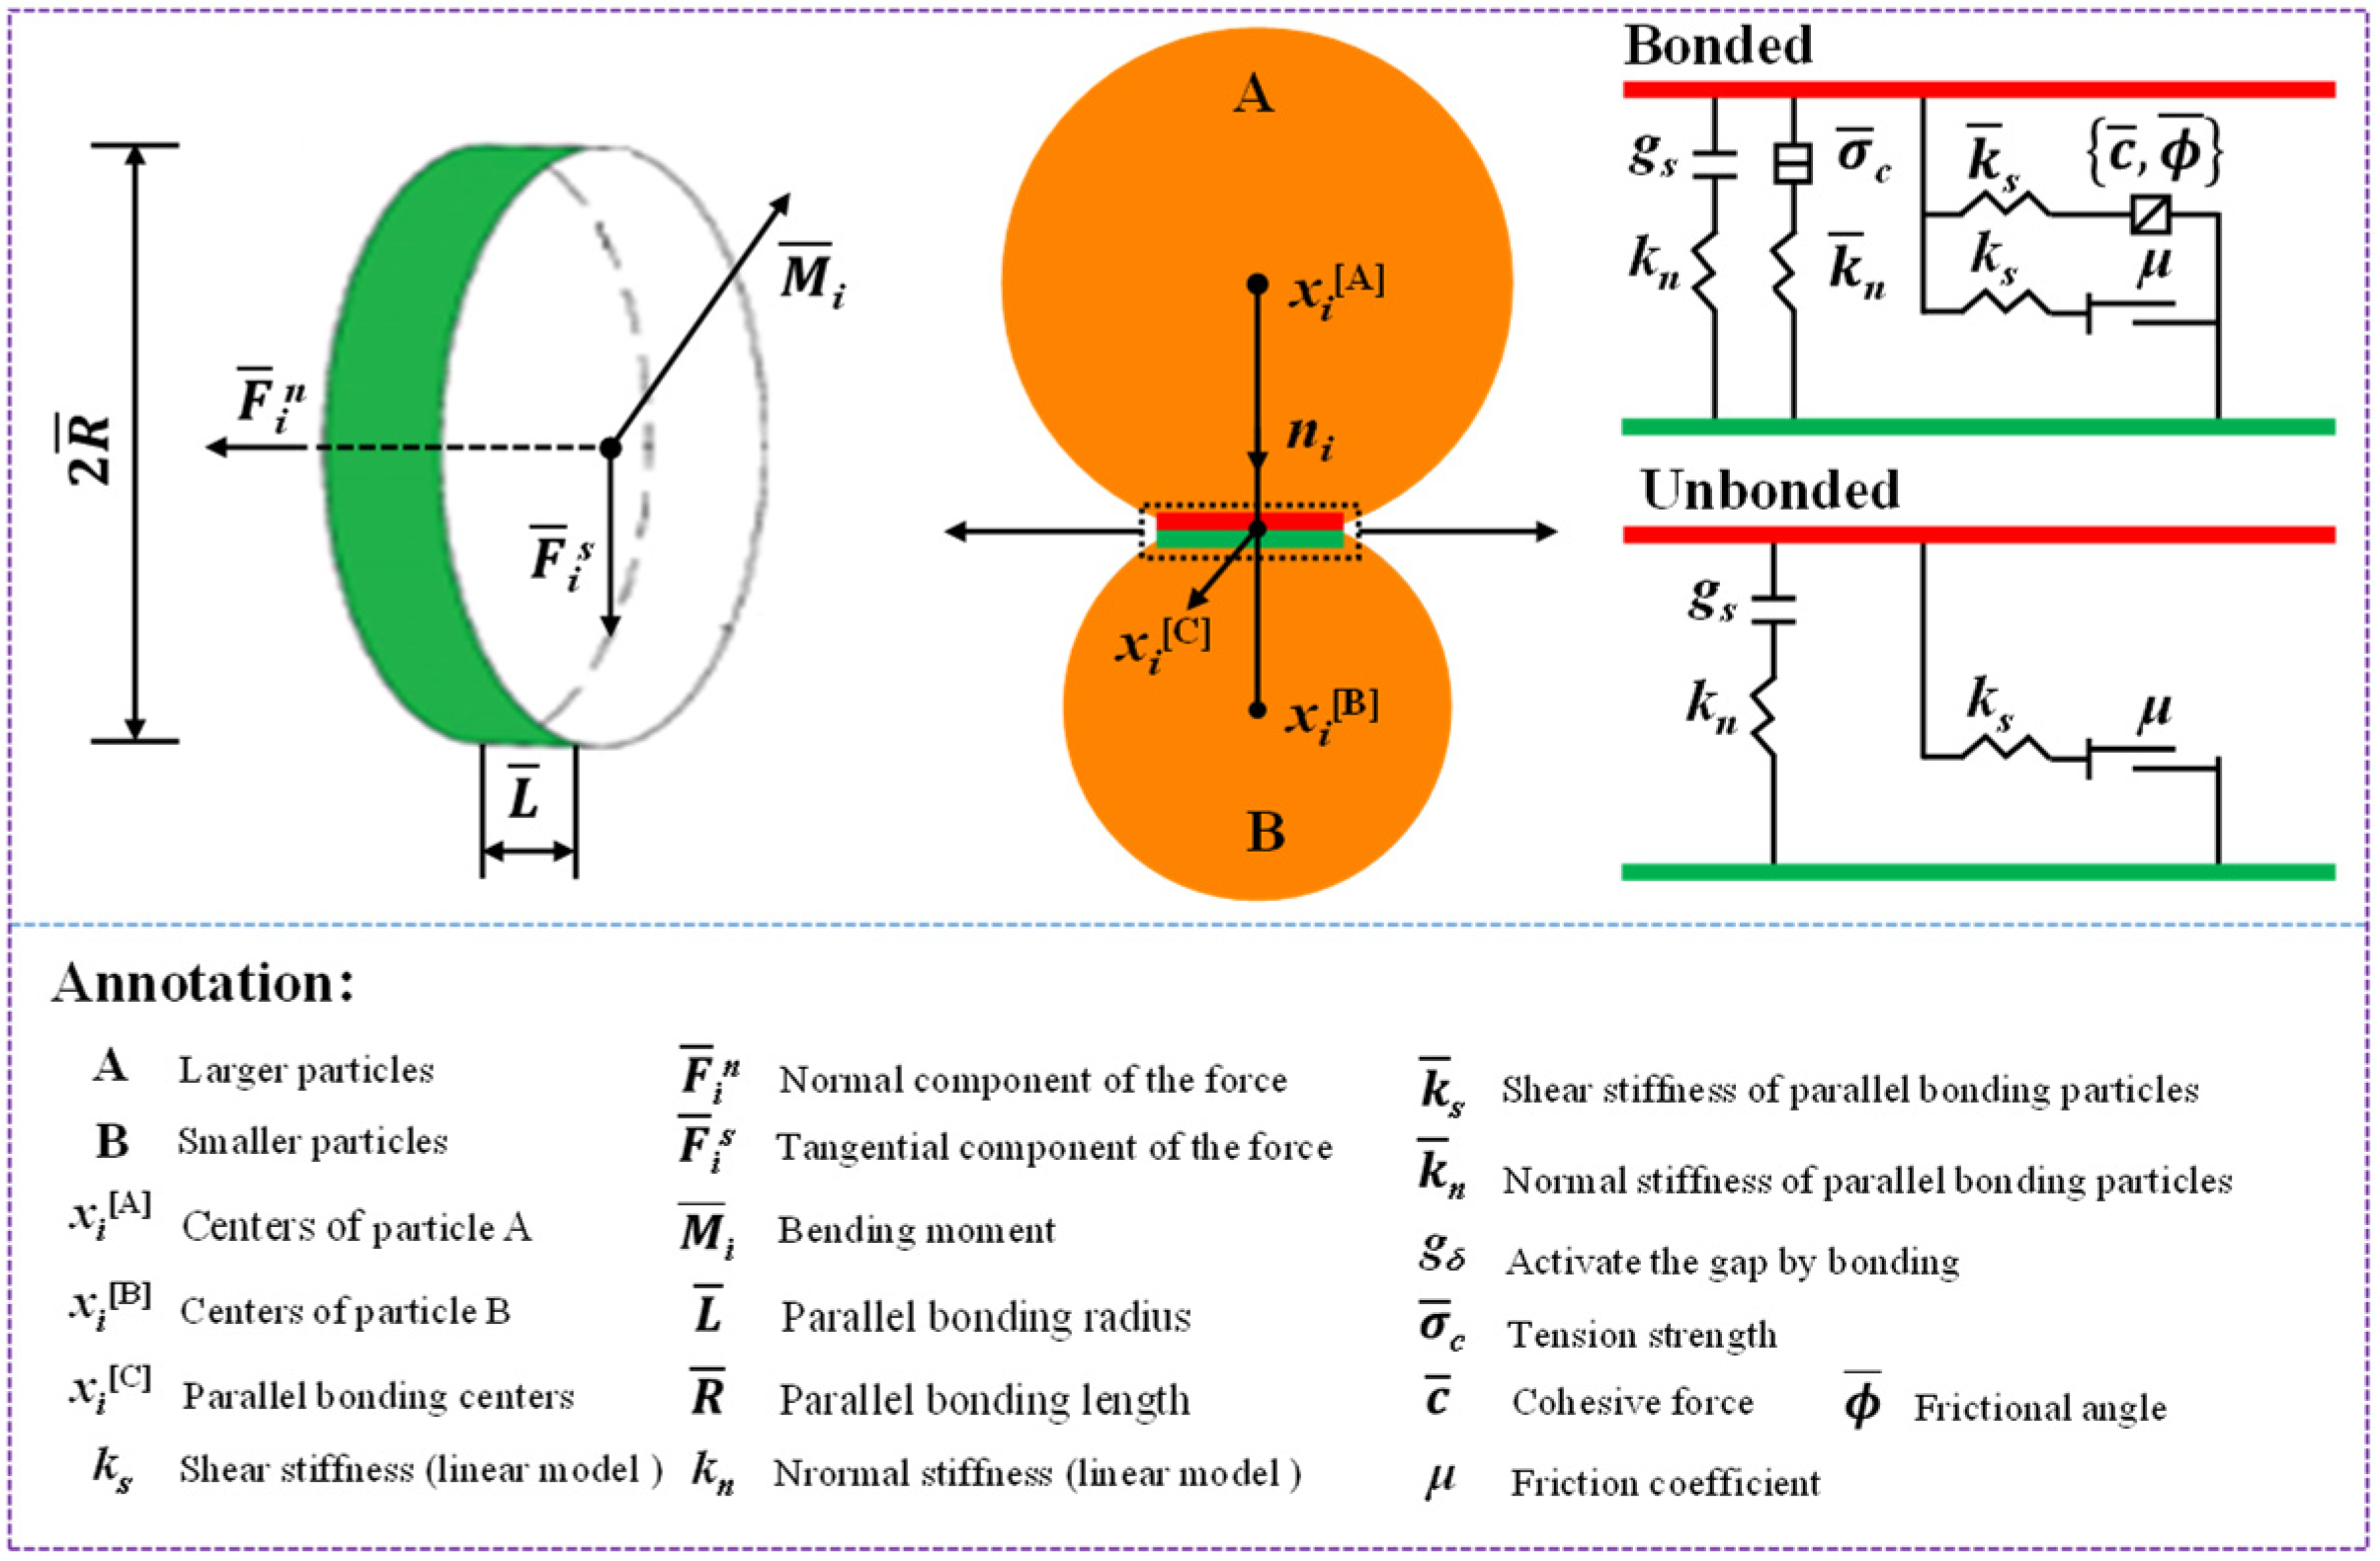
3.1. Particle Flow Code

Particle flow software (PFC 5.0) is a discrete element method for studying the characteristics of granular media by simulating their movement and interaction. Particle flow software provides two fundamental bonding models: the contact bonding model (CBM) and the parallel bonding model (PBM) [41,42]. The contact bonding model can be regarded as a pair of springs with constant normal and tangential directions at the bonding point between particles; the bonding range is minimal, and the spring has a specific tensile and shear strength, as shown in Figure 4 [43]. In the parallel bonding model, the interparticle is viewed as bonding material with mutual elastic action established within a particular range. Figure 5 indicates that the interparticle transmits both force and torque [44]. When the contact bonding model is used, the tensile strength of the bond is zero once the bond is broken in tension, regardless of whether the particles are in contact.
Therefore, assuming particle contact is maintained in the contact bond model, bond failure cannot significantly affect the macro stiffness, which is impossible for rocks. When the parallel bonding model is used, if either the maximum normal stress or the maximum tangential stress exceeds the corresponding parallel bonding strength, the parallel bonding will be destroyed, and the contact stiffness and bonding stiffness create the macro stiffness. Using parallel bonding during tension or shear fracturing can more accurately simulate the stress failure of coal–rock materials. Accordingly, this paper utilises a parallel bonding model. When the parallel bond is formed, the force F i ¯ and the bending moment M i ¯ are initialise to 0, and F i ¯ as follows [45]:
F i ¯ = F i n ¯ + F i s ¯
The effects of normal stress ( σ ¯ ) on parallel bonds and tangential stress ( τ ¯ ) can be calculated as follows:
σ ¯ = F i n ¯ / A + | M i ¯ | R ¯ / I
τ ¯ = | F i s | ¯ / A + | M t ¯ | R ¯ / J
where R ¯ is the parallel bonding length; M t ¯ is the torque; and J is the moment of inertia of the polar [46,47].
When the stress of parallel bonding exceeds the bonding strength, the bonding will fail, and the normal and tangential stresses will generate tensile and shear microcracks, respectively, by surpassing their corresponding bonding strength.

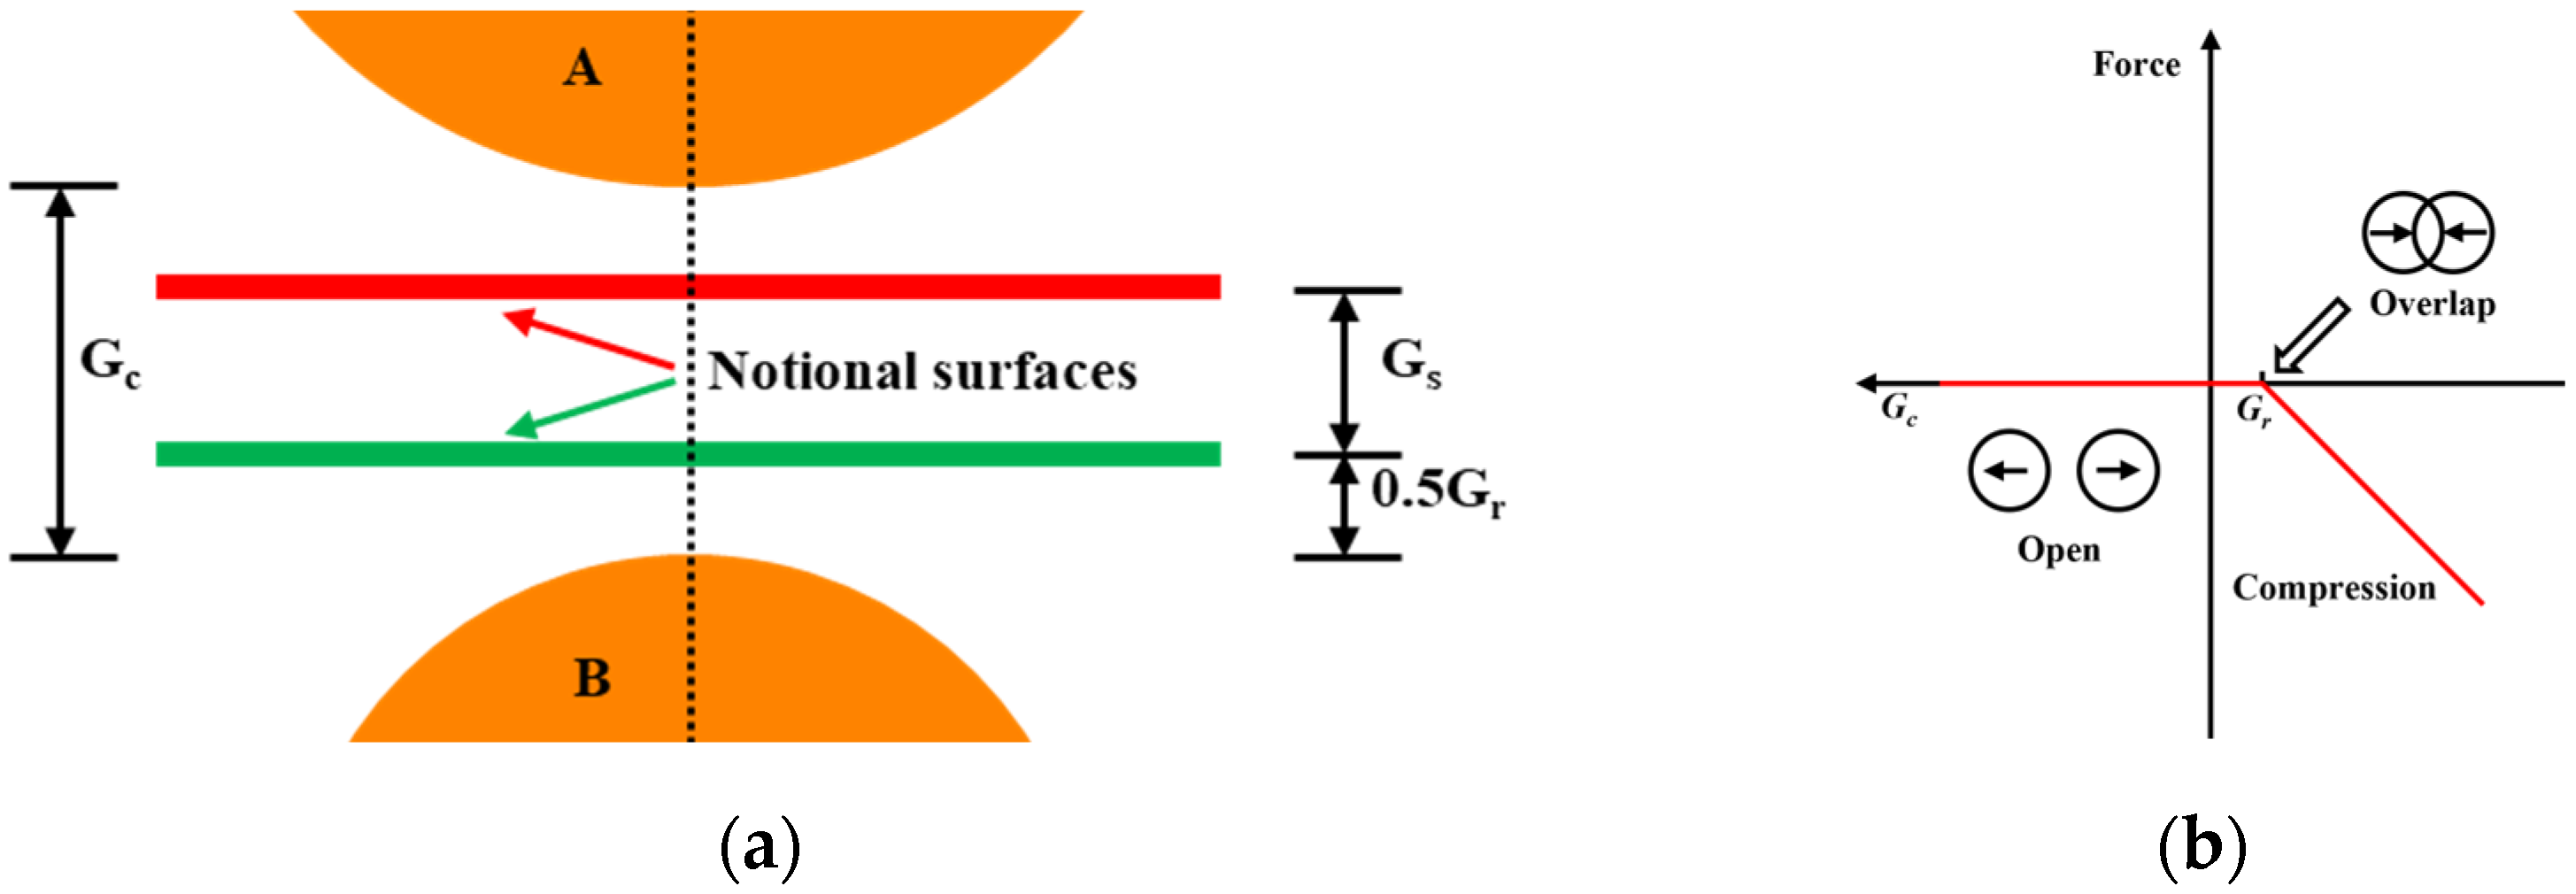
3.2. Presence of Initial Microcracks

Many studies have demonstrated that the parallel bond model has significant advantages for simulating rock materials [48,49]. These simulations did not identify the initial crack closure phase. This study introduces the surface concept of two adhesive particles to imitate the existing opening crack [50] (Figure 6). As axial stress increases, the opened microcracks are progressively forced to re-contact, causing the cracks to progressively close (Figure 6b), which ultimately leads to the compaction stage.
The total effective length L of the crack surface is illustrated in Equation (4), and the crack width Gr is determined by Equation (5).
L = j = 1 n l j
G r = G c + G s
where lj is the length of the jth crack; Gc is the contact gap determined by the positions of particles; and Gs is surface gap determined by positions of notional surfaces (Figure 6a). An ergodic search was performed for all the particle contact points in the rock specimens. Thereafter, the current value of the contact gap Gcv was obtained. In addition, a contact model property that leaves the constitutive model unchanged was obtained:
G c = k G c v
where k is the reference gap coefficient.
For contacts that have no initial overlap (Gc = 0) and are unbonded, the contact force begins at zero and continues to compress until the two particles move a sufficient distance apart (Gc < kGcv), a phenomenon known as crack closure.

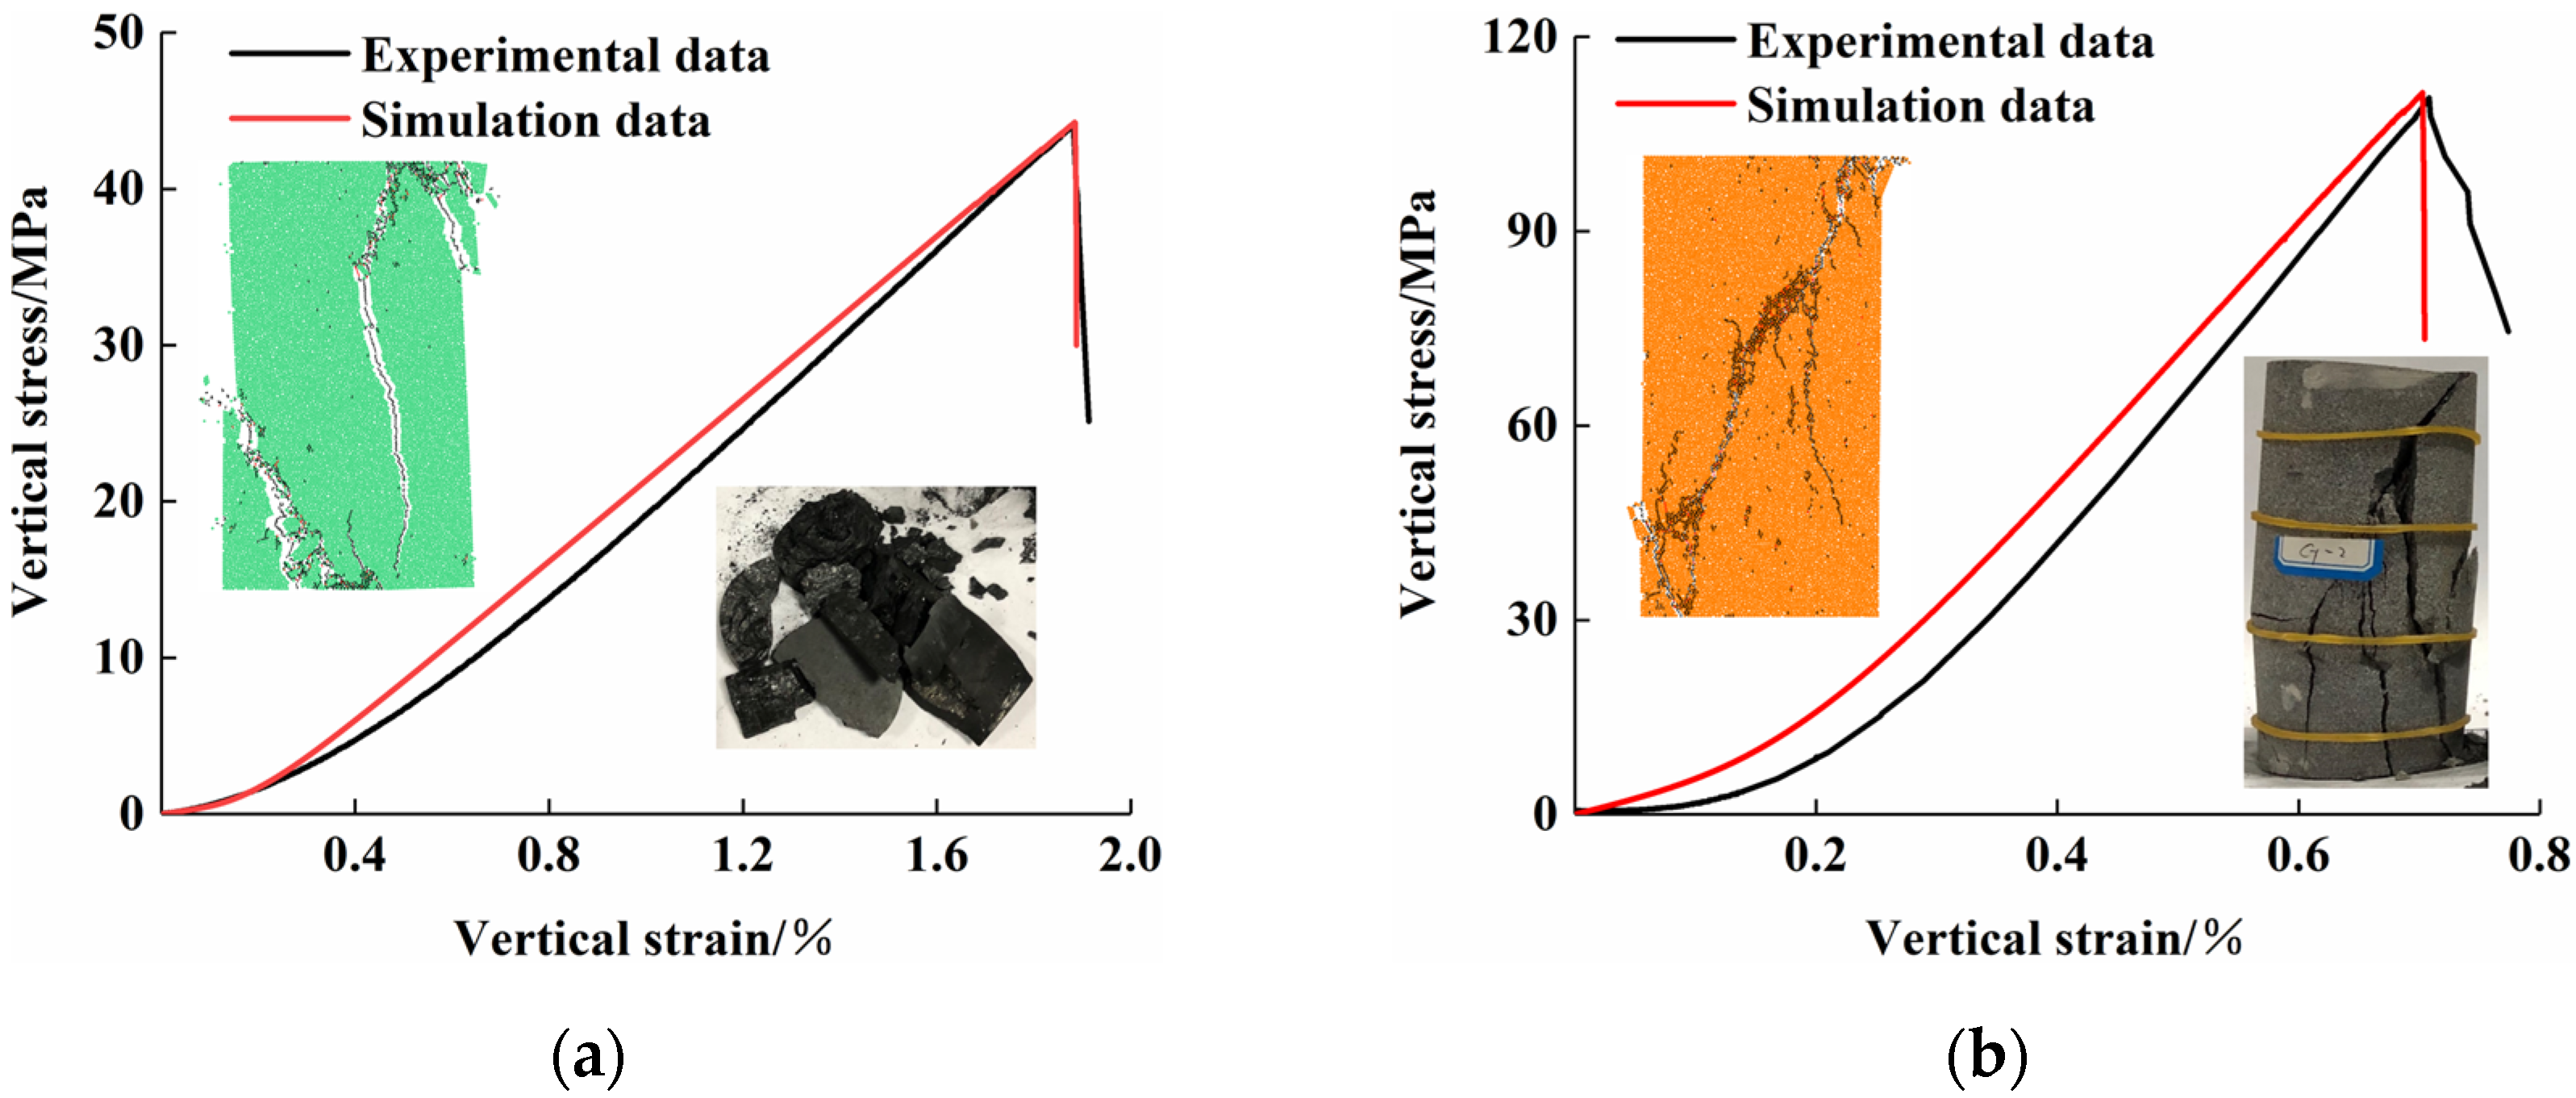
3.3. Calibration of Sandstone and Coal Microparticle Parameters

The initial compaction stage of the stress–strain curve is attained in the simulation process by writing the FISH function. The micro parameters are repeatedly calibrated through many simulation trials (trial and error approach) to guarantee that the numerical simulation results are consistent with the physical samples’ macro mechanical properties. By comparing the stress–strain curve of the laboratory uniaxial compression test of sandstone and coal with the findings of the uniaxial numerical simulation test, Figure 7 indicates that the peak stress, peak strain, elastic modulus, and other essential parameters have a strong correlation. Table 2 lists the mechanical parameters of sandstone and coal acquired via modelling and experimentation. Table 3 displays the microscopic parameters of CRC particles simulated numerically.
Figure 7 and Table 2 illustrate that via the final calibration of the micro parameters, the macro mechanical properties of the test specimen are recovered to a greater extent. Although the compressive strength, elastic modulus, and Poisson’s ratio derived from the physical experiment contain some errors, the deviation is insignificant. Numerous calculations are required to obtain microscopic parameters that correspond with physical experiments more accurately.

3.4. Model Construction of CRCs with Different Height Ratios of Coal to Rock
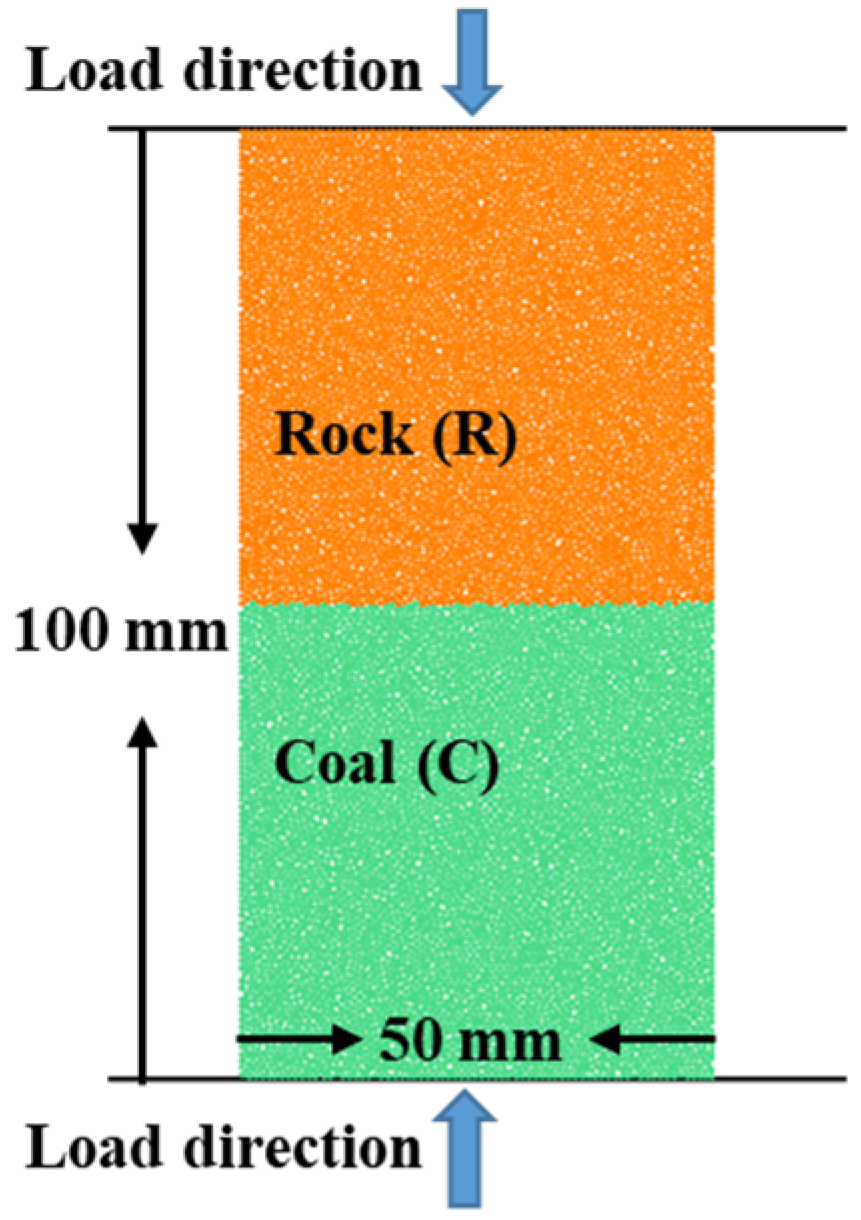
The model dimensions are 50 mm wide and 100 mm high. The minimum and maximum particle radii are 0.3 mm and 0.4 mm, respectively, to improve the calculation efficiency and reduce the number of particles. A total of 13,450 round particles of various scales are produced. The particle contact density is identical to the measured density, and the coal sample and sandstone have densities of 1300 kg/m3 and 2600 kg/m3, respectively. Two rigid walls serve as loading plates at the top and bottom. Figure 8 shows a schematic diagram of the coal and rock combination model (taking 5:5 as an example).
Establishment method for coal–rock association:
(1)
A ball model with the same dimensions as the standard specimen in physical experiments was developed. To maintain the simulation’s accuracy, all the parameters of the initial modelling must be consistent.
(2)
Grouping by various coal-to-rock height ratios and assignment of micro parameters based on calibration results. The bonding surface parameters are determined according to the mechanical properties at the interface of the CRC (the analysis results in Section 4.2), with a large number of simulation trials (trial-and-error method). Table 4 displays the micro parameters of the bonding surface. The assignment of bonding parameters is based on the particle range, where the ‘Cmat’ command follows the principle of assignment from large to small, and the ‘Contact’ command from small to large. Group 1 comprises the rock, group 2 the coal, and group 3 the interlayer.
(3)
Uniaxial compression experiments were conducted on assemblages with various coal-to-rock height ratios by eliminating the two side walls and keeping the upper and lower loading plates.

4. Mechanical Properties of RCR

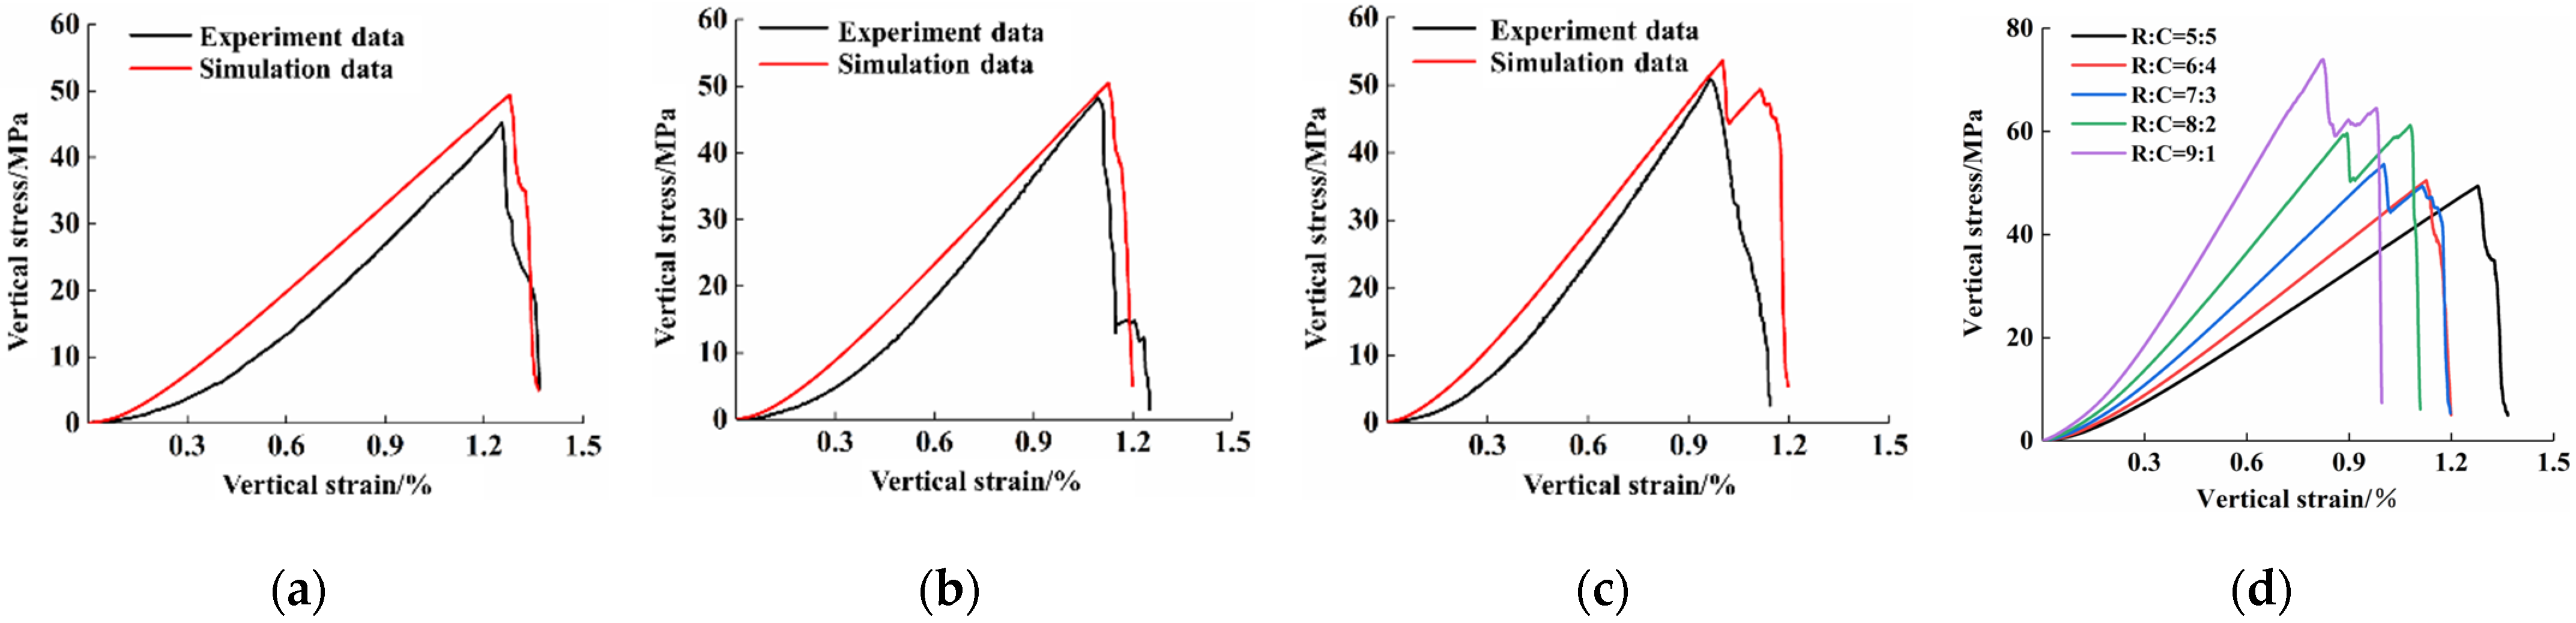
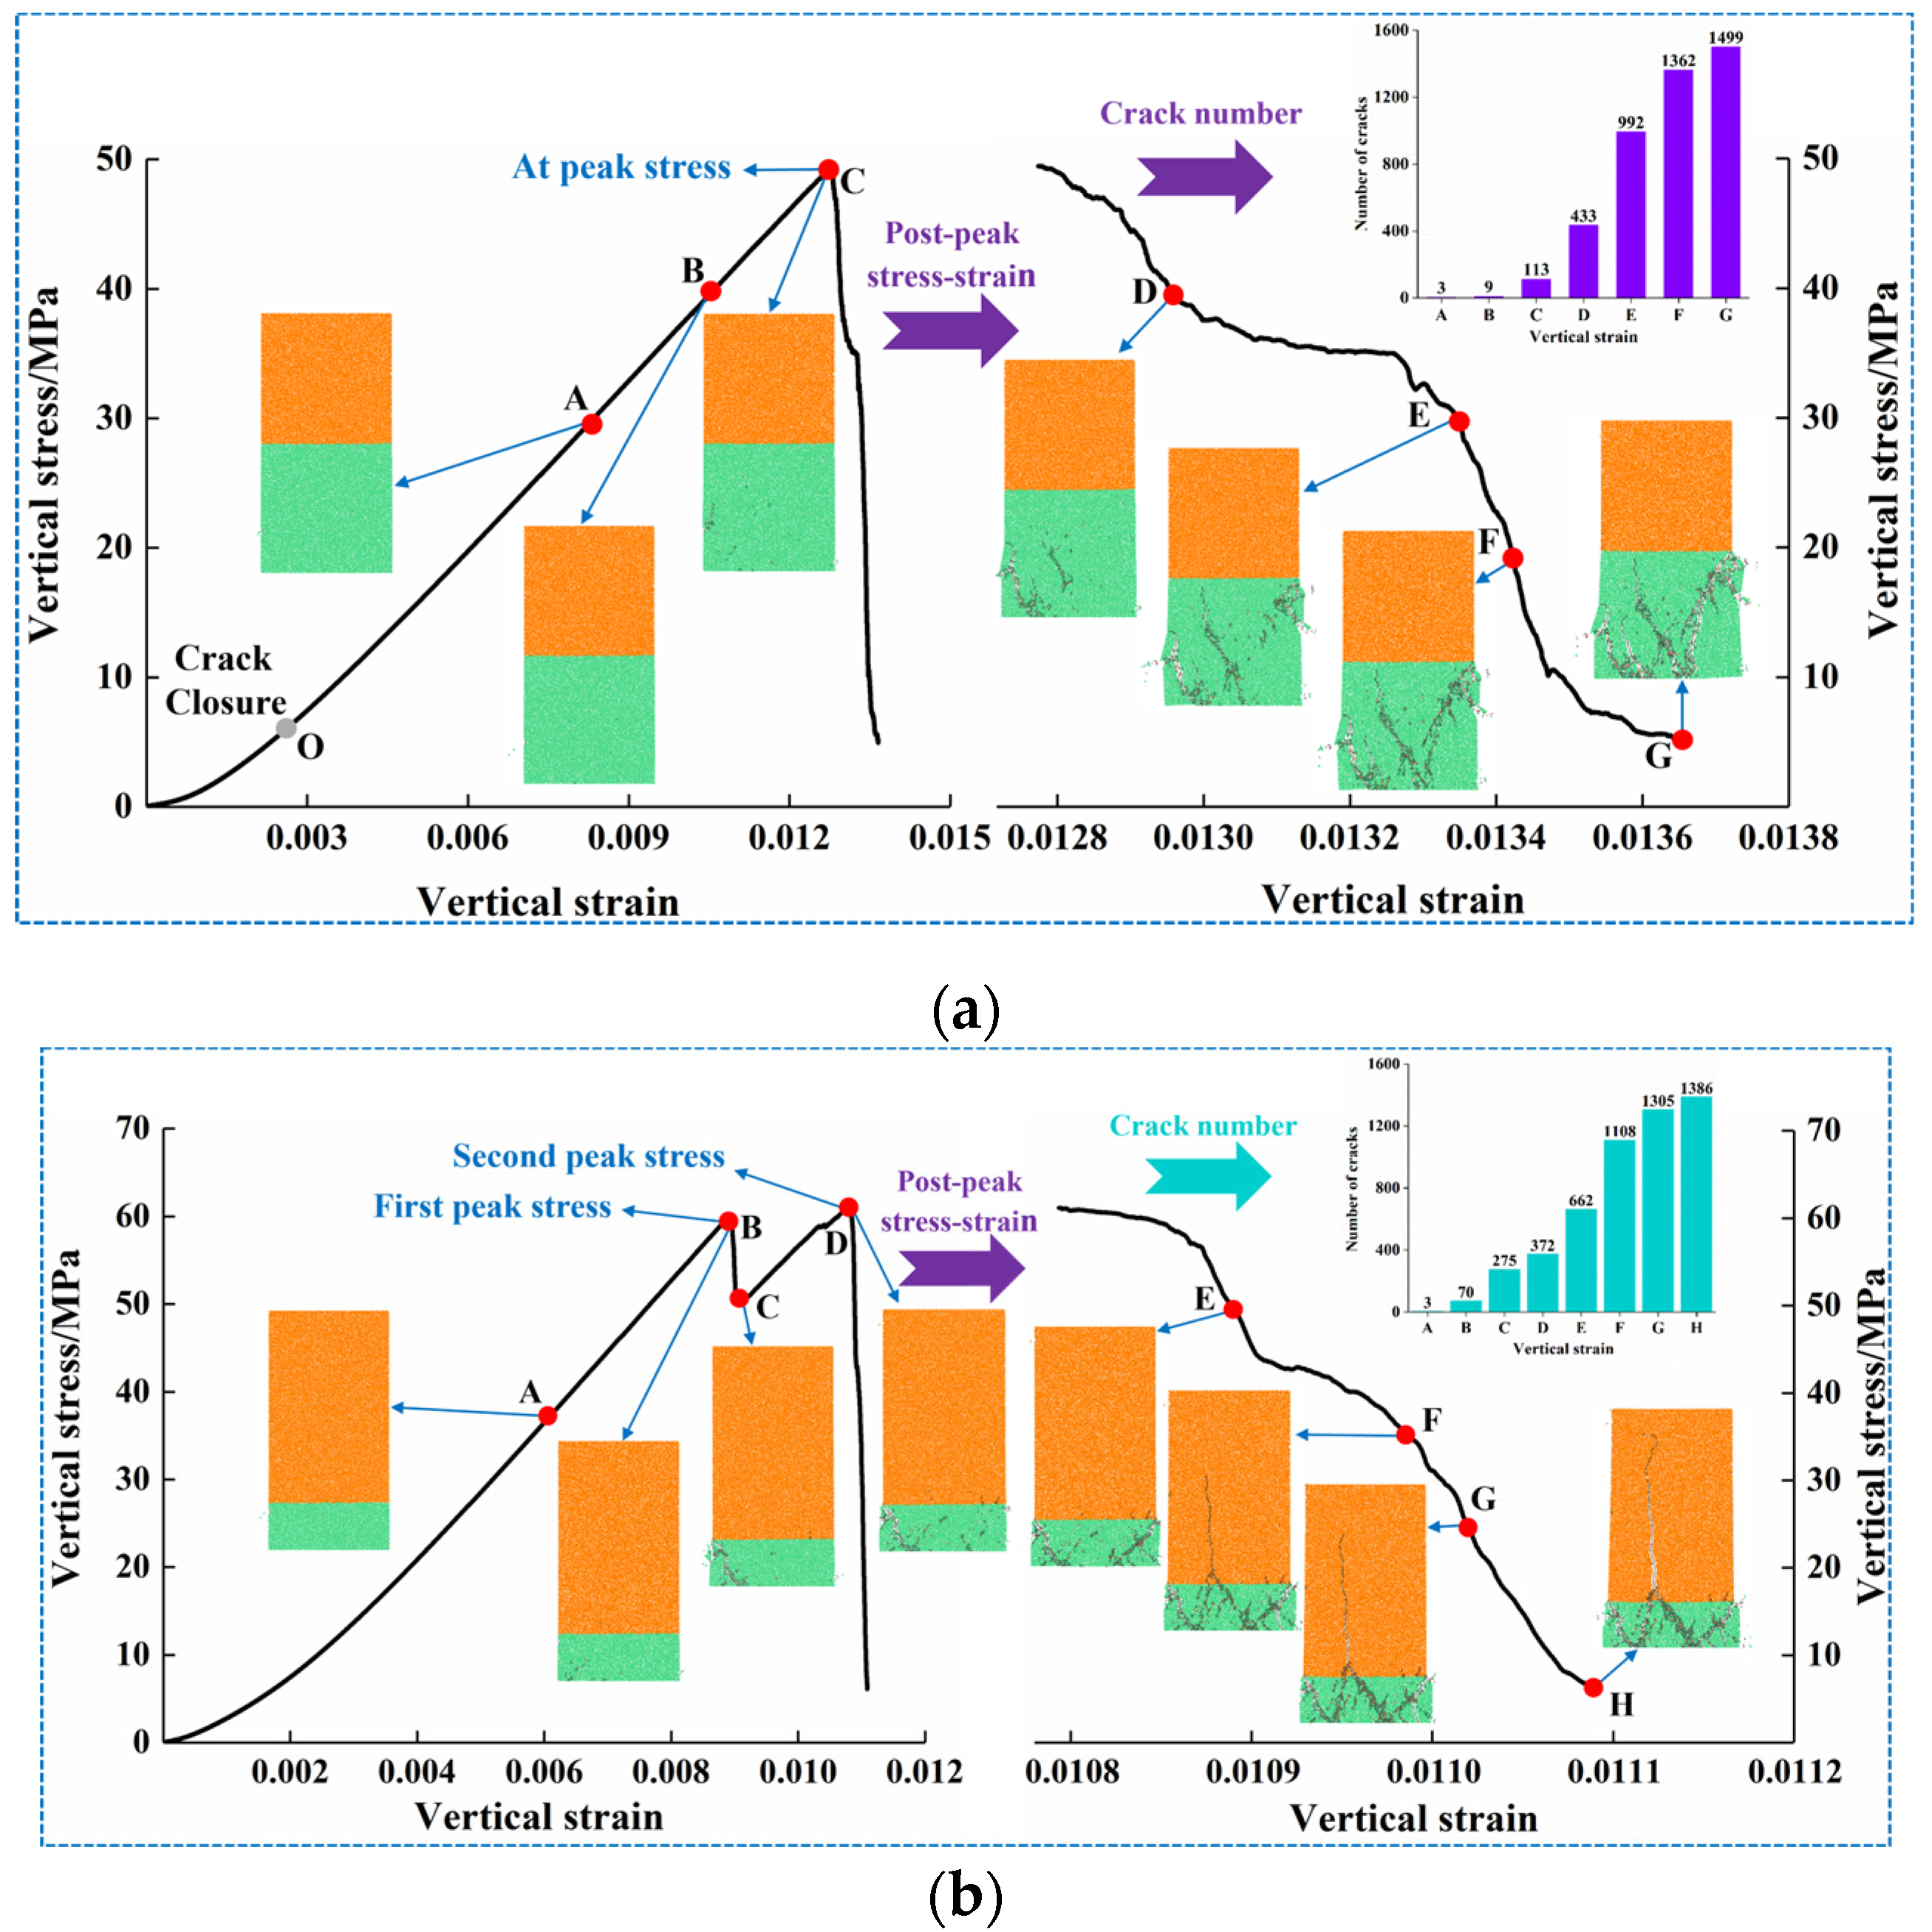
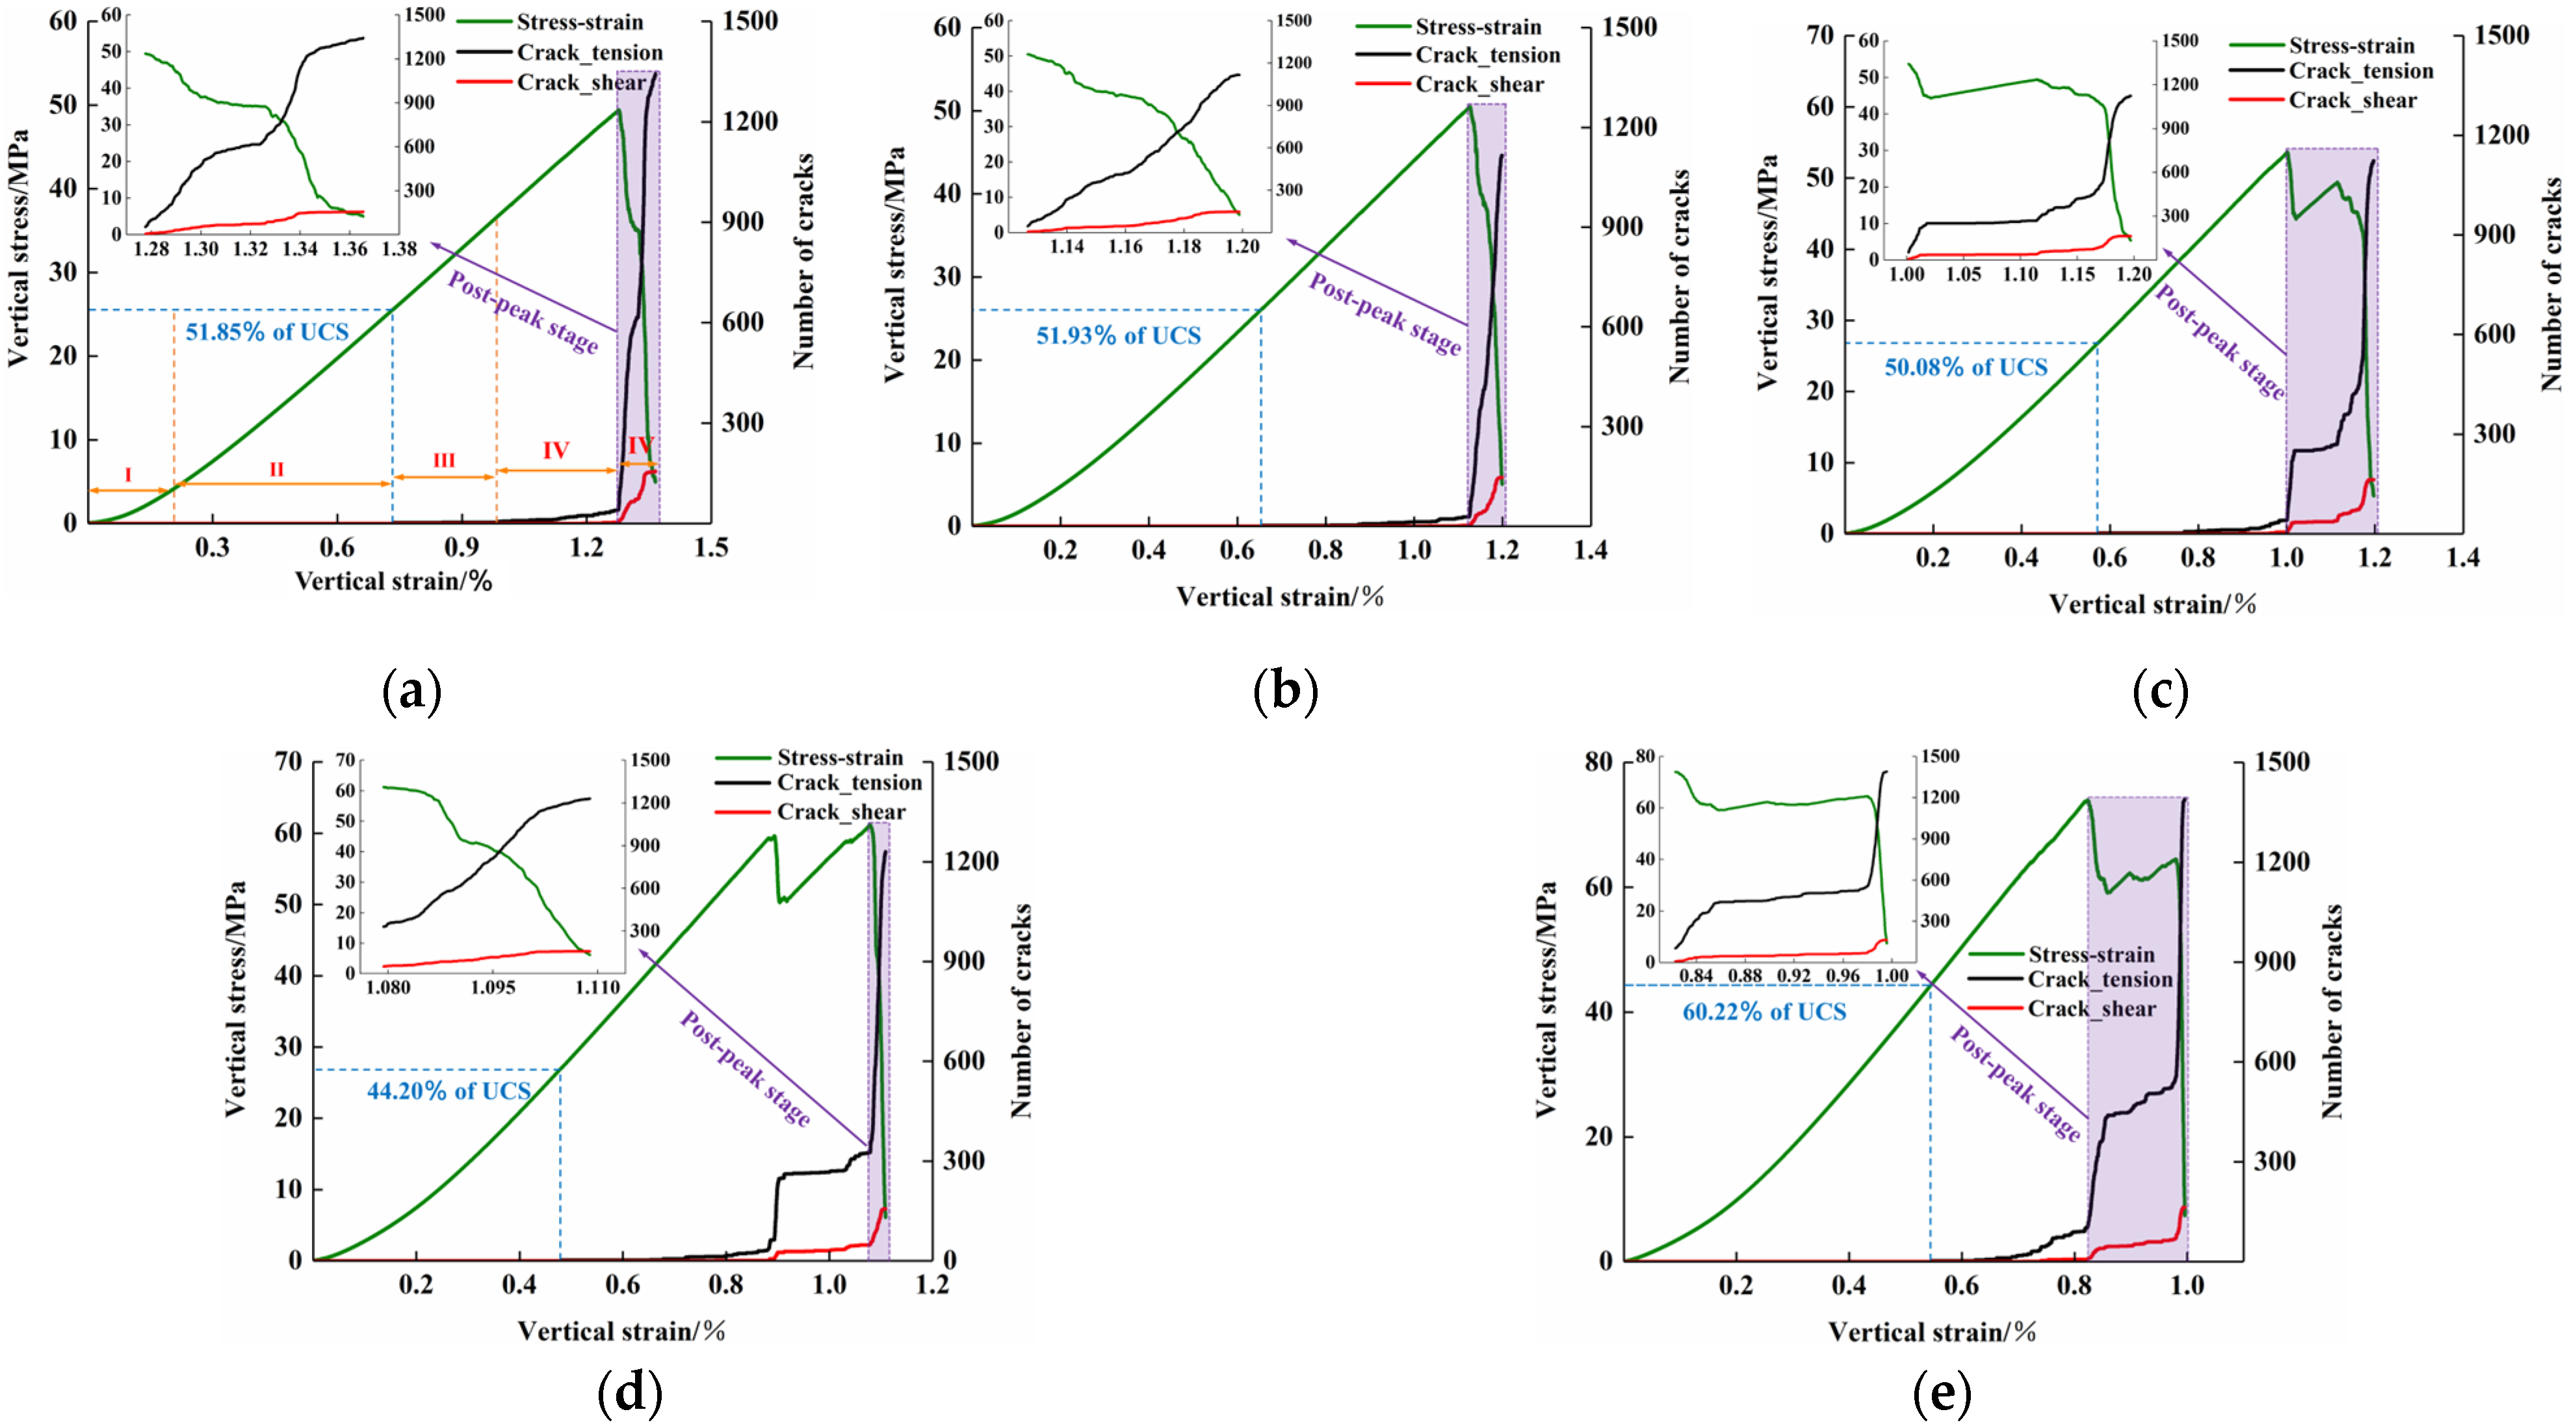
4.1. Stress–Strain Curve

The simulated axial stress–strain curve is compared to the experimental data, as revealed in Figure 9. As can be seen, the numerical simulation outcomes are more consistent with the laboratory test outcomes, which all pass through the initial compaction stage, linear elastic stage, and macro damage stage. Comparing R:C = 5:5, R:C = 6:4, and R:C = 7:3 demonstrates the feasibility of the parameters, and the CRC is simulated under the conditions of R:C = 8:2 and R:C = 9:1, depending on this parameter. Figure 9d indicates that the uniaxial compressive strengths of CRCs ranging from R:C = 5:5 to R:C = 9:1 were 49.41 MPa, 50.48 MPa, 53.64 MPa, 61.19 MPa, and 73.94 MPa, respectively, and the moduli of elasticity were 4.26 GPa, 5.03 GPa, 6.15 GPa, 9.73 GPa, and 11.13 GPa, respectively. The uniaxial compressive strength (UCS) and elastic modulus decline steadily as the coal proportion increases, but remain higher than those of single standard coal. The simulation findings for five types of coal–rock composite materials agree with the laboratory observation findings [51,52].
Figure 10 shows the UCS of the CRC specimens after failure with the coal thickness. To determine the effect of coal thickness on the compressive strength, the best fitting equation is obtained using non-linear regression, and the relationship between the compressive strength and the coal thickness can be described using an exponential equation, as follows:
y = 47.39 + 53.25 e 0.07 x

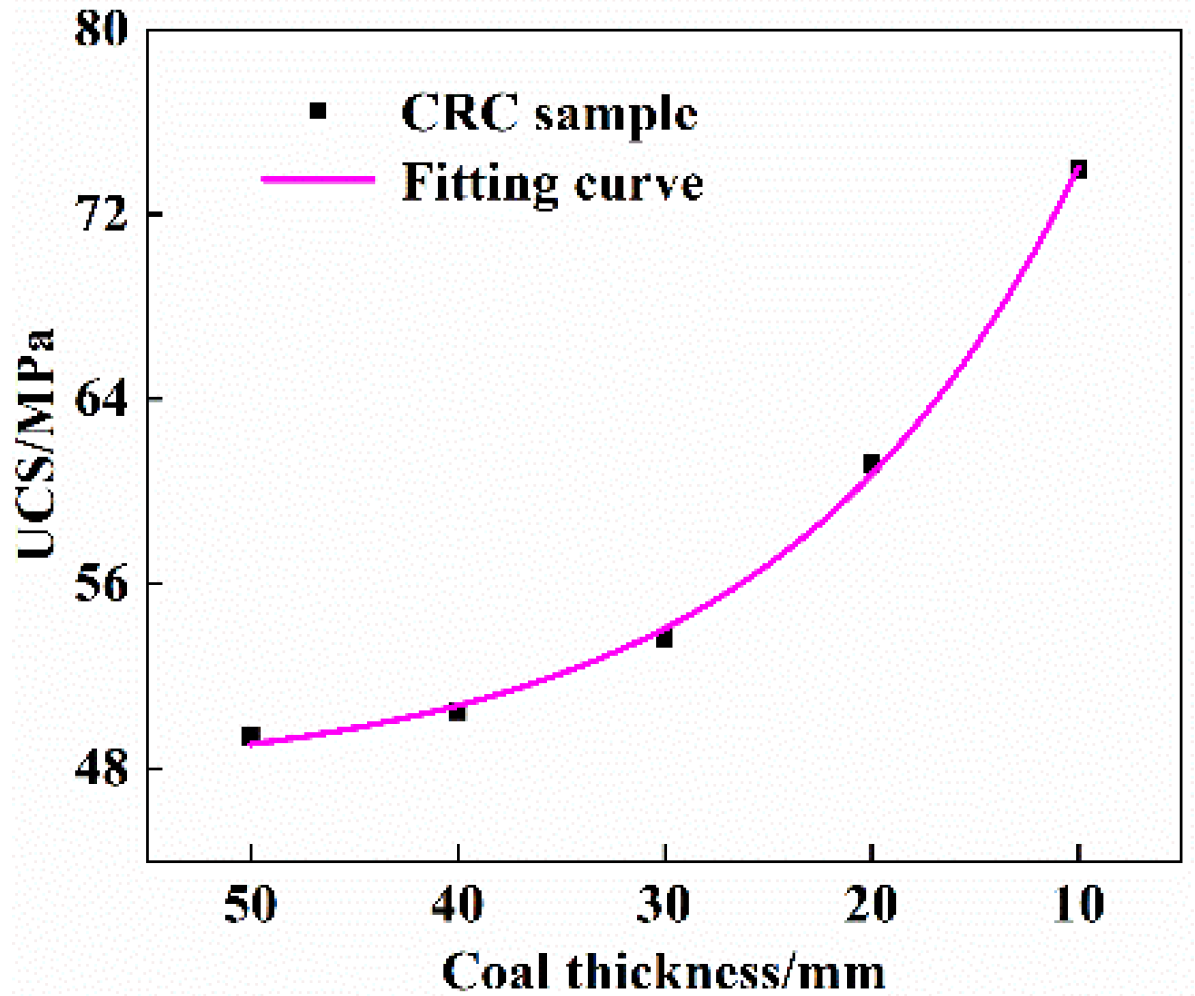
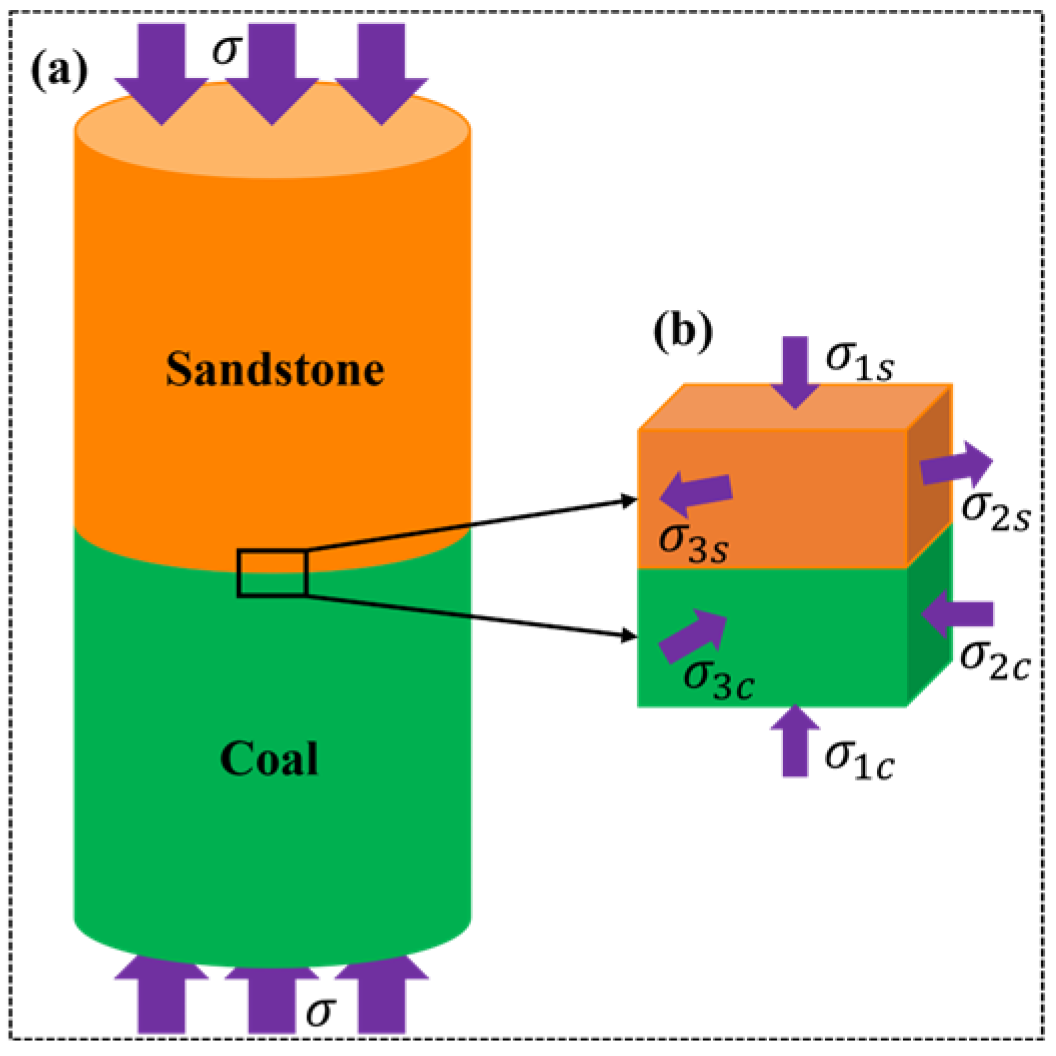
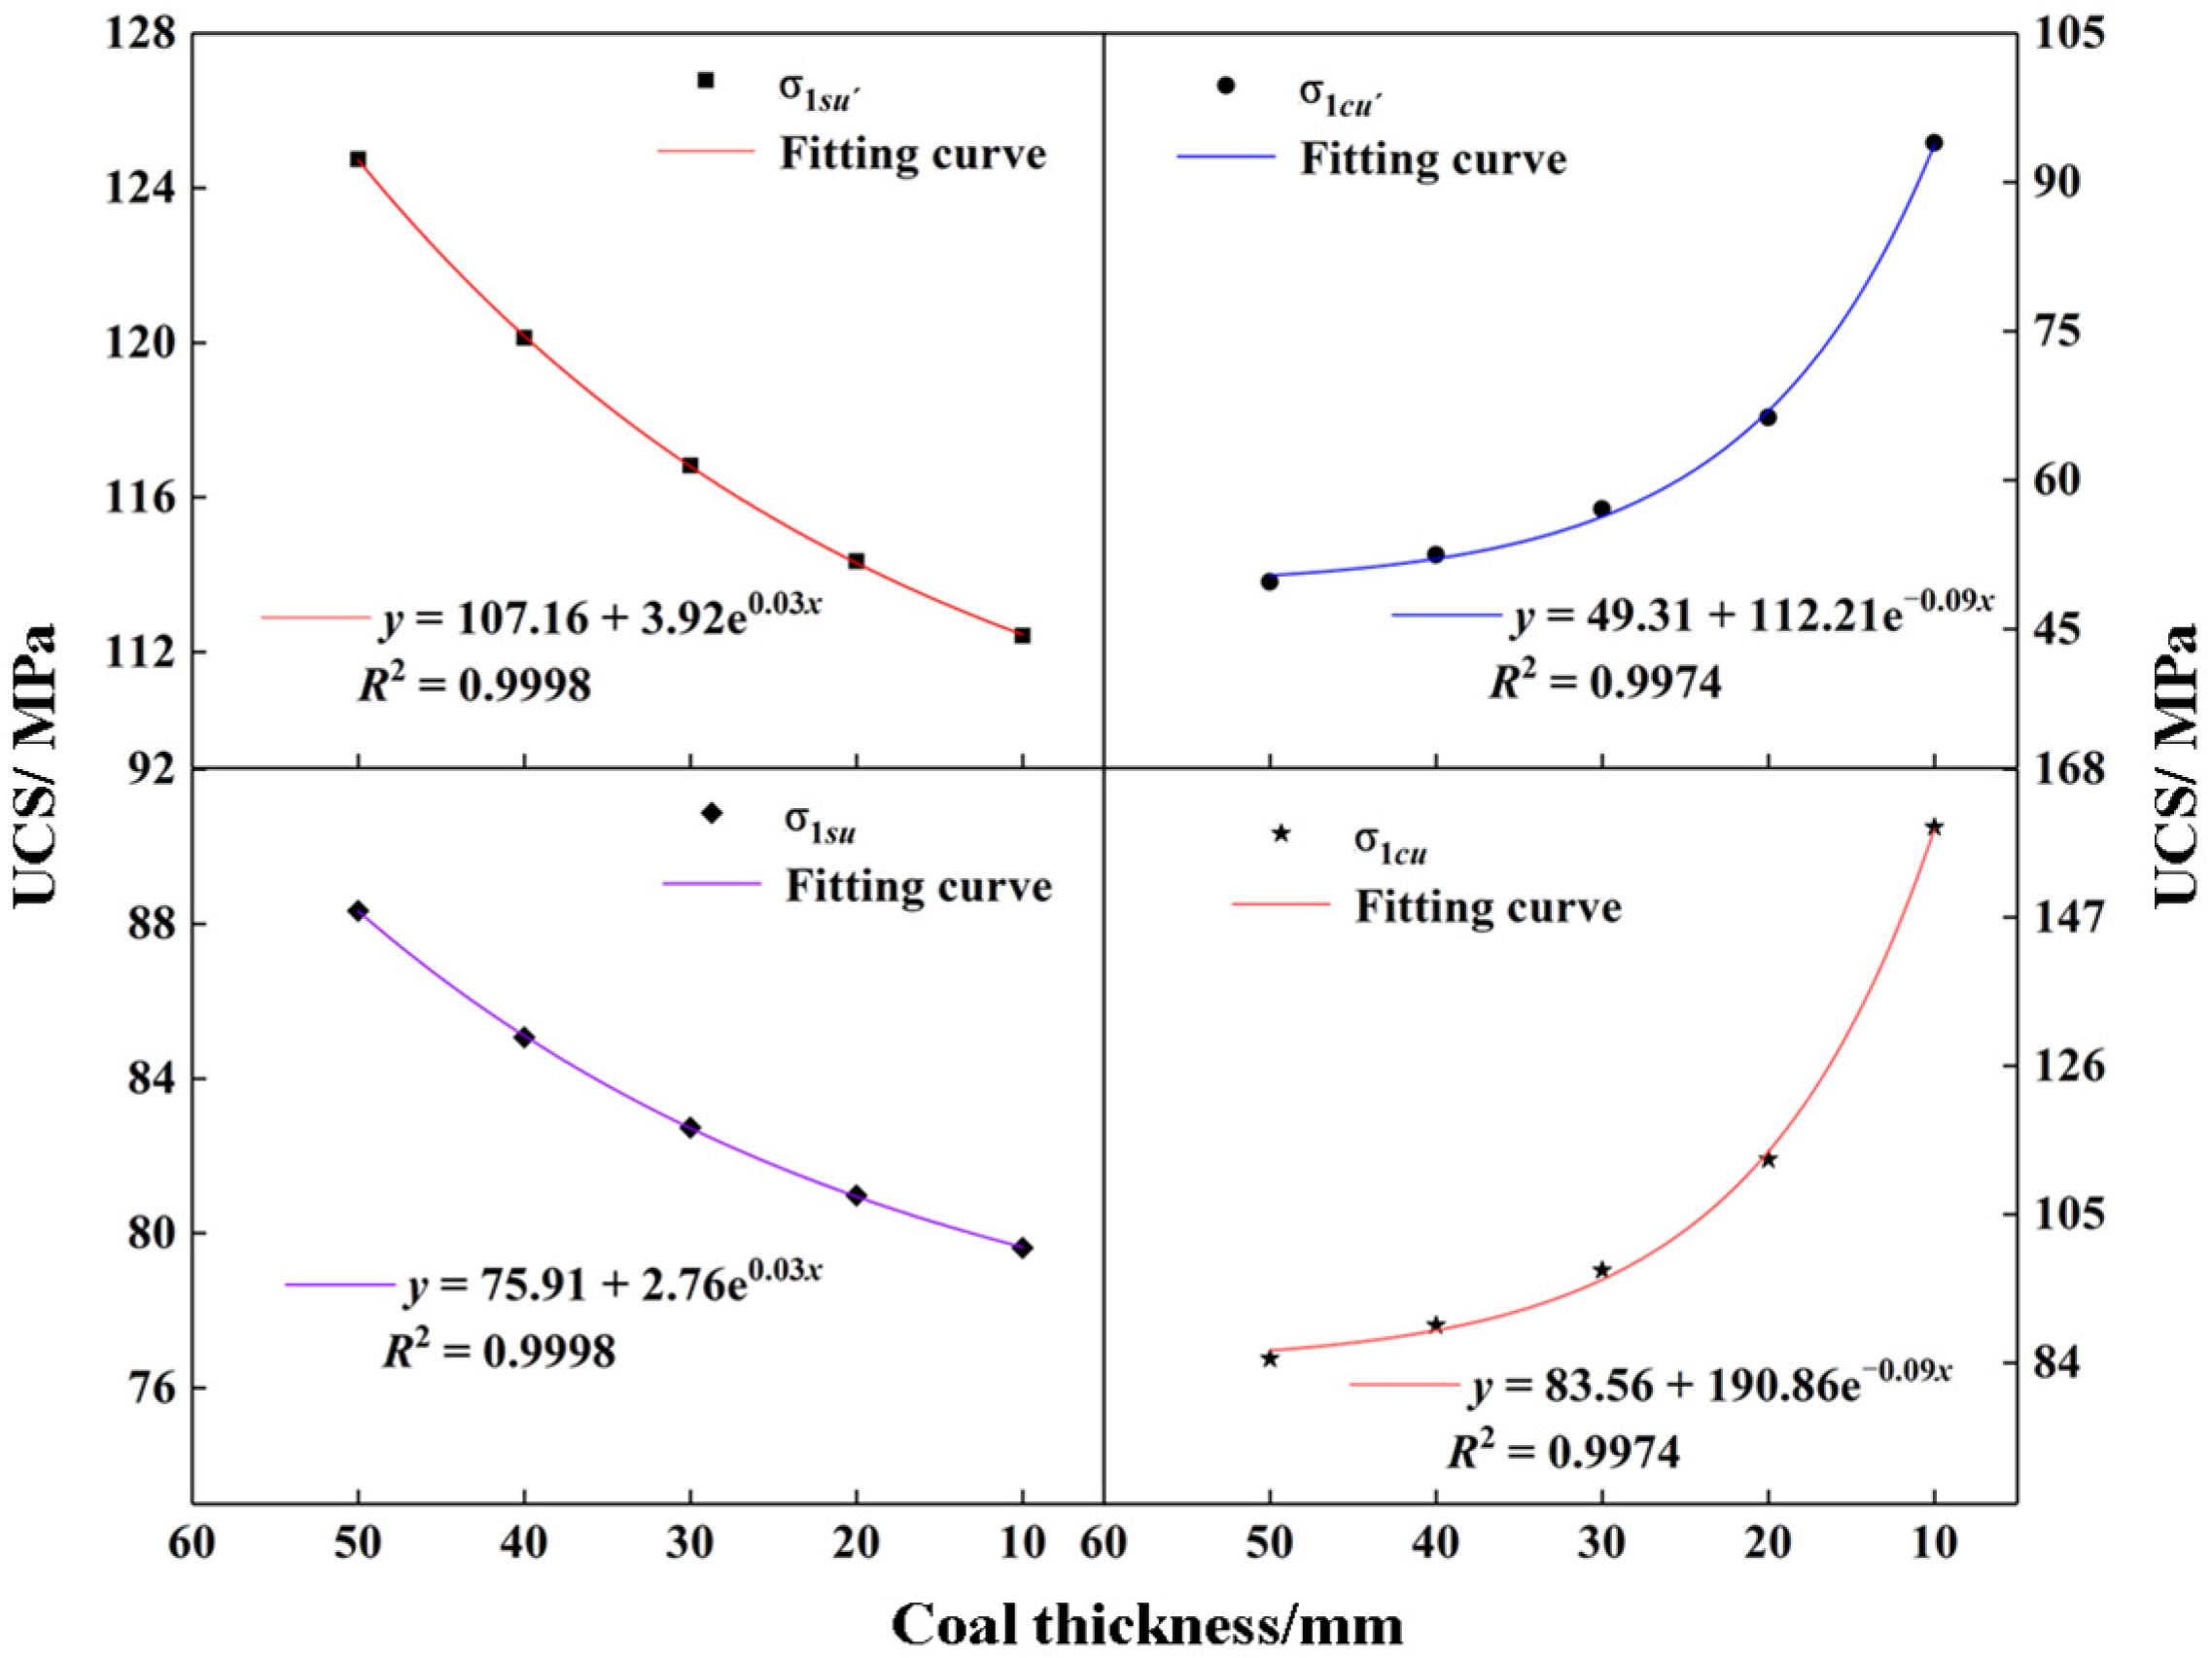
4.2. Results of Theoretical Analysis of Strength Characteristics

To determine the relationship between coal and rock strength and the failure mode of the combined body, the stress state of each element in the combined model at various positions is analysed, as shown in Figure 11. The sandstone and coal in the CRC are bonded as a single unit using the strong adhesive. It is assumed that there is no relative displacement between sandstone and coal at the interface after deformation, and the thickness of the interface is disregarded. The horizontal strain of sandstone and coal under uniaxial loading can be derived utilising Hooke’s law, as follows:
ε 2 s = ε 3 s μ s σ 1 s / E s
ε 2 c = ε 3 c μ c σ 1 c / E c
where ε2s′, ε3s′, ε2c′, ε3c′ are the strain of sandstone and coal in a horizontal direction, respectively; μs and μc are Poisson’s ratio of sandstone and coal, respectively; σ1s′ and σ1c′ are the axial stress of sandstone and coal, respectively; and Es and Ec are the elastic moduli of sandstone and coal, respectively.
The relationship between elastic modulus and Poisson’s ratio of sandstone and coal is μs < μc and Es > Ec, respectively. Equations (8) and (9) indicate, based on the previous assumptions and the relationship between the elastic modulus and Poisson’s ratio of sandstone and coal, that sandstone and coal have various Poisson effects and create bond-constraining forces near their interface, which reduce as the distance from the interface increases. Figure 11b demonstrates that coal causes tensile stress (σ2s and σ3s) in the sandstone near the interface, whereas the sandstone induces compressive stress (σ2c and σ3c) in the coal.
The stress and lateral strain levels of sandstone and coal near the interface meet the following relationships based on continuous deformation conditions, the static equilibrium relationship, and generalized Hooke’s law [21,53]:
σ 2 s = σ 2 c = σ 3 s = σ 3 c = K s c σ
σ 1 s = σ 1 c = σ
ε 2 s = ε 3 s = ε 2 c = ε 3 c
where σ′ is the same axial stress of sandstone and coal near the interface; σ1s and σ1c are the axial stress values of sandstone and coal near the interface, respectively; ε2s, ε3s, ε2c, and ε3c are the lateral strain values of sandstone and coal near the interface, respectively; and K s c = E s μ c E c μ s E s ( 1 μ c ) + E c ( 1 μ s ) is the coefficient of bond-constraining forces at the interface.
Accordingly, the sandstone and coal stress state near the interface changes from a unidirectional compression state to a three-dimensional compression–tension and three-dimensional compression due to the bond-constraining forces of the combination interface, i.e., the lateral strain constraint. However, the area far away from the interface remains in a condition of unidirectional compression due to the absence or weakness of bond-constraining forces, namely:
{ σ 1 s = σ 1 c = σ σ 2 s = σ 3 s = σ 2 c = σ 3 c = 0
where σ″ is the same axial stress of sandstone and coal outside the interface region; σ2s′, σ3s′, σ2c′, and σ3c′ are the stress of sandstone and coal in two principal horizontal directions outside the interface region, respectively. Tan et al. and Song et al. employed the Griffith strength criterion to determine the limit stress of sandstone and coal near and far from the interface region, as follows [51,53]:
{ σ 1 = σ 1 s u > 0 σ 3 = K s u σ 1 s u < 0
{ σ 1 = σ 1 c u > 0 σ 3 = K s c σ 1 c u > 0
{ σ 1 = σ 1 s u = σ 1 c u > 0 σ 3 = 0
where σ1 and σ3 are the maximum and minimum principal stress, respectively; σ1su and σ1cu are the ultimate compressive strength of sandstone and coal near the interface, respectively; and σ1su′ and σ1cu′ are the ultimate compressive strength of sandstone and coal outside the interface region.
To obtain the ultimate compressive strength of sandstone and coal near and far from the interface region, it is proposed that the UCS of both materials is known and subjected to uniaxial stress σ, while the interface bond-constraining forces are in the limit equilibrium state. Mohr strength condition expressions for sandstone and coal are computed according to the Mohr strength theory, as follows:
σ 1 = f s σ 3 + σ s u
σ 1 = f c σ 3 + σ c u
where fs and fc are the internal friction coefficients of sandstone and coal, respectively; σsu and σcu are the UCS of sandstone and coal, respectively.
The ultimate compressive strength of sandstone and coal near the interface can be calculated using Equations (14), (15), (17) and (18), respectively, as follows:
σ 1 s u = σ s u / ( 1 + K s u f s )
σ 1 c u = σ c u / ( 1 K s c f c )
Similarly, the ultimate compressive strength of sandstone and coal outside the interface region can be determined utilising Equations (16), (17) and (18), respectively:
σ 1 s u = σ s u
σ 1 c u = σ c u
As the sandstone and coal beyond the interface are exposed to unidirectional compression, their strengths can be described as σsu and σcu, respectively. Using the calculation equation of the UCS of non-standard samples and considering various height ratios of coal to rock, we can obtain the following:
{ σ s u = σ s ( 7 + 2 D / H ) / 8 σ c u = σ c ( 7 + 2 D / H ) / 8
where D and H are the diameter (mm) and height (mm) of sandstone and coal in the coal–rock structure.
The strength law of CRC under different height ratios of coal to rock is defined using Equations (19)–(23) as follows:
σ 1 s u < σ 1 s u
σ 1 c u > σ 1 c u
Equations (24) and (25) reveals that the bond-constraining forces diminish the strength of sandstone near the interface, which is less than σ1su, but the strength of coal near the interface increases to greater than σ1cu. Figure 12 depicts the relationship curve between the UCS of sandstone and coal determined at the interface and outside the interface of the CRC with different coal thickness, using Equations (24), (25) and (28), and Table 1. Obviously, the UCS of σ1su’ and σ1su has a marked exponential function regression relationship with coal thickness, and the correlation coefficients (R2) are all greater than 0.999, whereas the UCS of σ1cu’ and σ1cu has a good negative exponential function regression relationship with coal thickness, and the correlation coefficients (R2) are all greater than 0.997.
Figure 12 demonstrates that as the coal thickness reduces, the UCS values of σ1su′ and σ1su gradually decrease, whereas the UCS values of σ1cu′ and σ1cu exhibit an increasing trend. This is because the coal near the interface, when subjected to bond-constraining forces, is in a condition of three-dimensional compression, and is difficult to fracture. When the R:C is 5:5, 6:4, 7:3, and 8:2, respectively, the UCS of sandstone at each position is greater than that of coal far from the interface region, so that under uniaxial compression, the middle coal will generate radial tensile stress when pressed, making it easy for tensile fracture to occur, with rib spalling predominating, as illustrated in Figure 13b. When the middle portion of the coal is destroyed, cracks emerge in the bottom and upper parts, respectively, causing the coal’s and sandstone’s gradual deterioration (8:2) near the base and boundary. The coal’s instability contributes to the complex’s instability as a whole.
However, the sandstone at the interface changes from unidirectional stress to a three-dimensional compression tension, leading the sandstone at the interface to collapse earlier than the sandstone far away from the interface. When R:C = 9:1, the UCS of the sandstone near the interface is less than the UCS of the coal sample at the interface and the sandstone and coal outside the interface region, respectively, so that the sandstone at the interface is destroyed first after the CRC is compressed.

5. Progressive Failure Mechanism of RCR

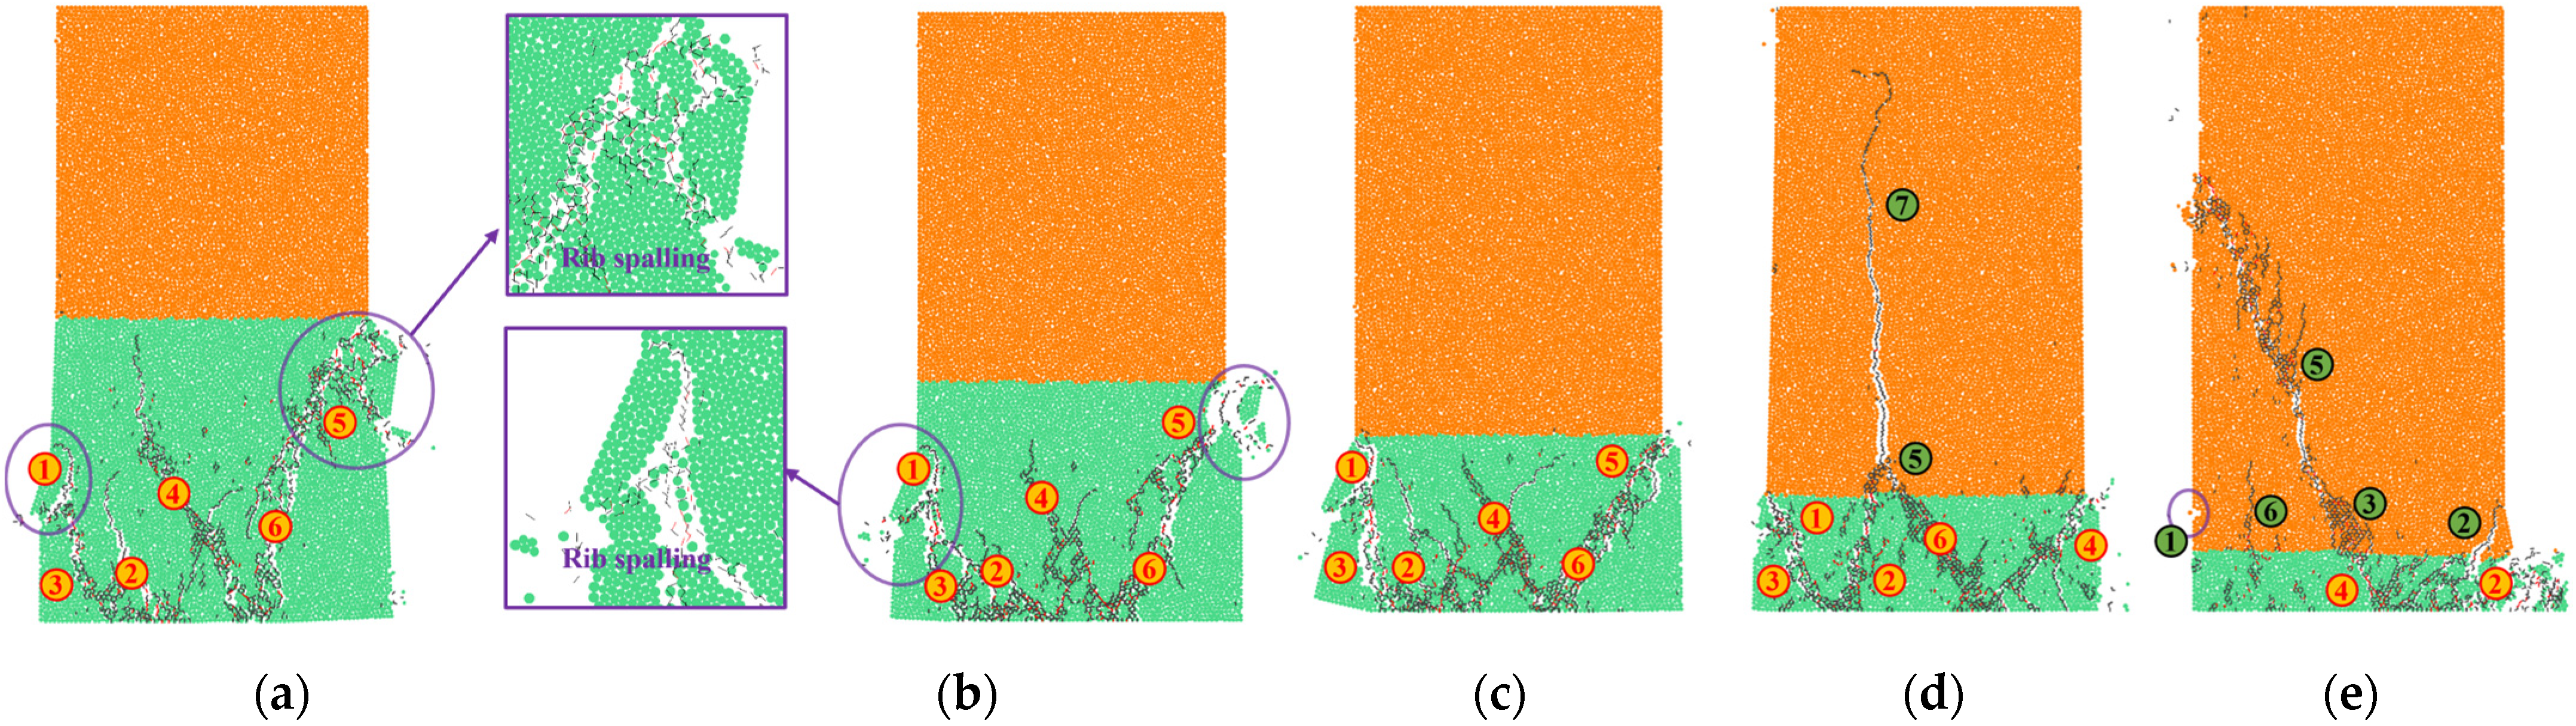
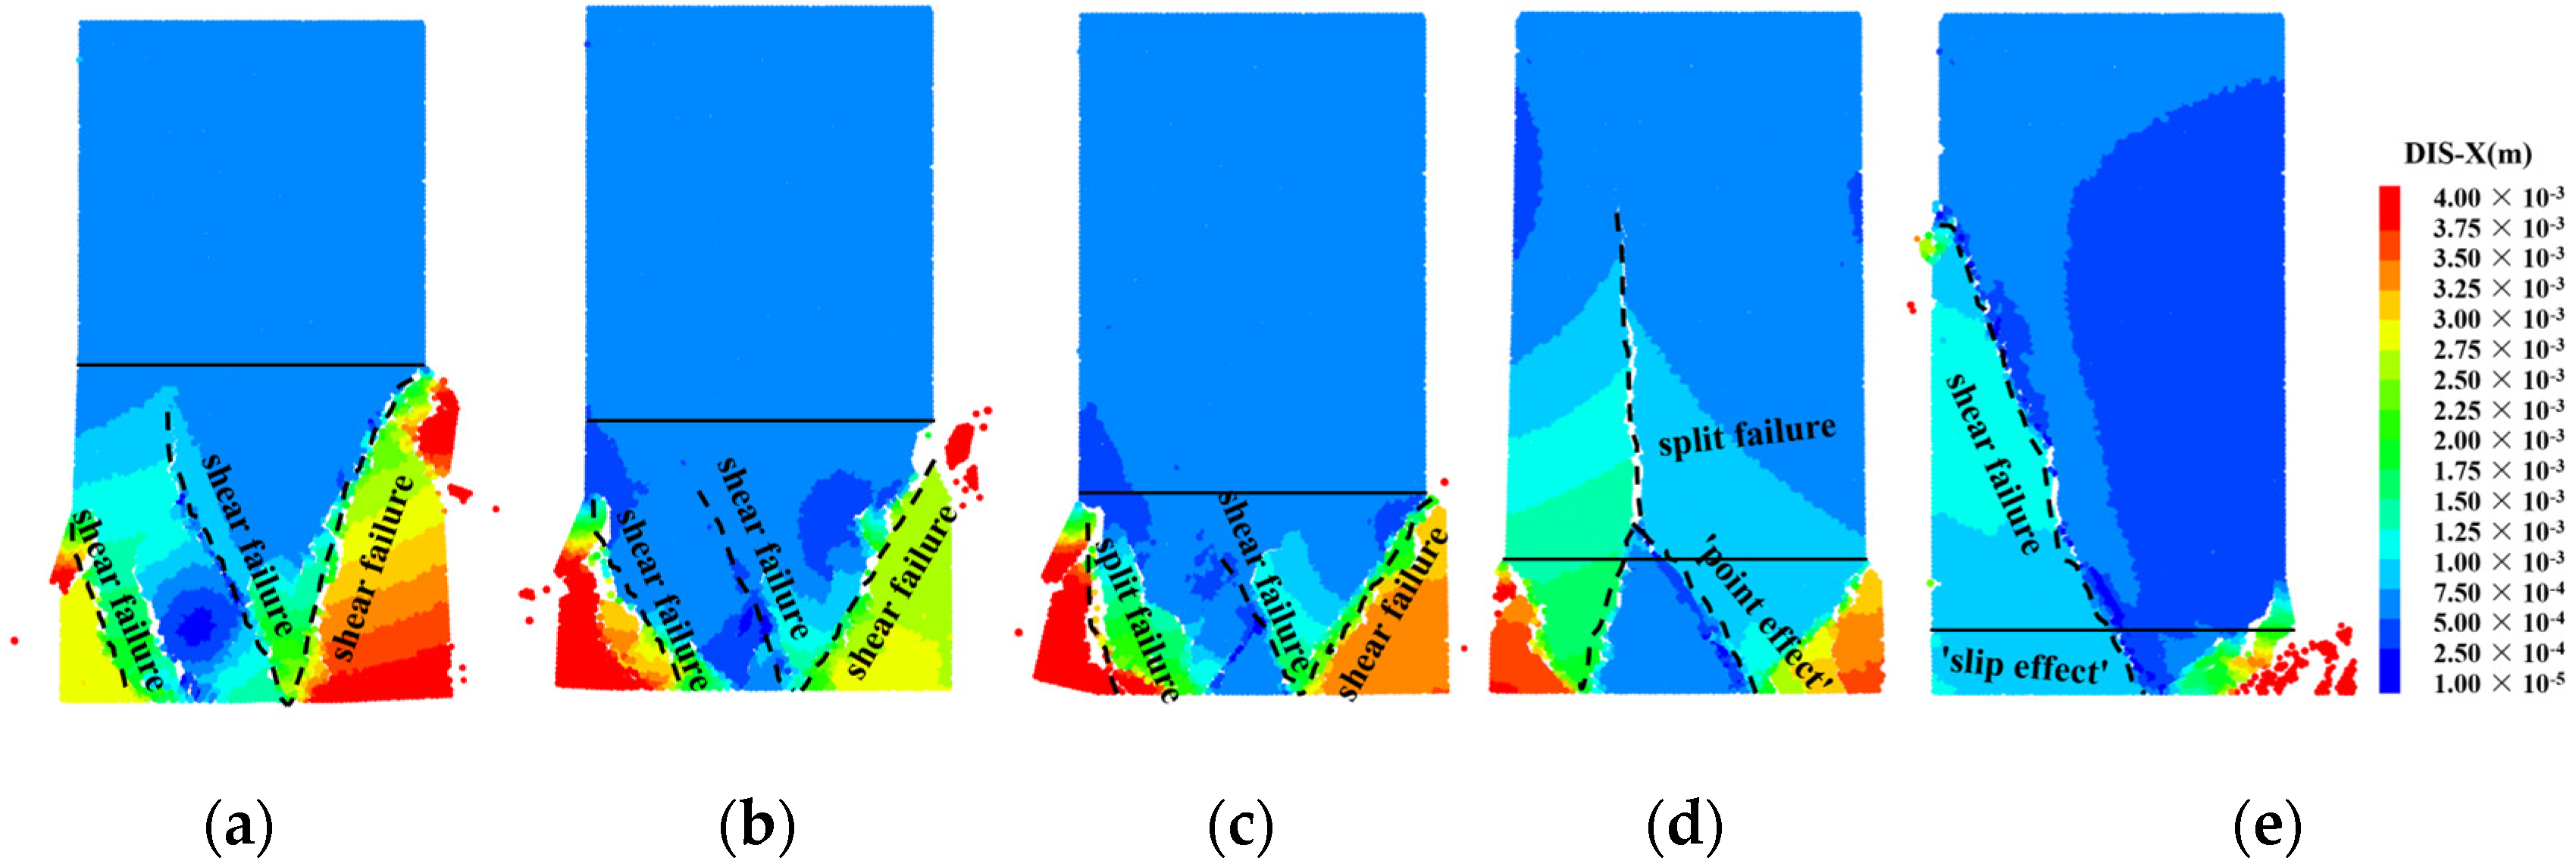
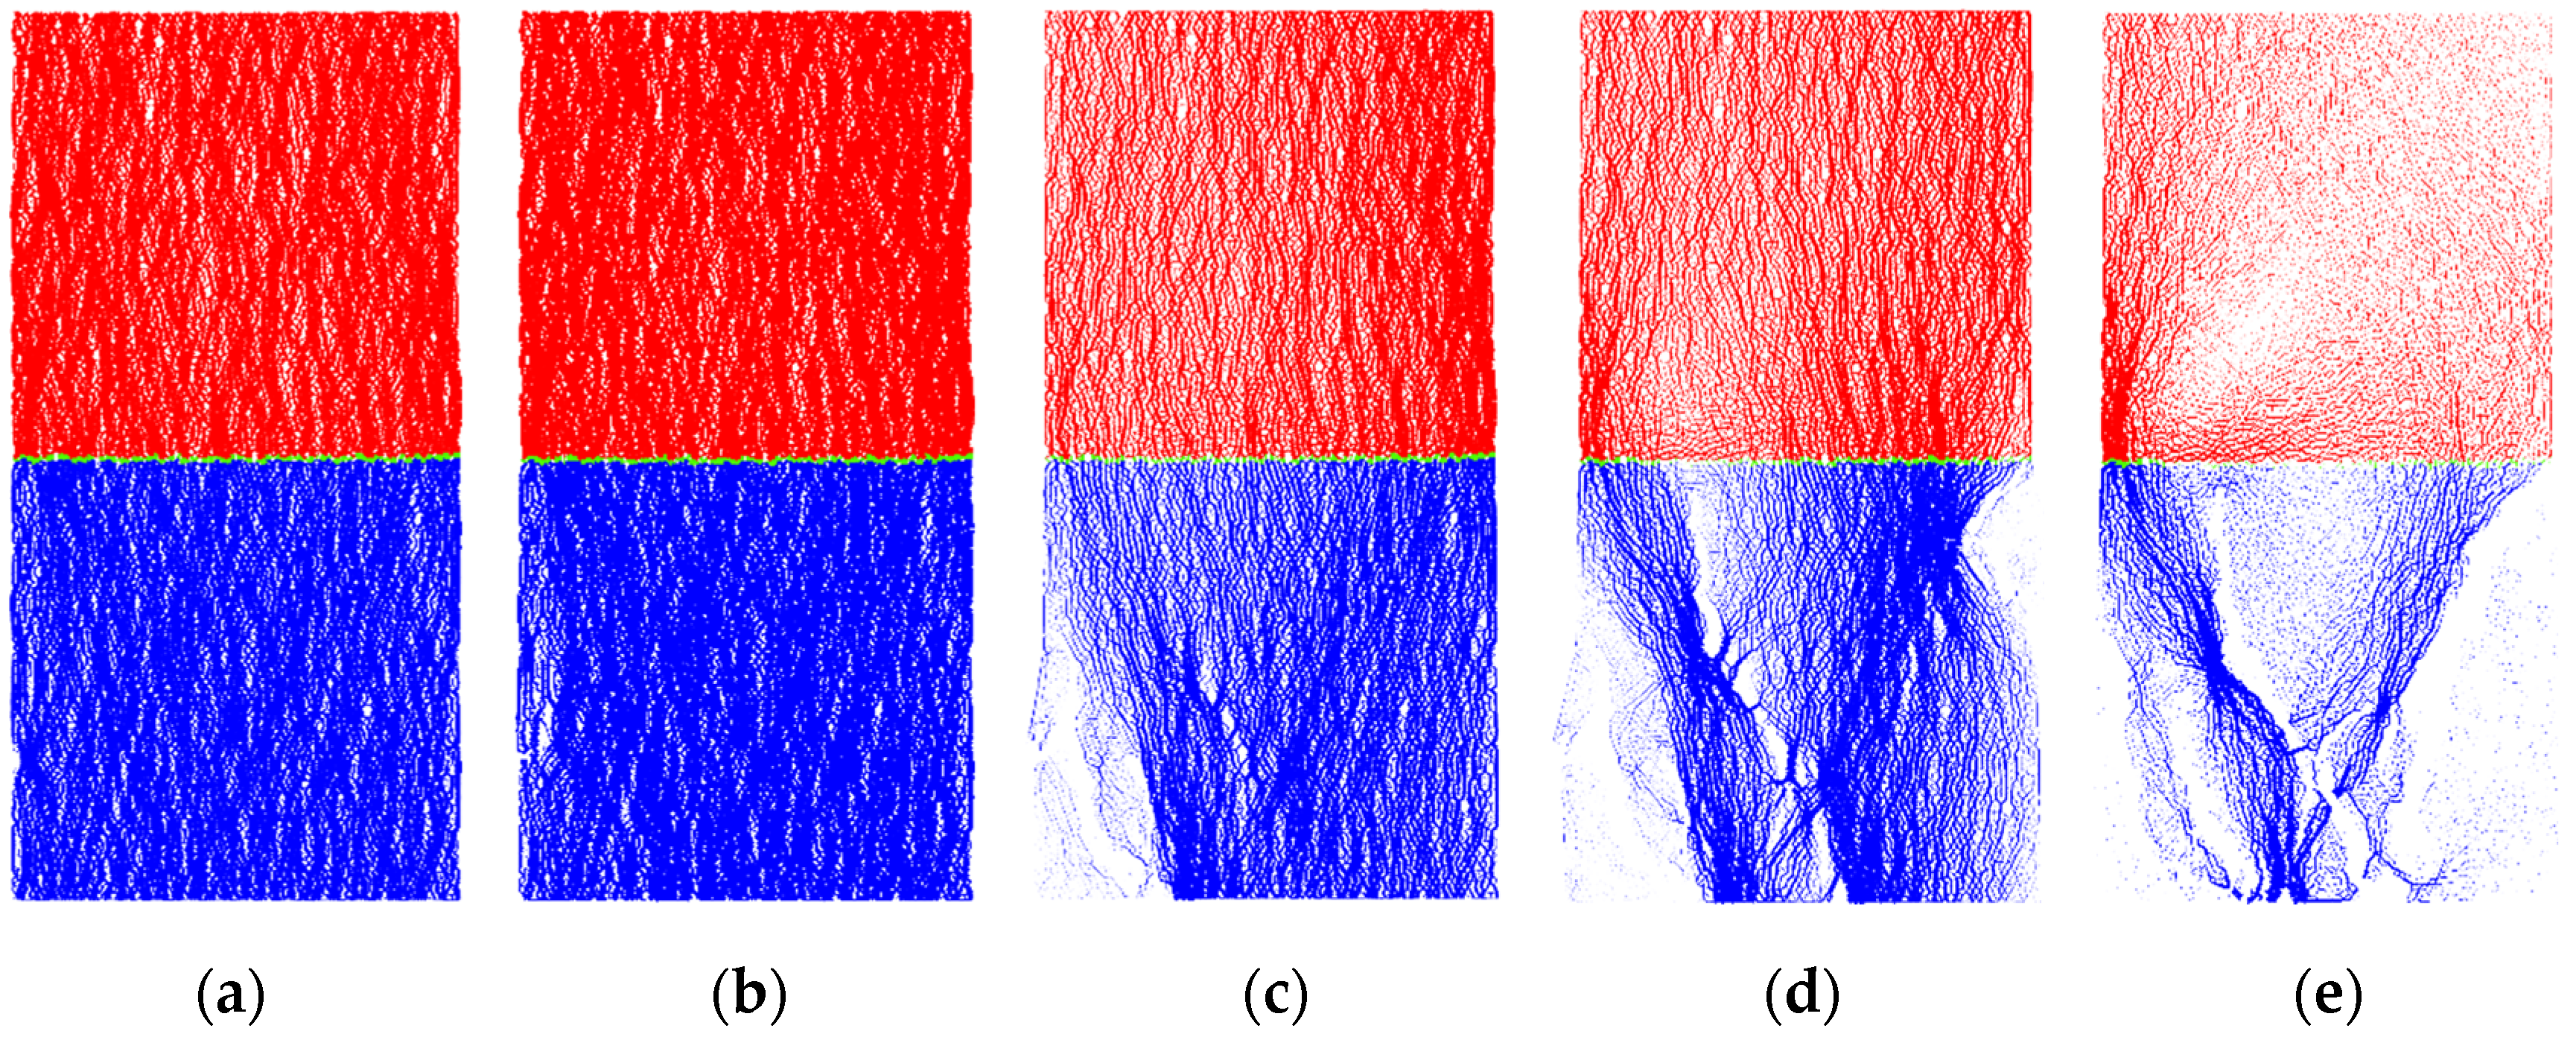
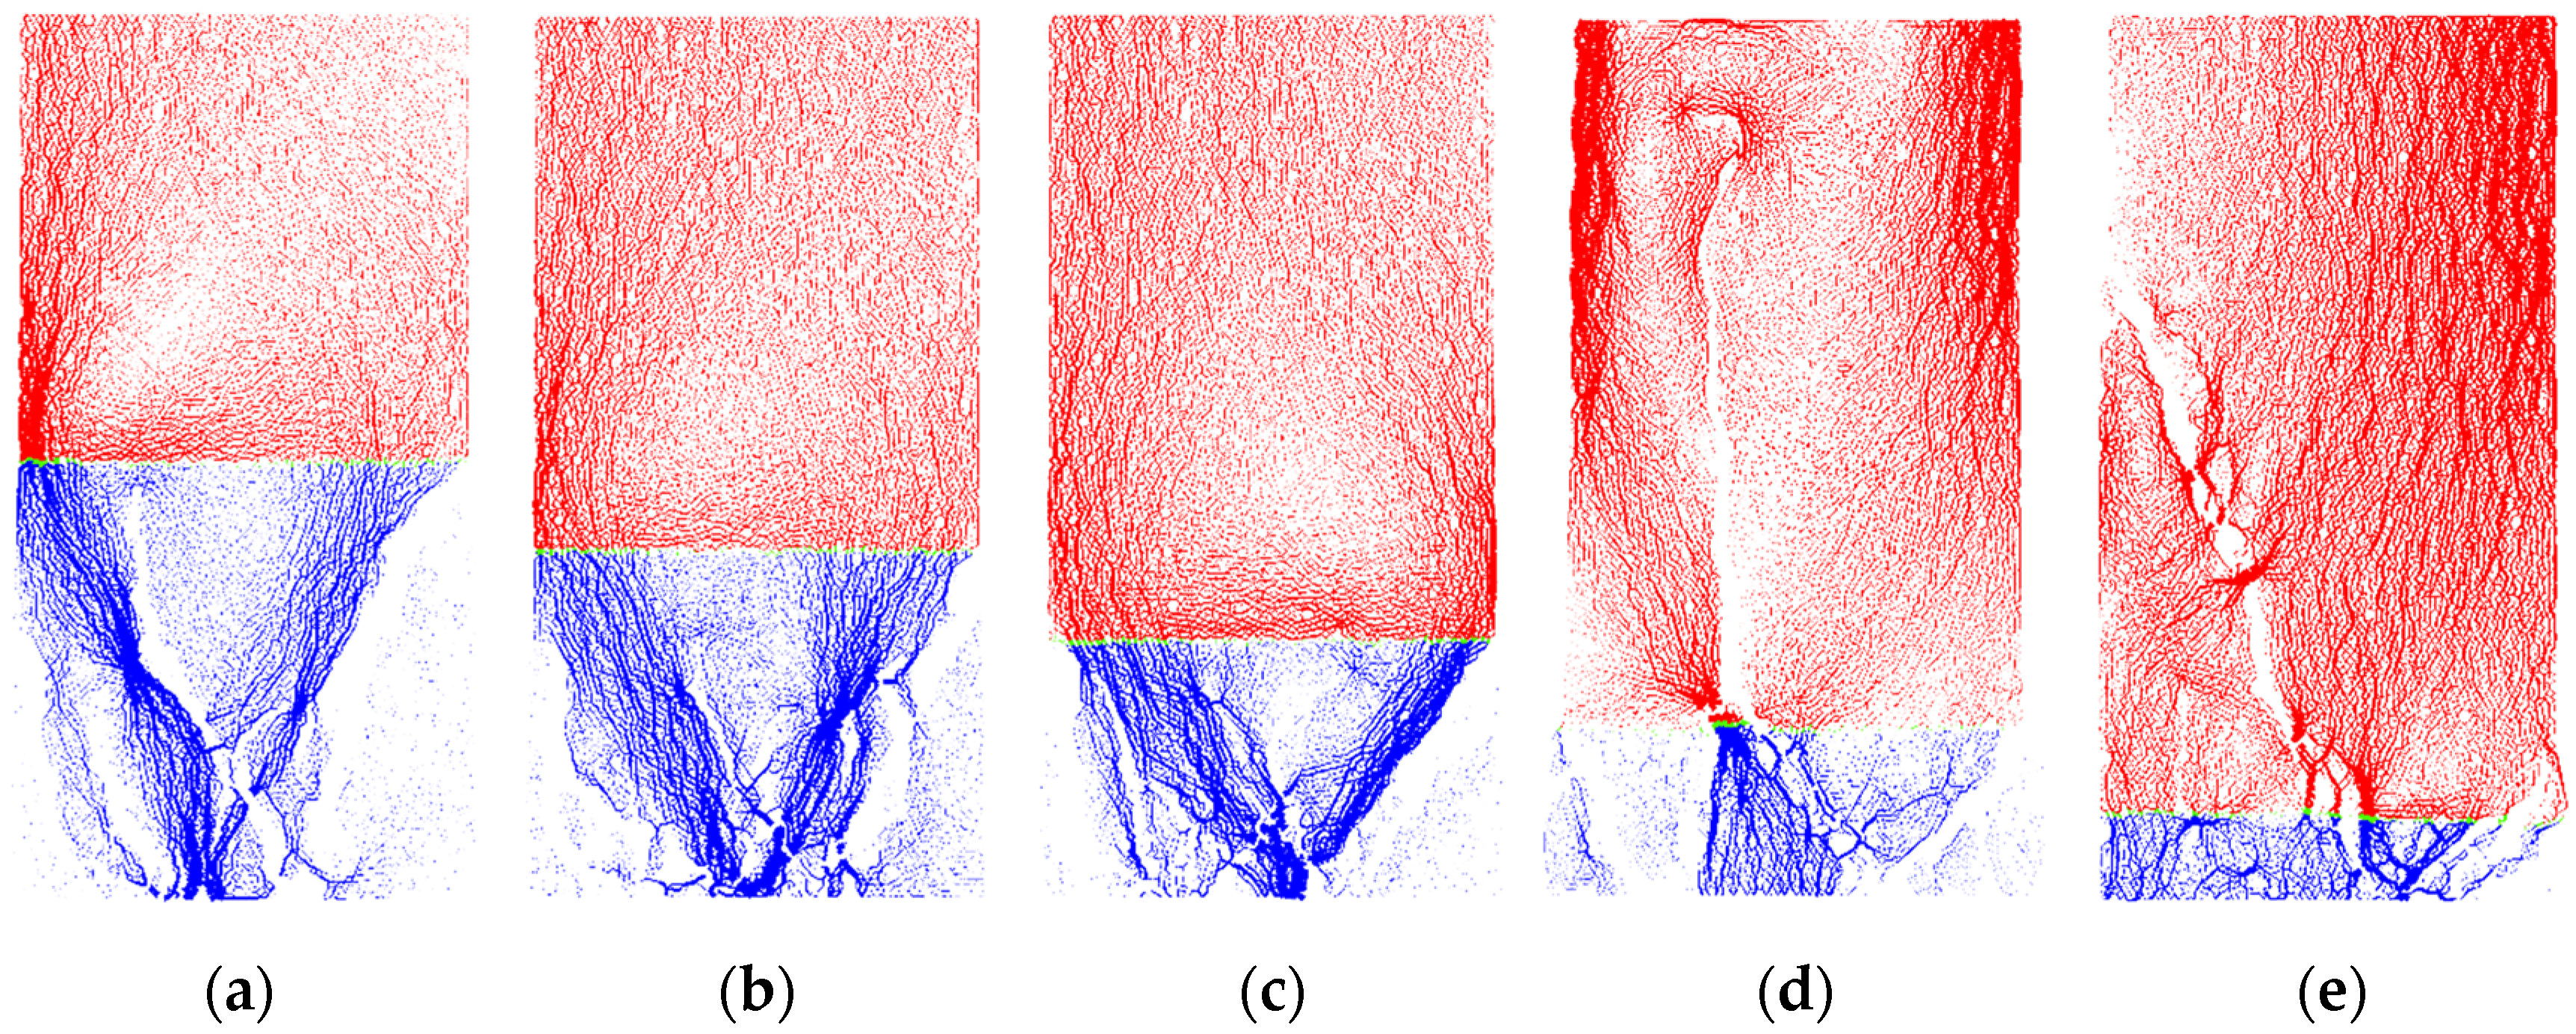
5.1. Morphological Characteristics of Crack Propagation and Failure Modes

In the CRC-loading process, many macrocracks are formed due to the shear–tension interconnection. These can be divided into tensile and shear macrocracks according to the crack direction and relative motion direction of the blocks on both crack sides [54]. If the macro fracture is vertical or sub-vertical (that is, parallel to the loading direction), and the blocks on both sides of the fracture are separating (that is, opening), it can be defined as tensile failure. If the macro crack is inclined and the blocks on both sides of the crack are sliding, it can be verified as shear failure. Figure 13 and Figure 14 show the final failure results of physical experiment and numerical simulation, respectively. In comparing the numerical simulation results with the laboratory experimental results, we can observe that the failure modes of the two are basically consistent. To avoid redundancy, only important results are given here. According to the simulation results, the crack propagation law and failure mode of different coal rock structures are studied. In Figure 13, the black and red areas are tension cracks and shear cracks, respectively. The serial numbers in Figure 13 represent not only the macro damage sequence, but also the macro crack damage form. For example, the number ④ on the coal and sandstone is the fourth group of macro cracks, representing shear failure.
Figure 14 depicts that when R:C = 5:5, microcracks are initiated in the middle and lower parts of the coal, showing a random dispersion distribution. This is because the strength of the coal far from the interface region is the smallest, which is consistent with the theoretical analysis. The local microcrack ① at the middle part’s left side of the coal forms a rib spalling failure after initiation, propagation, and coalescence, proving the occurrence of tensile failure. Furthermore, the cracks extend downward and merge with those near ② to form shear failure ③. The coal includes macroscopic shear damage ④ upon the successive propagation and coalescence of microcracks, which do not reach the sandstone. With the increase in the axial strain, the coal sample’s left side is damaged and unstable, causing the stress to concentrate on the right side, so that the coal experiences extrusion failure ⑤ and extends downward to form shear failure ⑥ that converges with ④ to form a V-shaped failure.
When R:C = 6:4, the crack initiation and propagation mainly occur in the coal far away from the interface region, with the coal fragmentation degree exceeding that of R:C = 5:5. The tensile failure ①, shear failure ②, shear failure ③, and shear failure ④ converge to form a roughly W-shaped macro failure, in which the crack tip located near ④ does not touch the sandstone, and the macrocrack length is less than that of R:C = 5:5. When R:C = 7:3, the crack length is less than that of R:C = 6:4, because the strength of coal samples near the interface increases significantly with the decrease in coal proportion, limiting the crack propagation.
When R:C = 8:2, due to the low strength of the coal–rock away from the interface region and the sandstone near the interface, the coal’s initiation cracks are mainly located in the middle and lower parts, and the sandstone microcracks are mainly distributed near the interface. Once the failure is caused by the crack propagation and coalescence in the coal body, it converges with the sandstone failure area near the interface, followed by upward splitting damage to the sandstone.
When R:C = 9:1, the microcracks are mainly distributed on the sandstone near the interface at the initial loading stage. The macro fracture initiation occurs on the sandstone at the interfaces (① and ②), which is mainly due to the coal’s relatively high strength and the sandstone’s minimum strength at the interface (as previously analysed), namely σ1su < σ1cu < σ1su < σ1cu. As the axial stress increases, the sandstone no longer breaks, and the coal sample starts breaking. The sandstone failure occurs after the coal sample failure, and the microcracks within the coal sample expand and coalesce, and then converge with the sandstone’s local breakage area to cause the sandstone’s overall failure. Ultimately, the macroscopic failure patterns of the assemblage are crushing failure ② and shear failure ④ for the coal, and shear failure (③ and ⑤) and small range splitting failure ⑥ for the sandstone.
In summary, when the rock-to-coal height ratio is 5:5, 6:4 and 7:3, with the decrease in the coal proportion, the increase in the strength of the coal sample near the interface limits its crack propagation, and the macrocrack length decreases. The mechanical behaviour of the coal is mainly shear failure, and the sandstone is not damaged. When the rock-to-coal height ratio is 8:2 and 9:1, the sandstone’s strength near the interface decreases significantly as the rock proportion increases. The coal sample macrocracks converge with the local failure area of the sandstone near the interface, causing the overall sandstone failure, which is categorised as split and shear failures.
Figure 15 shows the CRC failure displacement cloud diagram with different rock-to-coal height ratios under uniaxial compression. It can be seen in comparing the horizontal displacement cloud diagram that the Λ-shaped failure zone after coal sample failure forms a point effect, inducing a split failure in the sandstone. The slip effect formed in the shear failure zone causes the sandstone shear failure.

5.2. Evolution Laws of Microcracks

Figure 9d shows that when R:C = 8:2, the stress drop phenomenon occurs prior to the peak value. In order to further understand the relationship between the crack evolution law, failure characteristics, and stress–strain curve of the CRC, the variation in crack evolution with stress–strain curve during the entire coal–rock assemblage loading is investigated, taking the R:C = 5:5 and R:C = 8:2 as examples, as shown in Figure 16. Generally, the tangent modulus is calculated as follows:
E ( n ) = s t r e s s ( n + 1 ) s t r e s s ( n ) s t r a i n ( n + 1 ) s t r a i n ( n )
where n is the data point.
As shown in Figure 16a, when R:C = 5:5, points A and B represent 60% and 80% of the pre-peak value, respectively, point C is the peak value, and points D, E, F, and G represent 80%, 60%, 40%, and 10% of the post-peak value, respectively. At the initial loading stage, the CRC undergoes compaction and elastic stages, during which the initial spaces between particles gradually close to each other, and the tangent modulus gradually increases, resulting in a concave stress–strain curve. Upon crack closure, the stress–strain curve is approximately linear in the elastic phase, and the tangential modulus is almost unchanged (O-A stage). As the axial stress increases, new cracks begin to form due to the applied stress with less inter-particle stress damage, and a few wide cracks appear in the dispersion distribution state. The stress-induced cracks steadily increase at stages A, B, and C upon crack initiation. As the axial stress increases, more randomly distributed cracks occur. The tangential modulus decreases significantly due to the high number of new cracks. When the stress reaches C, the average contact force between the coal particles reaches a maximum value, and the cracks gradually expand to form a local crack stage. At this time, local microcracks are connected to cause coal spalling. At the post-peak stage, the tangent modulus becomes negative with the drop in the axial stress. When the strain reaches point F, the specimen forms a V-type macrocrack zone, while when it reaches point G, the number of cracks is at its peak.
As shown in Figure 16b, when R:C = 8:2, at point B loading, the microcrack distribution is small in number and range, mainly in the coal sample’s lower left part, leading to the local instability and stress drop upon the cracks’ connection, which forms the first peak. The stress drops to point C, and the load-bearing capacity increases after mutual adjustment between the particles. The stress reaches the second peak at point D with the increase in the microcrack distribution range, resulting in the peak average contact force between coal particles. At the post-peak stage, the number of cracks in coal samples increases rapidly, and each local fracture coalesces, further intensifying the coal–rock damage. When the strain is at point F (60% after the post-peak), the sample forms a W-type macrocrack zone in the coal sample, leading to the tensile failure of sandstone from the bottom to the top once the crack in the coal sample has coalesced. When the strain is at point G (40% after the post-peak), the cracks continue to propagate, and their number continues to increase. When the strain is at point H (10% after the post-peak), the number of cracks reaches its maximum.
From the above analysis, it can be seen that the damage and failure process of CRCs can be divided into five stages: the ① original crack closure stage, ② microcrack initiation stage, ③ microcrack dispersion and distribution stage, ④ crack gradual expansion to form the local cracks stage, and ⑤ instability and failure stage caused by the connection of each local crack. The cause of CRC instability and failure is the interaction between the roof sandstone and the coal sample, and is also determined by the distribution range of microcracks in the loading process, which is the main reason for the stress drop in the specimen before the peak.

5.3. Number of Cracks

Figure 17 shows the variation in the number of tensile and shear cracks with the change in the vertical stresses for the five coal–rock combinations with R:C = 5:5 to R:C = 9:1. The stress thresholds for crack initiation were 51.85% (25.62 MPa), 51.93% (26.21 MPa), 50.08% (26.87 MPa), 44.20% (27.04 MPa), and 60.22% (44.53 MPa) of peak stress for CRC from R:C = 5:5 to R:C = 9:1, respectively. Obviously, the crack initiation stress increases with the decrease in coal proportion, which proves that the crack resistance and compressive strength of the CRC are improved with the reduction in the coal proportion.
As shown in Figure 17a, in stages I and II, the initial spacing between particles is closed first, then the particles adjust and squeeze each other, and no cracks appear at this stage as the interparticle contact force is less than the interparticle bonding strength. In stage III, as the axial stress increases, when the inter-particle contact force is greater than the bonding strength between particles, microcracks begin to emerge in a dispersion distribution state, as mainly tensile cracks, not shear cracks. At this time, the number of microcracks is increasing slowly. In stage IV, the shear cracks begin to emerge, and the tension cracks continue to increase and expand. In stage V, the peak and post-peak stage, each local crack is connected and converged, and the overall damage after continuous penetration causes a dramatic increase in the number of shear and tensile cracks. Therefore, the crack evolution of CRC with different coal-to-rock height ratios can be divided into five stages: stage I, compaction stage; stage II, elastic stage; stage III, stable development stage; stage IV, unstable development stage; and stage V, extremely unstable post-peak stage.
Table 5 shows statistics for the number of tension and shear cracks of coal and rock in combination with different rock-to-coal height ratios. According to Table 5, the failure of coal in the CRCs was mainly caused by tension cracks. When R:C = 5:5, the number of tensile cracks and shear cracks in coal is the highest (1341 and 156, respectively). When R:C = 6:4, the number of tensile cracks and shear cracks in coal is the least (1116 and 147, respectively). When R:C = 9:1, the number of tensile cracks and shear cracks in the rock is the largest (879 and 44, respectively), and the total number of cracks in the composite is the largest (1552). With the rock-to-coal height ratio increasing from 5:5 to 9:1, the number of fractures in the combination decreases first and then increases. This is because as the proportion of coal samples decreases to a certain extent, the ability of roof rock to consume external load energy due to axial compression deformation becomes more substantial, the damage degree of coal samples and sandstones gradually increases, and the coal samples become extensively broken. In this case, many cracks exist.

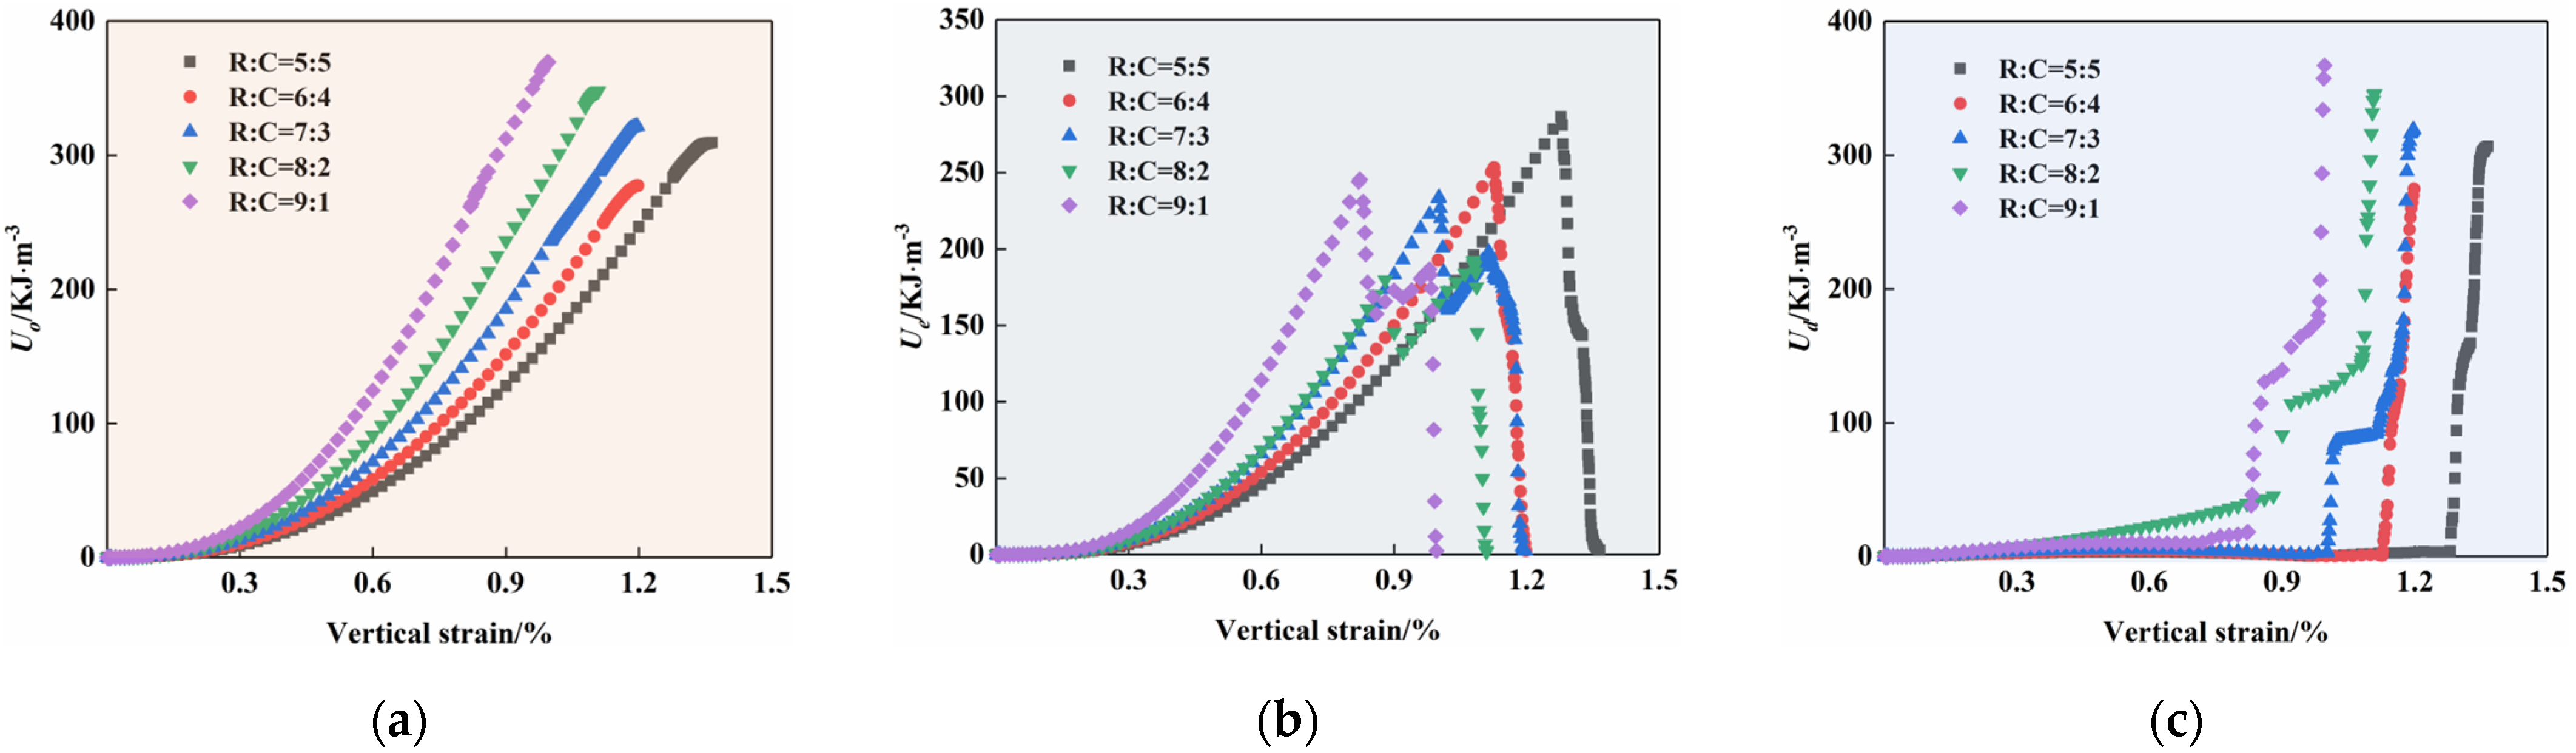
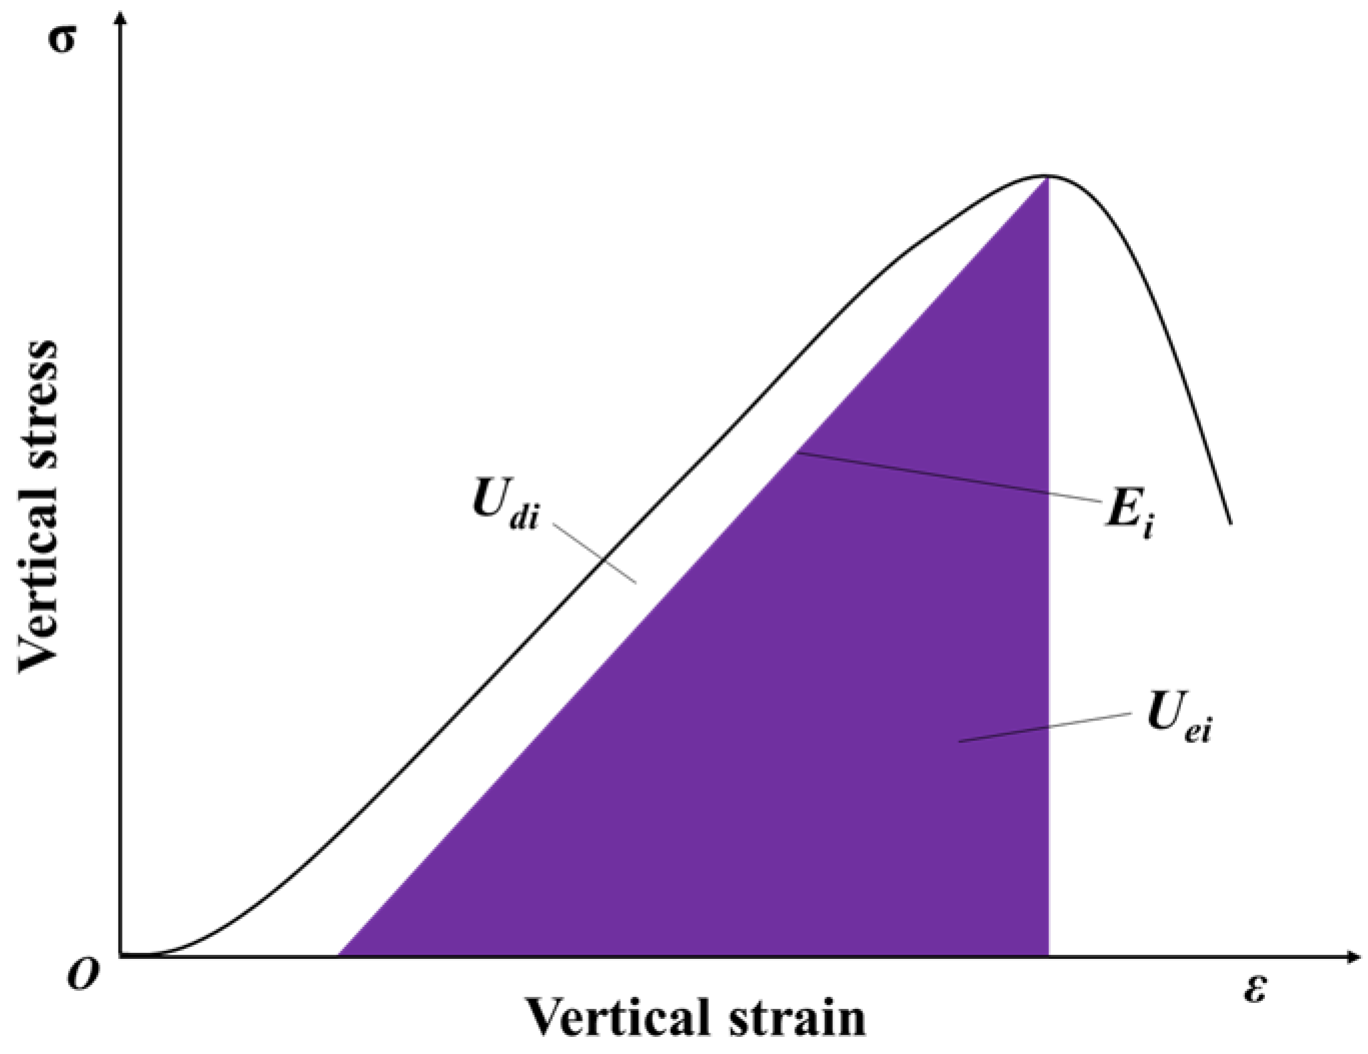
5.4. Effect of Coal Thicknesses on Energy Evolution in RCR Composite Samples

The damage and failure of coal and rocks is a state instability phenomenon driven by objects and external environmental energy. During the CRC-loading process, the external energy is constantly input, with part of it being transformed into dissipated strain energy, which is represented by the CRC plastic deformation, microcrack initiation, expansion, and other meso damage, and other parts being stored in the CRC in the form of elastic strain energy. When the input energy reaches its energy storage limit, it releases a part of the elastic strain energy, causing the overall failure of the rock. According to the first law of thermodynamics (assuming that there is no heat exchange between the CRC and the outside when the external force does work), the total input energy generated by the external force subjected to the composite material is defined as follows [55].
U o = U d + U e
where Ue is the elastic strain energy stored in the rock that can be released; Ud is the dissipated strain energy in the rock damage and failure process, and the correlation is shown in Figure 18.
As shown in Figure 19, the shaded part depicts the energy stored in the CRC in the form of elastic strain energy Ue. Ud is the dissipative strain energy for partial energy conversion. The rock element energy calculation formula under triaxial compression is as follows [56].
U o = 0 ε 1 σ 1 d ε 1 + 0 ε 2 σ 2 d ε 2 + 0 ε 3 σ 3 d ε 3
U e = 1 2 E ¯ [ σ 1 2 + σ 2 2 + σ 3 2 2 v ¯ ( σ 1 σ 2 + σ 2 σ 3 + σ 1 σ 3 ) ]
where E ¯ and v ¯ are the average values of the unloading elastic modulus and Poisson’s ratio, respectively.
When CRC is subjected to uniaxial compression, σ2 = σ3 = 0, the dissipated strain energy is
U e = σ 1 2 / 2 E ¯
The results of the stress–strain curves from the numerical simulations are taken into the above equations to calculate the total input energy Uo, elastic strain energy Ue, and dissipated strain energy Ud for the CRCs with different coal-to-rock height ratios. Figure 18 shows the variation in the total input energy Uo, elastic strain energy Ue and dissipated strain energy Ud with CRC strain with different coal-to-rock height ratios.
It can be seen from Figure 18 that the energy evolution curves of CRC with different coal-to-rock height ratios show a similar trend: the total input energy, elastic strain energy, and dissipated strain energy of CRC show a nonlinear growth trend with the increase in the axial stress level during compression, in which Uo and Ud increase slowly, then rapidly with the axial strain curve, and the peak value changes very violently at the pressure point. As the sample enters the elastic deformation phase, the CRC total input energy with different coal-to-rock height ratios increases approximately linearly with strain (Figure 18a). When the coal proportion decreases from 5:5 to 6:4, the maximum total input energy shows a downward trend. On the other hand, when the coal proportion reduces from 6:4 to 9:1, the maximum total input energy shows an upward trend, with a maximum peak value of 369.5 KJ/m3 at R:C = 9:1 and a minimum peak value of 277.3 KJ/m3 at R:C = 6:4. Differing from the Uo, Ud vs. axial strain curve, with the decrease in coal proportion, the accumulated elastic strain energy rises rapidly before the peak strength (Figure 18b), and the peak elastic strain energy decreases first and then increases. The peak accumulated elastic strain energy decreases first when the coal proportion reduces from 5:5 to 8:2, and gradually increases when the coal proportion decreases from 8:2 to 9:1, reaching a minimum value of 192.4 kJ/m3 at R:C = 8:2 and a maximum value of 286.5 kJ/m3 at R:C = 5:5. Once the peak strength is reached, the accumulated elastic strain energy decreases considerably until it disappears in the numerical simulation tests, regardless of the change in the ratio of coal to rock.
With the decreases in coal proportion, the peak dissipated strain energy of the CRC samples with different coal-to-rock height ratios decreases first and then increases. When the coal proportion decreases from 5:5 to 6:4, the peak dissipated strain energy decreases first. When the coal proportion decreases from 6:4 to 9:1, the peak dissipated strain energy gradually increases (Figure 18c). The minimum peak dissipated strain energy is 274.8 kJ/m3 at R:C = 6:4. Dissipative strain energy is closely related to CRC deformation and failure. Therefore, from the energy evolution perspective, the greater or smaller the thickness of the coal, the more severe the damage.
It should be pointed out that with the decrease in coal proportion, the coal sample and sandstone destruction degree increases, and the coal sample breaking rate rises. This can be attributed to the high strength of the coal near the interface under the increased rock-to-coal height ratio, and the accumulated energy coal before being destroyed. When the sandstone near the interface is damaged to a certain extent, the fractures of the sandstone near the interface lead to coal fracture development, resulting in rapid energy release in coal. At the same time, the decrease in the coal proportion means an increase in the sandstone volume, accumulating a certain amount of energy near the interface before failure. Under the mutual destruction of the sandstone and coal, the coal destruction accelerates. Therefore, as the coal proportion decreases, the overall combined strength increases significantly, and the reduction in damage rises sharply.

5.5. The Evolution of the Microscopic Structure of the Force Chain

The contact force chain is an important medium used to maintain the overall continuity and stability of the CRC, and is the core pathway for transferring overburdening loads and mining stresses. Contact force chains can be divided into two categories: strong force chains and weak force chains. The thicker the force chain, the stronger the force chain, and the more detailed the force chain, and vice versa. The strong force chain plays a stabilising role, and the weak chain plays a fixing auxiliary role. This energy stabilises the strong force chain (stabilising the unstable state), and contributes to their reconstruction. By analysing the force chain evolution of the contact force during the CRC axial loading with different coal-to-rock height ratios, the law of the transmission evolution of the contact force within the CRC is revealed. In Figure 20, the red represents the contact force chain of the rock mass, and the blue represents the contact force chain of the coal mass.
As shown in Figure 20, we take R:C = 5:5 as an example. At the initial stage of loading, more, finer, and interconnected and intersected contact force chains are generated within the coal and rock along the axial direction. With the increase in vertical stress, the load borne by the CRC gradually increases, and the density of the inter-particle contact force chains intensifies. In the third and fourth stages of fracture development, the microcrack distribution is wide, the number is small, and there is no coalescence; hence, there is no impact on the evolution of the force chain (Figure 21a). When the stress reaches its peak value, the CRC reaches its maximum bearing capacity, and the overall force chain becomes thicker and stronger. The contact force chain on the coal’s left side is damaged due to the failure of the coal spalling upon connecting the local cracks, and the force chain in the adjacent damage area is locally concentrated (Figure 20b).
In the post-peak stage, when the stress is reduced to 80% of the peak, shear damage occurs through the fracture coalescence on the coal sample’s left side, the force chain in the adjacent area is concentrated, and the contact force chain on the coal body’s right side is weakened. At this time, the loading centre of gravity shifts to the right, and the contact force chain in the rock mass gradually concentrates to the right (Figure 20c). As the stress decreases to 60% of the peak, the contact force of the coal body on the right side weakens, which leads to the failure of this area. The contact force chain adjacent to the failure area is concentrated, with a structure similar to a skeleton forming on the left side of the coal body (Figure 20d) [34]. When the loading ends, the contact force chain in the coal body further breaks, offsets, and reconstructs, leading to the weakening and destruction of the strength of the contact force chain over a wider range. After the instability and failure of the CRC, the rock mass quickly releases energy, making the internal contact force chain weaken in a large area, and the force chain is concentrated towards the two top ends of the skeleton in the coal.
Figure 21 shows the final results of the evolution of force chains in CRCs with different coal-to-rock height ratios. It can be seen that the contact force chain inside the coal body in structural bodies with different height ratios is more likely to fracture, and the microcracks are more likely to expand in the coal body. Moreover, the evolution of the contact force chains corresponds to the expansion and penetration of the microcracks, both of which gradually evolve to form macroscopic rupture zones in the coal body. Due to the different crack propagation capabilities and angles, the failure forms of sandstone are different, showing splitting, shear failure, or non-occurrence. At the end of loading, as the proportion of the coal body decreases, the contact force chain in the coal body is weakened, and the degree of crushing is increased. It is worth mentioning that even in post-peak stage, the CRC still has a certain load-bearing capacity, mainly due to its strong load-bearing skeleton structure and the friction between particles in the fracturing area, which resists external forces.

6. Discussion

In recent years, with the gradual depletion of shallow mineral resources, resource development is continuously moving towards deeper parts of the earth [57,58]. In high-stress environments in deep parts of mines, many disasters are essentially the result of the overall destructive destabilization of the coal–rock assemblage system [59,60]. Therefore, the study of the failure and instability mechanisms of CRCs under loading is of vital significance in guiding the safe production of coal mines and the sustainable development of the coal mining industry.
Due to differences in lithologic characteristics, interface structures, and effect sizes, the complexity of studies on the mechanical responses and failure mechanisms of CRCs is greatly increased. Numerical simulation method has become a reliable research method for studying the mechanical properties of rock fractures due to its low cost and good feasibility. In this paper, we constructed a model for the initial closure behaviour of rock fractures under uniaxial compression, and solved the problem that the stress–strain curves simulated in previous discrete element method were usually linear at the initial stage. According to the national standard GB/T23561.7-2009 for the determination of the physical and mechanical properties of coal and rock, the CRC sample in this paper was machined into ϕ50 × 100 mm cylinders [61]. If the dimensions of the simulation need to be further in-depth and consistent with actual case dimensions, it may be difficult to use the PFC 4.0 simulation software to achieve a current PFC software simulation of standard specimens’ microscopic fracture behaviour; this, alongside the damage mechanism, is very good, differing from that of FLAC3D 7.0 simulation software [44,46,62]. Zhang et al. [63] simulated a simplified rock–coal–rock specimen, and the results obtained were approximately the same as the field 2 damage pattern; it can thus be considered that the fracture behaviour and the damage mechanism of the simulated combined specimen can be obtained from field references.
However, there are certain limitations in this study. First, it is necessary to further study the mechanical properties of CRCs with different interfacial bonding parameters, and to consider changes in CRC strength under the conditions of built-in fractures in coal or rock. Second, it may be necessary to change the amounts of coal and rock in CRCs to further improve the composite strength model of CRCs of different sizes, particularly through quantitative analyses, which will also be our next step.

7. Conclusions

In this paper, the mechanical properties, failure mechanisms, crack propagation laws, energy characteristics, and force chain evolution of CRCs with different coal-to-rock height ratios under uniaxial compression were studied synthetically via physical experiments and numerical simulations, which is vital for safe mining, the protection of the eco-environment in mining areas, the sustainable development of the mining industry, and economic growth. The following conclusions are drawn:
(1)
The stress thresholds for crack initiation, UCS, and the elastic modulus of the CRCs rose with the decreasing coal-to-rock height ratio. Interfacial adhesion interaction enhances the strength of coal near the interface, and decreases the strength of sandstone near the interface.
(2)
The point effect and slip effect formed via coal failure cause sandstone split failure and shear failure, respectively. The instability and failure of CRCs are the result of the interaction between the strength of sandstone and coal at the interface and the strength of sandstone and coal far from the interface region; in addition, they are influenced by the distribution range of microfractures during the loading process.
(3)
The number of cracks decreases and then increases with the reduced coal thickness. Similarly, the total input energy Uo, elastic strain energy Ue, and dissipated strain energy Ud decrease and then increase with the reduction in coal thickness. When the thickness of the coal pillar is small or large, the CRC is unstable.
(4)
The CRC still has a certain load-bearing capacity in the post-peak stage, mainly due to the strong load-bearing skeleton structure and the friction between particles in the fracturing area that resists external forces.

Author Contributions

Conceptualization, Y.H. and W.G.; methodology, Y.H., W.G. and D.W.; software, Y.H. and D.W.; formal analysis, Y.H., W.G. and D.W.; investigation, Y.H. and D.W.; data curation, Y.H. and D.W.; writing—original draft preparation, Y.H. and D.W.; writing—review and editing, Y.H. and D.W.; funding acquisition, W.G. All authors have read and agreed to the published version of the manuscript.

Funding

This research was funded by the Key Project of the National Natural Science Foundation of China (U21A20108), the National Natural Science Foundation of China (52104127), the Central China Science and Technology Innovation Leading Talents Project (224200510012).

Institutional Review Board Statement

Not applicable.

Informed Consent Statement

Not applicable.

Data Availability Statement

Relevant data are listed in the paper.

Conflicts of Interest

The authors declare no conflict of interest.

References

  1. Li, T.; Cai, M. A review of mining-induced seismicity in China. Int. J. Rock Mech. Min. Sci. 2007, 44, 1149–1171. [Google Scholar] [CrossRef]
  2. Lu, C.-P.; Liu, G.-J.; Liu, Y.; Zhang, N.; Xue, J.-H.; Zhang, L. Microseismic multi-parameter characteristics of rockburst hazard induced by hard roof fall and high stress concentration. Int. J. Rock Mech. Min. Sci. 2015, 76, 18–32. [Google Scholar] [CrossRef]
  3. Wang, S.-L.; Hao, S.-P.; Chen, Y.; Bai, J.-B.; Wang, X.-Y.; Xu, Y. Numerical investigation of coal pillar failure under simultaneous static and dynamic loading. Int. J. Rock Mech. Min. Sci. 2016, 84, 59–68. [Google Scholar] [CrossRef]
  4. Cai, W.; Bai, X.X.; Si, G.Y.; Cao, W.Z.; Gong, S.Y.; Dou, L.M. A monitoring investigation into rock burst mechanism based on the coupled theory of static and dynamic stresses. Rock Mech. Rock Eng. 2020, 53, 5451–5471. [Google Scholar] [CrossRef]
  5. Gao, F.Q.; Kang, H.P.; Yang, L. An Experimental Investigation into the Strainburst Process Under Quasi-static Loading. Rock Mech. Rock Eng. 2020, 53, 5617–5629. [Google Scholar] [CrossRef]
  6. Liu, Q.; Nie, W.; Hua, Y.; Peng, H.T.; Liu, Z.Q. The effects of the installation position of a multi-radial swirling air-curtain generator on dust diffusion and pollution rules in a fully-mechanised excavation face: A case study. Powder Technol. 2018, 329, 371–385. [Google Scholar] [CrossRef]
  7. Li, Y.J.; Wang, P.F.; Liu, R.H.; Jiang, Y.D.; Han, H. Determination of the optimal axial-to-radial flow ratio of the wall-mounted swirling ventilation in fully mechanized excavation face. Powder Technol. 2020, 360, 890–910. [Google Scholar] [CrossRef]
  8. Xu, J.M.; Zhu, W.B.; Xu, J.L.; Wu, J.Y.; Li, Y.C. High-intensity longwall mining-induced ground subsidence in Shendong coal-field. China Int. J. Rock Mech. Min. Sci. 2021, 141, 104730. [Google Scholar] [CrossRef]
  9. Guo, W.B.; Guo, M.J.; Tan, Y.; Bai, E.H.; Zhao, G. Sustainable developmentof resources and the environment: Mining-induced eco-geological environmental damage and mitigation measures-a case study in the Henan coal mining area, China. Sustainability 2019, 11, 4366. [Google Scholar] [CrossRef]
  10. Zhou, Z.L.; Chen, L.; Cai, X.; Shen, B.T.; Zhou, J.; Du, K. Experimental investigation of the progressive failure of multiple pillar–roof system. Rock Mech. Rock Eng. 2018, 51, 1629–1636. [Google Scholar] [CrossRef]
  11. Zhu, W.B.; Chen, L.; Zhou, Z.L.; Shen, B.T.; Xu, Y. Failure Propagation of Pillars and Roof in a Room and Pillar Mine Induced by Longwall Mining in the Lower Seam. Rock Mech. Rock Eng. 2018, 52, 1193–1209. [Google Scholar] [CrossRef]
  12. Yang, S.-Q.; Huang, Y.-H.; Tang, J.-Z. Mechanical, acoustic, and fracture behaviors of yellow sandstone specimens under triaxial monotonic and cyclic loading. Int. J. Rock Mech. Min. Sci. 2020, 130, 104268. [Google Scholar] [CrossRef]
  13. Rück, M.; Rahner, R.; Sone, H.; Dresen, G. Initiation and propagation of mixed mode fractures in granite and sandstone. Tectonophysics 2017, 717, 270–283. [Google Scholar] [CrossRef]
  14. Eremin, M. Three-dimensional finite-difference analysis of deformation and failure of weak porous sandstones subjected to uniaxial compression. Int. J. Rock Mech. Min. Sci. 2020, 133, 104412. [Google Scholar] [CrossRef]
  15. Cheng, L.C.; Xu, J.; Peng, S.J.; Liu, Y.X.; Chen, G.; Li, X.W.; Qin, Y. Mesoscopic crack initiation, propagation, and coalescence mechanisms of coal under shear loading. Rock Mech. Rock Eng. 2019, 52, 1979–1992. [Google Scholar] [CrossRef]
  16. Ghasemi, S.; Khamehchiyan, M.; Taheri, A.; Nikudel, M.R.; Zalooli, A. Microcracking Behavior of Gabbro During Monotonic and Cyclic Loading. Rock Mech. Rock Eng. 2021, 54, 2441–2463. [Google Scholar] [CrossRef]
  17. Bai, J.W.; Feng, G.R.; Wang, Z.H.; Wang, S.Y.; Qi, T.Y.; Wang, P.F. Experimental Investigations on the Progressive Failure Characteristics of a Sandwiched Coal-Rock System Under Uniaxial Compression. Appl. Sci. 2019, 9, 1195. [Google Scholar] [CrossRef]
  18. Tan, Y.L.; Ma, Q.; Liu, X.S.; Zhao, Z.H.; Zhao, M.X.; Li, L. Failure prediction from crack evolution and acoustic emission characteristics of coal-rock sandwich composite samples under uniaxial compression. Bull. Eng. Geol. Environ. 2022, 81, 200. [Google Scholar] [CrossRef]
  19. Yin, D.W.; Chen, S.J.; Ge, Y.; Liu, R. Mechanical properties of rock–coal bi-material samples with different lithologies under uniaxial loading. J. Mater. Res. Technol. 2021, 10, 322–338. [Google Scholar] [CrossRef]
  20. Li, F.X.; Yin, D.W.; Wang, F.; Jiang, M.N.; Li, X.L. Effects of combination mode on mechanical properties of bi-material samples consisting of rock and coal. J. Mater. Res. Technol. 2022, 19, 2156–2170. [Google Scholar] [CrossRef]
  21. Chen, S.J.; Yin, D.W.; Jiang, N.; Wang, F.; Zhao, Z.H. Mechanical properties of oil shale-coal composite samples. Int. J. Rock Mech. Min. Sci. 2019, 123, 104120. [Google Scholar] [CrossRef]
  22. Yang, E.H.; Li, S.H.; Lin, H.F.; Zhao, P.X.; Qin, L.; Zhao, B. Influence mechanism of coal thickness effect on strength and failure mode of coal–rock combination under uniaxial compression. Environ. Earth Sci. 2022, 81, 429. [Google Scholar] [CrossRef]
  23. Liu, X.S.; Tan, Y.L.; Ning, J.G.; Lu, Y.W.; Gu, Q.H. Mechanical properties and damage constitutive model of coal in coal-rock combined body. Int. J. Rock Mech. Min. Sci. 2018, 110, 140–150. [Google Scholar] [CrossRef]
  24. Wu, G.S.; Yu, W.J.; Zuo, J.P.; Du, S.H. Experimental and theoretical investigation on mechanisms performance of the rock-coal-bolt (RCB) composite system. Int. J. Min. Sci. Technol. 2020, 30, 759–768. [Google Scholar] [CrossRef]
  25. Ma, S.Z.; Liu, K.W.; Guo, T.F.; Yang, J.C.; Li, X.D.; Yan, Z.X. Experimental and numerical investigation on the mechanical characteristics and failure mechanism of cracked coal & rock-like combined sample under uniaxial compression. Theor. Appl. Fract. Mech. 2022, 122, 103583. [Google Scholar] [CrossRef]
  26. Zhao, D.; Chang, H.M.; Pu, Y.X.; Feng, Z.C.; Li, X.W. Study on mechanical parameters and creep seepage characteristics of different coal and rock combination samples. Géoméch. Geophys. Geo-Energy Geo-Resour 2023, 9, 25. [Google Scholar] [CrossRef]
  27. Lu, J.; Huang, G.; Gao, H.; Li, X.; Zhang, D.M.; Yin, G.Z. Mechanical Properties of Layered Composite Coal–Rock Subjected to True Triaxial Stress. Rock Mech. Rock Eng. 2020, 53, 4117–4138. [Google Scholar] [CrossRef]
  28. Huang, B.X.; Liu, J.W. The effect of loading rate on the behavior of samples composed of coal and rock. Int. J. Rock Mech. Min. Sci. 2013, 61, 23–30. [Google Scholar] [CrossRef]
  29. You, M.Q.; Su, C.D.; Zhou, Y. Strength and deformation of specimen for different coal blocks and regression method of strength criterion. Chin. J. Rock Mech. Eng. 2003, 22, 2081–2085. [Google Scholar]
  30. Ding, X.; Xiao, X.C.; Lv, X.F. Investigate on the fractal characteristics and acoustic emission of coal fracture. J. China Coal Soc. 2018, 43, 3080–3087. [Google Scholar]
  31. Hoek, E.; Martin, C.D. Fracture initiation and propagation in intact rock—A review. J. Rock Mech. Geotech. Eng. 2014, 6, 287–300. [Google Scholar] [CrossRef]
  32. Yang, S.-Q.; Huang, Y.-H.; Jing, H.-W.; Liu, X.-R. Discrete element modeling on fracture coalescence behavior of red sandstone containing two unparallel fissures under uniaxial compression. Eng. Geol. 2014, 178, 28–48. [Google Scholar] [CrossRef]
  33. Luo, Y.; Wang, G.; Li, X.P.; Liu, T.T.; Mandal, A.K.; Xu, M.; Xu, K. Analysis of energy dissipation and crack evolution law of sandstone under impact load. Int. J. Rock Mech. Min. Sci. 2020, 132, 104359. [Google Scholar] [CrossRef]
  34. Wu, D.T.; Luo, F.; Li, M.; Diao, Y.L.; Guo, Y.J.; Xu, P.D. Macroscopic and microscopic study on the compression bearing characteristics and deformation failure mechanism of gangue with different particle sizes. Powder Technol. 2021, 383, 198–211. [Google Scholar] [CrossRef]
  35. Chen, Y.L.; Zuo, J.P.; Liu, D.J.; Wang, Z.B. Deformation failure characteristics of coal–rock combined body under uniaxial compression: Experimental and numerical investigations. B. Eng. Geol. Environ. 2018, 78, 3449–3464. [Google Scholar] [CrossRef]
  36. Wang, K.; Zhang, X.; Du, F.; Li, K.N.; Sun, J.Z.; Wang, Y.Q. Numerical study on damage response and failure mechanism of gas-containing coal-rock combination under confining pressure effect. Fuel 2023, 349, 128683. [Google Scholar] [CrossRef]
  37. Tian, C.L.; Sun, H.T.; Dai, L.C.; Li, R.F.; Wang, B.; Cao, J.; Wang, J.; Hu, Q.T. Experimental study on mechanical properties and energy evolution law of coal-rock composite structure under different interface connection modes. Geofluids 2022, 2022, 1288463. [Google Scholar] [CrossRef]
  38. Ma, Q.; Tan, Y.L.; Liu, X.S.; Gu, Q.H.; Li, X.B. Effect of coal thicknesses on energy evolution characteristics of roof rock-coal-floor rock sandwich composite structure and its damage constitutive model. Compos. Part B: Eng. 2020, 198, 108086. [Google Scholar] [CrossRef]
  39. Ma, Q.; Tan, Y.-L.; Liu, X.-S.; Zhao, Z.-H.; Fan, D.-Y. Mechanical and energy characteristics of coal–rock composite sample with different height ratios: A numerical study based on particle flow code. Environ. Earth Sci. 2021, 80, 309. [Google Scholar] [CrossRef]
  40. Yin, D.W.; Chen, S.J.; Chen, B.; Liu, X.Q.; Ma, H.F. Strength and failure characteristics of the rock-coal combined body with single joint in coal. Geomech. Eng. 2018, 15, 1113–1124. [Google Scholar]
  41. Shimizu, H.; Murata, S.; Ishida, T. The distinct element analysis for hydraulic fracturing in hard rock considering fluid viscosity and particle size distribution. Int. J. Rock Mech. Min. Sci. 2011, 48, 712–727. [Google Scholar] [CrossRef]
  42. Zeng, W.; Yang, S.-Q.; Tian, W.-L.; Wen, K. Numerical investigation on permeability evolution behavior of rock by an improved flow-coupling algorithm in particle flow code. J. Central South Univ. 2018, 25, 1367–1385. [Google Scholar] [CrossRef]
  43. PFC2D 3.0 Manual; Itasca Consulting Group Inc.: Minneapolis, MN, USA, 2004.
  44. Yang, X.X.; Kulatilake, P.H.S.W.; Chen, X.; Jing, H.W.; Yang, S.Q. Particle Flow Modeling of Rock Blocks with Nonpersistent Open Joints under Uniaxial Compression. Int. J. Géoméch. 2016, 16, 04016020. [Google Scholar] [CrossRef]
  45. PFC3D-Particle Flow Code in 3 Dimensions, Version 4.0; Itasca Consulting Group Inc.: Minneapolis, MN, USA, 2008.
  46. Ding, X.B.; Zhang, L.Y. A new contact model to improve the simulated ratio of unconfined compressive strength to tensile strength in bonded particle models. Int. J. Rock Mech. Min. Sci. 2014, 69, 111–119. [Google Scholar] [CrossRef]
  47. Shen, Z.F.; Jiang, M.J.; Thornton, C. DEM simulation of bonded granular material. Part I: Contact model and application to cemented sand. Comput. Geotech. 2016, 75, 192–209. [Google Scholar] [CrossRef]
  48. Indraratna, B.; Thakur, P.K.; Vinod, J.S. Experimental and numerical study of railway ballast behavior under cyclic loading. Int. J. Géoméch. 2010, 10, 136–144. [Google Scholar] [CrossRef]
  49. Lee, H.; Jeon, S. An experimental and numerical study of fracture coalescence in precracked specimens under uniaxial com-pression. Int. J. Solids. Struct. 2011, 48, 979–999. [Google Scholar] [CrossRef]
  50. Ji, P.Q.; Zhang, X.P.; Zhang, Q. A new method to model the non-linear crack closure behavior of rocks under uniaxial com-pression. Int. J. Rock. Mech. Min. 2018, 112, 171–183. [Google Scholar] [CrossRef]
  51. Song, H.Q.; Zuo, J.P.; Liu, H.Y.; Zuo, S.H. The strength characteristics and progressive failure mechanism of soft rock-coal combination samples with consideration given to interface effects. Int. J. Rock Mech. Min. Sci. 2021, 138, 104593. [Google Scholar] [CrossRef]
  52. Yin, D.W.; Chen, S.J.; Sun, X.Z.; Jiang, N. Strength characteristics of roof rock-coal composite samples with different height ratios under uniaxial loading. Arch. Min. Sci. 2019, 64, 307–319. [Google Scholar] [CrossRef]
  53. Tan, X.S.; Xian, X.F.; Zheng, D.F. Theory and Application of Compound Rock Mass Mechanics, 1st ed.; China Coal Industry Publishing House: Beijing, China, 1994; pp. 64–66. [Google Scholar]
  54. Gao, F.Q.; Stead, D.; Elmo, D. Numerical simulation of microstructure of brittle rock using a grain-breakable distinct element grain-based model. Comput. Geotech. 2016, 78, 203–217. [Google Scholar] [CrossRef]
  55. Xie, H.P.; Li, L.; Peng, R.D.; Ju, Y. Energy analysis and criteria for structural failure of rocks. J. Rock Mech. Geotech. Eng. 2009, 1, 11–20. [Google Scholar] [CrossRef]
  56. Jia, Z.Q.; Li, C.B.; Zhang, R.; Wang, M.; Gao, M.Z.; Zhang, Z.T.; Zhang, Z.P.; Ren, L.; Xie, J. Energy Evolution of Coal at Different Depths Under Unloading Conditions. Rock Mech. Rock Eng. 2019, 52, 4637–4649. [Google Scholar] [CrossRef]
  57. Wang, H.D.; Chang, J.C.; Wang, T.; Zhang, H.L.; Guo, Y.J. Mechanical Properties and Strength Characteristics of Rock-Coal-Rock Assemblages under Different Peripheral Pressures. Sustainability 2023, 15, 12463. [Google Scholar] [CrossRef]
  58. Xie, H.P. Research review of the state key research development program of China: Deep rock mechanics and mining theory. J. China Coal Soc. 2019, 44, 1283–1305. [Google Scholar]
  59. Zuo, J.P.; Chen, Y.; Song, H.Q. Study progress of failure behaviors and nonlinear model of deep coal-rock combined body. J. Cent. South Univ. 2021, 52, 2510–2521. [Google Scholar]
  60. Dai, L.C.; Zhang, Z.G.; Sun, H.T.; Gao, H.L. Research on mechanical properties and energy evolution law of coal-rock as-semblage with different gas pressures. Sustainability 2022, 14, 9904. [Google Scholar] [CrossRef]
  61. Chen, G.B.; Li, T.; Yang, L.; Zhang, G.H.; Li, J.W.; Dong, H.J. Mechanical properties and failure mechanism of combined bodies with different coal-rock ratios and combinations. J. Min. Strat. Control. Eng. 2021, 3, 023522. [Google Scholar]
  62. Wang, T.; Chang, J.C.; Wang, H.D. A Study of the Deformation Law of the Surrounding Rock of a Laminated Roadway Based on FLAC3D Secondary Development. Appl. Sci. 2023, 13, 6077. [Google Scholar] [CrossRef]
  63. Zhang, H.; Lu, C.-P.; Liu, B.; Liu, Y.; Zhang, N.; Wang, H.-Y. Numerical investigation on crack development and energy evolution of stressed coal-rock combination. Int. J. Rock Mech. Min. Sci. 2020, 133, 104417. [Google Scholar] [CrossRef]
Figure 1. Coal–rock combination field prototype and structural model.
Sustainability 15 15175 g001
Figure 2. Testing equipment.
Sustainability 15 15175 g002
Figure 3. Stress–strain curves of the different types of samples.
Sustainability 15 15175 g003
Figure 4. Normal and tangential mechanical responses of CBM [39]. (Modified from references of the ltasca Consulting Group inc. 2004).
Sustainability 15 15175 g004
Figure 5. Schematic diagram of parallel bond [44].
Sustainability 15 15175 g005
Figure 6. The initial crack between particles. (a) Position of the two notional surfaces; (b) opening of microcracks, modified from Figure 4.
Sustainability 15 15175 g006
Figure 7. Calibration of microscopic parameters under uniaxial compression. (a) Coal; (b) rock.
Sustainability 15 15175 g007
Figure 8. Schematic diagram of the coal and rock combination model.
Sustainability 15 15175 g008
Figure 9. Stress–strain curves of coal and rock combined bodies under uniaxial compression. (a) R:C = 5:5; (b) R:C = 6:4; (c) R:C = 7:3; (d) different proportions.
Sustainability 15 15175 g009
Figure 10. The UCS of the CRC specimens after failure with the coal thickness.
Sustainability 15 15175 g010
Figure 11. (a) Stress state of the roof–coal pillar structure; (b) element near the interface between coal and rock.
Sustainability 15 15175 g011
Figure 12. Variations in the ultimate compression strength of CRC at different positions with the coal thickness.
Sustainability 15 15175 g012
Figure 13. Comparison of coal and rock combination with different height ratios before and after loading. (a) Before loading; (b) after loading.
Sustainability 15 15175 g013
Figure 14. Numerical simulation results of CRC with different rock-to-coal height ratios. (a) R:C = 5:5; (b) R:C = 6:4; (c) R:C = 7:3; (d) R:C = 8:2; (e) R:C = 9:1.
Sustainability 15 15175 g014
Figure 15. Failure displacement cloud image. (a) R:C = 5:5; (b) R:C = 6:4; (c) R:C = 7:3; (d) R:C = 8:2; (e) R:C = 9:1.
Sustainability 15 15175 g015
Figure 16. Relationship between crack morphology and stress–strain response. (a) R:C = 5:5; (b) R:C = 8:2.
Sustainability 15 15175 g016
Figure 17. Variation in the number of tensile and shear cracks with the change in vertical stress of different coal–rock ratios. (a) R:C = 5:5; (b) R:C = 6:4; (c) R:C = 7:3; (d) R:C = 8:2; (e) R:C = 9:1.
Sustainability 15 15175 g017
Figure 18. Relationship between CRCs with different coal-to-rock height ratios, energy and strain. (a) Total input energy Uo; (b) elastic strain energy Ue; (c) dissipated strain energy Ud.
Sustainability 15 15175 g018
Figure 19. Relationship between dissipative strain energy and accumulated elastic strain energy in CRC.
Sustainability 15 15175 g019
Figure 20. Force chain distribution of CRCs in the compression process at R:C = 5:5. (a) Pre-peak: 60% of the peak; (b) the peak; (c) post-peak: 80% of the peak; (d) post-peak: 60% of the peak; (e) post-peak: 10% of the peak.
Sustainability 15 15175 g020
Figure 21. The final results of force chain distributions of coal and rock combined bodies with different coal–rock height ratios. (a) R:C = 5:5; (b) R:C = 6:4; (c) R:C = 7:3; (d) R:C = 8:2; (e) R:C = 9:1.
Sustainability 15 15175 g021
Table 1. Mechanical properties results of samples.
No.Size/mm × mmMass/gUniaxial Compressive Strength
σ/MPa
Axial Peak Strain
ε/%
Elastic Modulus
E/GPa
R-1 ϕ49.15 × 100.63498.3110.510.7221.67
R-2 φ49.21 × 100.69501.887.530.8223.15
R-3 φ49.32 × 100.32500.299.560.7825.99
C-1 φ49.51 × 98.56235.744.572.472.31
C-2 φ49.94 × 100.38245.344.081.892.76
C-3 φ49.77 × 99.48240.842.452.152.50
55-1 φ49.40 × 101.01369.634.361.074.59
55-2 φ49.15 × 101.39375.742.911.234.62
55-3 φ49.02 × 100.89380.245.281.254.82
64-1 φ49.14 × 100.20390.446.911.335.80
64-2 φ49.20 × 99.98399.840.741.016.17
64-3 φ49.08 × 100.36395.648.211.106.12
73-1 φ49.04 × 100.30425.846.320.847.34
73-2 φ49.16 × 100.38422.348.691.025.15
73-3 φ49.36 × 99.75423.450.950.977.04
Table 2. Simulation and testing results of the basic mechanical parameters.
ItemUniaxial Compressive Strength/MPaElastic Modulus/GPaPoisson’s Ratio
SandstoneSimulation110.8819.630.213
Experiment110.5121.670.198
CoalSimulation44.212.590.342
Experiment44.082.760.318
Table 3. Microparameters of rock and coal in PFC2D tests.
ItemParameterCoalSandstone
Linear contactContact model modulus/Pa3.2 × 1092.3 × 1010
Contact stiffness ratio2.02.0
Friction coefficient0.50.55
Parallel bondBonding modulus/Pa3.84 × 1084.60 × 109
Bonding stiffness ratio1.21.5
Normal bond strength/Pa1.75 × 1074.5 × 107
Tangential bond strength/Pa1.88 × 1074.8 × 107
Frictional coefficient/°25.029.0
Table 4. Microparameters of bonding surface in PFC2D tests.
ItemParameterValueItemParameterValue
Contact model modulus /Pa1.0 × 109 Bonding modulus/Pa2.0 × 108
Linear contactContact stiffness ratio2.0 Bonding stiffness ratio1.5
Friction coefficient0.55Parallel bondNormal bond strength/Pa3.5 × 107
Tangential bond strength/Pa3.5 × 107
Frictional coefficient/°50.0
Table 5. The number of tensile and shear cracks of coal and rock in CRC.
R:CCrack_TensionCrack_ShearNumber of Cracks
CoalRockCoalRock
5:51341215601499
6:41114214701263
7:31118515301276
8:211795115331386
9:1510879119441552
Disclaimer/Publisher’s Note: The statements, opinions and data contained in all publications are solely those of the individual author(s) and contributor(s) and not of MDPI and/or the editor(s). MDPI and/or the editor(s) disclaim responsibility for any injury to people or property resulting from any ideas, methods, instructions or products referred to in the content.

