Article

Does Regional Integration Improve Carbon Emission Performance?—A Quasi-Natural Experiment on Regional Integration in the Yangtze River Economic Belt

School of Political Science and Public Administration, Henan Normal University, Xinxiang 453007, China
*
Author to whom correspondence should be addressed.
Sustainability 2023, 15(20), 15154; https://doi.org/10.3390/su152015154
Submission received: 22 August 2023 / Revised: 30 September 2023 / Accepted: 20 October 2023 / Published: 23 October 2023
(This article belongs to the Special Issue Economic Policies for the Sustainability Transition)

Abstract

:
Carbon emission performance (CEP) comprehensively considers the four-dimensional factors of “carbon reduction, pollution reduction, green expansion, and growth” and constitutes a key indicator for low-carbon and high-quality development. Although some studies have previously explored the relationship between regional integration and carbon emissions from different perspectives, it remains unclear how regional integration affects carbon emission performance. This article regards the regional integration construction of the Yangtze River Economic Belt as a quasi-natural experiment and uses the difference-in-difference (DID) model to empirically examine the mechanisms behind regional integration and their impact on carbon emission performance. The results show that regional integration significantly promotes improvements in carbon emission performance, primarily through three transmission mechanisms: resource factor allocation, economies of scale, and green innovation. It can also promote improvements in carbon emission performance in high-level carbon emission performance cities, middle- and downstream cities, non-natural-resource-oriented cities, and non-riverside cities. This article provides theoretical and empirical evidence that can be utilized to promote China’s high-quality, low-carbon transformation through regional integration construction in the Yangtze River Economic Belt.

1. Introduction

As global climate change intensifies, low-carbon sustainable development has become a focus of governments and academia worldwide. As a major carbon emitter globally, China’s strategies and actions in the low-carbon transition will be crucial in global climate governance. To achieve high-quality, low-carbon sustainable development in China, the full report of the 20th National Congress of the Communist Party of China explicitly proposes to “coordinate efforts to reduce carbon, reduce pollution, expand greenery, and promote growth, prioritizing ecology, conserving resources, and pursuing green low-carbon development”. Carbon emission performance comprehensively considers the four dimensions of “carbon reduction, pollution reduction, green expansion, and growth”, serving as a key indicator for measuring the green low-carbon development of Chinese-style modernization. However, the market segmentation that persists due to local government protectionism hinders progress in achieving regional environmental collaborative governance and green and low-carbon transformation [1], which is not conducive to improving the carbon emission performance level. With regional integration gradually becoming a national strategy for China’s economic development [2], a series of regional integration construction documents, based on urban agglomerations, has been continuously promulgated and implemented [3]. This has provided new ideas for solving the problem of environmental collaborative governance in regional integration construction and promoting green and low-carbon economic transformation.
Within the context of regional climate governance, the advancement of integration offers jurisdictions a unified platform for collaborative action against the challenges posed by climate change. Such synergistic governance not only facilitates the attainment of carbon emission objectives but also promotes the efficient allocation of resources and the dissemination of technological innovation. Moreover, regional integration affords the opportunity to collaboratively devise and enforce more stringent environmental standards and policies. The quintessential role of regional climate governance lies in its capacity to transcend administrative boundaries, fostering extensive collaboration and synergy. This governance paradigm encourages regions to tailor adaptive strategies in accordance with their unique environmental and economic contexts, thereby addressing climate change challenges more effectively. It is imperative to note that regional climate governance is not solely an intergovernmental endeavor. It instead encompasses the broad participation of corporations, non-governmental organizations, and civil society, all of whom can play pivotal roles in the formulation and execution of climate strategies. This multifaceted involvement ensures a more holistic and efficacious implementation of strategies, simultaneously bolstering public enthusiasm for and engagement in climate policies. Nonetheless, regional climate governance faces several challenges, such as ensuring consistency in commitments and actions across regions, resolving potential conflicts of interest, and guaranteeing the long-term sustainability and adaptability of strategies. Yet, given the escalating complexity and urgency of global climate governance, regional climate governance undoubtedly presents a promising solution. So, can regional integration construction empower carbon emission performance? If so, what is the specific transmission mechanism at work? Is there heterogeneity in its operation? Exploring this series of issues has important theoretical and practical significance for achieving green and low-carbon development in China. Therefore, this study treats the construction of the Yangtze River Economic Belt regional integration as a quasi-natural experiment, utilizing panel data from 283 Chinese cities from 2006 to 2019 to investigate the impact and mechanisms of regional integration on carbon emission performance and explain their differential impacts. The aim is to provide theoretical and empirical evidence from the Yangtze River Economic Belt in order to advance regional integration and promote a high-quality, low-carbon transition in China and globally.
The literature closely related to this study focuses, firstly, on the evaluation of carbon emission performance. Some studies use single-indicator methods such as carbon emission intensity [4,5] and carbon productivity [6,7] to measure carbon emission performance, but these methods ignore the comprehensive effects of other factors [8]. Additionally, the research on this topic adopts the input–output technique and measures carbon emission performance from the perspective of carbon emission efficiency, using methods such as the SBM model [9,10]. Another major aspect of this field of research examines the basic connotation, driving mechanism, implementation path, and measurement of regional integration. Regional integration refers to the process and state of the rational allocation of production factors in accordance with market dynamics, institutional arrangements, and functions, in order to achieve factor-scale agglomeration and cooperation across the division of labor [11]. This concept is not only applicable to cross-regional cooperation organizations, but also to urban agglomerations. Since the rise of regional integration theory and new regionalism theory [12,13], some scholars have conducted qualitative analyses of the basic connotations, driving mechanisms, and implementation paths of regional integration [14], using production methods [15], price methods [16], and comprehensive indicators [17] to quantitatively measure economic integration, market integration, and overall regional integration.
The environmental, social, and economic effects of regional integration have also received considerable attention from the academic community. Based on the use of price methods to measure regional integration in China, research has empirically determined that regional integration promotes carbon emission performance [18] and regional green total factor productivity [19]. Additionally, market integration can reduce carbon emissions [20]. However, some studies have found that the positive and negative impacts of the integration level of the Chengdu Chongqing urban agglomeration in China on the urban ecological environment depend on factors such as economic development level, development stage, and location [21]. There are also studies that have found the regional economic integration in Chinese urban agglomerations to be able to promote optimal resource allocation and improve urban land use efficiency in the process of socio-economic transformation [22]. Since the development of the DID model, the PSM–DID (propensity score matching DID) model, and synthetic control methods, most studies have examined the green and low-carbon development effects of regional integration policies.
Research into environmental pollution suggests that regional unification efforts, as seen in the EU integration [23] and the expansion of China’s Yangtze River Delta integration [24], can mitigate such pollution. Conversely, other findings indicate that while the Yangtze River Economic Belt’s integration in China curtails transboundary pollution through enhanced governmental oversight, joint governance, industrial restructuring, green tech advancements, and competitive markets, it intensifies this pollution by broadening market dimensions and fostering population concentration [25]. In terms of carbon emissions, evidence from China’s administrative reform—transitioning from counties to districts—reveals that intra-city regional amalgamation curtails emissions by relocating energy-intensive, high-pollution businesses elsewhere [26]. The confluence of industrial and urban sectors in China’s Yellow River Basin has caused a decline in carbon emissions [27]. Furthermore, the broadening scope of regional amalgamation in China’s Yangtze River Delta has markedly diminished urban carbon outputs. Deepening collaborative governance, refining industrial frameworks, and advancing green innovations stand as pivotal drivers in this reduction [28]. However, certain studies, centered on the Yangtze River Delta’s integration, argue that while regional unification endeavors have streamlined urban carbon emission intensities by elevating industrial structures and technological prowess, they have inadvertently amplified emissions due to intensified inter-city economic interactions [29]. Research also found that regional trade integration has failed to affect CO2 emissions in Cambodia, Malaysia, Indonesia, and Thailand [30]. Additionally, it has been determined that de facto conditions, in terms of trade integration, and de jure conditions in financial integration have mitigating effects on CO2 emissions in Venezuela [31]. Economically and socially, research indicates that the strategic development of China’s Yangtze River Economic Belt has the potential to address overproduction [32] and bolster employment opportunities [33].
In summary, this study believes that there remains room for further exploration in the research on regional integration construction. Firstly, the single-indicator method for measuring carbon emission performance overlooks the comprehensive effects of other factors, and the input–output method based on the SBM model from the perspective of carbon emission efficiency fails to incorporate “green expansion and pollution reduction” into the indicator system. Secondly, regarding the relationship between regional integration and carbon emissions, discussions have not reached a consensus due to varying research subjects, methodologies, and perspectives. (3) In terms of model endogeneity, while some studies have attempted to evaluate the green and low-carbon effects of regional integration, the endogeneity issue still requires further resolution using natural geographic tool variables.
This study expands and enriches these considerations from the following perspectives: (1) this study incorporates “green expansion and pollution reduction” into the connotation theory of carbon emission performance, comprehensively and systematically constructing a carbon emission performance indicator system and thereby making up for the shortcomings of previous single-indicator methods and input–output methods. (2) This study focuses on the urban scale and uses the DID model to accurately evaluate the impact of the integration strategy of the Yangtze River Economic Belt on carbon emission performance. Additionally, this research examines the multidimensional implementation mechanisms used to enact the strategy. It systematically analyzes the transmission mechanisms between strategy and performance, including resource factor allocation, economies of scale, and green innovation. (3) This study uses river density and river length as instrumental variables for regional integration, in order to further alleviate the endogeneity problem of the model. (4) This research investigates the differential effects of urban carbon emission performance levels, different river basins where cities are located, urban-scale characteristics, urban resource endowments, and whether cities are located along the Yangtze River.

2. Theoretical Analysis and Hypothesis

Carbon emission performance can be defined as the economic, social, and ecological benefits produced in human social production and living activities by consuming the carbon ecological capacity of nature. The core goal of assessing such a metric is to optimize and intensively manage resource elements, hoping for minimal resource input and reduced carbon emissions among other unintended outputs, in order to achieve the best possible economic, social, and ecological effects. This study suggests that regional integration construction can generate a low-carbon dividend of “emission reduction efficiency enhancement” through resource factor allocation effects, economy-of-scale effects, and green innovation effects, thereby affecting carbon emission performance.
Under the boundary effect of market segmentation, the cross-regional flow of resource elements and collaboration in production links are hindered [34], which is the main reason for the inefficient utilization of urban energy and the high-level carbon emission intensity [1]. According to the connotations of economic integration proposed by Tinbergen, coordinated development within the geographical scope of economic cooperation can weaken boundary barriers, meaning that regional integration has the direct effect of breaking market segmentation. As one of the developmental forms of regional integration, factor market integration provides basic conditions for eliminating and weakening obstacles to the free flow of resources and factors [35]. Specifically, regional integration promotes market integration and openness, with more free distribution of resource elements such as capital, labor, and information [36]. On the one hand, it plays a market selection effect, driving resource elements to flow towards enterprises with higher marginal output, accelerating the elimination of backward and inefficient production [37] and forcing enterprises to improve processes, resource utilization efficiency, and production efficiency. On the other hand, regional integration has strengthened the cooperation mechanisms of the market. For example, cities with stricter environmental standards can obtain intermediate products through purchasing instead of production, thereby reducing carbon emissions in the production process. This process demonstrates the trade creation and substitution effects of regional integration, reducing urban carbon emissions by improving factor returns and “transaction efficiency” [16].
The new trade theory emphasizes the importance of market size and economies of scale in international trade. Regional integration, by expanding market size, offers firms greater production and sales scale, theoretically providing support for the economy-of-scale effects of regional integration. Regional integrated infrastructure planning, coordination, and cooperative construction can effectively improve transportation accessibility and provide cost advantages between provinces and cities through the “spatiotemporal compression” mechanism, promoting industrial production activities to become “standardized” and “scaled” within a region. The resulting cost advantages promote improvements in energy consumption and resource utilization efficiency, achieving the goal of improving production efficiency and reducing carbon emission intensity. In addition, the economy-of-scale effects caused by regional integration will also extend the industrial chain and production links, forming favorable spillovers. For example, advanced demonstration enterprises and enterprises in low-carbon, underdeveloped areas will continue to cooperate. This has the effect of spreading and promoting production experience, advanced production models, and clean production technologies, thereby creating favorable incentives for improving production efficiency and reducing carbon emissions upstream and downstream for enterprises in the industrial chain and surrounding cities.
The technology diffusion theory suggests that the spread of technology is influenced by geographical and spatial factors. For instance, new technologies are more likely to disseminate between regions that are geographically adjacent or culturally similar. Against a backdrop of regional integration, technology diffusion and knowledge sharing become more frequent, offering richer resources and opportunities for green innovation. Green innovation is an important driving force for improving production efficiency and carbon reduction intensity [38]. On the one hand, the endogenous growth theory argues that innovation is endogenous in the production process and is an effective means of improving the utilization efficiency of production factor resources and reducing natural resource depletion [39]. Conversely, existing research and empirical evidence also indicate that progress in green technologies (such as carbon reduction technologies) is the key to reducing carbon emission intensity and improving carbon emission reduction efficiency [16]. Against the background of regional integration, innovation entities can provide new momentum for the spillover of innovative elements by expanding the scope of cooperation and weakening boundary barriers [40], thereby forming an important mechanism for promoting urban carbon emission reduction and carbon efficiency improvement. On the one hand, according to the classical growth convergence model, integrated cities, due to their comparative advantage in innovation benefits, can provide excellent opportunities for gathering innovation factors. The integrated market guidance function helps to fully leverage the allocation role of price signals among innovation entities, leading to a “demand innovation” mechanism and promoting the application and derivation of advanced and clean production technologies within the economic belt. Conversely, regional integration provides the possibility for innovative division of labor and collaboration. In building a regional collaborative innovation platform, integration enhances the driving force of innovation belts such as entrepreneurial behavior, R&D funding investment, and new product project development within the region, thereby improving the regional coordination of green innovation development and promoting a low-carbon transformation within the region.
Hypothesis 1.
Regional integration can improve carbon emission performance, which is done primarily through three transmission mechanisms: resource factor allocation, economies of scale, and green innovation.

3. Research Methods

3.1. Econometric Model

The difference-in-differences (DID) model is a statistical technique in econometrics and empirical economics, used to measure the impact of specific interventions or treatments (such as policy changes) on outcome variables. The fundamental idea of DID is to compare the changes in outcomes between a group subjected to the intervention and a control group not subjected to it, with data taken before and after the intervention. This includes both the single-period DID model and the multi-period DID model, wherein the single-period DID model primarily focuses on the changes in outcome variables over one period before and after the intervention. Its advantage lies in its simplicity in calculation and capacity to examine the effects of intervention, using data from just two periods. A drawback of this method is its assumption that, without any intervention, the difference between the two groups remains constant before and after the intervention, which might not always hold true. The multi-period DID model considers multiple periods before and after the intervention, allowing researchers to capture the effects of the intervention more accurately, especially when these effects vary over time. The multi-period DID model can capture the changes in intervention effects over time and better control for unobserved time-varying confounders. However, the multi-period DID model is prone to biases in multi-time-point difference-in-differences estimates under bidirectional fixed effects. In 2014, the Chinese government incorporated Shanghai and 10 other provinces (cities) into the Yangtze River Economic Belt regional integration strategy, with 2014 being the sole year of policy implementation. Therefore, the single-period DID model is suitable for evaluating the impact of the Yangtze River Economic Belt’s regional integration construction on CEP. The specific formula for the single-period DID model is as follows:
C E P i t = α 0 + α 1 P O L I C Y i t + φ X i t + μ i + v t + ε i t
where CEP is carbon emission performance, POLICY is the policy variable for regional integration construction, X i t is the control variable, α 0 is a constant term, α 1 is the influence coefficient of POLICY, μ i is an individual fixed effect, vt is a time fixed effect, and ε i t represents a random interference term.
To verify Hypothesis 1, this article constructed a panel-mediated effect model based on Formula (1), which includes Formulas (2) and (3):
M E D i t = β 0 + β 1 P O L I C Y i t + φ X i t + μ i + v t + ε i t
C E P i t = γ 0 + γ 1 M E D i t + γ 2 P o l i c y i t + φ X i t + μ i + v t + ε i t
where MED is the mediating variable, β 1 is the coefficient of influence on MED, and γ 1 is the coefficient of influence of the mediating variable on CEP. If the α 1 coefficient in the model (1) is significantly positive and the β 1 and γ 1 coefficients are both significantly positive, regional integration can improve carbon emission performance via variable mediation.

3.2. Variables

3.2.1. Dependent Variable

The carbon emission performance indicator system of this study is shown in Table 1. The system involves three categories: input indicators, expected output indicators, and non-expected output indicators. Among these, input indicators include four categories: land, labor, capital, and energy; expected output indicators include three categories: economic benefit output, ecological benefit output, and social benefit output; and non-expected output indicators include pollution emissions and carbon dioxide emissions. Previous studies have mostly used the SBM model to measure carbon emission performance. This study used an EBM model that includes radial and SBM distance functions to measure carbon emission performance [41], overcoming the bias in carbon emission performance measurement based on the SBM model alone.

3.2.2. Core Independent Variable

In 2014, the Chinese government officially issued the “Guiding Opinions on Promoting the Development of the Yangtze River Economic Belt through the Golden Waterway”. This incorporated 11 provinces (cities) such as Shanghai, Jiangsu, Zhejiang, Anhui, Jiangxi, Hubei, Hunan, Chongqing, Sichuan, Guizhou, and Yunnan into the regional integration strategy of the Yangtze River Economic Belt, marking its official implementation. This study selected 283 cities in China as the overall research sample, assigning a value of one to the cities included in the Yangtze River Economic Belt regional integration strategy as the experimental group and zero for the cities not included within this region as the control group. We assigned the time dummy variables included from the 2014 regional integration strategy of the Yangtze River Economic Belt to zero and one, respectively. The policy variable (POLICY) for regional integration is measured by the interaction term between the regional dummy variable and the time dummy variable of the implementation of the Yangtze River Economic Belt regional integration strategy. Working from the research sample, 108 cities in the Yangtze River Economic Belt were selected as the experimental group, and the remaining 175 non-Yangtze River Economic Belt cities were selected as the control group.

3.2.3. Mediating Variables

This study measured resource factor allocation (AE), green innovation (INNOV), and economies of scale (SCALE) using the metrics of urban total factor productivity [42], green invention patent applications per 10,000 people [43], and non-agricultural added value per unit of administrative land area [44].

3.2.4. Control Variables

In this study, we selected the following control variables based on the previous research [45]:
(1)
Temperature variation (TV): Elevated temperatures might lead to increased energy consumption, which is detrimental to CEP. This study measured TV using the average daily temperature of cities.
(2)
Transport infrastructure (INFRA): Efficient transportation infrastructure can reduce traffic congestion, ensuring smoother vehicle flow and thereby decreasing carbon emissions caused by idling and frequent stops and starts. This study measured INFRA using the per capita road area of cities.
(3)
Environmental regulation (ER): Environmental regulations can compel enterprises to adopt low- or zero-carbon technologies, thereby promoting technological innovation and R&D, and steering industries towards a more environmentally friendly and low-carbon direction. This study employed the entropy method to measure ER using an integrated index based on three indicators: the removal rate of sulfur dioxide, the removal rate of industrial smoke (dust), and the comprehensive utilization rate of industrial solid waste.
(4)
Openness to foreign investment (OPEN): Opening up to foreign investments can introduce advanced clean technologies domestically, which is beneficial for CEP. This study measured OPEN using the proportion of foreign direct investment (FDI) in GDP.
(5)
Industrial agglomeration (AGG): Excessive industrial agglomeration can lead to congestion effects, thus increasing a city’s carbon emissions, which is unfavorable for CEP. This study measures AGG using the locational entropy of manufacturing employees.
(6)
Industrial structure (INDUSTR): The presence of a higher proportion of secondary industry’s added value in GDP indicates a larger share of high-emission, low-efficiency heavy industries, which is detrimental to CEP. This study measured INDUSTR using the proportion of secondary industry’s added value in relation to overall GDP.
(7)
Government intervention (GOV): Local governments, in pursuit of GDP, might offer various incentives to heavy industries with high pollution and a large tax base. Hence, government intervention might be unfavorable for CEP. This study measured GOV using the proportion of government expenditure, excluding investment in science and education.
(8)
Population density (POP): A higher population density might lead to urban traffic congestion, increasing carbon emissions. This study measured POP using the population per administrative region.
(9)
Energy utilization efficiency (ENER): Enhancing energy efficiency can reduce the demand for fossil fuels like coal, oil, and natural gas, thereby decreasing the carbon emissions associated with their combustion. This study measured ENER using the total energy consumption per unit of GDP.
(10)
Human capital (HUMAN): Human capital can provide talent support for low-carbon technologies, which is beneficial for CEP. This study measured HUMAN using the number of undergraduate students per 10,000 population.

3.3. Data Source and Statistical Analysis

Table 2 shows the statistical description results of each variable. The data for this study were sourced from the “China Urban Statistical Yearbook” from 2007 to 2020 and the EPS data platform (https://www.epsnet.com.cn/, accessed on 10 October 2023), and missing data were supplemented using interpolation methods. This study excluded samples with missing data from cities such as Chaohu, Bijie, Tongren, Sansha, Lhasa, Hegang, and Sanya, and ultimately, panel data from 283 Chinese cities from 2006 to 2019 were selected for analysis.

4. Empirical Results and Analysis

4.1. Benchmark Analysis

Table 3 contains the benchmark test results of the impact of regional integration construction on carbon emission performance. From columns (1) to (3) of Table 3, it can be seen that, irrespective of whether a model controls for time effects or urban effects, regional integration construction can significantly promote improvements in carbon emission performance. From column (3) in Table 3, it can be seen that, compared to non-Yangtze River Economic Belt cities, the carbon emission performance of cities in the Yangtze River Economic Belt has increased by an average of 0.0355. On the one hand, the regional integration strategy of the Yangtze River Economic Belt guides the convergence of environmental regulation measures and provision among cities, thereby weakening the policy incentives and distortions caused by administrative and geographical divisions. These changes are conducive to achieving improvements in carbon emission performance across the entire basin at lower regulatory costs. On the other hand, this strategy indirectly promotes carbon emission performance by stimulating green innovation, guiding resource factor allocation, and generating economies of scale.

4.2. Robustness Analysis

4.2.1. Parallel Trend Testing
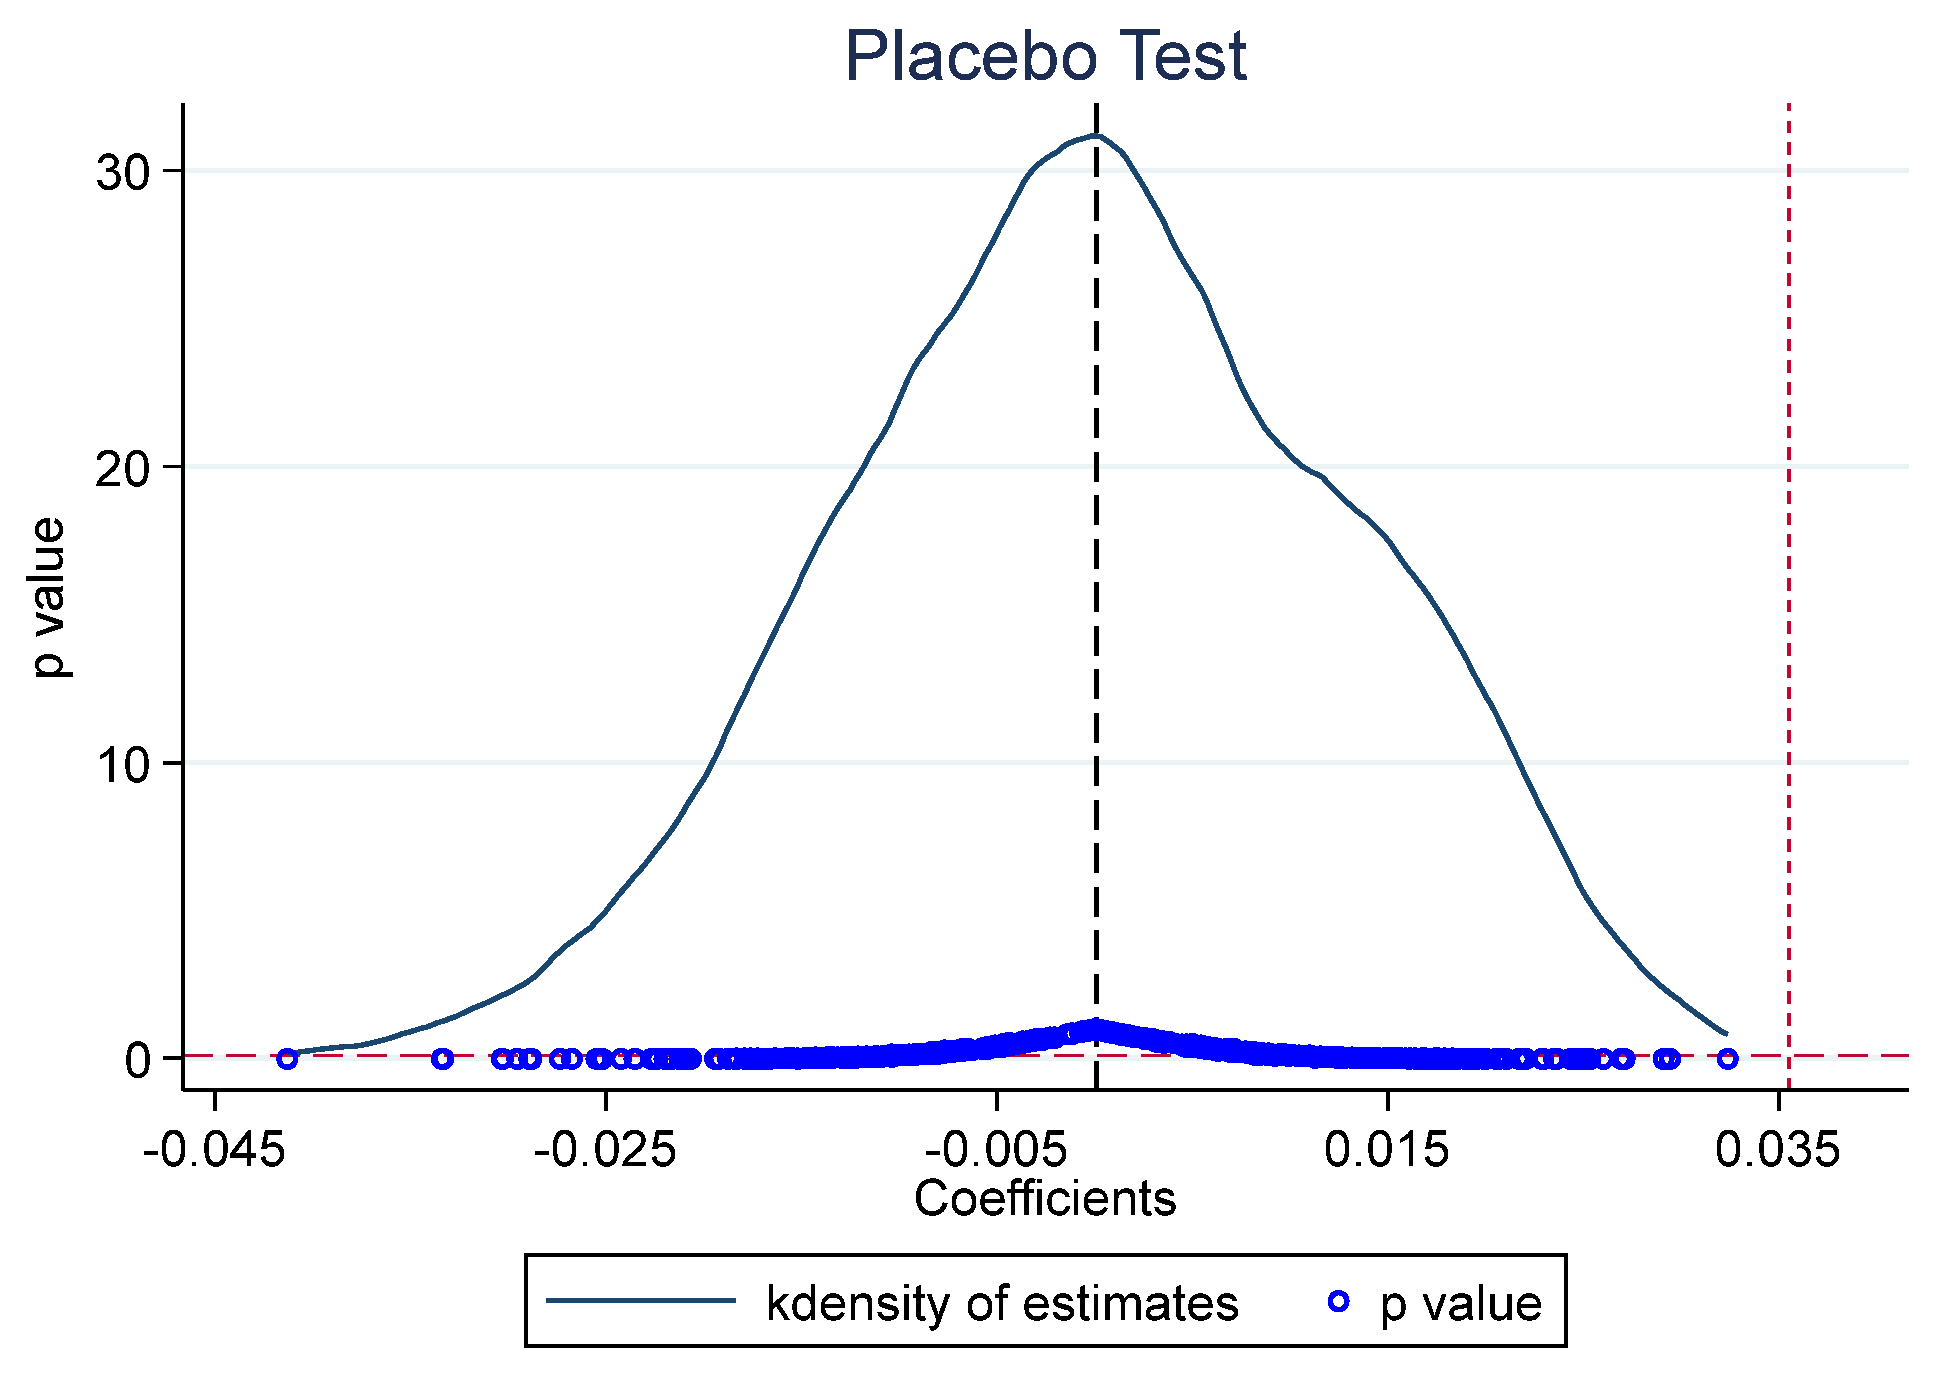
Figure 1 shows the results of the common trend test of the impact of regional integration construction on carbon emission performance. It can be concluded that in 2014, there was no significant difference in the coefficient of policy variables between each period and zero, indicating that there was no significant difference in carbon emission performance between cities in the Yangtze River Economic Belt and non-Yangtze River Economic Belt cities in 2014. In 2014 and later years, there was a significant difference in carbon emission performance between cities in the Yangtze River Economic Belt and non-Yangtze River Economic Belt cities, and the coefficient of policy variables in each period was significantly greater than 0, indicating that the regional integration construction of the Yangtze River Economic Belt had a significant positive impact on carbon emission performance.

4.2.2. Placebo Test

To further rule out the possibility of the effect of regional integration on carbon emission performance being influenced by other policies or random factors, this study drew on an existing study [42] and randomly selected the same number of cities as contained within the experimental group of the earlier research. A “virtual” policy variable was constructed according to the randomly generated time, and the baseline model was regressed 500 times for each city. The estimated coefficients of POLICY from the 500 regressions were plotted into a kernel density distribution (Figure 2). The mean of the simulated regression coefficients is 0.0000072, which is closer to zero compared than the regression coefficient of 0.0355 shown in column (3) of Table 3. This indicates that the baseline regression coefficient is larger than most of the simulated values and can be regarded as an extreme value. In other words, obtaining a baseline regression coefficient of 0.0355 is a high-probability event. Therefore, the effect of regional integration construction on carbon emission performance is not affected by other policies or random factors.

4.2.3. Other Robustness Analysis

This study conducted other robustness analyses by excluding other pilot policies, changing the regression model, and using the instrumental variable approach. Firstly, other pilot policies that may have affected carbon emission performance were excluded, such as civilized city, low-carbon city, smart city, energy-saving, and emission-reduction fiscal pilot policies. The regression results of the model are shown in column (1) of Table 4. Secondly, the regression model was changed. Unlike the traditional DID model, the PSM–DID model can reduce sample self-selection bias caused by urban heterogeneity. The regression results of the PSM–DID model are shown in column (2) of Table 4. Columns (1) and (2) show that regional integration construction still significantly promotes improvements in carbon emission performance.
Secondly, a two-stage instrumental variable approach was used to reconduct the model regression. On the one hand, natural geographical features are a key factor in determining the level of regional integration. Highly developed water systems can engender close connections between regions, satisfying the instrumental variable correlation assumption. On the other hand, carbon emission performance cannot affect the natural formation of river length and river density in the region, satisfying the instrumental variable exogeneity assumption. Since the river length and density of the Yangtze River are variables that do not change over time, this study constructs two instrumental variables for regional integration construction: the interaction term between river length and time dummy variables, and the interaction term between river density and time dummy variables. The model regression results are presented in columns (3) and (4) of Table 4. It can be concluded that both river length and river density as instrumental variables do not have a weak instrumental variable problem. At the same time, the regression coefficient of POLICY is still significantly positive, indicating that regional integration construction still significantly promotes improvements in carbon emission performance.
Finally, compared to prefecture-level cities in China, sub-provincial cities and municipalities directly under the central government have advantages in terms of administrative level, which may have an impact on the above conclusions. Therefore, this research excluded this part of the data from the sensitivity analysis. The regression results of the model excluding some samples are shown in column (6) of Table 4. It can be concluded that the regression coefficient of POLICY is still significantly positive.

4.3. Action Mechanisms Analysis

Table 5 shows the test results of the transmission mechanism of regional integration construction on carbon emission performance. From column (1) of Table 5, it can be seen that regional integration construction significantly promoted the allocation of resource elements and that, in turn, resource element allocation significantly improved carbon emission performance. After adding resource factor allocation variables, the promotion coefficient of regional integration construction on carbon emission performance decreased from 0.0355 in column (3) of Table 3 to 0.0244 and was significant at the 1% level.
According to column (2) of Table 5, regional integration construction promoted improvements in carbon emission performance by generating economies of scale. After adding economy-of-scale variables, the promotion coefficient of regional integration construction on carbon emission performance decreased from 0.0355 in column (3) of Table 4 to 0.0132 and was significant at the 5% level.
Column (3) of Table 5 shows that regional integration construction promoted improvements in carbon emission performance by enhancing green innovation. After adding the green innovation variable, the promotion coefficient of regional integration construction on carbon emission performance decreased from 0.0355 in column (3) of Table 3 to 0.0304, being significant at the 1% level.
The results for the Sobel test of mediating effects, shown in Table 5, support the existence of these three transmission mechanisms. This indicates that regional integration construction can promote improvements in carbon emission performance through resource factor allocation, economies of scale, and green innovation, thereby verifying Hypothesis 1. After the implementation of the regional integration strategy, the allocation of factors within the Yangtze River Economic Belt was continuously optimized and the allocation efficiency significantly improved. By allocating production factors to clean and transitional industries, the cooperation between cities and enterprises in the industrial chain was significantly strengthened, creating conditions for regional low-carbon development. At the same time, by leveraging economies of scale, cities promoted carbon emission efficiency by saving on unit energy consumption, strengthening specialized division of labor, and disseminating the concept of green development. Hence, it is possible to promote green technology innovation and spillover, drive breakthroughs, and generate improvements in production and pollution control technologies related to energy conservation and emission reduction, thereby promoting common emission reduction among enterprises and guiding industrial structure adjustment towards low energy consumption and low emissions. Administrators can gradually achieve green upgrading within a region, injecting vitality into the process of improving carbon emission performance.

4.4. Heterogeneity Analysis

The provinces and cities in the Yangtze River Economic Belt show significant differences in economic development, geographic location, and other regards. In order to explore the heterogeneity of the impact of regional integration on carbon emission performance in the Yangtze River Economic Belt, this study groups together the samples based on the levels of carbon emission performance, urban location characteristics, and natural resource endowments, conducting in-depth discussions from these perspectives.

4.4.1. Heterogeneity in Carbon Emission Performance

Table 6 shows the regression results of the heterogeneity of carbon emission performance levels. It can be concluded that the estimated coefficients of regional integration construction exhibit significant structural differences at different quantiles. At the 25%, 50%, 75%, and 95% quantiles, the promotion coefficients of regional integration construction on carbon emission performance are 0.0362, 0.0486, 0.0637, and 0.0842, respectively. The reason for this is that high-level carbon emission performance cities are usually areas with high levels of green innovation and reasonable allocations of resource elements. Such conditions are conducive to the functioning of regional integration, emission reduction, and efficiency enhancement.

4.4.2. Urban Location Heterogeneity

Column (1) of Table 7 shows the results of the impact of regional integration construction on the carbon emission performance of cities in different river basins. It can be concluded that regional integration construction can better promote improvements in carbon emission performance levels in the middle- and downstream regions. The reason for this is that the economic development level of middle- and downstream cities is relatively high, with a relatively complete industrial chain and rich technological know-how facilitating the optimization and upgrading of industrial structure and technological innovation, improving resource utilization efficiency and ecological efficiency. Upstream cities have advantageous natural endowments, including water and solar resources, and production systems that rely on clean energy during the urban development process. However, in the process of promoting the integration strategy, upstream cities, as relatively backward development areas, participate to some degree in high-pollution and high value-added production links and industrial chains from middle- and downstream cities, while also providing important ecological support for middle- and downstream cities. The result is that there are not significant changes in carbon emission performance in the upstream region during the integration strategy promotion process. The conclusion of this research is also consistent with the research conclusion on the heterogeneity of carbon emission performance levels shown in Table 6.
Column (2) of Table 7 shows the results of the impact of regional integration construction on the carbon emission performance of different natural resource endowments. It can be concluded that compared to natural resource-based cities, regional integration construction can better promote improvements in carbon emission performance levels in non-natural-resource-based cities. The reason for this is that, compared to natural r-source-reliant cities, non-natural-resource-based cities usually depend on the development of other industries and service industries, resulting in their carbon emissions being relatively low. The promotion of regional integration has brought broader markets and cooperation opportunities to non-natural-resource-based cities, enabling them to develop green and high-tech industries and reduce the proportion of traditional high-carbon industries, thus improving carbon emission performance.
Column (3) of Table 7 shows the impact of regional integration construction on the carbon emission performance of cities along and outside the Yangtze River. It can be concluded that, compared to cities along the river, regional integration construction can better promote improvements in carbon emission performance in non-river cities. The reason for this is that cities along the river have higher levels of economic development and industrialization due to their long-term dependence on rivers as important transportation and economic power sources, but this is also accompanied by high carbon emissions. However, the promotion of regional integration provides more development opportunities and resource integration for non-riverside cities, enabling them to better transform, upgrade, and promote green development, while also reducing carbon emissions.

5. Conclusions, Policy Implications, and Limitations

5.1. Conclusions

Based on theoretical analysis, this article regarded the regional integration construction of the Yangtze River Economic Belt as a quasi-natural experiment and used the DID model to explore the impact of regional integration construction on carbon emission performance and the mechanisms behind this process. The results show that regional integration construction can significantly promote improvements in carbon emission performance, and the robustness analyses of parallel trend testing, placebo testing, the exclusion of other pilot policies, the replacement of regression models, and instrumental variable methods support this research conclusion. Regional integration construction primarily improves carbon emission performance through resource allocation, economies of scale, and green innovation. Compared to low-level carbon emission performance cities, upstream cities, natural resource-reliant cities, and riverside cities, regional integration construction can more strongly promote improvements in high carbon emission performance cities, middle- and downstream cities, non-natural-resource-based cities, and non-riverside cities.
The carbon emission performance in this study encompasses multifaceted dimensions, including carbon reduction, pollution abatement, green expansion, and growth, serving as pivotal indicators for low-carbon, high-quality development. Notably, prior research predominantly focused on the singular dimensions of regional integration, such as its socio-economic or environmental impacts, often overlooking the holistic effects of the Yangtze River Economic Belt’s regional integration construction. Moreover, while a plethora of studies employ the DID model to assess the environmental implications of regional integration, they frequently neglect the endogeneity concerns between regional integration and carbon emissions. To address this potential endogeneity bias, our study leverages river density and river length as instrumental variables for regional integration construction, thereby mitigating inherent model endogeneity. Utilizing the DID model, complemented by a series of robustness checks and endogeneity analyses, this study ensures the reliability and validity of its empirical findings. Furthermore, the theoretical elaboration and empirical validation of the three transmission mechanisms—resource allocation, economies of scale, and green innovation—offer profound insights into the intricate dynamics of how regional integration influences carbon emission performance.
The conclusion of this study may have the following practical impacts on the Yangtze River Economic Belt. Firstly, in the process of regional integration construction, we mentioned resource allocation and green innovation as key factors in improving carbon emission performance. This may lead to the government formulating policy documents that are conducive to cracking down on obstacles to factor flow and incentivizing enterprises to invest more in green technology and innovation. Secondly, the conclusion of this study may promote cooperation and exchange within the Yangtze River Economic Belt. For example, cities with a high-level carbon emission performance can share their successful experiences and best practices with other cities, helping the entire economic belt to achieve low-carbon development. Finally, the conclusion of this study indicates that the Yangtze River Economic Belt has potential and opportunities for low-carbon development, which may attract external investors and partners to participate in cooperation or investment in the region.
In addition, the conclusions of this study may have a profound impact on the policy making, resource allocation, technological innovation, and long-term planning of policy makers and relevant stakeholders in areas other than the Yangtze River Economic Belt. Firstly, the conclusion of this study provides a clear path for other regions to improve carbon emission performance by promoting regional integration. This may lead governments in other regions to place greater emphasis on the role of regional integration when formulating relevant policies. Secondly, the conclusion of this study emphasizes the key role of resource factor allocation and green innovation in improving carbon emission performance in regional integration construction. This may prompt decision makers in other regions to re-examine and adjust resource allocation strategies in regional integration construction, ensuring optimal utilization of resources within the region, and incentivizing governments and enterprises in other regions to increase investment in green technology and product research and development, thereby promoting low-carbon economic development. Finally, the conclusion of this study may prompt governments in other regions to pay more attention to the relationship between regional integration and carbon emission performance when formulating long-term plans, ensuring consistency between long-term plans and low-carbon development goals.

5.2. Policy Implications

Based on the above research conclusions, this study proposes the following policy recommendations:
(1)
The government should formulate policy measures to promote the rationalization and optimization of cross-regional resource allocation in the Yangtze River Economic Belt and improve resource utilization efficiency. For example, governments could consider establishing cross-regional resource-sharing mechanisms to promote the rational flow and allocation of resource elements and reduce unnecessary growth of carbon emissions. Authorities can also support and encourage enterprises to merge and restructure to form economies of scale and reduce carbon emissions per unit of output. By providing fiscal and tax incentives, enterprises can be encouraged to adopt clean energy and efficient energy technologies to further reduce carbon emissions. In addition, the government should increase support for green technology research and innovation in the Yangtze River Economic Belt and encourage enterprises to increase investment in clean production technology and low-carbon technology. Equally, establishing intellectual property protection systems, providing good environment and market mechanism for green innovation, stimulating the innovation vitality of enterprises, and promoting the widespread application and adoption of green technologies would all contribute to this objective.
(2)
The government should establish differentiated carbon emission reduction targets based on the status and potential differences in carbon emissions in different types of cities. For cities with a high-level carbon emission performance, middle- and downstream cities, non-natural resource-oriented cities, and non-riverside cities, more specific and challenging goals should be set, to provide motivation to reduce emissions. For cities with a low carbon emission performance, the government should increase support for green technology research and innovation, establish special funds, encourage enterprises and research institutions in cities with a high-level carbon emission performance to increase investment in green technology innovation and promote technological breakthroughs and applications, to achieve carbon emission reduction and efficiency improvement. For upstream cities, the government should strengthen the integration and rational allocation of resource elements, optimize resource allocation, reduce unnecessary growth of carbon emissions, encourage upstream cities to strengthen their environmental protection and ecological construction, improve ecological efficiency, and reduce carbon emissions by promoting cross-regional resource coordination and flow. For natural resource-based cities, the government should encourage industrial structural adjustment, transformations, and upgrades. There is a need to guide natural resource-based cities towards transforming themselves into green, high-tech, and service-industry-based economies and reducing the proportion of traditional high-carbon industries. The government should strengthen cooperation and exchange between cities along the Yangtze River and non-riverside cities, establish a coordination mechanism for carbon emission reduction policies in the Yangtze River Economic Belt, unify policy direction and standards, and promote regional cooperation for win–win results.

5.3. Limitations

Improving the carbon emission performance of enterprises is a fundamental aspect of economic low-carbon transformation. This study only examines the impact of regional integration construction in the Yangtze River Economic Belt on urban carbon emission performance at the urban level and the mechanisms behind this change. In the future, data from Chinese listed companies and industrial enterprises should be used to examine the impact of regional integration on corporate carbon emission performance and the mechanisms behind this. In addition, this research will continue, with investigations of the spatial spillover effect of regional integration construction in the Yangtze River Economic Belt on urban carbon emission performance.

Author Contributions

Conceptualization, K.A. and N.X.; methodology, N.X.; software, N.X.; validation, K.A. and N.X.; formal analysis, K.A.; investigation, K.A.; resources, K.A.; data curation, N.X.; writing—original draft preparation, K.A. and N.X.; visualization, K.A.; supervision, N.X.; project administration, K.A.; funding acquisition, N.X. All authors have read and agreed to the published version of the manuscript.

Funding

This research was funded by Philosophy and Social Science Project of Henan Province, grant number 2021CJJ149.

Institutional Review Board Statement

Not applicable.

Informed Consent Statement

Not applicable.

Data Availability Statement

The original data of the variables are sourced from the EPS data platform, and statistical yearbooks of various provinces and cities, as well as the “China Urban Statistical Yearbook” and “China Energy Statistical Yearbook”.

Acknowledgments

Thanks for the support from Henan Normal University.

Conflicts of Interest

The authors declare no conflict of interest.

References

  1. Zhang, D.; Lu, Y. Impact of market segmentation on energy efficiency. China Popul. Resour. Environ. 2017, 27, 65–72. [Google Scholar]
  2. Li, J.; Lin, B. Does energy and CO2 emissions performance of China benefit from regional integration? Energy Policy 2017, 101, 366–378. [Google Scholar] [CrossRef] [PubMed]
  3. You, S.; Chen, X. Regional integration degree and its effect on a city’s green growth in the Yangtze River Delta: Research based on a single-city regional integration index. Clean Technol. Environ. 2021, 23, 1837–1849. [Google Scholar] [CrossRef]
  4. Sun, J.W. The decrease of CO2 emission intensity is decarbonization at national and global levels. Energy Policy 2005, 33, 975–978. [Google Scholar] [CrossRef]
  5. Sun, C.; Li, Z.; Ma, T.; He, R. Carbon efficiency and international specialization position: Evidence from global value chain position index of manufacture. Energy Policy 2019, 128, 235–242. [Google Scholar] [CrossRef]
  6. Kaya, Y.; Yokobori, K. Global Environment, Energy, and Economic Development. Presented at the United Nations University, Tokyo, Japan, 25–27 October 1993.
  7. Wang, X.; Wang, S.; Teng, Z. Research on spatial convergence of carbon productivity in Chinas service industry. China Popul. Resour. Environ. 2020, 30, 70–79. [Google Scholar]
  8. Yu, X.; Chen, H.; Li, Y. Impact of carbon emission trading mechanism on carbon performance based on synthetic control method. China Popul. Resour. Environ. 2021, 31, 51–61. [Google Scholar]
  9. Wang, Y.; Zhao, T.; Wang, J.; Guo, F.; Kan, X.; Yuan, R. Spatial analysis on carbon emission abatement capacity at provincial level in China from 1997 to 2014: An empirical study based on SDM model. Atmos. Pollut. Res. 2019, 10, 97–104. [Google Scholar] [CrossRef]
  10. Guo, X.; Wang, X.; Wu, X.; Chen, X.; Li, Y. Carbon Emission Efficiency and Low-Carbon Optimization in Shanxi Province under “Dual Carbon” Background. Energies 2022, 15, 2369. [Google Scholar] [CrossRef]
  11. Yan, D.; Sun, W.; Li, P.; Wang, Y. The effects of integration regional enlargement on urban innovation developments in the Yangtze River Delta. Geogr. Res. 2022, 41, 2568–2586. [Google Scholar]
  12. Feng, Y.; Lee, C.C.; Peng, D.Y. Does regional integration improve economic resilience? Evidence from urban agglomerations in China. Sustain. Cities Soc. 2023, 88, 104273. [Google Scholar] [CrossRef]
  13. Krugman, P.; Venables, A.J. Globalization and the Inequality of Nations. Q. J. Econ. 1995, 110, 857–880. [Google Scholar] [CrossRef]
  14. Chen, D.; Lu, X.; Zhang, C.; Zhang, X. Research on the Impact Mechanism of Regional Integration on Urban Land Green Use Efficiency from a Multidimensional Perspective. Econ. Manag. Res. 2021, 42, 96–110. [Google Scholar]
  15. Qian, H. Yangtze River Delta regional economic integration measurement. Res. Financ. Trade 2010, 21, 24–31. [Google Scholar]
  16. Li, W.; Yang, S.; Wu, Y. Study on the impact of regional market integration on carbon emission benefit: A spatial econometric analysis from the Yangtze River Delta region. Soft Sci. 2018, 32, 52–55. [Google Scholar]
  17. Zeng, G.; Wang, F. Evaluation and improvement strategy of urban integration development capability in Yangtze River Delta region. Reform 2018, 12, 103–111. [Google Scholar]
  18. Wen, L.; Chatalova, L.; Gao, X.; Zhang, A. Reduction of carbon emissions through resource-saving and environment-friendly regional economic integration: Evidence from Wuhan metropolitan area, China. Technol. Forecast. Soc. Chang. 2021, 166, 120590. [Google Scholar] [CrossRef]
  19. Hou, S.Y.; Song, L.R. Market Integration and Regional Green Total Factor Productivity: Evidence from China’s Province-Level Data. Sustainability 2021, 13, 472. [Google Scholar] [CrossRef]
  20. Zheng, K.; Deng, H.; Lyu, K.; Yang, S.; Cao, Y. Market Integration, Industrial Structure, and Carbon Emissions: Evidence from China. Energies 2022, 15, 9371. [Google Scholar] [CrossRef]
  21. Jian, Y.T.; Yang, Y.C.; Xu, J. The Impact and Mechanism of the Increased Integration of Urban Agglomerations on the Eco-Efficiency of Cities in the Region—Taking the Chengdu–Chongqing Urban Agglomeration in China as an Example. Land 2023, 12, 684. [Google Scholar] [CrossRef]
  22. Gao, X.; Zhang, A.L.; Sun, Z.L. How regional economic integration influence on urban land use efficiency? A case study of Wuhan metropolitan area, China. Land Use Policy 2020, 90, 104329. [Google Scholar] [CrossRef]
  23. Chen, X.; Huang, B. Club membership and transboundary pollution: Evidence from the European Union enlargement. Energy Econ. 2016, 53, 230–237. [Google Scholar] [CrossRef]
  24. Zhao, L.; Xu, L. Study on water pollution effects of regional integration based on the quasi-natural experiment of the enlargement in Yangtze River Delta. China Popul. Resour. Environ. 2019, 29, 50–61. [Google Scholar]
  25. Li, H.; Lu, J. Can regional integration control transboundary water pollution? A test from the Yangtze River economic belt. Environ. Sci. Pollut. Res. 2020, 27, 28288–28305. [Google Scholar] [CrossRef]
  26. Xiao, R.R.; Tan, G.R.; Huang, B.C.; Li, J.; Luo, Y.Y. Pathways to sustainable development: Regional integration and carbon emissions in China. Energy Rep. 2022, 8, 5137–5145. [Google Scholar] [CrossRef]
  27. Jiang, Z.Y.; Feng, Y.; Song, J.P.; Song, C.Z.; Zhao, X.D.; Zhang, C. Study on the Spatial–Temporal Pattern Evolution and Carbon Emission Reduction Effect of Industry–City Integration in the Yellow River Basin. Sustainability 2023, 15, 4805. [Google Scholar] [CrossRef]
  28. Yan, D.S.; Li, P.X. Can Regional Integration Reduce Urban Carbon Emission? An Empirical Study Based on the Yangtze River Delta, China. Int. J. Environ. Res. Public Health 2023, 20, 1395. [Google Scholar] [CrossRef] [PubMed]
  29. Guo, Y.; Cao, X.; Wei, W.; Zeng, G. The impact of regional integration in the Yangtze River Delta on urban carbon emissions. Geogr. Res. 2022, 41, 181–192. [Google Scholar]
  30. Shah, M.I.; AbdulKareem, H.K.K.; Ishola, B.D.; Abbas, S. The roles of energy, natural resources, agriculture and regional integration on CO2 emissions in selected countries of ASEAN: Does political constraint matter? Environ. Sci. Pollut. Res. 2023, 30, 26063–26077. [Google Scholar] [CrossRef]
  31. Nwani, C. Taking Venezuela back to the sustainability path: The role of financial development and economic integration in low-carbon transition. Nat. Resour. Forum 2021, 45, 37–62. [Google Scholar] [CrossRef]
  32. Yang, T.; Zhu, Y.; Zhang, Y. Whether regional integration can alleviate manufacturing overcapacity—A study based on the development strategy of the Yangtze River Economic Belt. Ind. Econ. Res. 2021, 6, 58–72. [Google Scholar]
  33. Zhao, L.; Li, F.; Wang, Q. Development Strategy of the Yangtze River Economic Belt and Employment: Promotion or Inhibition? A Difference-in-Differences Analysis Based on the Panel Data of Prefecture-level Cities. Resour. Environ. Yangtze Basin 2021, 30, 2569–2580. [Google Scholar]
  34. Ren, Y.; Lu, L.; Zhu, D. The Research Framework of Administrative Border under the Regional Coordinated Development Strategy. Econ. Geogr. 2019, 39, 29–36, 47. [Google Scholar]
  35. Liu, R. State-owned Enterprises, Hidden subsidies and market segmentation: Theoretical and empirical evidence. Manag. World 2012, 4, 21–32. [Google Scholar]
  36. Chen, H.; He, C.; Mao, X. A review of regional integration studies: Dimensions, linkages and boundaries. Trop. Geogr. 2018, 38, 1–12. [Google Scholar]
  37. Desmet, K.; Parente, S.L. Bigger is better: Market size, demand elasticity, and innovation. Int. Econ. Rev. 2010, 51, 319–333. [Google Scholar] [CrossRef]
  38. Zhang, Y. The impact of changes in economic development mode on China’s carbon emission intensity. Econ. Res. 2010, 45, 120–133. [Google Scholar]
  39. Ranis, G.; Fei, J.C. A theory of economic development. Am. Econ. Rev. 1961, 51, 533–565. [Google Scholar]
  40. Gao, L.; Zhu, S. Does urban agglomeration integration promote innovation?—Empirical evidence from the Yangtze River Delta city cluster. East China Econ. Manag. 2018, 32, 66–71. [Google Scholar]
  41. Tone, K.; Tsutsui, M. An epsilon-based measure of efficiency in DEA—A third pole of technical efficiency. Eur. J. Oper. Res. 2010, 207, 1554–1563. [Google Scholar] [CrossRef]
  42. Xu, N.; Zhang, H.; Li, T.X.; Ling, X.; Shen, Q. How Big Data Affect Urban Low-Carbon Transformation—A Quasi-Natural Experiment from China. Int. J. Environ. Res. Public Health 2022, 19, 16351. [Google Scholar] [CrossRef] [PubMed]
  43. Li, L.; Li, M.; Ma, S.; Zheng, Y.; Pan, C. Does the construction of innovative cities promote urban green innovation? J. Environ. Manag. 2022, 318, 115605. [Google Scholar] [CrossRef] [PubMed]
  44. Xu, N.; Zhao, D.; Zhang, W.; Zhang, H.; Chen, W.; Ji, M.; Liu, M. Innovation-Driven Development and Urban Land Low-Carbon Use Efficiency: A Policy Assessment from China. Land 2022, 11, 1634. [Google Scholar] [CrossRef]
  45. Wen, S.; Jia, Z.; Chen, X. Can low-carbon city pilot policies significantly improve carbon emission efficiency? Empirical evidence from China. J. Clean. Prod. 2022, 346, 131131. [Google Scholar] [CrossRef]
Figure 1. The parallel trend test of the Yangtze River Economic Belt integration strategy. Note: The x axis represents the year, and the y axis represents the estimated coefficients of policy.
Sustainability 15 15154 g001
Figure 2. Placebo test.
Sustainability 15 15154 g002
Table 1. Index system for carbon emission performance.
IndicatorsVariablesDescription of Variables
Input indicatorLand inputUrban construction land area (unit: km2)
Labor inputUrban employment at the end of the year (unit: ten thousand)
Capital inputUrban capital stock (unit: CNY 10,000)
Energy inputTotal consumption of three types of energy (unit: 10,000 metric tons of standard coal)
Expected output indicatorEconomic benefit outputUrban GDP (unit: CNY 10,000)
Ecological benefit outputThe green coverage rate of urban built-up area (%)
Social benefit outputThe average salary of urban employees (yuan)
Unexpected output indicatorCarbon emissionsCarbon emissions from natural gas consumption in urban society (10,000 tons)
Carbon emissions from liquefied petroleum gas consumption in urban areas (10,000 tons)
Carbon emissions from electricity consumption in urban areas (10,000 tons)
Carbon emissions from heat energy consumption in urban areas (10,000 tons)
Pollutant emissionsTotal industrial wastewater discharge in urban areas (10,000 tons)
Total industrial SO2 emissions in urban areas (10,000 tons)
Total industrial dust and smoke emissions in urban areas (10,000 tons)
Table 2. Statistical description of variables.
VariablesMeanSDMinMax
Variable LabelAttribute of VariableExplanation of Variables
Dependent variableCarbon emission performance (CEP)See dependent variable in Section 3.2.10.6500.18001.200
Core independent variablePolicy on regional integration construction of the Yangtze River Economic Belt (POLICY)See core independent variable in Section 3.2.20.1600.37001.000
Mediator variableResource factor allocation (AE)Urban total factor productivity1.7100.8000.18017.460
Economies of scale (SCALE)Non-agricultural added value per unit of administrative land area6.7901.4001.97011.810
Green innovation (INNOV)Green invention patent applications per 10,000 people0.5101.460026.820
Control variableTemperature variation (TV)Average daily temperature of cities14.6005.100−1.09025.680
Transport infrastructure (INFRA)Per capita road area in cities4.5205.890073.040
Environmental regulation (ER)Integrated index based on three indicators: the removal rate of sulfur dioxide, the removal rate of industrial smoke (dust), and the comprehensive utilization rate of industrial solid waste, employing the entropy method0.6100.2000.0600.990
Openness to foreign investment (OPEN)The proportion of foreign direct investment (FDI) in GDP1.9001.980015.320
Industrial agglomeration (AGG)The locational entropy of manufacturing employees0.8600.4800.0203.050
Industrial structure (INDUSTR)The proportion of the secondary industry’s added value in GDP47.79010.87010.68090.970
Government intervention (GOV)The proportion of government expenditure excluding science and education0.8000.0400.6100.980
Population density (POP)The population per administrative region5.7400.9101.6107.880
Energy utilization efficiencyThe total energy consumption per unit GDP22.1119.820.070244.500
Human capital (HUMAN)The number of undergraduate students per 10,000 population8.56015.5100.020105.700
Table 3. Benchmark inspection results.
Variables(1)(2)(3)
POLICY0.1067 ***0.0503 ***0.0355 ***
(19.268)(10.044)(6.101)
ControlsYESYESYES
_cons0.6357 ***−1.0121 ***−0.3921
(343.942)(−3.930)(−1.550)
City fixed effectNOYESYES
Time fixed effectNONOYES
N396239623962
R20.66010.75700.7962
Adj-R20.63390.73750.7792
F371.2635148.007361.9743
Note: The regression coefficients in parentheses represent t values, while *** represents significant values at the 1% level.
Table 4. Other robustness test results.
Variables(1)(2)(3)(4)(5)
Excluding Other Policy EffectsPSM–DIDIV-2SLS
(River Length)
IV-2SLS
(River Density)
Sensitivity Analysis
POLICY0.0234 **0.0283 ***0.1856 ***0.0666 **0.0344 ***
(2.298)(4.830)(8.424)(2.245)(5.351)
ControlsYESYESYESYES
City fixed effectYESYESYESYES
Year fixed effectYESYESYESYES
Constant0.5761−0.4874 **--0.0204
(1.405)(−2.037)--(0.076)
Kleibergen–Paap rk
LM statistic
--316.086149.914
--[0.000][0.000]
Kleibergen–Paap rk
Wald F statistic
--26.34711.905
--{11.520}{11.520}
N14563794394839483472
R20.78470.80880.36040.45020.7836
Adj-R20.76420.79230.36040.45020.7653
F17.237493.3286109.46124.1363.6645
Note: The regression coefficients in the () represent t values, while ** and *** represent significant values at the 5%, and 1% levels, respectively. The values in the [ ] are p values, and the values in the { } are critical values of the Stock–Yogo weak identification test at the 10% level.
Table 5. Transmission mechanism tests.
Variable(1)(2)(3)
Resource AllocationEconomies of ScaleGreen Innovation
Policy0.1395 ***0.0244 ***0.1353 ***0.0132 **0.2662 ***0.0304 ***
(4.260)(4.348)(17.848)(2.105)(4.247)(5.260)
Resource allocation 0.0799 ***
(2.864)
Economies of scale 0.1652 ***
(8.868)
Green innovation 0.0193 ***
(7.687)
ControlsYESYESYESYESYESYES
_cons−3.3503 **−0.12430.0625−0.4024−22.9528 ***0.0505
(−2.372)(−0.524)(0.149)(−1.550)(−3.500)(0.197)
N396239623962396239623962
R20.72300.83230.99460.80530.72870.8030
Adj-R20.69980.81830.99420.78900.70600.7865
F31.844074.7842250.278474.399425.752966.2506
Sobel test4.37210.5104.331
[0.0000][0.0000][0.0000]
Note: The number in parentheses is the t value; ** and *** indicate significance at the 5% and 1% levels, respectively. The values in the [ ] are p values.
Table 6. Heterogeneity in carbon emission performance levels.
Variable25%50%75%95%
POLICY0.0362 ***0.0486 ***0.0637 ***0.0842 ***
(5.730)(9.414)(8.266)(6.077)
ControlsYESYESYESYES
City fixed effectYESYESYESYES
Time fixed effectYESYESYESYES
N3962396239623962
Note: The number in parentheses is the t value; *** indicate significance at the 1% level.
Table 7. Test results of urban location heterogeneity.
Variable(1)(2)(3)(4)(5)(6)(7)
DownstreamMidstreamUpstreamNon-Natural-Resource-Dependent CitiesNatural Resource-Dependent CitiesAlong the Yangtze RiverNot along the Yangtze River
Policy0.0679 ***0.0264 ***−0.01160.0391 ***−0.00580.0272 ***0.0631 ***
(8.744)(3.478)(−1.154)(6.231)(−0.516)(3.967)(6.612)
ControlsYESYESYESYESYESYESYES
Constant−0.3894−0.2419−0.1377−0.2302−0.5329−0.3787−0.0764
(−1.462)(−0.801)(−0.444)(−0.865)(−1.193)(−1.260)(−0.271)
City fixed effectYESYESYESYESYESYESYES
Time fixed effectYESYESYESYESYESYESYES
N3024295428843962159635422870
R20.78610.79410.76150.76450.70630.75840.7621
Adj-R20.76770.77640.74100.74490.67900.73810.7416
F48.119741.870628.296537.80637.088630.888427.5685
Note: The number in parentheses is the t value; *** indicate significance at the 1%,level.
Disclaimer/Publisher’s Note: The statements, opinions and data contained in all publications are solely those of the individual author(s) and contributor(s) and not of MDPI and/or the editor(s). MDPI and/or the editor(s) disclaim responsibility for any injury to people or property resulting from any ideas, methods, instructions or products referred to in the content.

