Article

Study on the Suitable Ecological Groundwater Depth and the Suitable Well–Canal Combined Irrigation Ratio in the Weigan River Irrigation District

1
College of Water Conservancy & Architectural Engineering, Shihezi University, Shihezi 832000, China
2
China Institute of Water Resources and Hydropower Research, Beijing 100038, China
3
School of Civil Engineering, Tianjin University, Tianjin 300072, China
*
Author to whom correspondence should be addressed.
These authors contributed equally to this work.
Sustainability 2023, 15(20), 15097; https://doi.org/10.3390/su152015097
Submission received: 13 September 2023 / Revised: 12 October 2023 / Accepted: 18 October 2023 / Published: 20 October 2023
(This article belongs to the Topic Low Carbon Economy and Sustainable Development)

Abstract

:
It is important to clarify the suitable ratio of well–canal combined irrigation and the suitable range for ecological groundwater depth for the ecological stability of the arid zone. The MODFLOW model was used to reconstruct long-term groundwater depth by analyzing the response relationship between vegetation cover and groundwater depth in the Weigan River irrigation district. The suitable range for ecological groundwater depth was obtained, and based on this range, the suitable well–canal combined irrigation ratio in the research area was further simulated. The results show the following: (1) The average annual depth of groundwater in 82.9% of the study area increased from 2012 to 2021, and the average annual depth of groundwater increased by 1.03 m in 2021 compared to 2012. The average depth of the groundwater in the upstream area increased the most, with an increase of 1.96 m. (2) The vegetation cover in the study area from 2012 to 2021 increased in general, with an increase of 0.0461 over the 10-year period, but it fluctuated between years. (3) The depth of the groundwater in the study area suitable for the growth of vegetation in the irrigation area ranged from 3 to 5 m, and the value of NDVI within this range concentrated near 0.564–0.731, which represents a good state of vegetation growth. (4) The ratio of combined well and canal irrigation in the study area from 2012 to 2014 surged from 0.13 in 2012 to 0.48 in 2014, and the irrational harvesting and replenishment relationship led to a rapid increase in the depth of buried groundwater. A suitable well–canal combined irrigation ratio of 0.396 in the study area was obtained. This study is beneficial for maintaining the sustainable development and utilization of water resources and ecological stability in the Weigan River irrigation district.

1. Introduction

The Weigan River, located in the Aksu Region of Xinjiang, China [1], is one of the important sources among the “Nine Sources and One Mainstream” in the Tarim River basin. The Weigan River basin has an irreplaceable ecological service function, and its ecological stability plays a key role in ensuring water resources for the natural and artificial ecosystems of the whole Tarim River basin [2]. Due to the natural climate characteristics of scarce rainfall and strong evaporation in this area, as well as massive water consumption, with the proportion of agricultural water historically accounting for more than 92%, the shortage of water resources in the Weigan River irrigation district has become increasingly serious [3]. To this end, the Weigan River irrigation district has actively responded to the call for water-saving measures, adopting the combined well–canal irrigation mode and implementing high-efficiency water-saving measures and water-saving irrigation on a large scale [4].
Well–canal combined irrigation refers to a water supply mode in which both well irrigation and canal irrigation are set up at the same time, and surface water and groundwater are jointly applied to agricultural irrigation [5,6]. In fact, it is a general term for “well and canal combination” and “canal and well combination” irrigation modes, which are distinguished according to which of the methods is the primary and the secondary irrigation form [7], and the combined irrigation ratio is determined based on the ratio of well and canal irrigation water [8,9] in agricultural irrigation. The combined application of groundwater and surface water irrigation modes is an effective way to improve water resource utilization efficiency, reduce ineffective diving evapotranspiration, and alleviate water shortages in irrigation areas [10,11]. However, unreasonable implementation will also create new problems and challenges. For example, when combining wells and canals within regions, groundwater recharge and drainage imbalance, groundwater overexploitation, and other problems will lead to a significant drop in the groundwater level and a series of ecological and environmental problems [12]. Therefore, the combination of well and channel irrigation must be carried out on the basis of ensuring the balance between exploitation and compensation of groundwater resources.
Currently, most studies mainly analyze the appropriate well–canal combination irrigation ratio from the perspective of maintaining the recharge and discharge balance of the groundwater system (LIU [8], YUE [13]), while some studies have further carried out research on the well–canal combination irrigation ratio in the context of soil salinity [11,14,15], the sustainability of water resource use [13,16,17,18], and the implementation conditions of the areas where wells and canals are combined [19].
There is an important relationship between groundwater depth and regional vegetation coverage [20,21]. As an important link to water circulation, vegetation can affect evapotranspiration, water infiltration, and other processes [22]. Various vegetation indices based on remote sensing technology can be used to analyze and evaluate the growth status of vegetation, plant community structure, and vegetation coverage rate and its change trend [23]. At present, there are more than 40 vegetation indices available for research, such as the normalized difference vegetation index (NDVI), enhanced vegetation index (EVI), and soil-adjusted vegetation index (SAVI) [24], among which the SAVI is more suitable for characterizing vegetation cover and subsurface changes on a small scale. The EVI has a relatively poor time-series stability due to its high sensitivity to light, which makes it prone to anomalies in long-time-series analyses. Meanwhile, the NDVI, the most commonly used vegetation index, has the disadvantage of being susceptible to the effects of atmospheric residual noise, which weakens its reliability [23,24,25,26,27,28,29,30,31]. Overall, the NDVI has better time-series stability than the EVI and is more suitable for extracting large-scale subsurface information than the SAVI. At the same time, the NDVI can be pre-processed to eliminate most of the data errors caused by the instrument calibration, solar angle, topography, cloud shading, and atmospheric conditions, thus enhancing its responsiveness to changes in vegetation cover. Many studies [32,33,34,35] have been conducted to analyze the linkage between vegetation growth and groundwater level dynamics based on the NDVI, providing support for determining the appropriate ecological groundwater depth [36,37]; however, comprehensive analyses of the coupled well–canal combined irrigation ratio, the vegetation growth index, and the groundwater depth are not common.
Groundwater is the last line of defense for the ecology of arid and semi-arid regions, and determining the appropriate range for groundwater depth is the foundation for maintaining ecological stability [38,39]. The appropriate groundwater depth range is closely related to the subsurface and hydrogeological conditions, and under large-scale conditions, numerical simulation is an effective tool to analyze the well–canal combined irrigation ratio, vegetation dynamics, and the mutual feedback relationship of groundwater depth coupling. At present, the commonly used groundwater numerical simulation software in China and abroad mainly includes MIKE SHE [40], MODFLOW, and FEFLOW [41], among which the MODFLOW model is most widely used.
In summary, this study takes the Weigan River irrigation district as the research area and uses the MODFLOW model to reconstruct the long-term changes in groundwater depth. On this basis, this study analyzes the response relationship between vegetation dynamics and groundwater depth based on the NDVI and determines the groundwater depth that is conducive to maintaining the ecological stability of the study area. Then, different scenarios of the well–canal combined irrigation ratio are set, and the MODFLOW model is used to study the well–canal combined irrigation regime to maintain the groundwater system at a reasonable groundwater depth, thus providing a scientific basis for the sustainable development of the study area. Relevant research can also provide useful references for the formulation of water-saving and ecological protection policies in other irrigation areas.

2. Materials and Methods

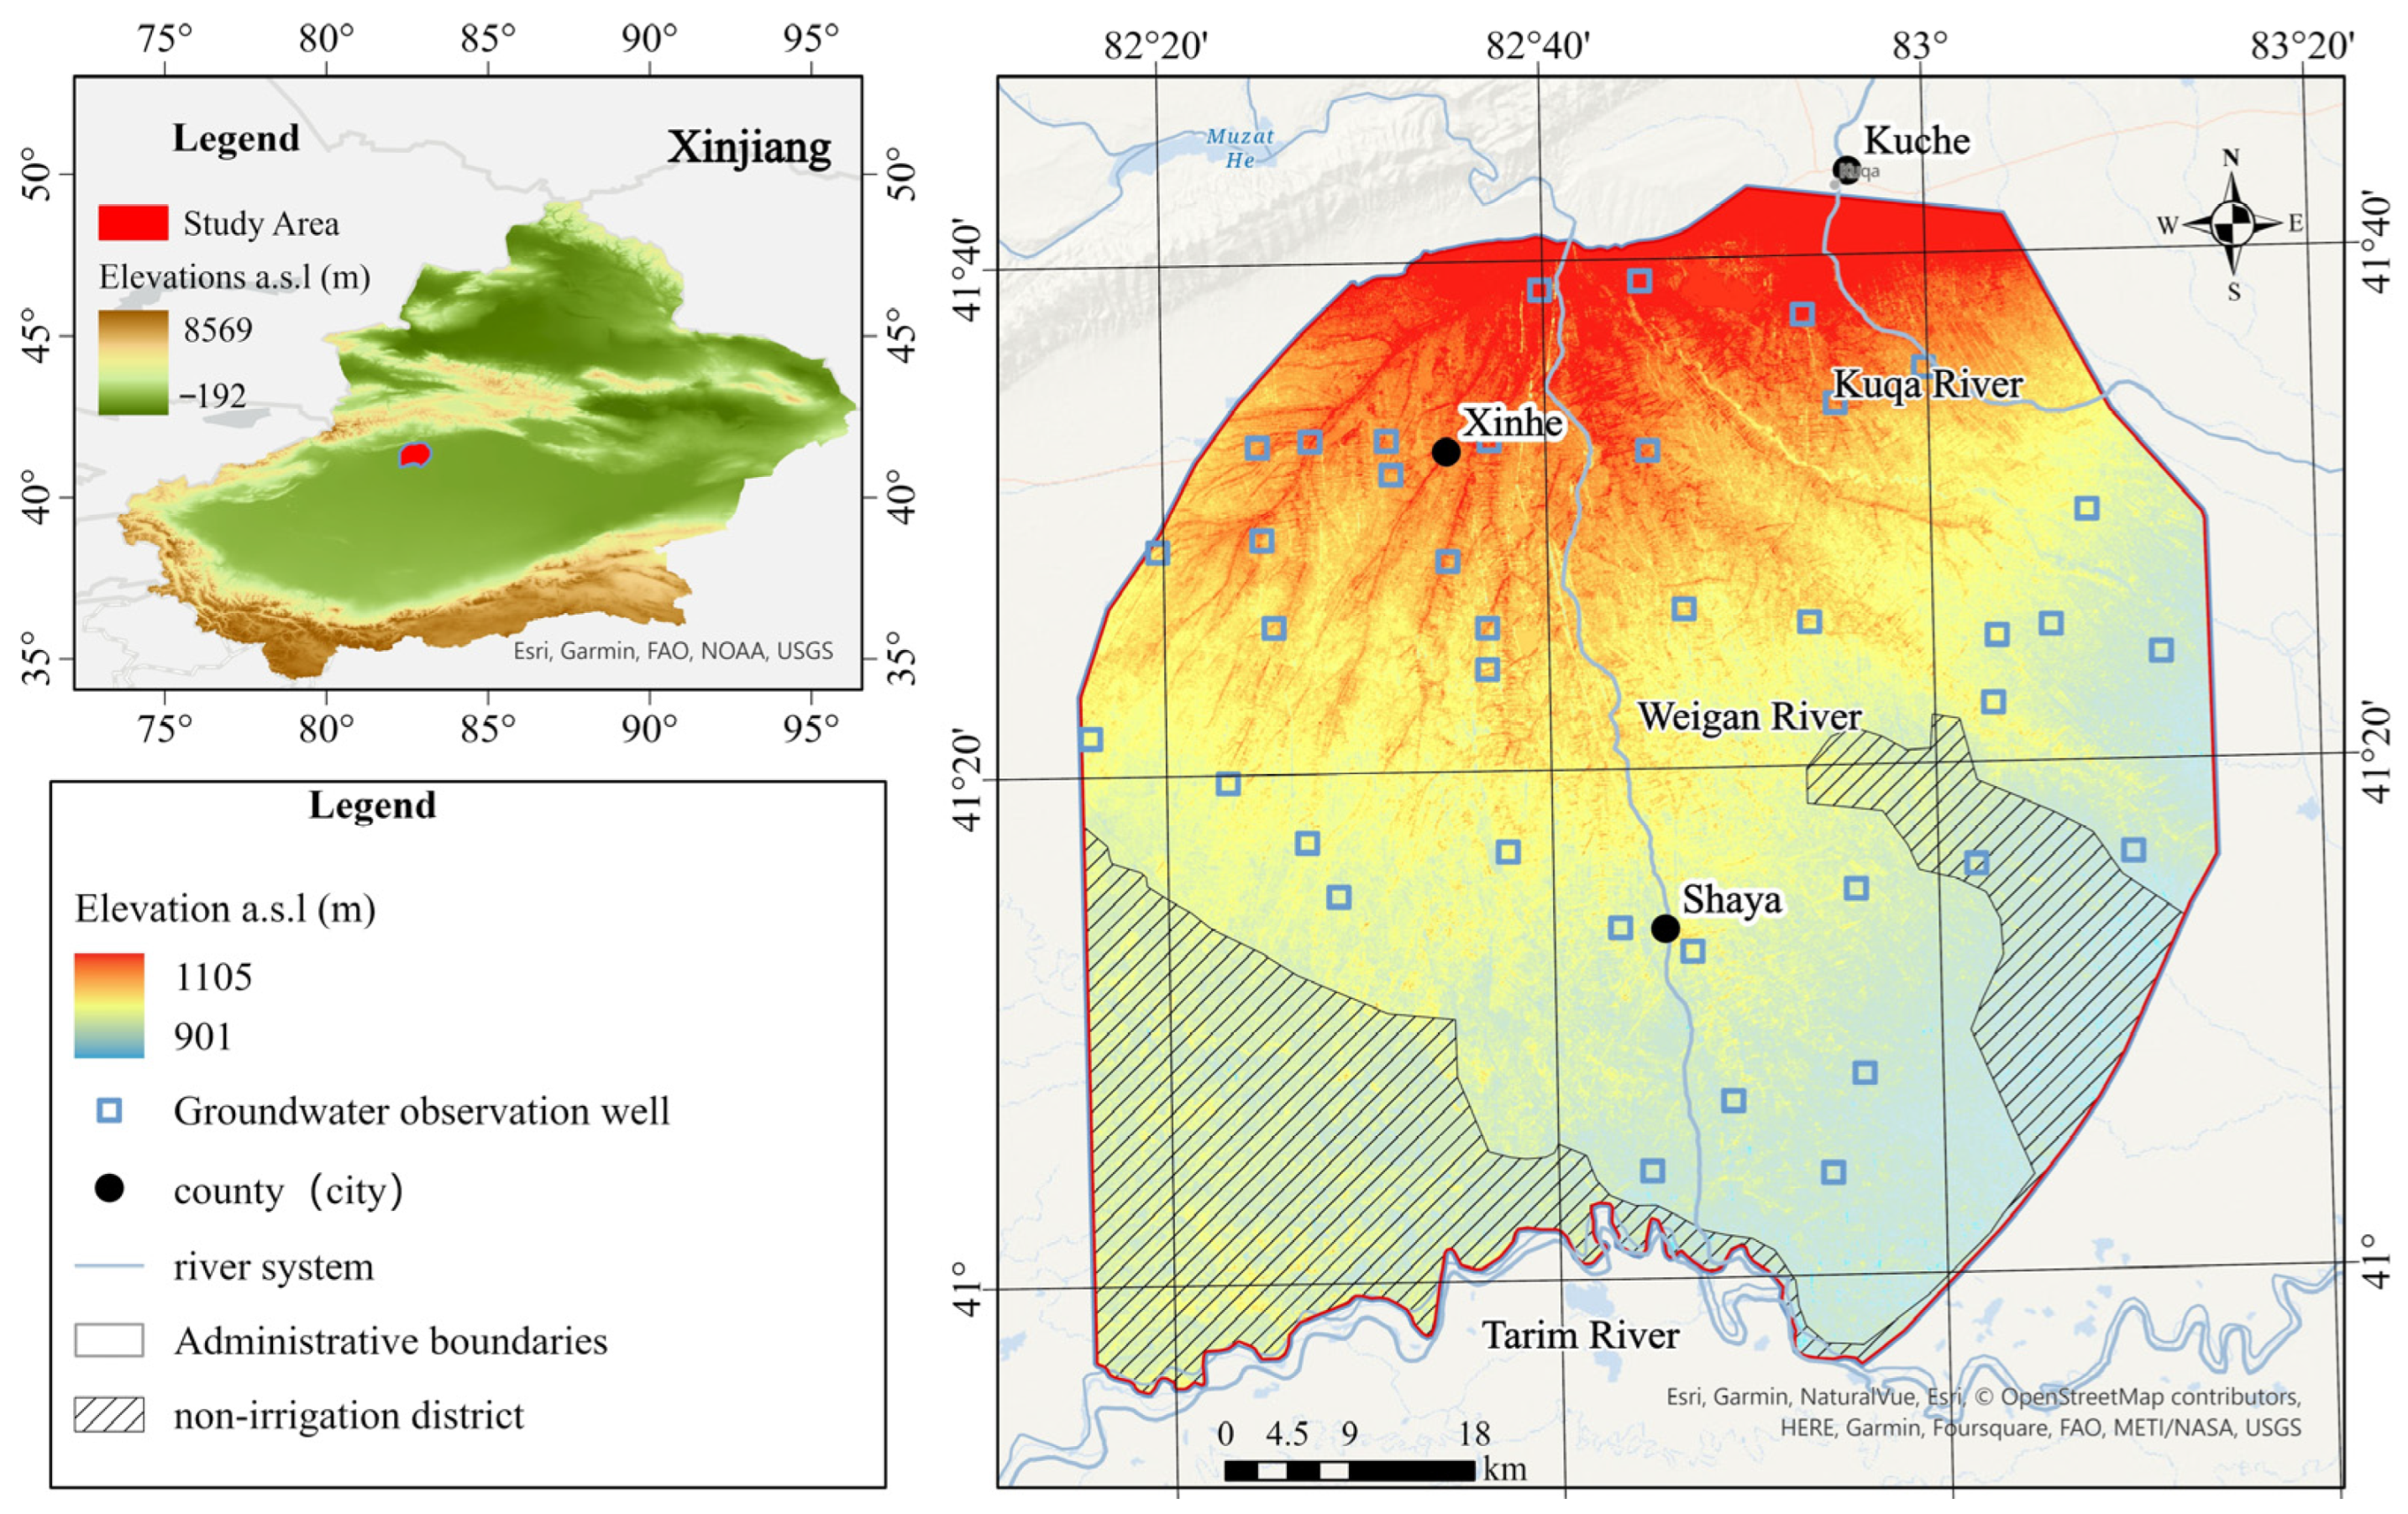
2.1. Overview of the Study Area

The Weigan River irrigation district (Figure 1) is located in the alluvial plain in the middle and lower reaches of the Weigan River Basin in Xinjiang. It is flat and is mainly distributed as a quaternary pore water-bearing system [1]. The aquifer groups are strata consisting of pebble gravel, sandy gravel, and single-structure driftstone, with an uncovered thickness in the range of 80–150 m, It is a strongly permeable stratum with very good permeability and water enrichment, categorized as the diving type. The particles in the formation gradually become finer from north to south, and the permeability coefficient gradually decreases. The Weigan River flows from the mountain pass, and the water flow direction inland of the irrigation area is consistent with the slope direction of the ground, both flowing from north to south. The average annual rainfall in the irrigation area is approximately 51.5 mm, and the distribution is uneven, mainly from June to September [3]. The average annual evaporation is 2123 mm, with strong evaporation and scarce rainfall, representing a typical arid continental climate [2]. The main crops in the irrigation area are cotton, wheat, and corn, and the natural vegetation mainly includes desert riparian forest vegetation such as Populus euphratica and willow [42]. Governing members of the irrigation district actively responded to the call for water-saving measures and vigorously promoted and implemented the well and canal combined irrigation mode. The irrigation water sources are mainly canal head diversions, groundwater, and rainfall, and the combined irrigation ratio in recent years has been maintained at approximately 0.5. According to the “Third Water Resources Survey and Evaluation Report of Xinjiang”, the average annual overexploitation of groundwater in the Weigan River–Kucha River basin from 2018 to 2021 was 290.4 million m3. The overexploitation of groundwater and the irrational system of combined irrigation with wells and canals have led to an increase in the depth of the groundwater year by year and even the emergence of landfall funnels in some areas.

2.2. Data Sources and Data Pre-Processing

2.2.1. DEM Data

The 90 m × 90 m DEM data used in this paper were downloaded from Geospatial Data Cloud (https://www.gscloud.cn/search, accessed on 19 September 2022), showing the study area’s highest elevation at 1105 m and lowest elevation at 901 m.

2.2.2. NDVI Data

The MODIS data used in this paper were the MOD13 vegetation index product released by NASA (https://earthdata.nasa.gov/, accessed on 23 April 2023), with a temporal resolution of 16 days and a spatial resolution of 500 m. Through the Google Earth Engine (GEE) platform, we pre-processed the NDVI changes in the Weigan River irrigation area and utilized ENVI 5.3 software for band synthesis, image enhancement, and geometric correction. After that, the annual and monthly mean NDVI data from 2012 to 2021 were finally obtained.

2.2.3. Aquifer Properties Data

In this paper, the data for the water supply degree and lithological characteristics of the aquifer were extracted from the “Survey and Evaluation Report of Planned Groundwater Resources in the Weigan River Basin of Aksu Region, Xinjiang” and the “Weigan River Basin Planning Main Hub Engineering Geological Survey Report”, while the data for the infiltration coefficient were extracted from the “Survey and Evaluation Report of Planned Groundwater Resources in the Weigan River Basin of Aksu Region, Xinjiang”. They were also based on measurements achieved through double-ring field experiments in the irrigation areas of Kuqa, Shaya, and Xinhe counties, which were validated by the data provided in the report.

2.2.4. Groundwater Depth and Water Resources Development and Utilization Data

The measured groundwater depth data in this paper were obtained from the Aksu Water Conservancy Bureau and the Weigan River Water Conservancy Bureau, and the time periods of the measured groundwater depth data were 2015–2016 and 2018–2021. For the groundwater depth data in 2012–2014 and 2017, this paper used the MODFOLW groundwater numerical model to simulate and reconstruct the data. The amount of water diversion and groundwater exploitation at the head of the canal was obtained from the Aksu Water Conservancy Bureau and the Weigan River Water Conservancy Bureau, within the period of 2012–2021. The exploitable amount of groundwater in Weigan River was obtained from the “Third Water Resources Survey in Xinjiang”. Irrigation quota data were extracted from the “Research Report on Water Resources Carrying Capacity and Comprehensive Regulation in Aksu Region under Changing Conditions” and the “Survey and Evaluation Report of Planned Groundwater Resources in the Weigan River Basin of Aksu Region, Xinjiang”.

2.2.5. Other Hydrometeorological and Subsurface Information Data

The precipitation and evapotranspiration data for the period from 2012 to 2021 were obtained from the Aksu Water Resources Bureau and the National Weather Service (http://data.cma.cn/, accessed on 23 April 2023). The division of upstream, middle, and downstream irrigation areas was determined by the Aksu Water Resources Bureau based on the distribution of groundwater monitoring wells. Monitoring wells 1–13 and their surrounding areas are upstream areas, monitoring wells 14–25 are their surrounding areas are midstream areas, and monitoring wells 25–38 and their surrounding areas are downstream areas.

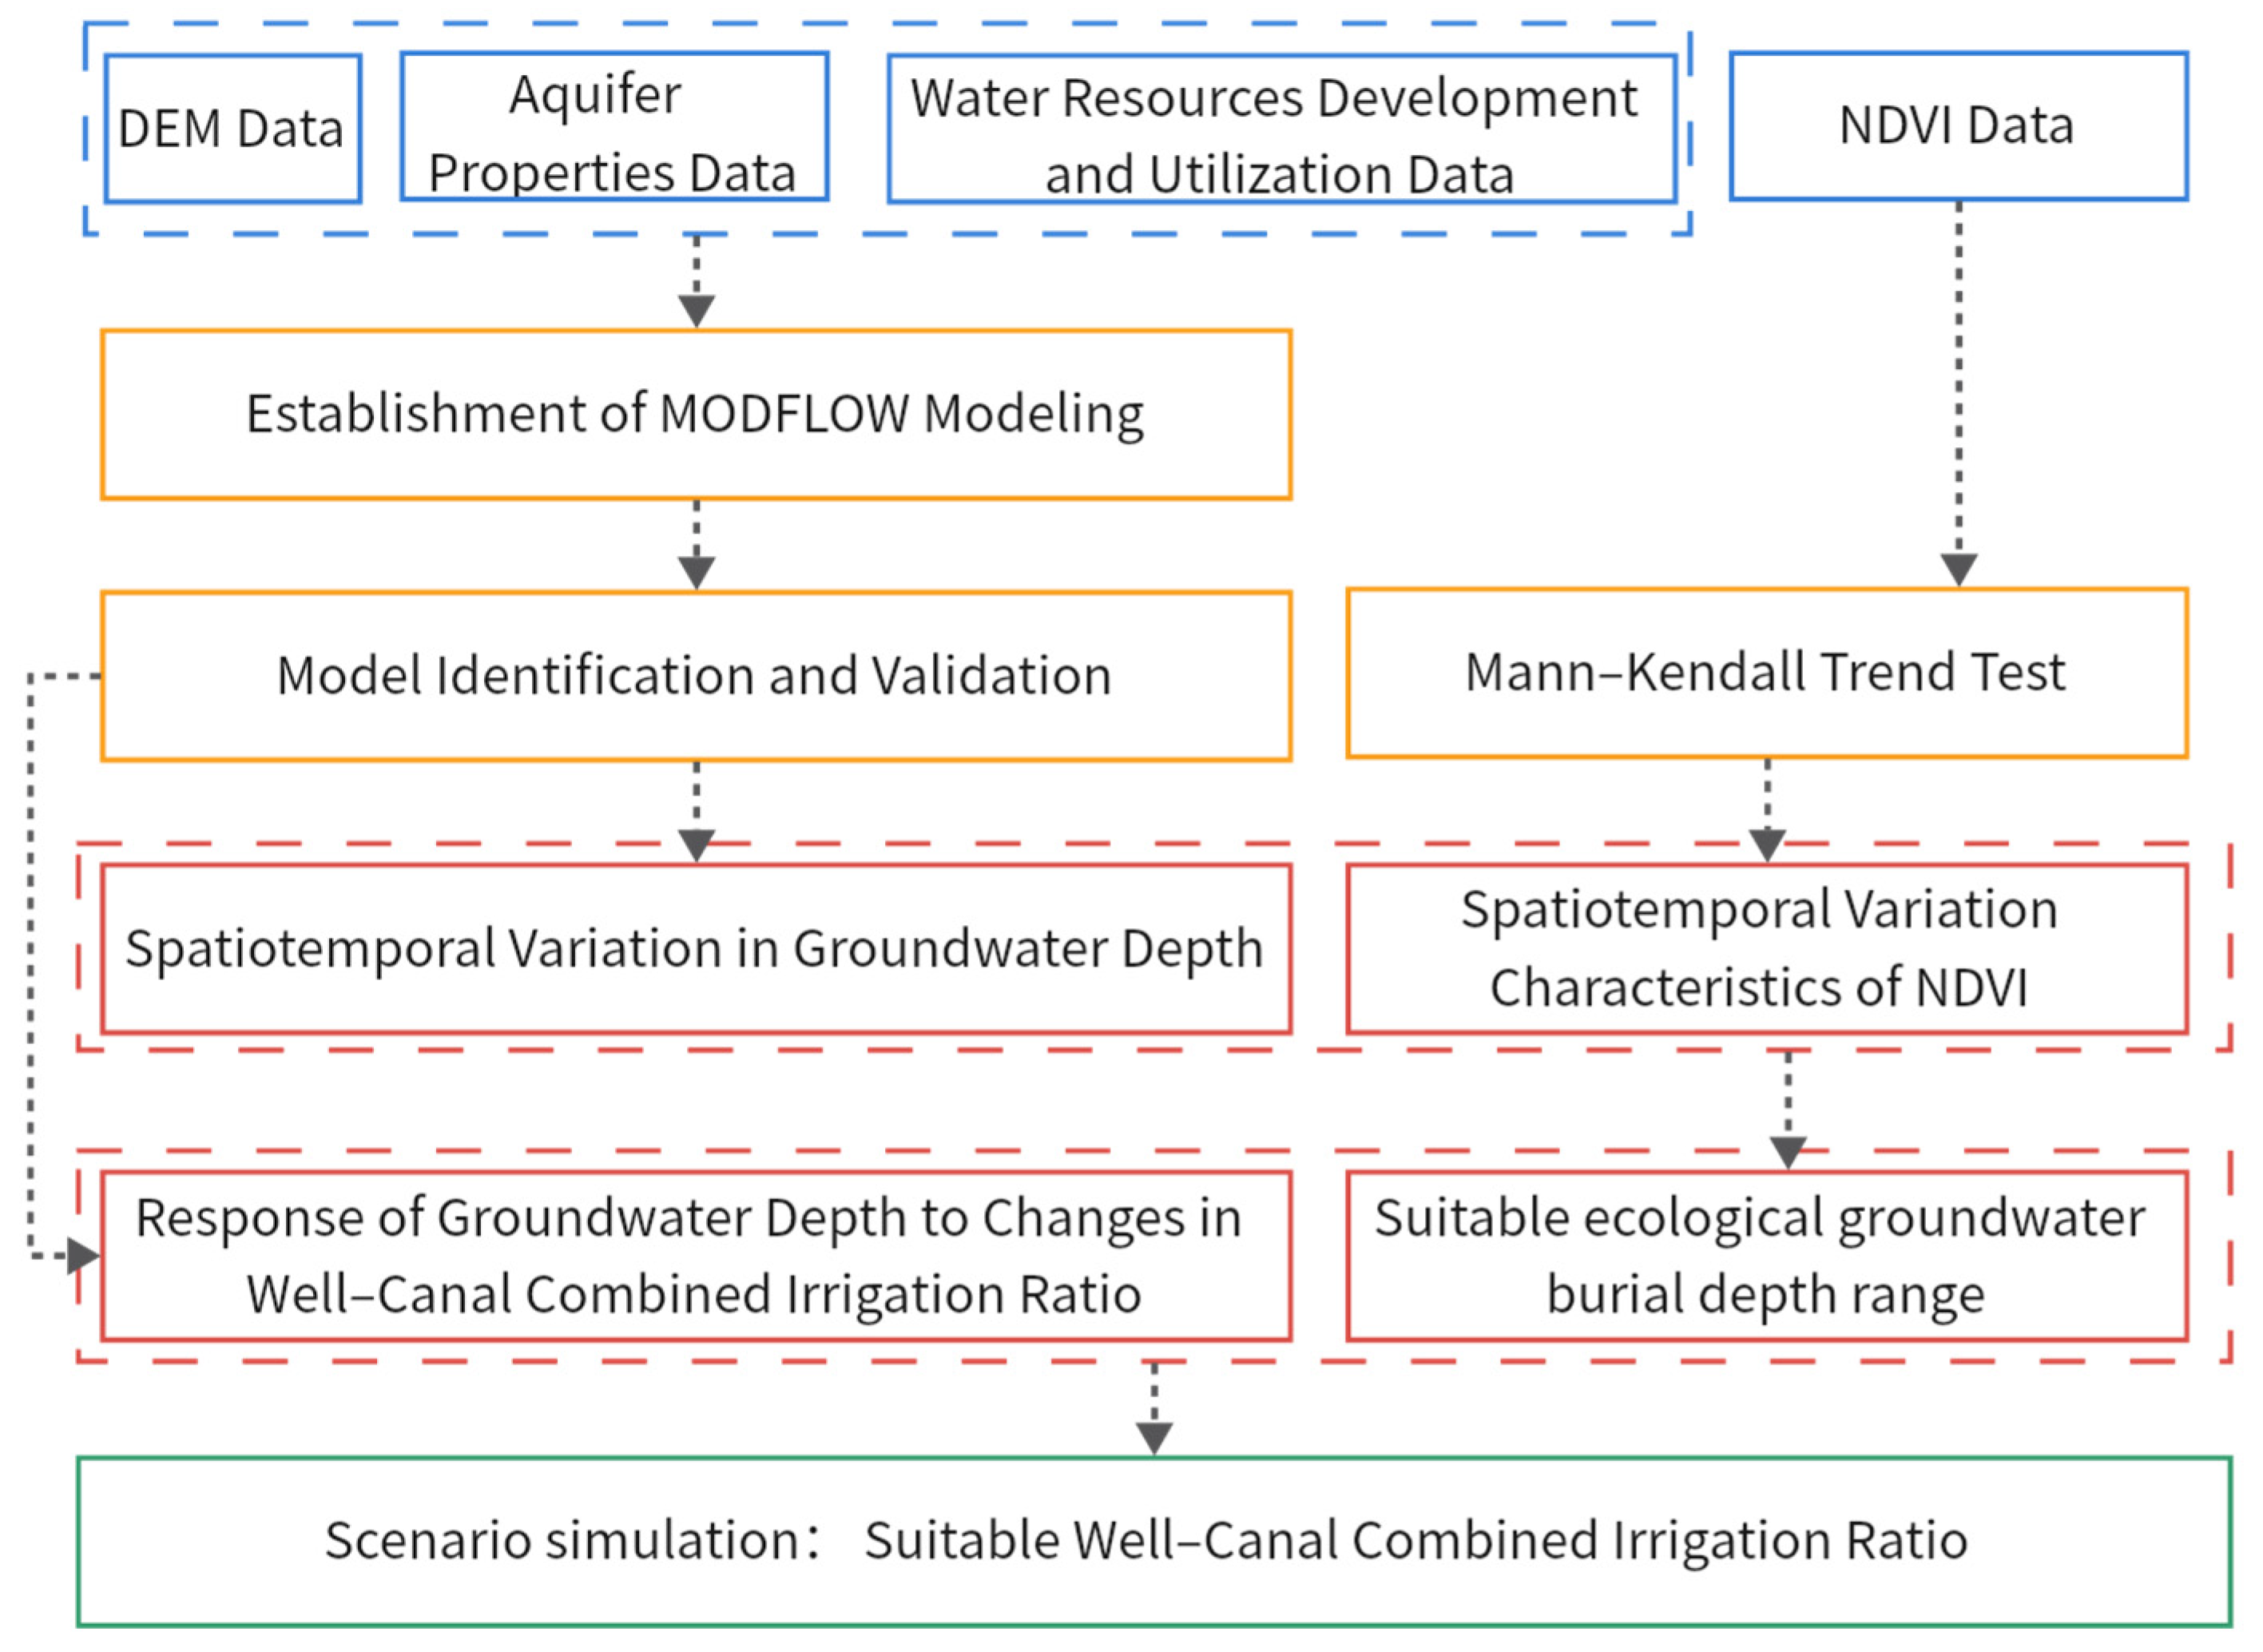
2.3. Research Methodology

The study process is specified below (Figure 2).

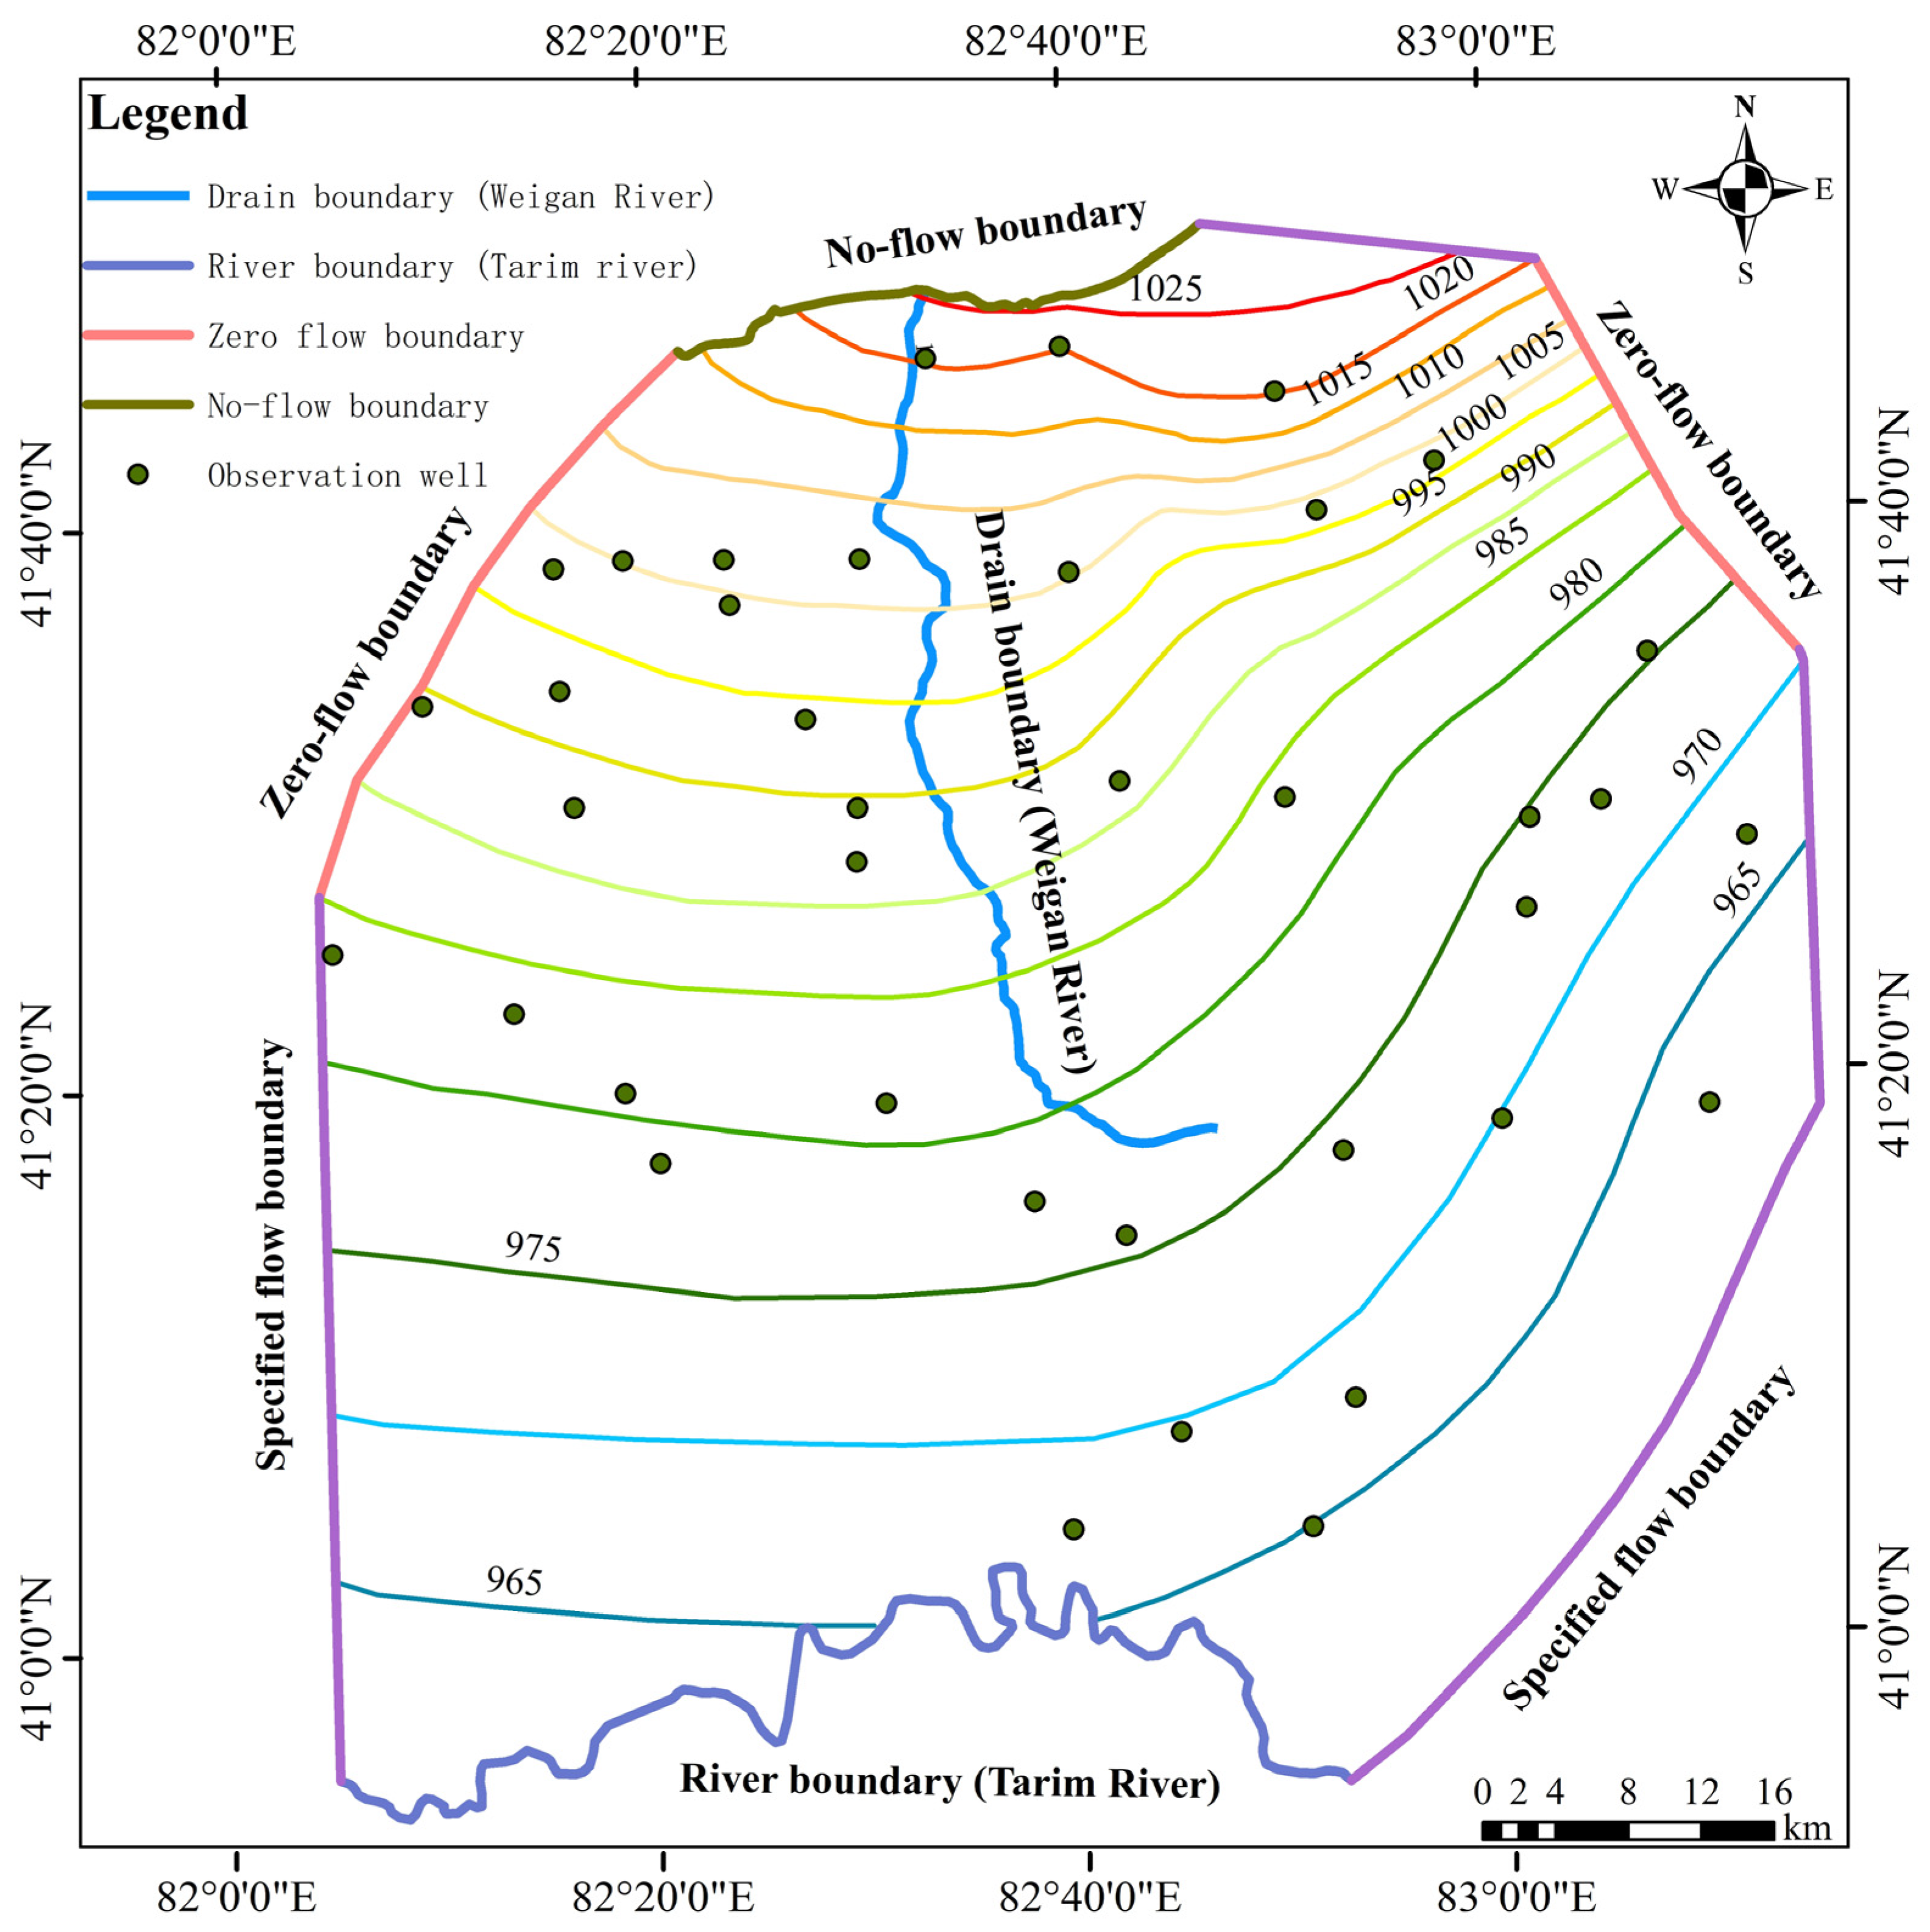
2.3.1. Establishment of MODFLOW Modeling

(1)
Spatial and Temporal Discrete Division
The data show that the average depth of groundwater in the Weigan River irrigation district from 2006 to 2012 was in the range of 3.01–3.84 m, and the depth of groundwater in 2012 was 4.52 m. The depth of groundwater increased significantly in 2012, meaning that the simulation cycle was selected to start in 2012 and end in 2021, which is the most recent year with available data. At the same time, we obtained continuous monthly monitoring data of groundwater depth from January 2018 to December 2019, which were conducive to model calibration. Therefore, the period from January 2018 to December 2019 was used as the calibration period for the model, and the period from January 2020 to December 2021 was used as the validation period for model identification and validation. According to the “Xinjiang Aksu Area Weigan River Basin Planning Groundwater Resources Investigation and Evaluation Report”, it can be seen that the exchange of water between deep groundwater and shallow groundwater in the study area is weak, and most of the groundwater exploitation in the study area involves only the submersible aquifer; therefore, the groundwater system in the irrigation area is a single submersible aquifer. A square grid dissection of 500 m×500 m was used in MODFLOW in the horizontal direction, and it was then vertically divided into one layer of aquifer. The model was dissected into 193 rows, 182 columns, and 1 layer, with a total of 22,850 effective differential computation cells. The study area was 5614.13 km2.
(2)
Source and sink terms; boundary delimitation
The submerged aquifer in the Weigan River irrigation district was modeled using the LPF package of MODFLOW and the convertible aquifer type. The upper boundary of the aquifer receives infiltration recharge from the precipitation and return water from irrigation, and the lateral boundary of the aquifer receives lateral runoff recharge. Groundwater is discharged via evapotranspiration, groundwater mining, and recharge to the river.
Precipitation infiltration recharge and irrigation return water infiltration recharge were simulated using the Recharge package of MODFLOW. Among them, the precipitation infiltration recharge coefficient was mainly related to the soil and land use type. Referring to “Groundwater Resources of Xinjiang”, the precipitation infiltration recharge coefficient of Xinjiang ranges from 0.08 to 0.32, and it was set to 0.25 after the debugging and rate determination of the model. Referring to “Groundwater Resources of Xinjiang”, the irrigation infiltration recharge coefficient of Xinjiang ranges from 0.12 to 0.31, and it was set to 0.28 after the debugging and rate determination of the model so that all groundwater irrigation water infiltration recharge in the study area was simulated through the MODFLOW Recharge package. After model debugging and rate setting, it was set at 0.28, so as to estimate the infiltration recharge of all groundwater irrigation water in the study area. The total statistical groundwater extraction was divided equally in each extraction well and simulated using the well package. Submerged evapotranspiration is mainly related to the evapotranspiration capacity and the depth of the groundwater, so the evapotranspiration was estimated using the month-by-month water surface evapotranspiration data measured at the hydrological stations and simulated using the Evapotranspiration package.
The study area is a relatively independent groundwater system, and it is bounded by the Cholertag Mountain in the north. This boundary is impermeable, so it can be regarded as a water-isolated boundary. In the south, the study area is bounded by the Tarim River, and the exchange of water between the Tarim River and the groundwater, which is manifested as the groundwater recharging to the Tarim River year-round, is generalized as a river boundary, which was simulated using the River package. The east, northeast, southeast, northwest, and southwest boundaries have no obvious demarcation lines, and are all artificially determined boundaries. Their flow lines are determined according to the collected groundwater isohydraulic headline map (Figure 3). The northeast and northwest boundaries are divided along the flow line, with no water flux exchange, and they are designated as zero-flux boundaries. The southeast, east, and southwest boundaries are generalized as flow boundaries.
(3)
Initial Conditions and Hydrogeologic Conditions
The groundwater flow field did not change significantly from 2006 to 2012, and the 2006 flow field was approximated as the 2012 flow field and set as the initial flow field driving the simulation. As seen in Figure 3, the flow direction of the groundwater flow field was derived from the initial flow field map as flowing from north to south. Combined with the hydrogeological data and double-loop field experiments, the permeability coefficient K of the aquifer was finally set to 1.2–3.1 after rate determination (Figure 4, Appendix A), and Kz was not set due to the division of a layer of aquifer in the vertical direction in the simulation and the assumption that the aquifer level in the study area is isotropic. Therefore, Kx = Ky = K for the same partition in the simulation. Furthermore, based on the collected data of the report, the range of values of the water-feeding degree was 0.1. According to the collected report data, the range of water supply degree is 0.1–0.18, and the value of water supply degree of each partition is determined through the rate determination (Table 1) so that the dynamic change in the groundwater level is closer to the actual situation.
The results of the zonal assignment of hydrogeological parameters in this model are shown in Figure 4 and Table 1.

2.3.2. Performance Evaluation Method of MODFLOW Model

In this study, three indices, namely the coefficient of determination (R2), root mean square error (RMSE), and mean absolute error (MAE), were selected to evaluate the accuracy and stability of the model, followed by a second validation of the model based on the water equilibrium method.
(1)
Model Performance Evaluation Index
R 2 = i = 1 N O i O ¯ S i S ¯ 2 i = 1 N O i O ¯ 2 i = 1 N S i S ¯ 2
R M S E = i = 1 N S i O i 2 N
N R M S E = i = 1 N S i O i 2 N O m a x O m i n
where S i and O i are the simulated and measured values of the time i, respectively, and S ¯ and O ¯ are the mean values of the simulated and observed values, respectively. O m a x and O m i n represent the maximum and minimum values of the observed values, respectively. N is the number of observations.
(2)
Water Balance Method
The water balance method is a method used to estimate the total “possible water inflow” by analyzing the relationship between the income and expenditure of water balance using a balance equation according to the basic principle of the dynamic balance of the groundwater in the exploitation area.
The Weigan River is located in the northwest arid area of China; the climate is dry and has little rain, which is a typical continental climate. The annual precipitation provides less recharge to groundwater, and there is more evaporation in the field. Therefore, the groundwater recharge factors in the experimental area mainly include lateral inflow, field infiltration recharge, and rainfall infiltration recharge. The excretion factors in the test area include plant lateral outflow, extraction, displacement, and diving evapotranspiration. Accordingly, the groundwater equilibrium equation is established as follows:
Q l i g + Q r c s + Q f i a + Q r i r Q l o + Q m q + Q d + Q d e = Q
where Qlig is the annual lateral inflow of groundwater, m3; Qrcs is the annual leakage recharge of the canal system, m3; Qfia is the annual irrigation field infiltration allowance, m3; Qrir is the annual rainfall infiltration recharge, m3; Qlo is the annual lateral outflow, m3; Qmq is the mined quantity, m3; Qd is the displacement, m3; and Qde is the diving evapotranspiration, m3.

2.3.3. Mann–Kendall Trend Test

The Mann–Kendall trend test (hereinafter referred to as the MK test) is widely used to examine the trends in hydrological or meteorological sequences.
S = k = 1 n 1   i = k + 1 n   sign x i x k
sign x i x k = + 1 , x i x k > 0 0 , x i x k = 0 1 , x i x k < 0
Z = S 1 Var S , S > 0 0 , S = 0 S + 1 Var S , S < 0
where the statistic Z is used to calculate the significance of the trend, with Z > 0 indicating a positive (increasing) trend in the series and Z < 0 indicating a negative (decreasing) trend. |Z| ≥ 1.96 and |Z| ≥ 2.58, respectively, indicate significance at the 95% and 99% confidence levels, and Var(S) is the variance of S.

3. Results and Analysis

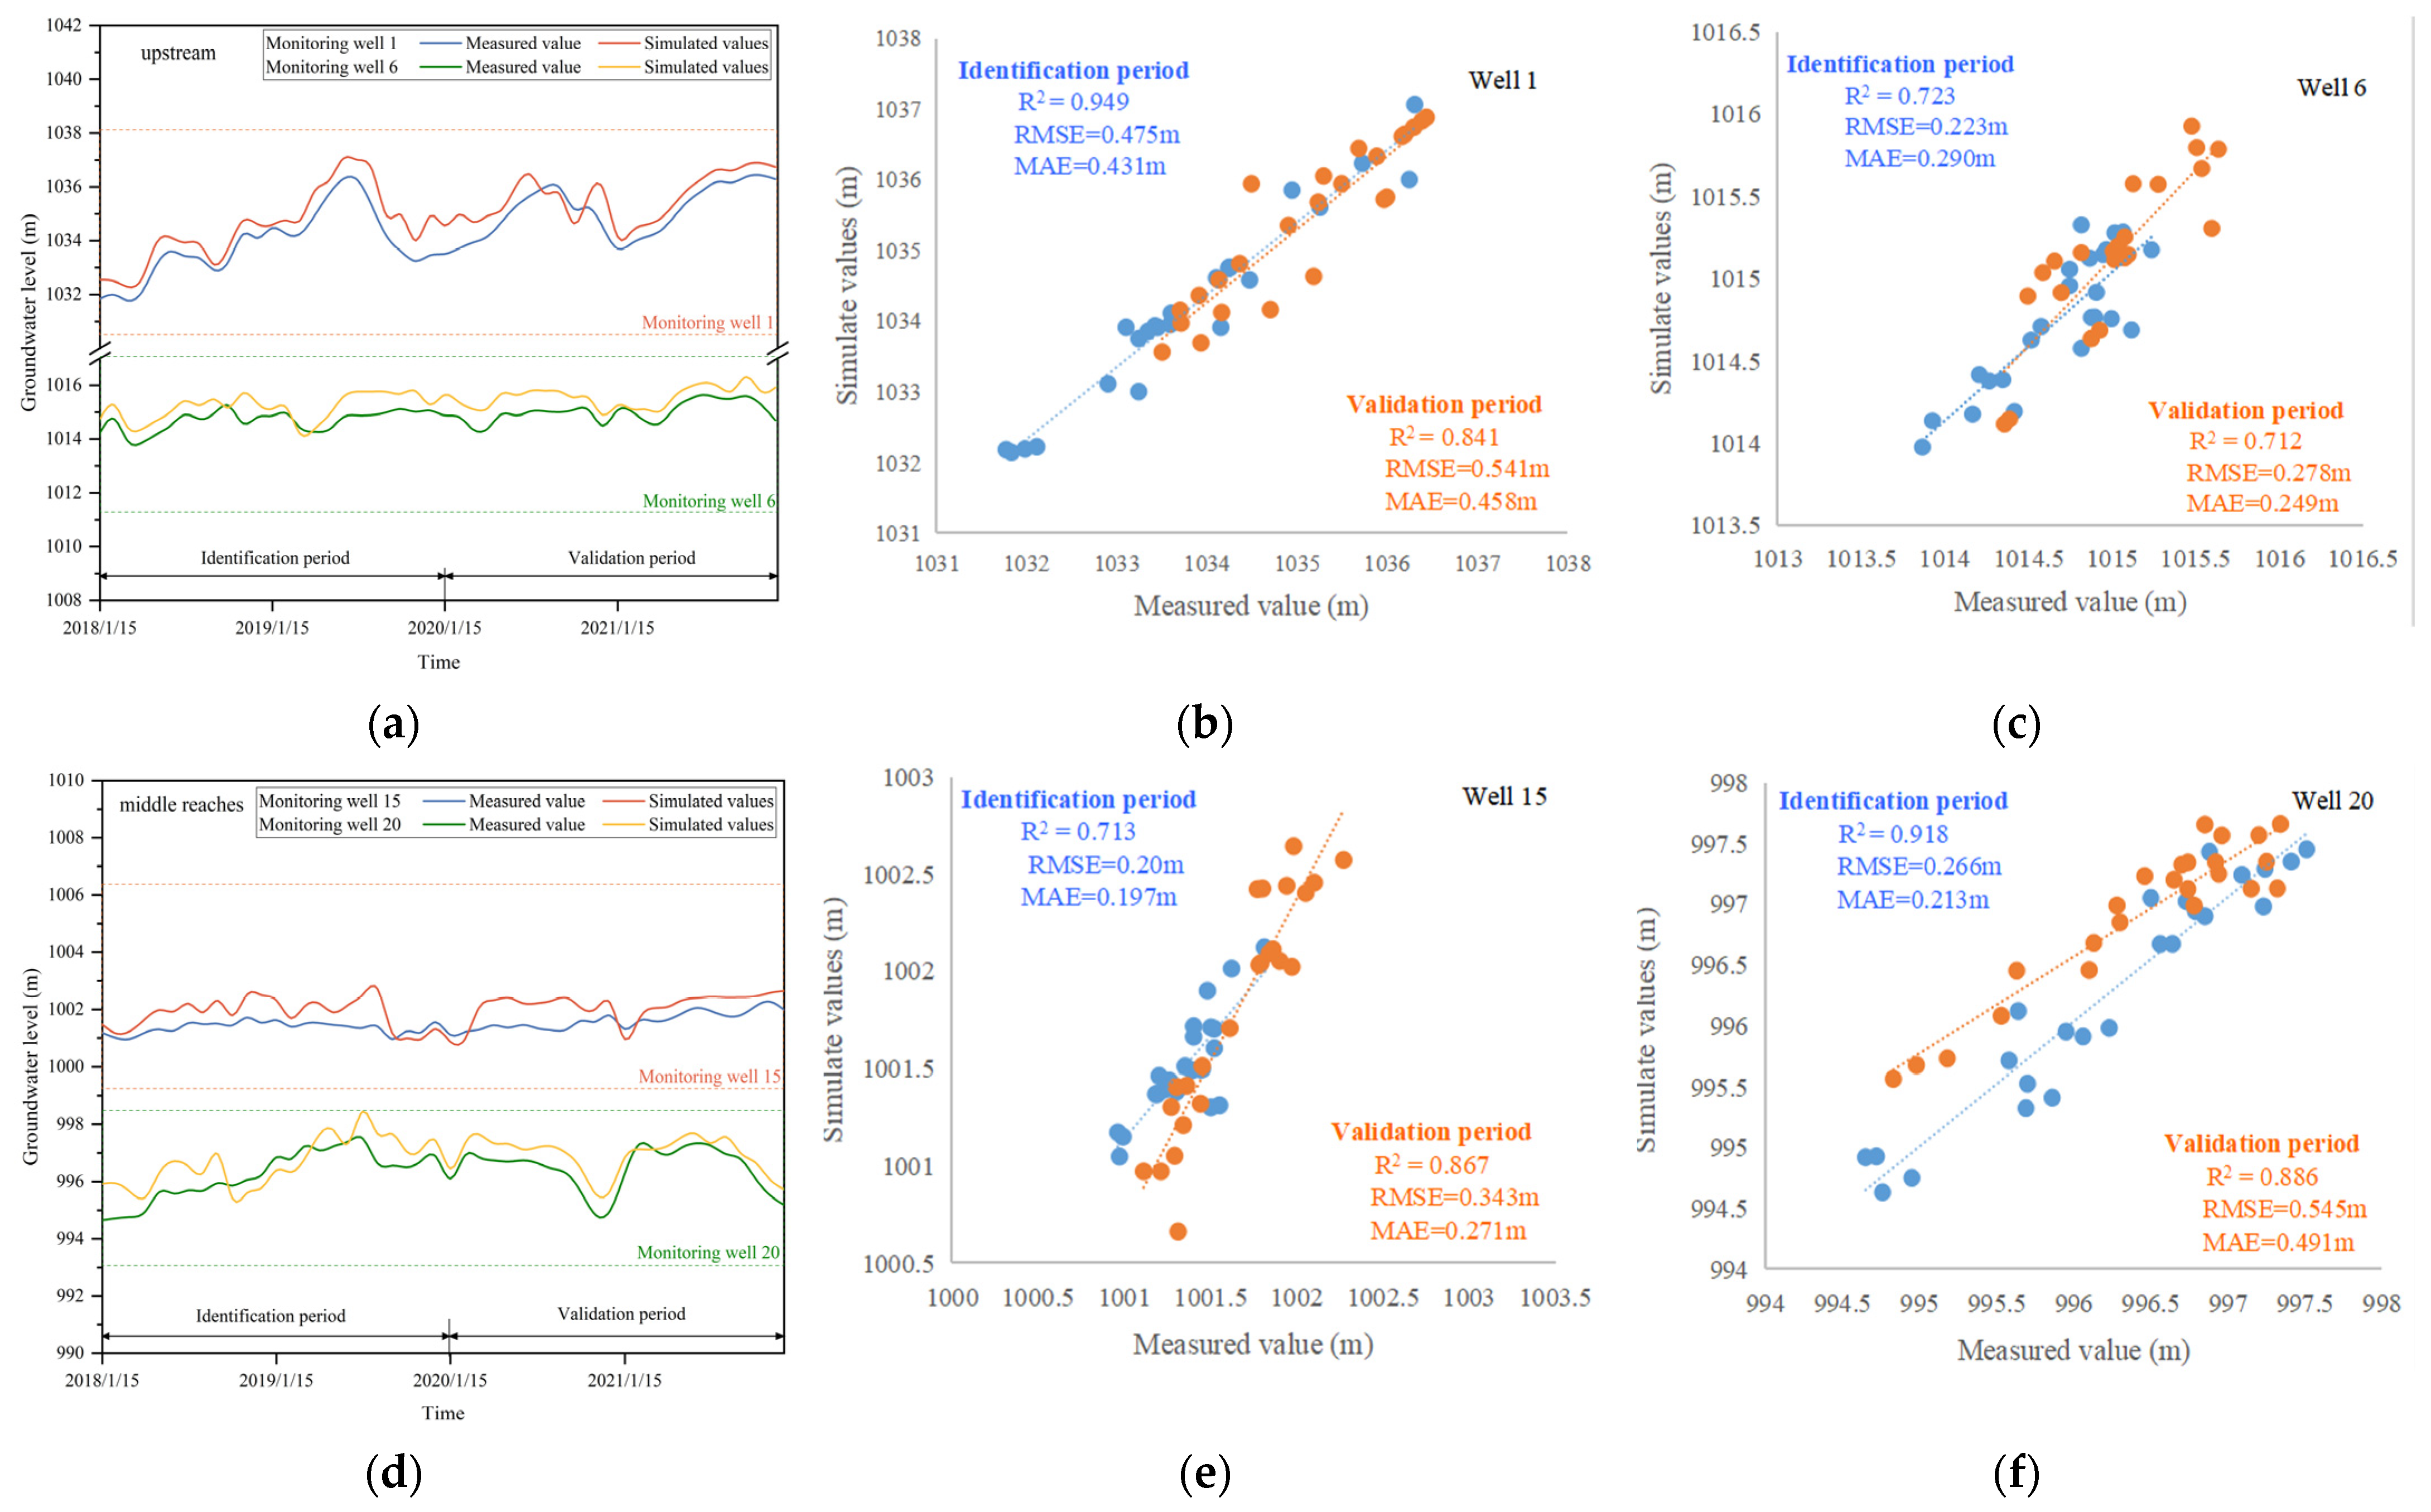
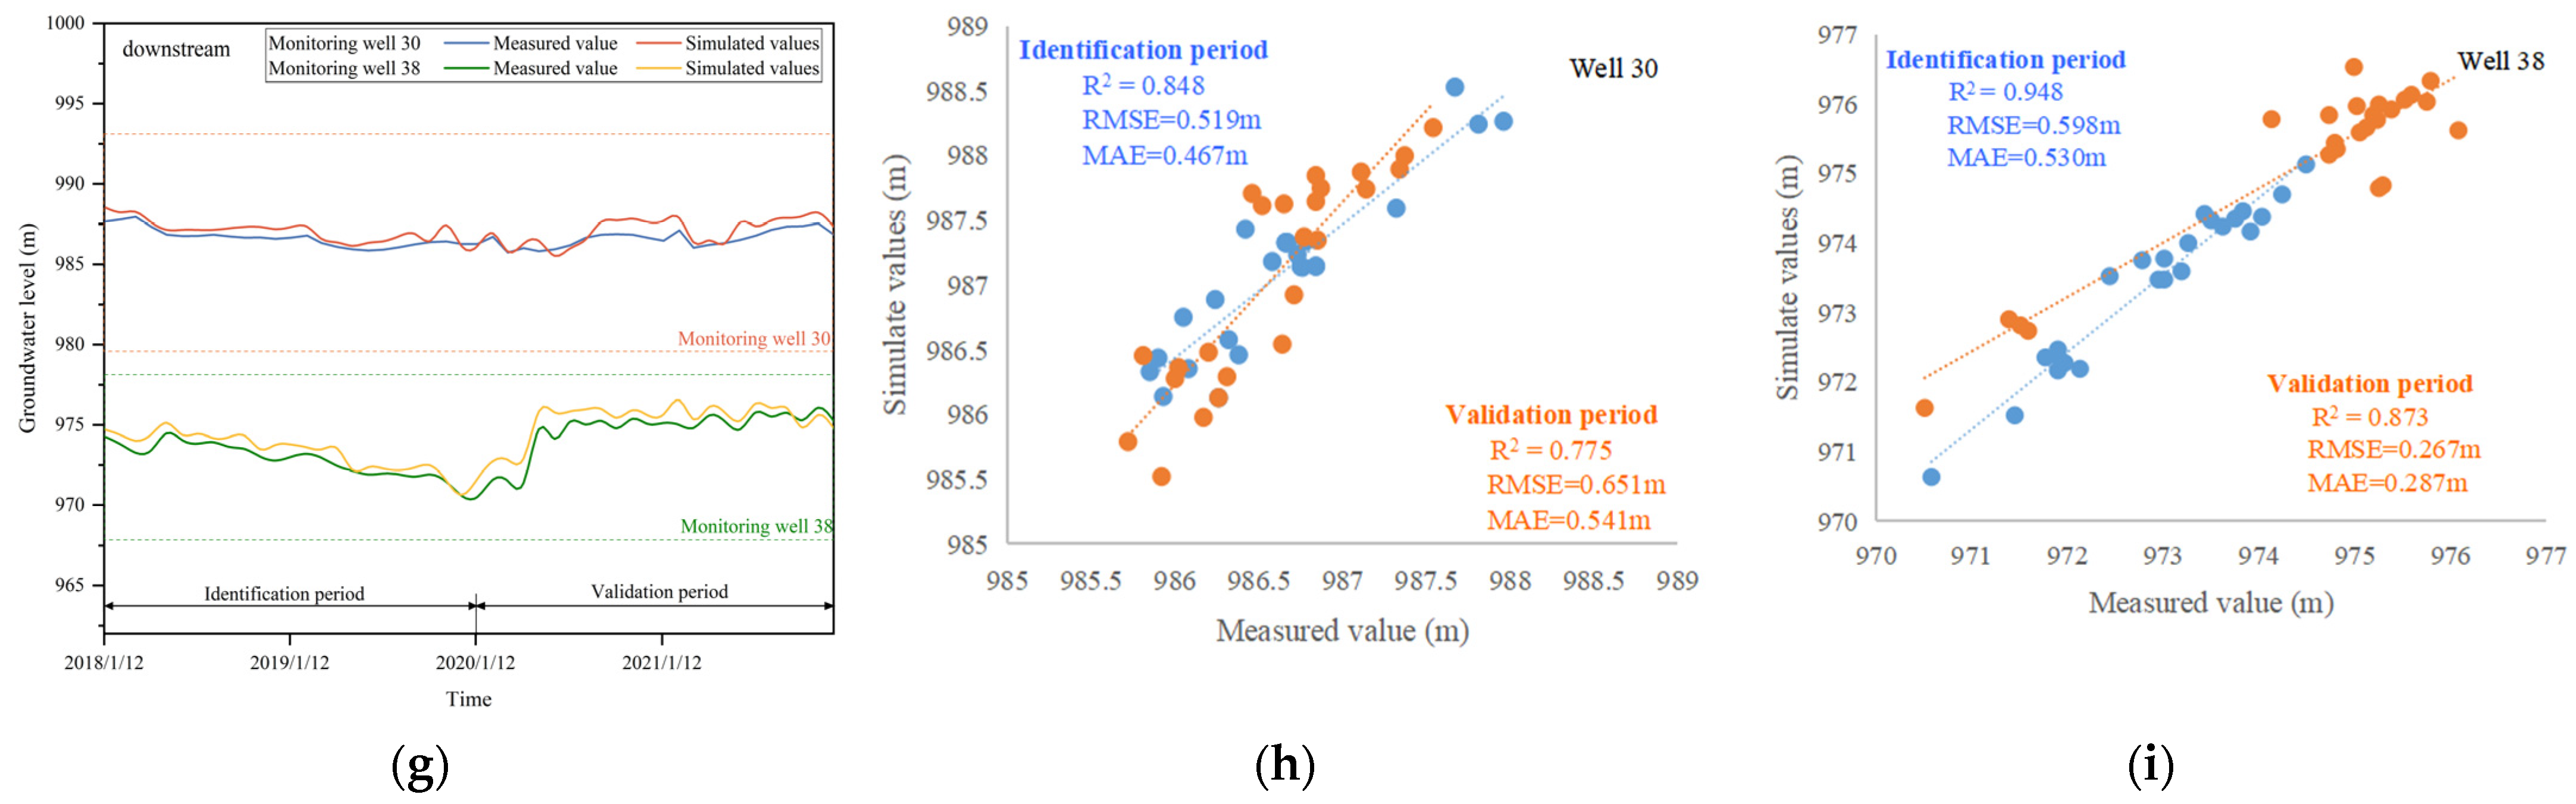
3.1. Model Identification and Validation

The water balance method and numerical simulation method were used to compare and calculate the water balance of the study area from 2018 to 2021, and the comparison results are detailed in Table 2, which shows little difference in the calculation results between the two methods. At the same time, the R2 between the groundwater level of typical observation wells simulated using the MODFLOW model and the actual water level was >0.7 (Figure 5), demonstrating that the trend in changes in the simulated and measured groundwater levels was relatively consistent and indicating that the simulation effect of the model was good. Therefore, the model could be used for subsequent numerical simulations and analyses of groundwater levels under different scenarios of combined well and canal irrigation regimes.

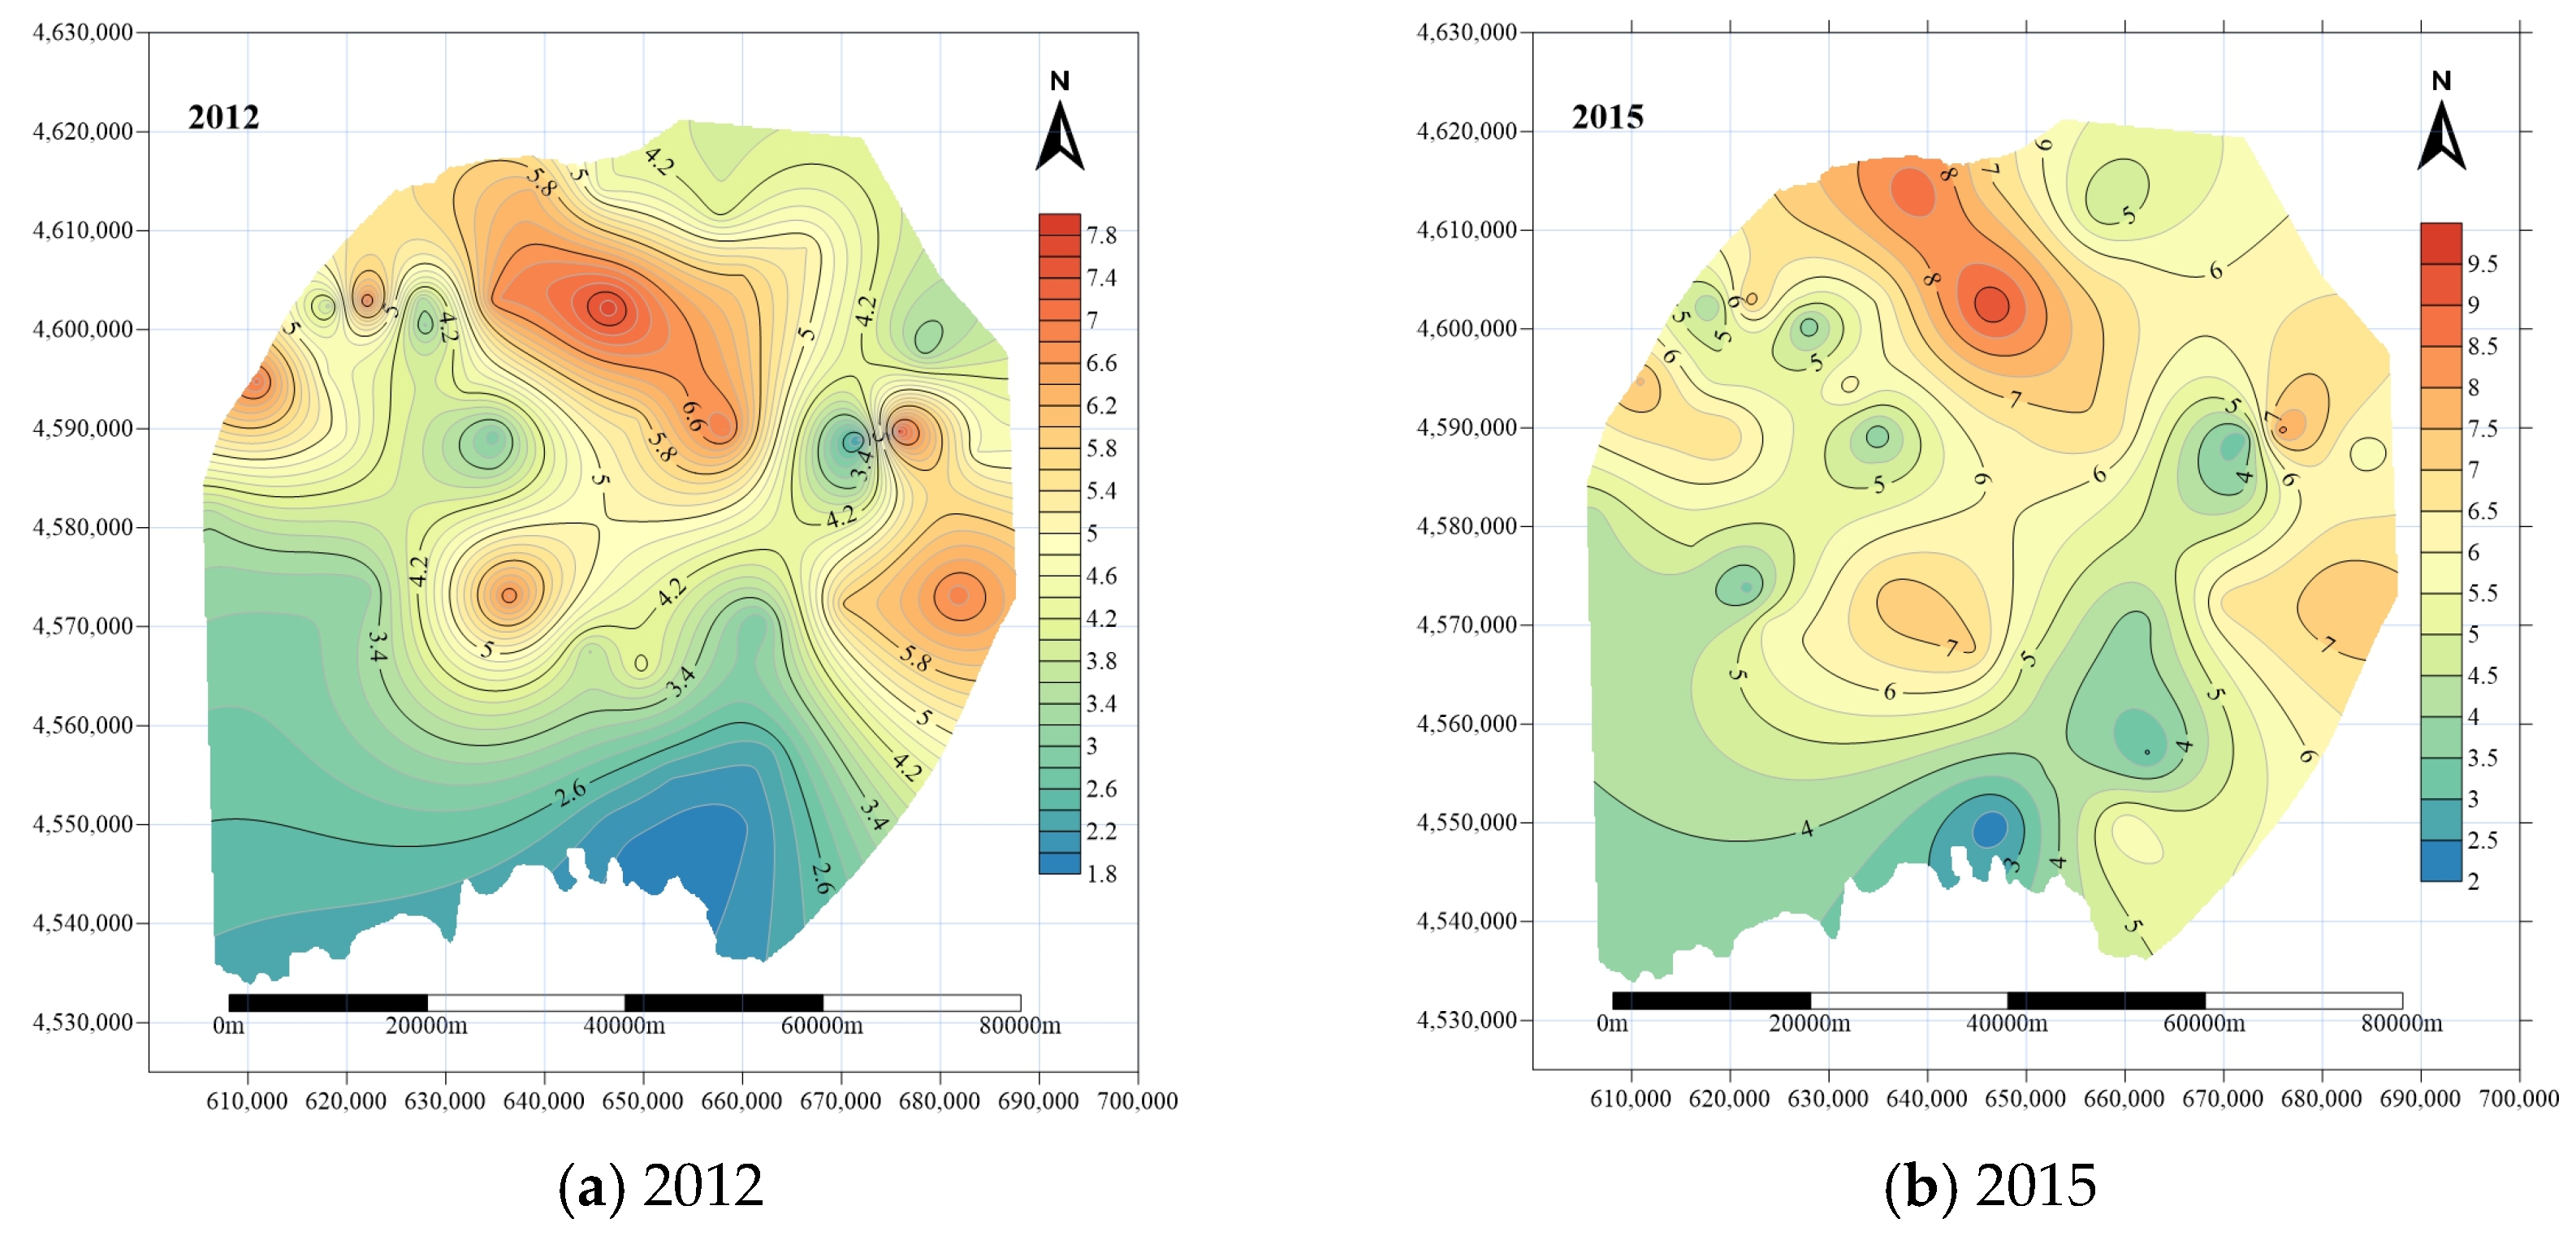
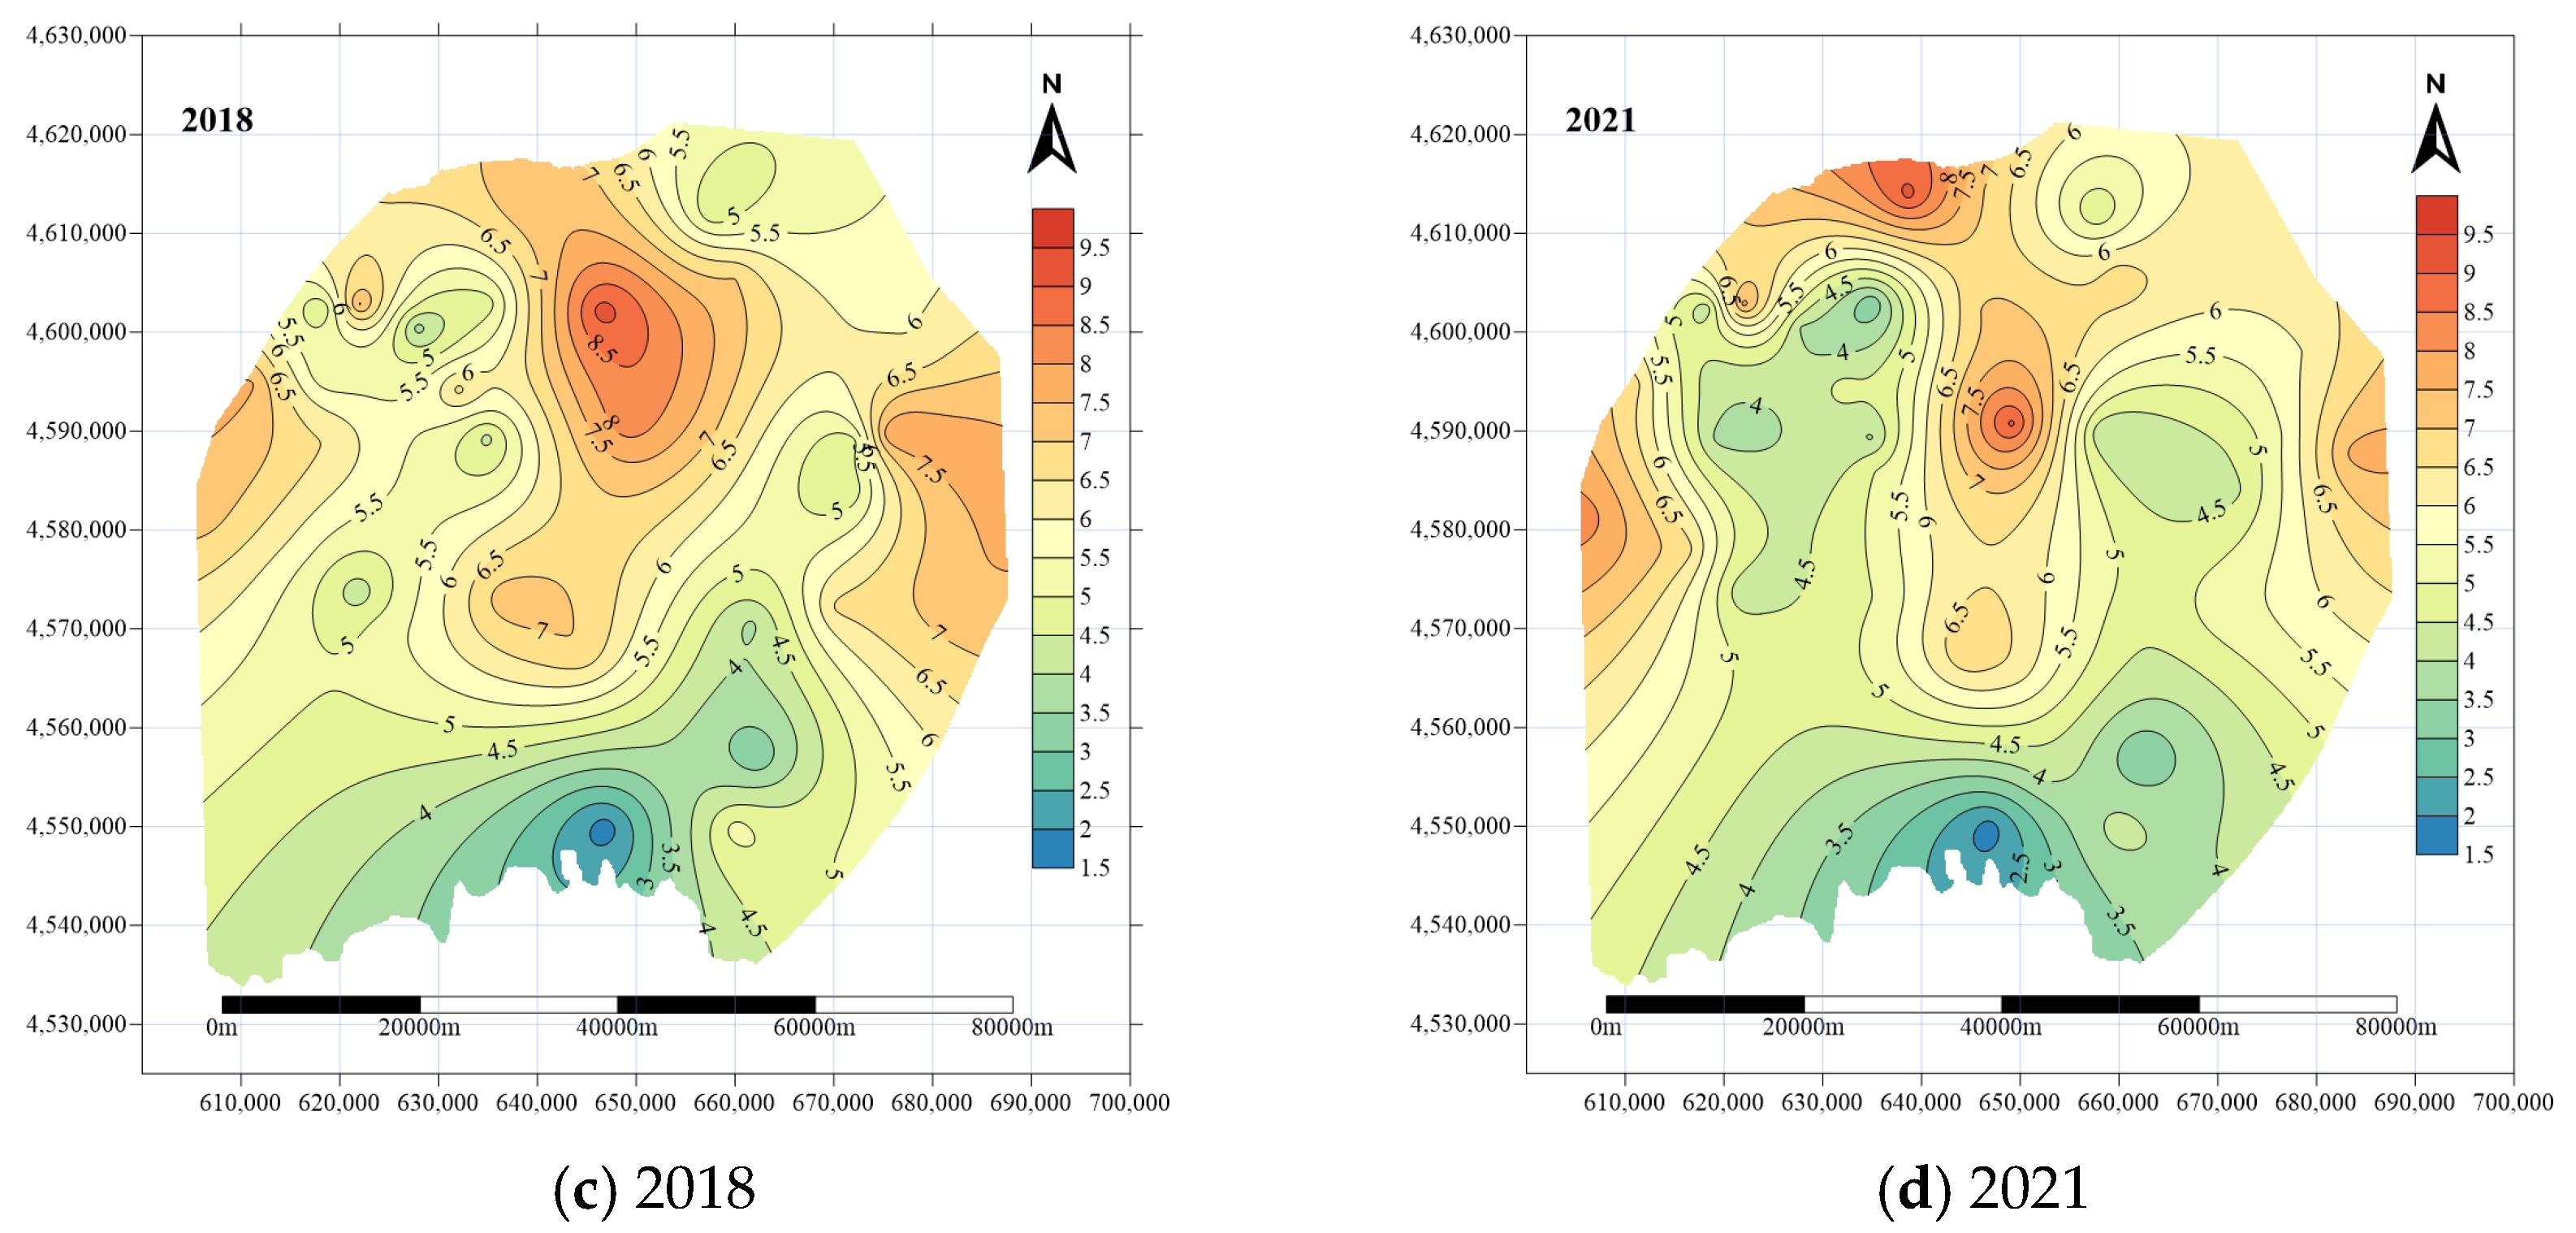
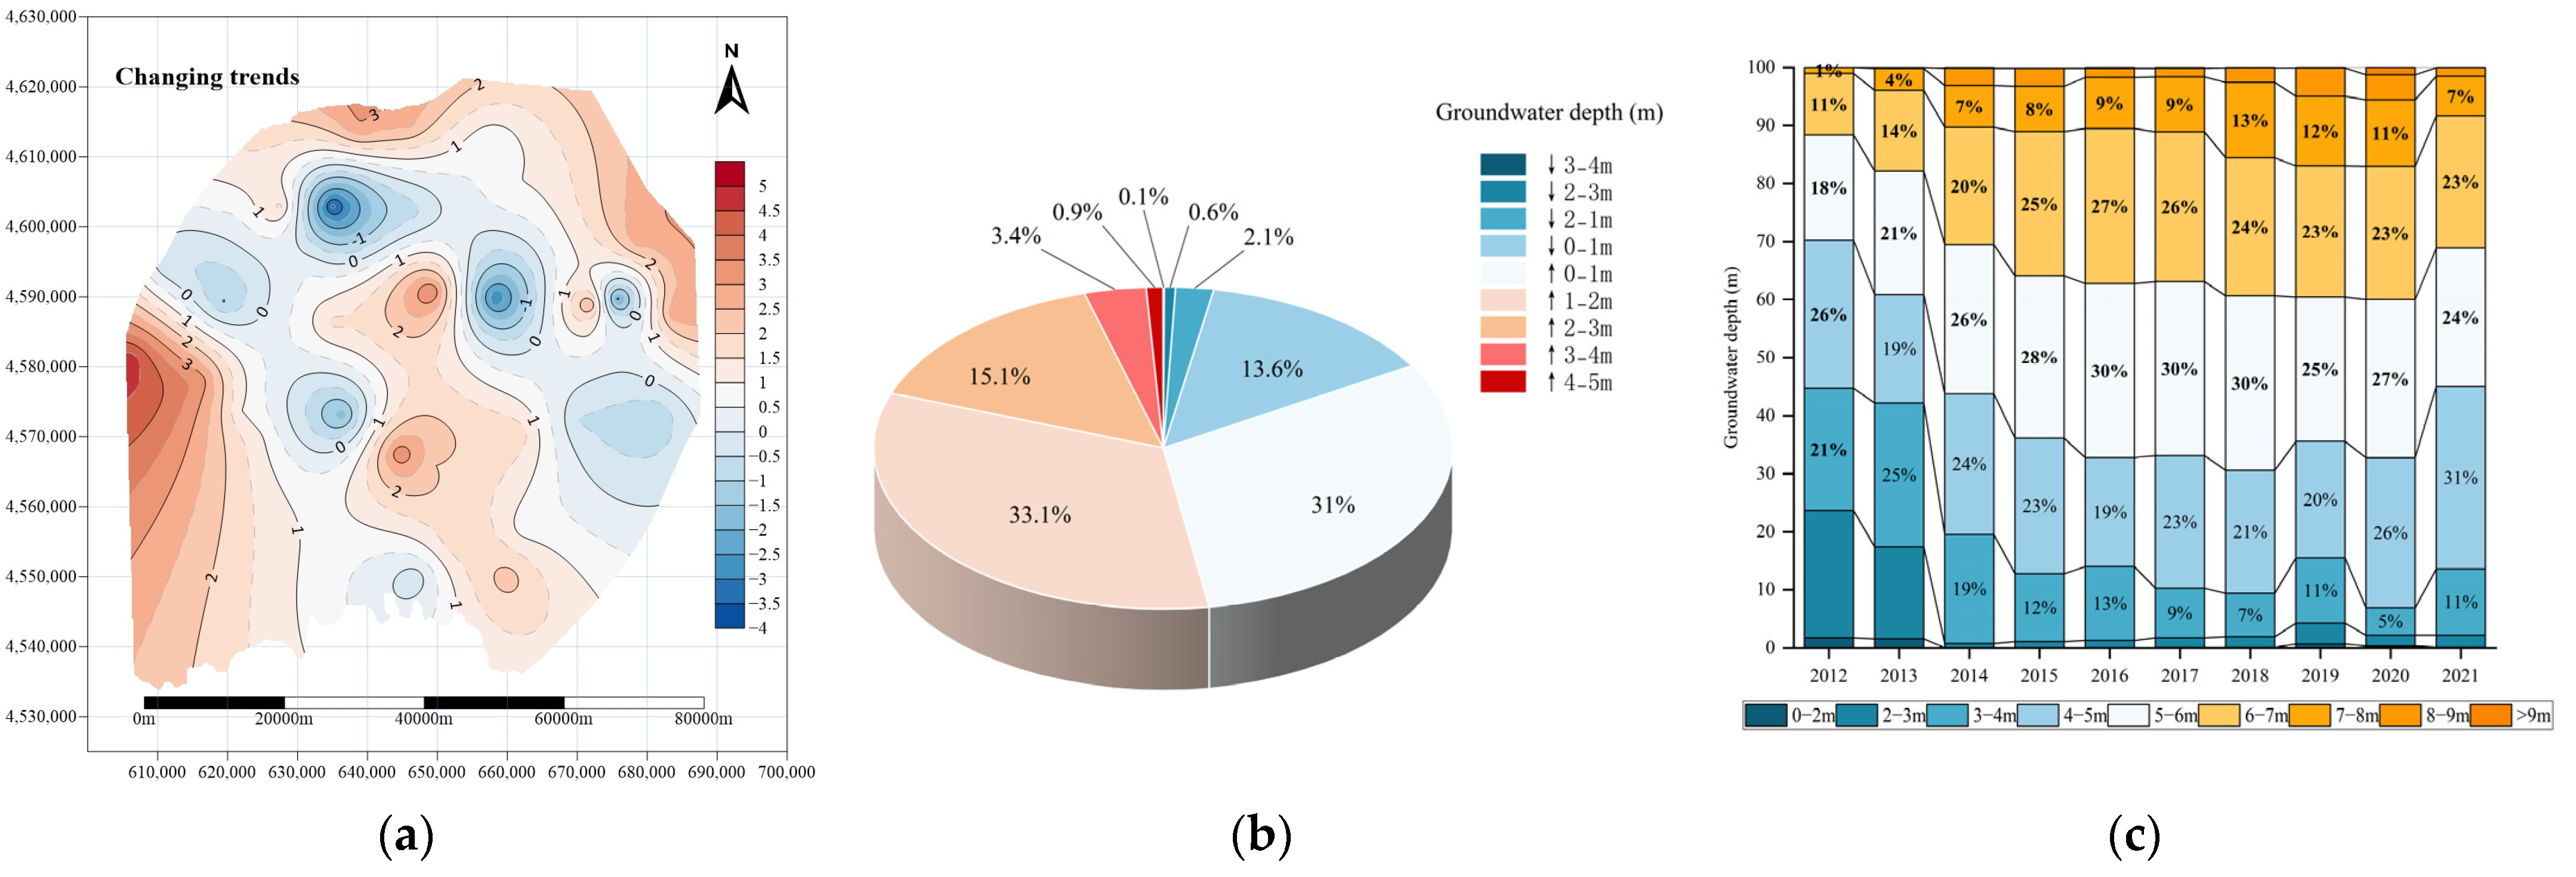
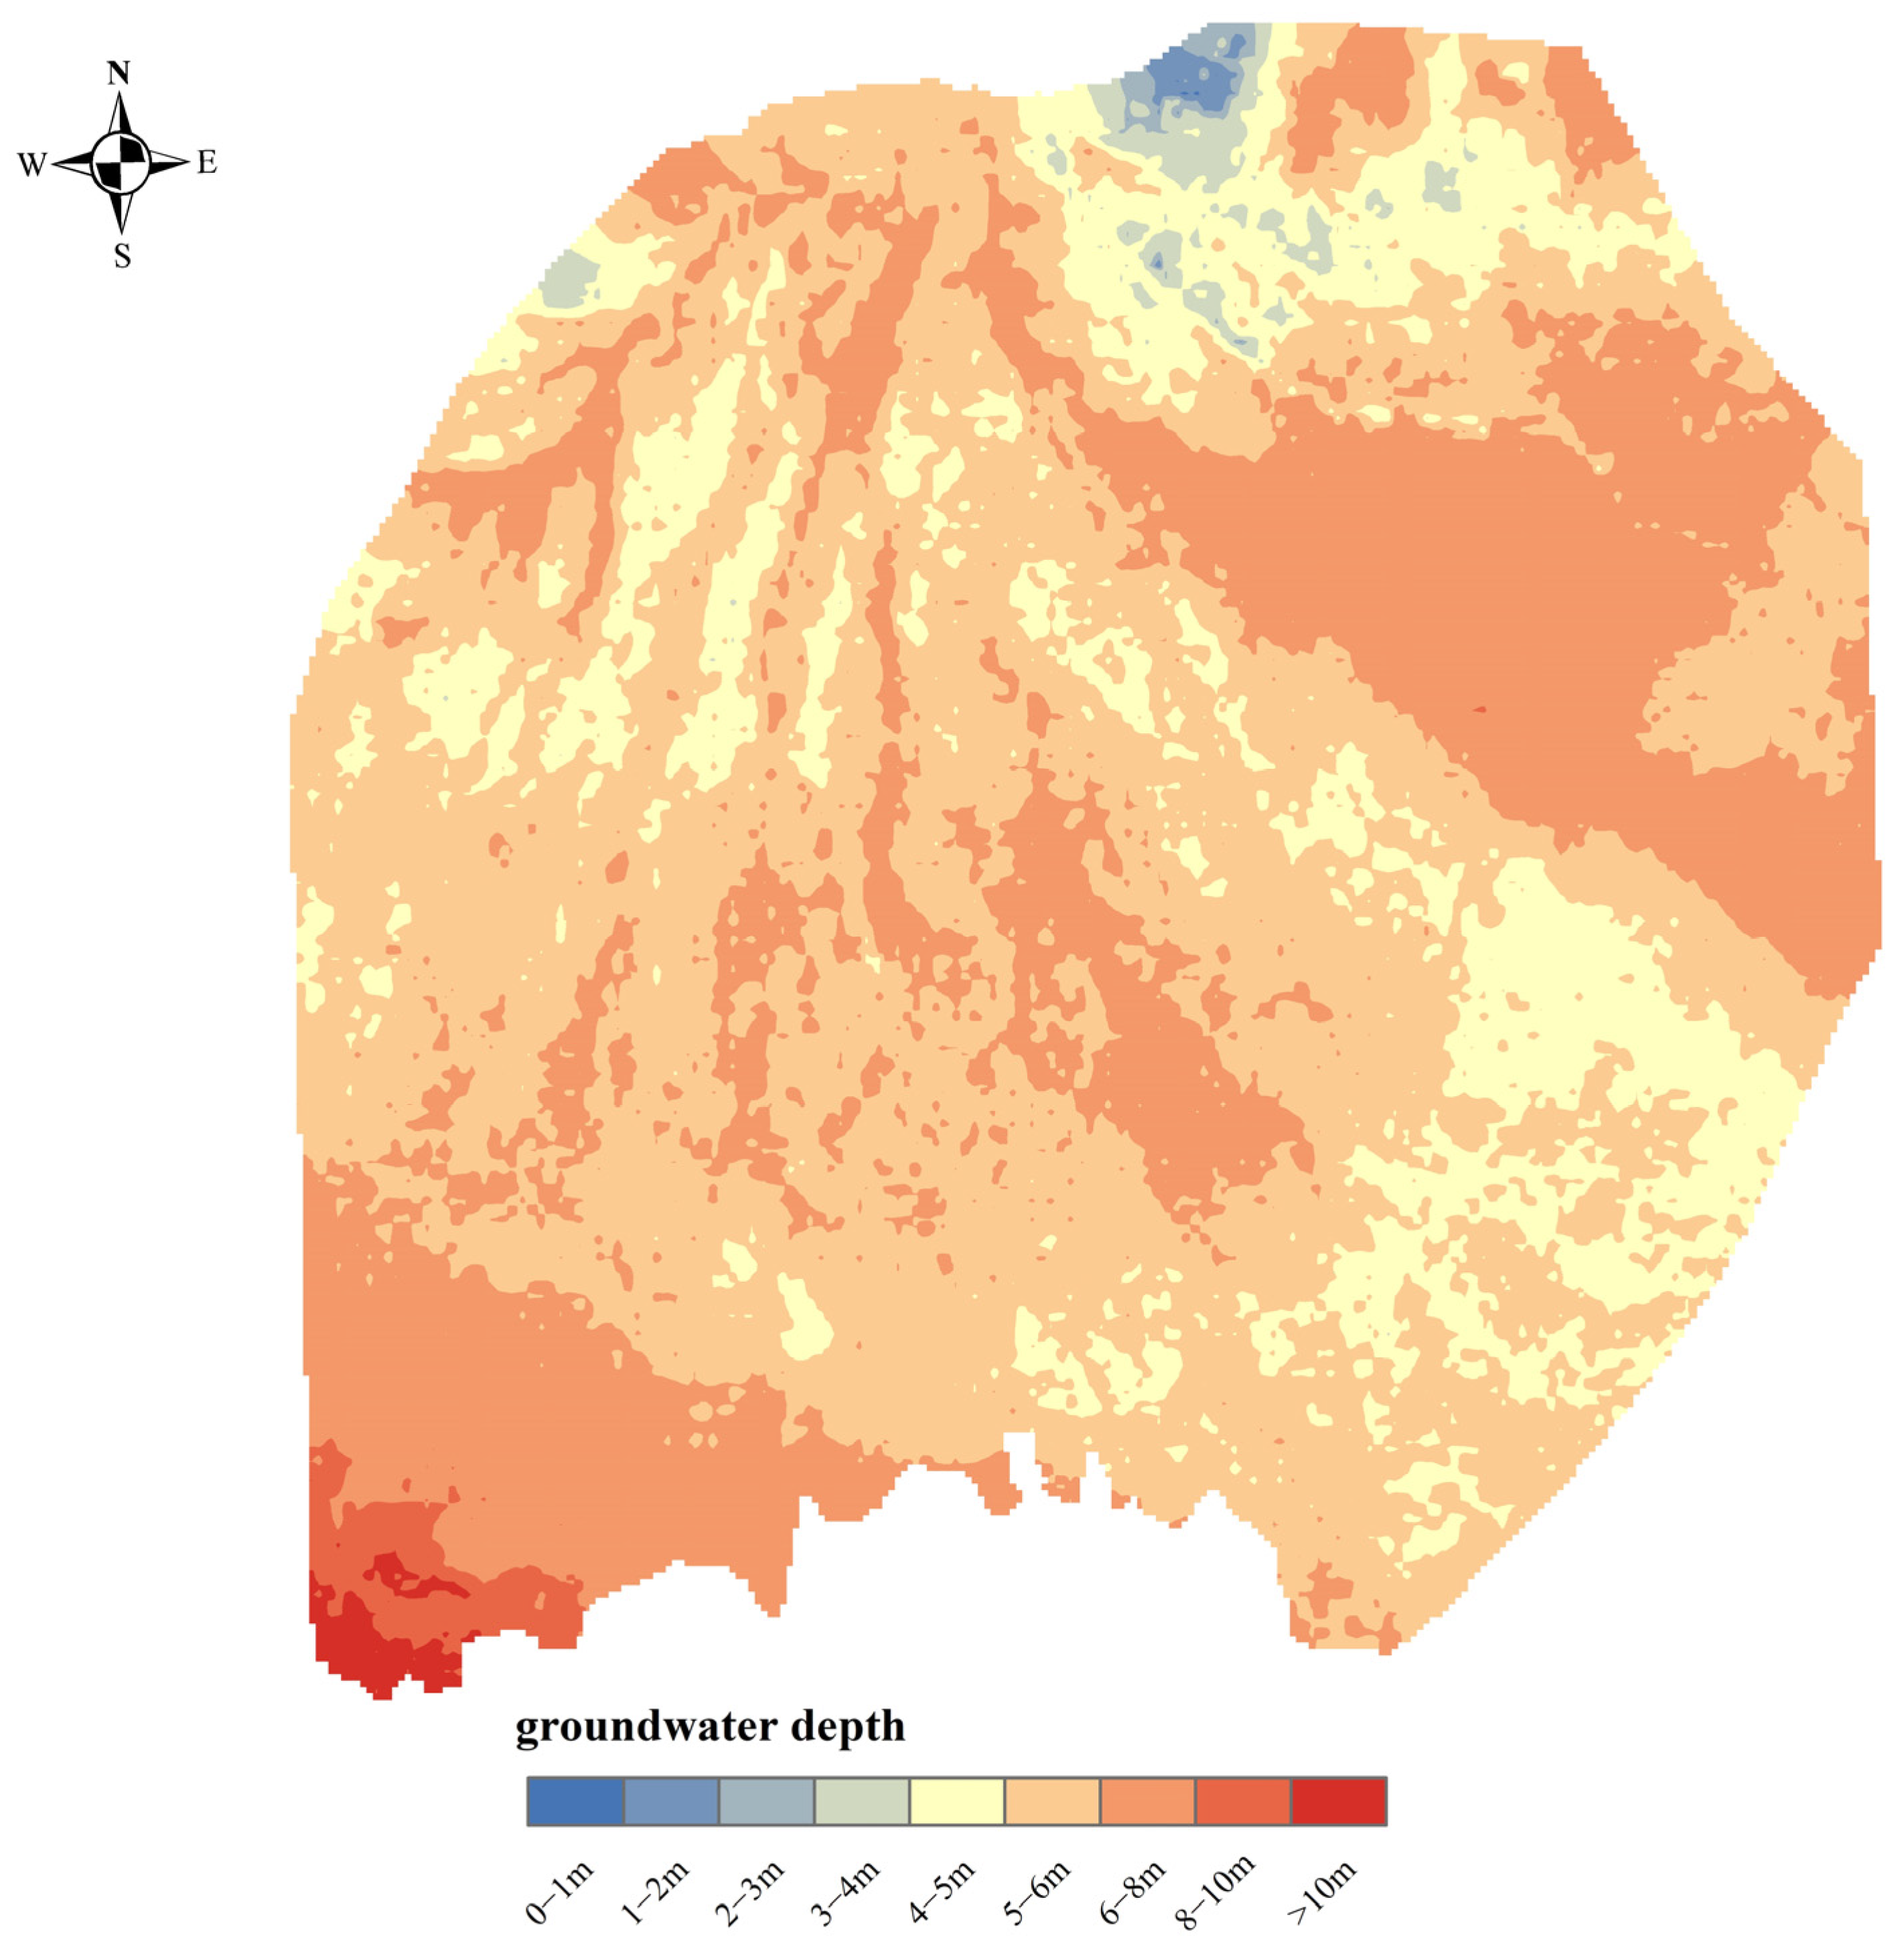
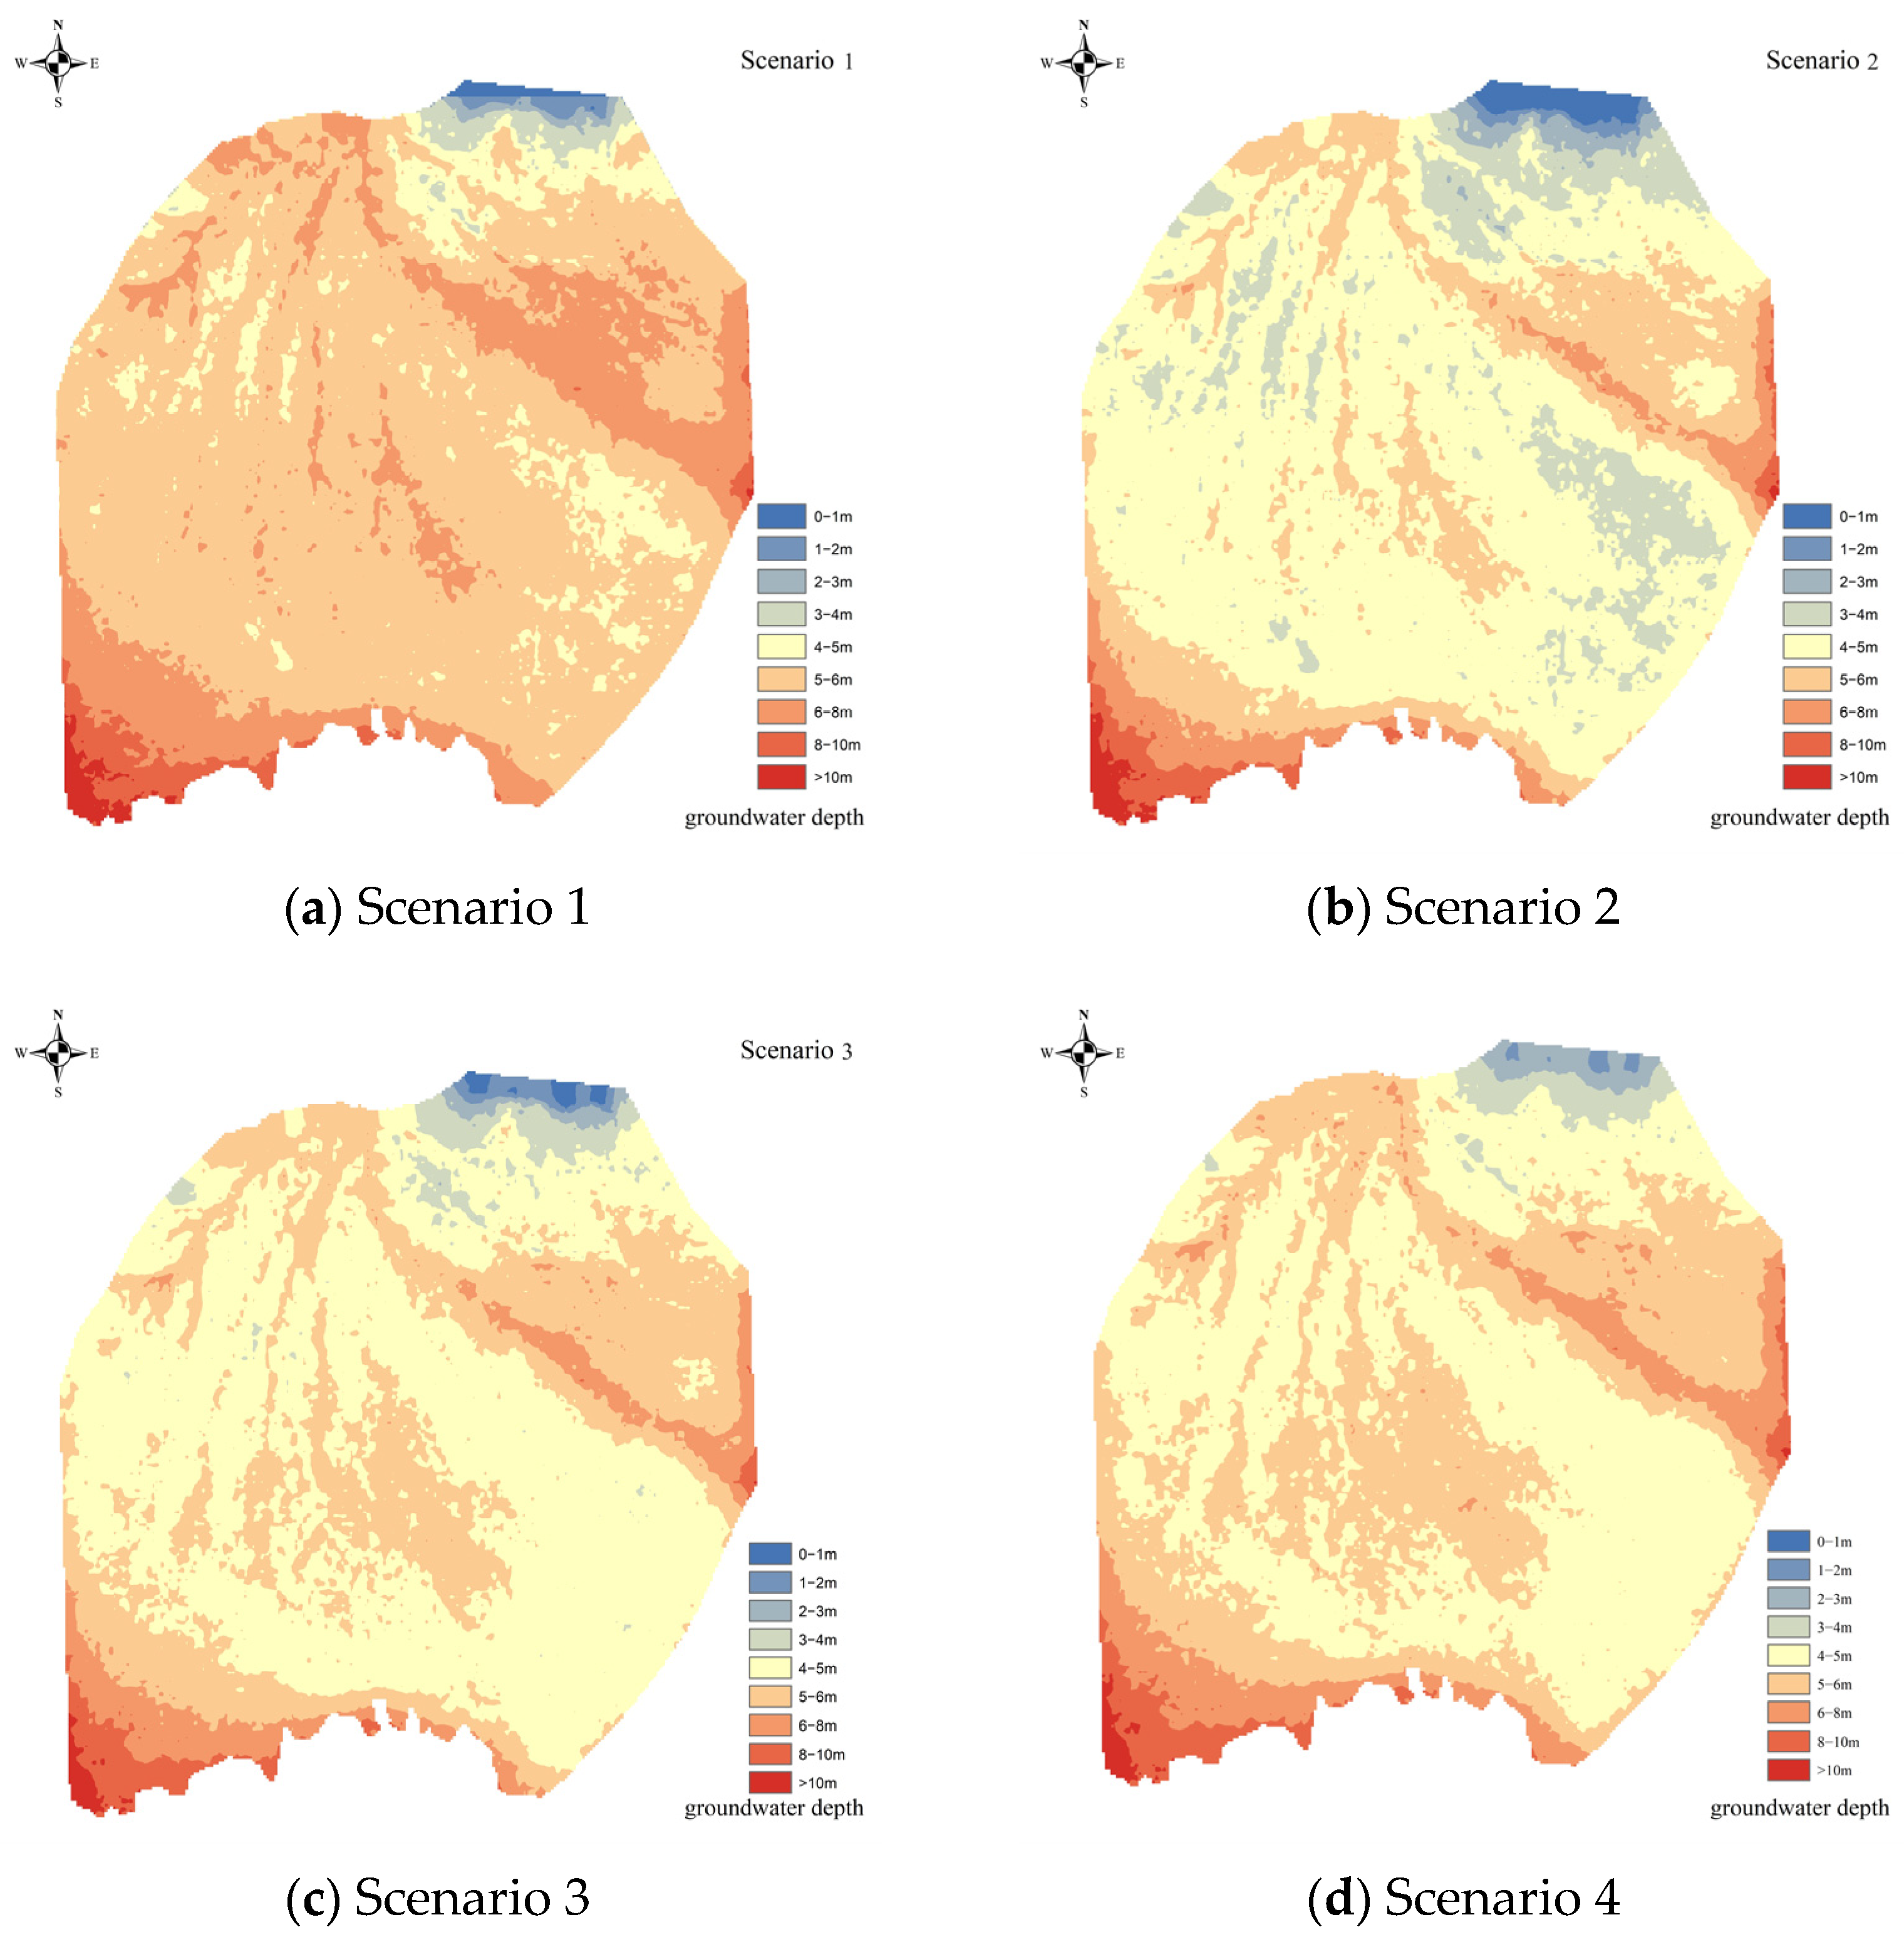
3.2. Analysis of Spatiotemporal Variation in Groundwater Depth

The interannual change in groundwater depth simulated through MODFLOW is shown in Figure 6. During the 10-year period, the groundwater depth in the Weigan River irrigation district showed an overall increasing trend, increasing from 4.52 m in 2012 to 5.55 m in 2021, an increase of 1.03 m. The upstream groundwater depth increased the most, increasing from 4.47 m to 6.43 m, an increase of 1.96 m; meanwhile, the middle and downstream areas had a relatively small increase in groundwater depth, increasing by 0.53 m and 0.58 m. The relative increase in groundwater depth in the middle and lower reaches was small, with the groundwater depth in the middle reaches increasing from 4.71 m to 5.24 m, an increase of 0.53 m, and the groundwater depth in the lower reaches increasing from 4.41 m to 4.99 m, an increase of 0.58 m.
In 2021, in contrast to 2012, 82.9% of the area showed an increasing trend in groundwater depth, with variations ranging from 0 to 5 m. Additionally, localized areas experienced drawdown cone phenomena, with regions exhibiting groundwater depth reductions of 0–1 m, 1–2 m, 2–3 m, and 3–4 m, accounting for 0.1%, 0.6%, 2.1%, and 13.6% of the total study area, respectively. These were concentrated primarily in the forested land cultivation area.
Over 10 years, the area with a groundwater depth of less than 3 m steadily decreased, declining from 23% in 2012 to 1% in 2014. Subsequently, while there was an increase in the proportion of areas with a groundwater depth below 3 m, it remained consistently below 5%.
The proportion of areas with a groundwater depth exceeding 5 m started to increase, starting at 30% in 2012 and reaching its peak at 70% in 2018. After 2019, it began to decline, with 56% of the area still having a groundwater depth greater than 5 m in 2021 (Figure 7).

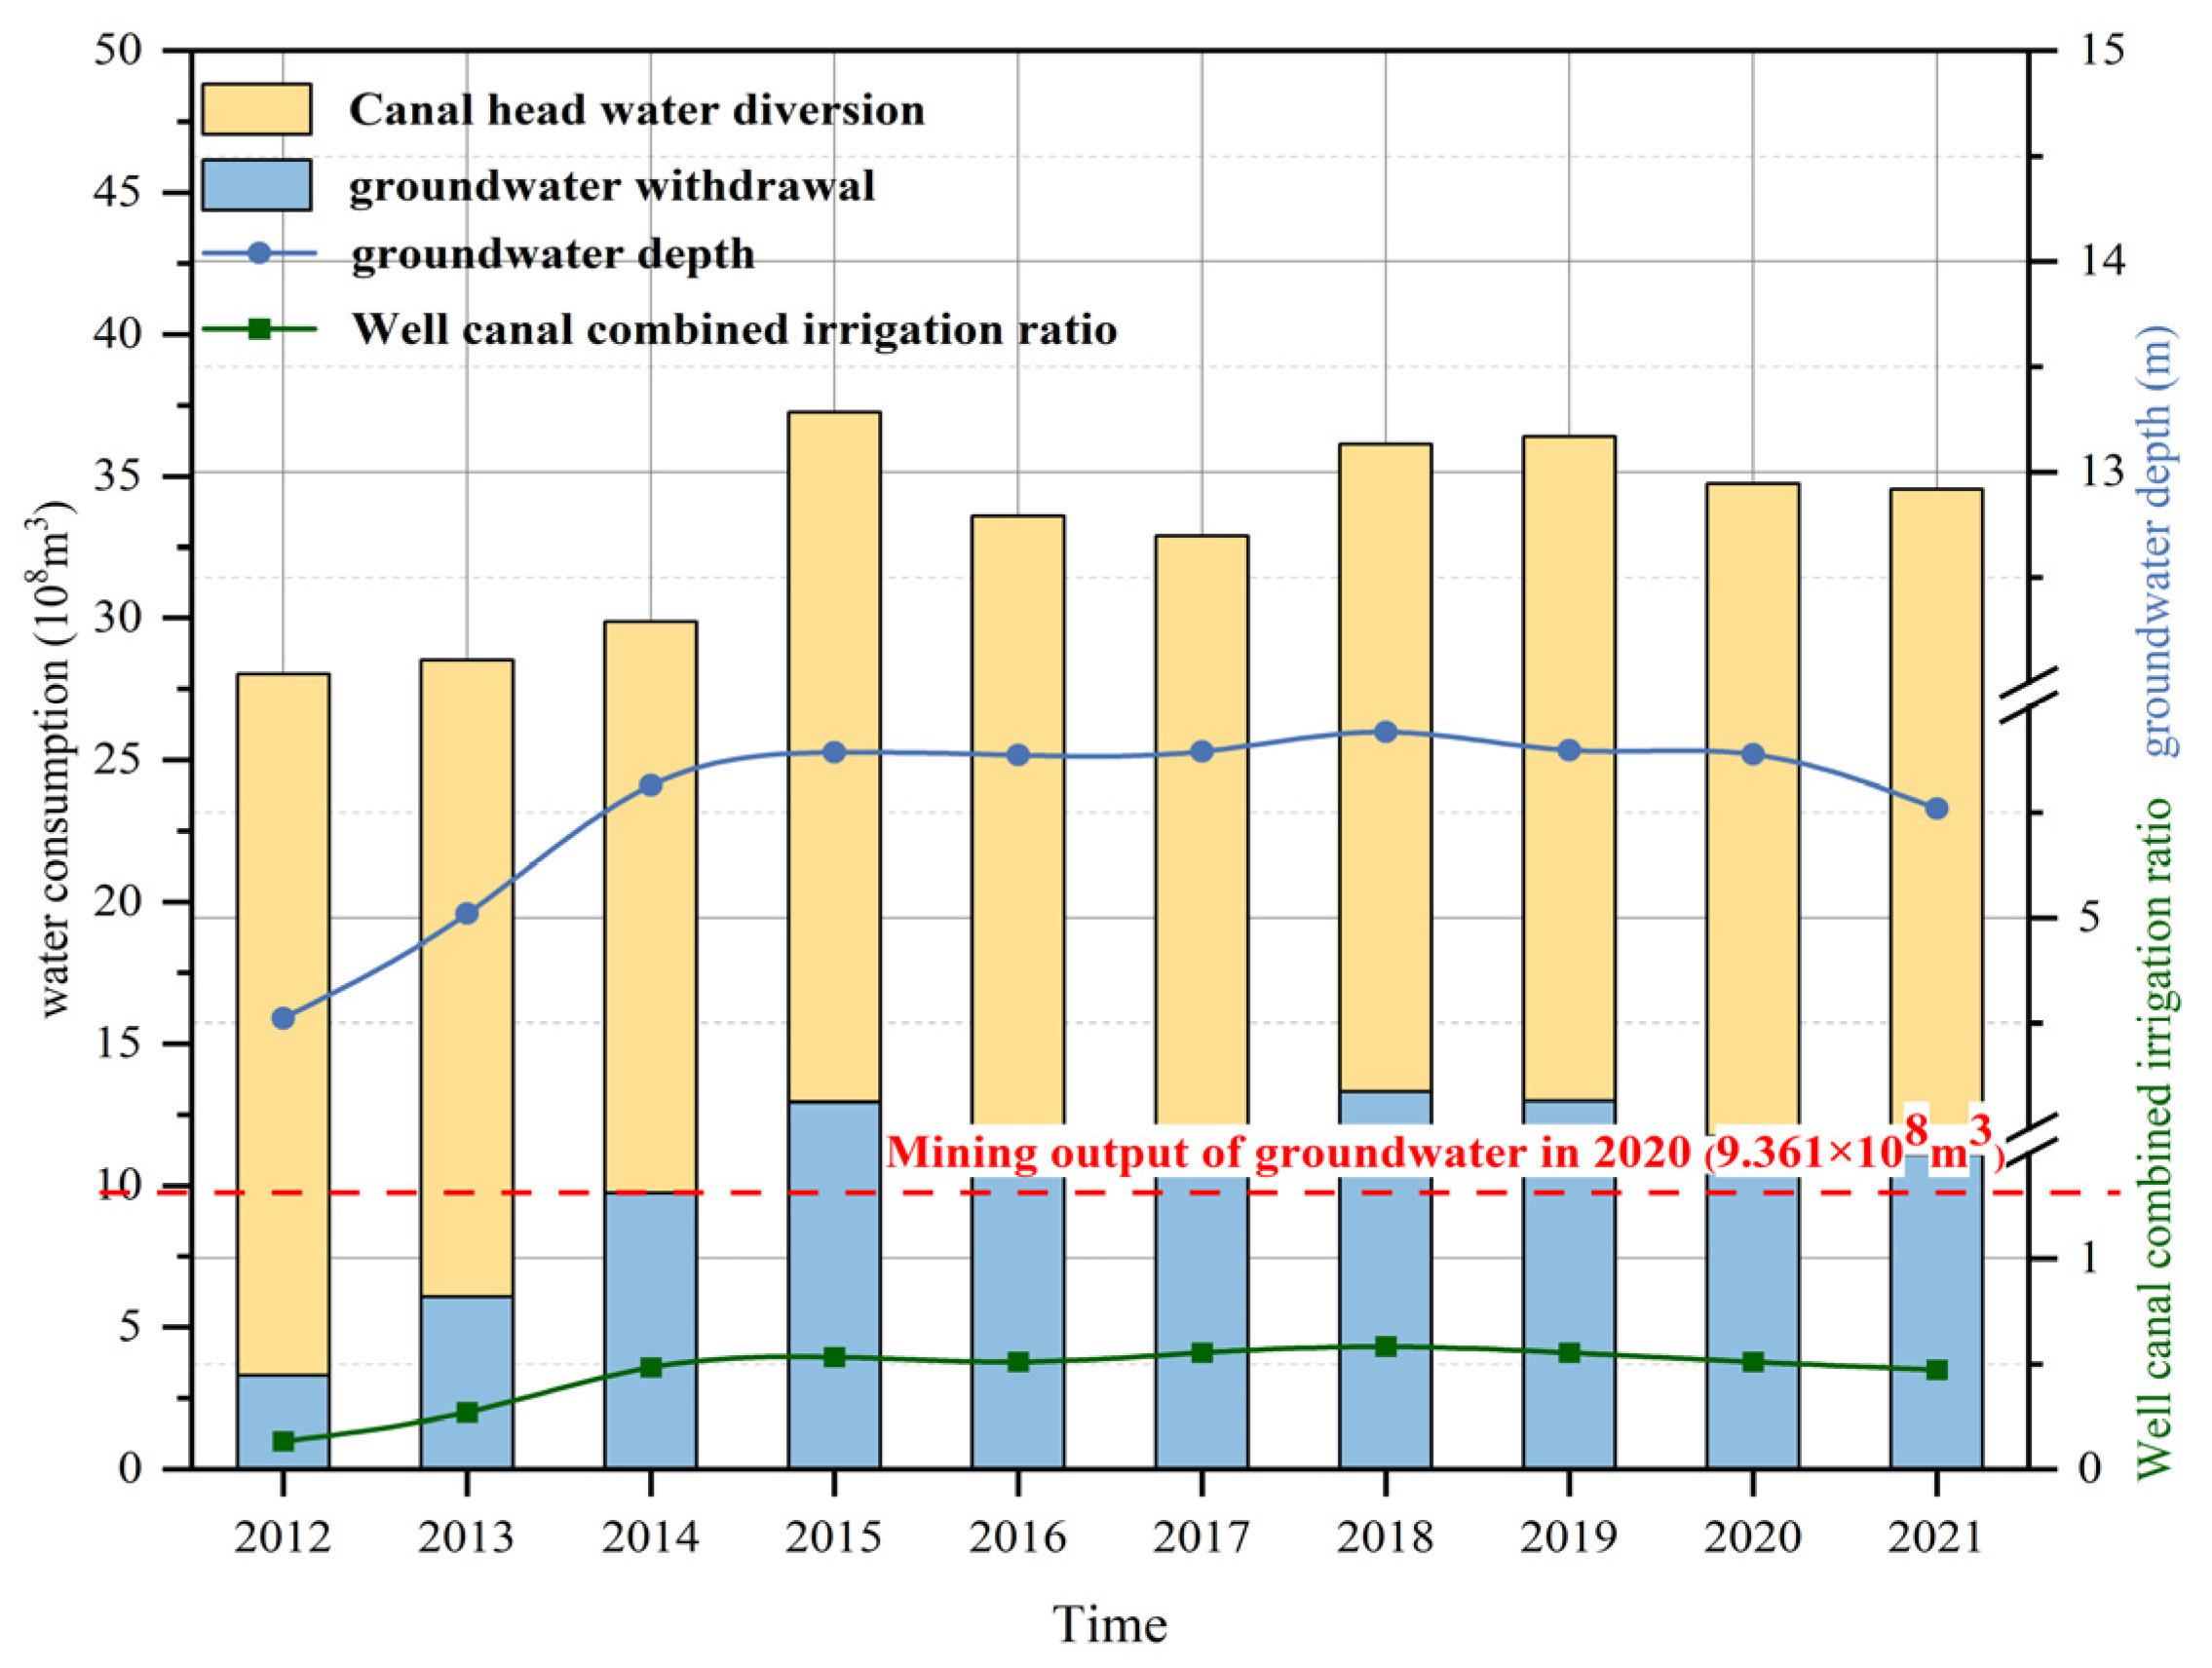
3.3. Response of Groundwater Depth to Changes in Well–Canal Combined Irrigation Ratio

As shown in Figure 8, the amount of groundwater exploitation increased greatly in 2012–2014, which led to a significant increase in the combined irrigation ratio of wells and canals, from 0.13 in 2012 to 0.48 in 2014, after which the increase slowed down and was maintained at approximately 0.5. The relatively stable combined irrigation ratio of wells and canals also maintained a relatively stable groundwater depth, and the maximum combined irrigation ratio reached 0.58 in 2018, which corresponded to the annual average groundwater depth, while the 10-year maximum was 5.88 m.

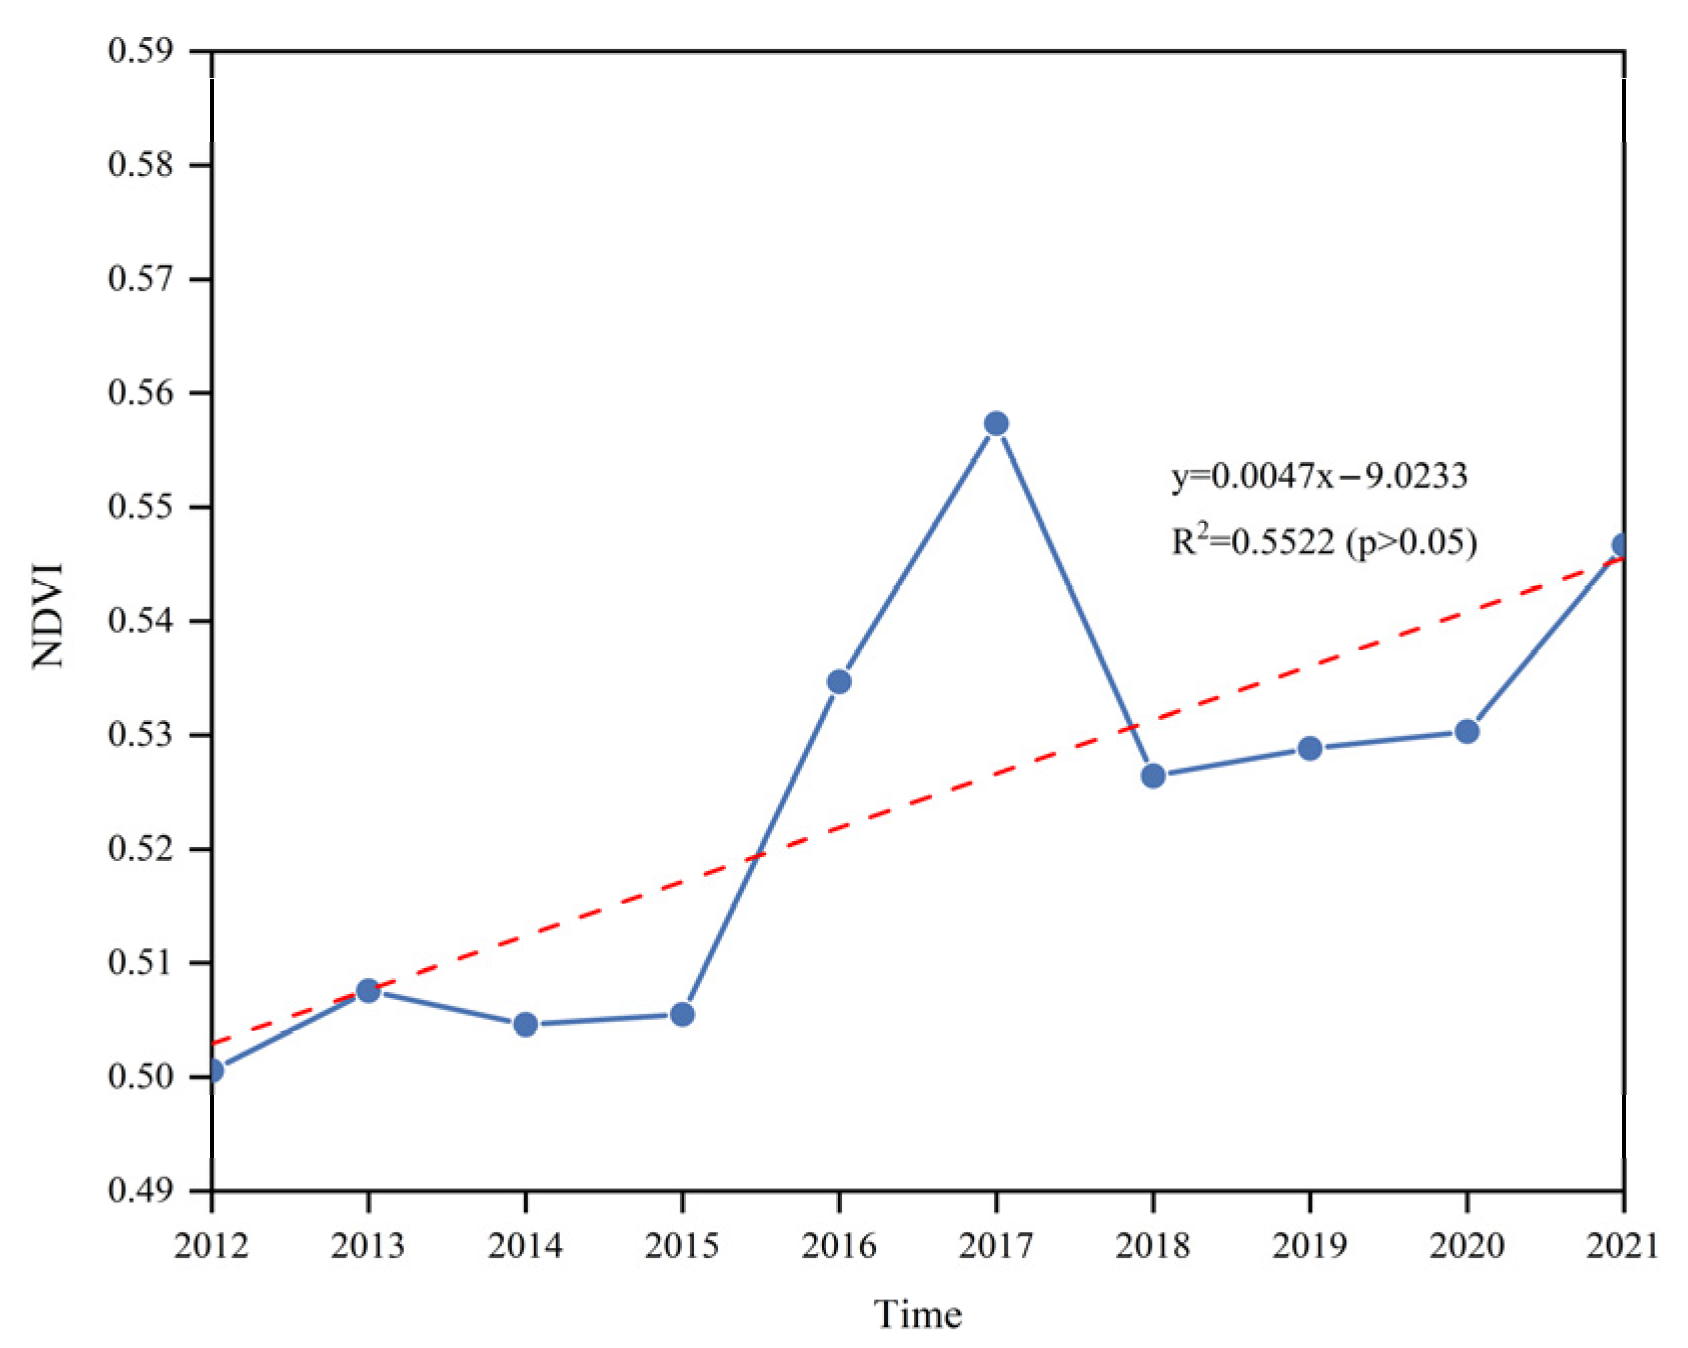
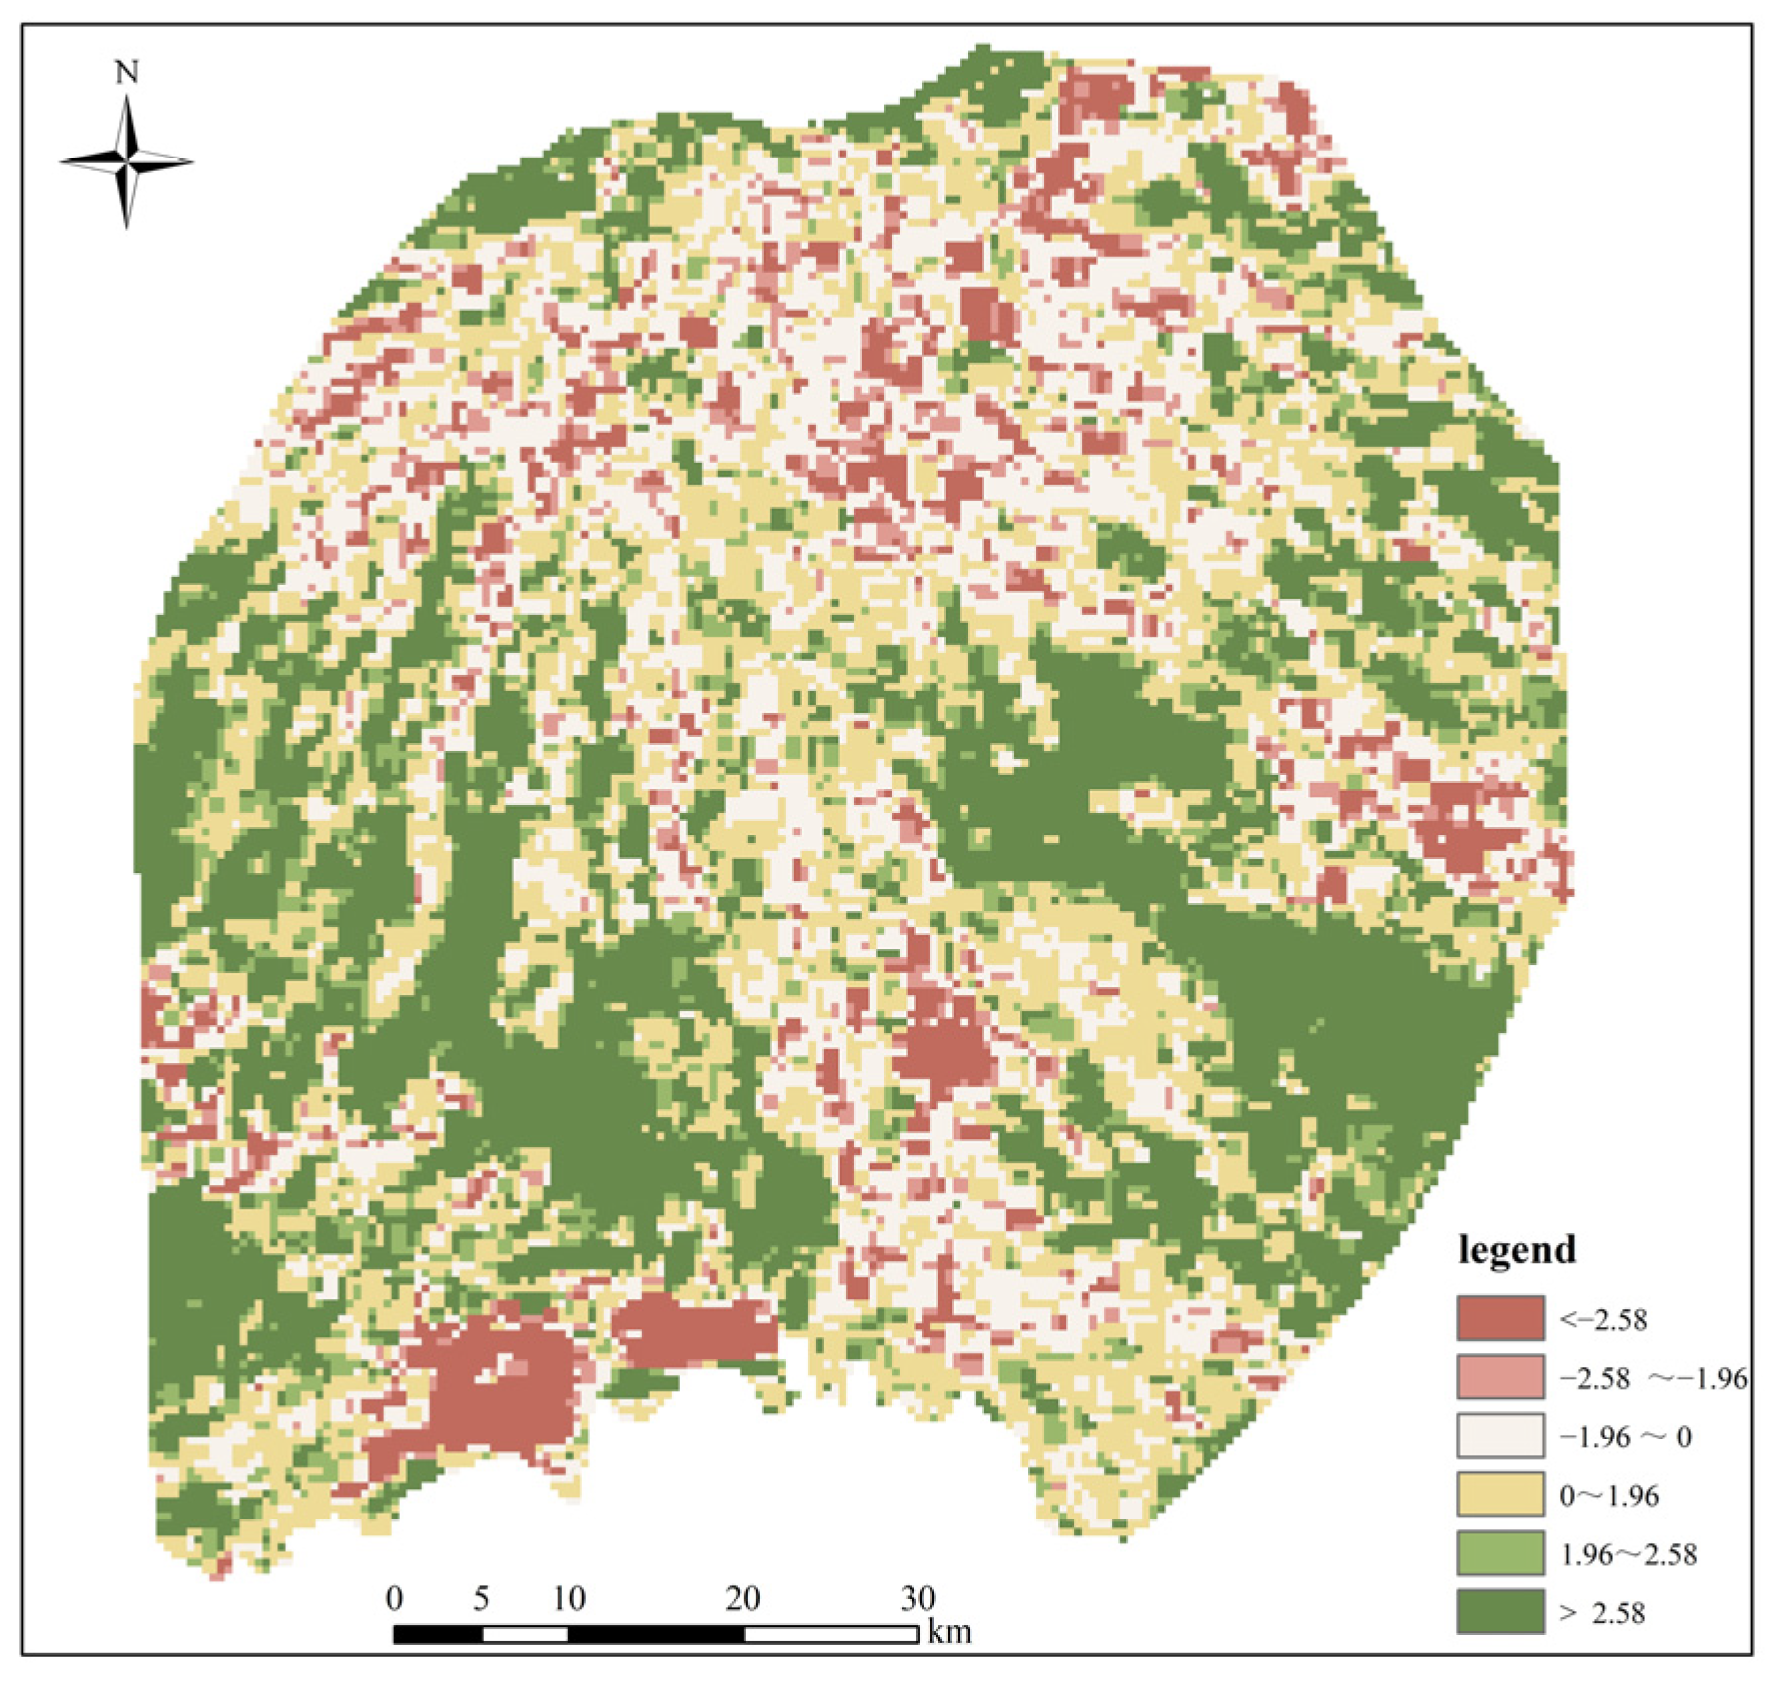
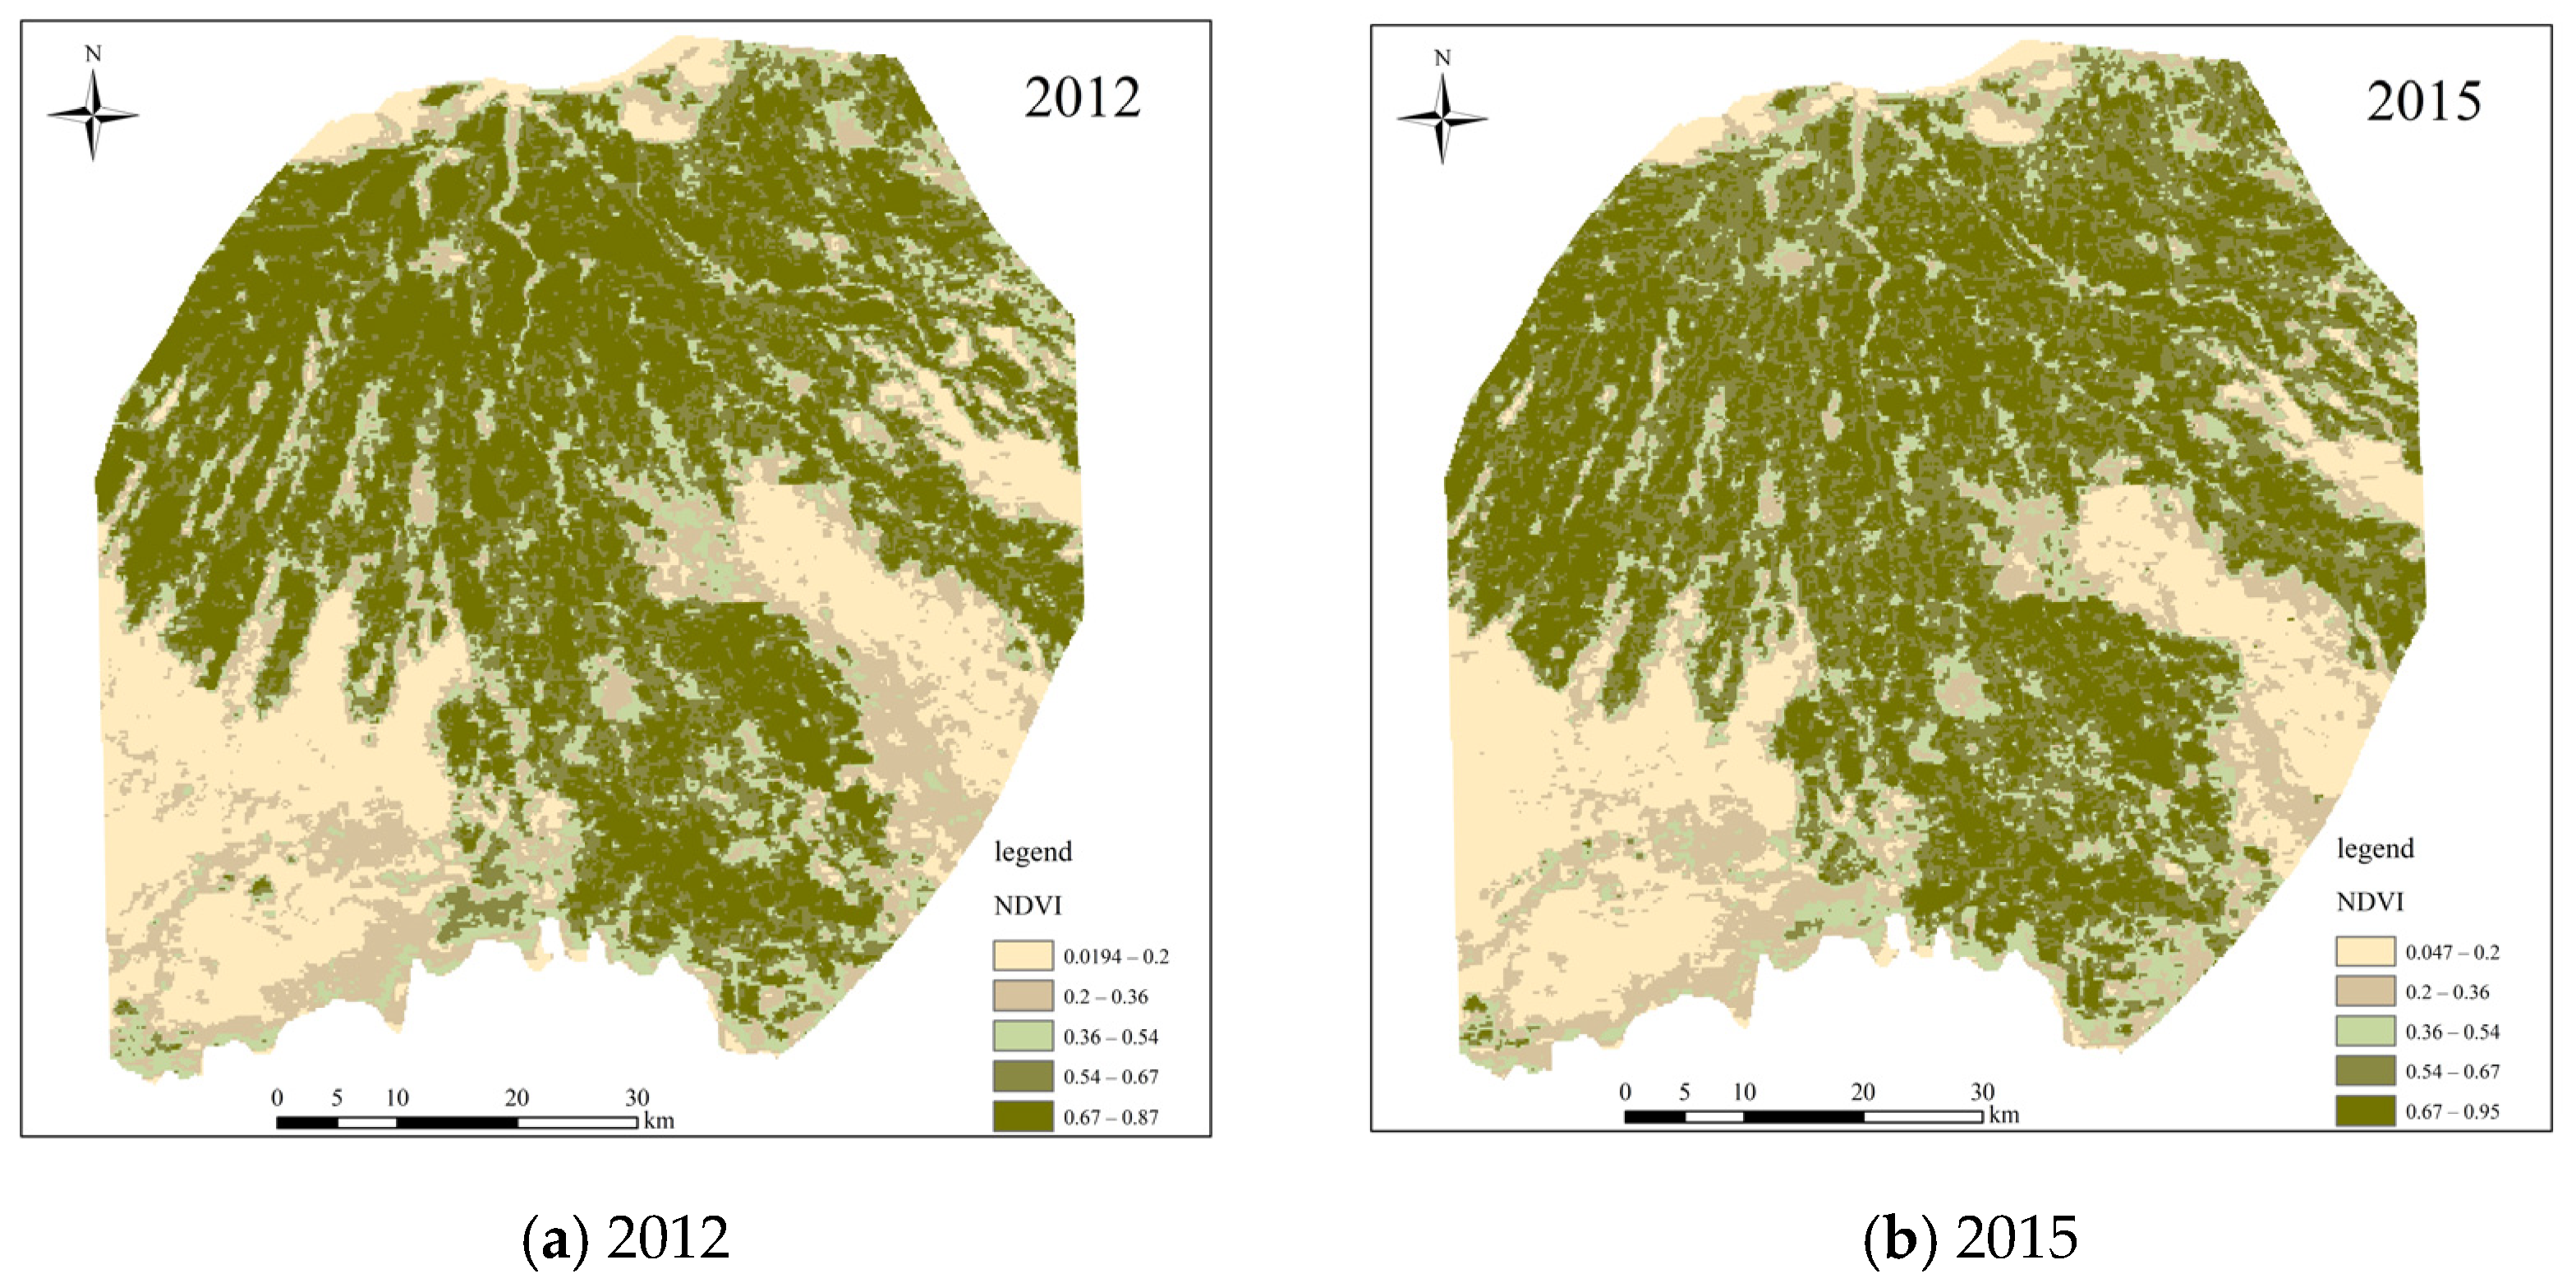
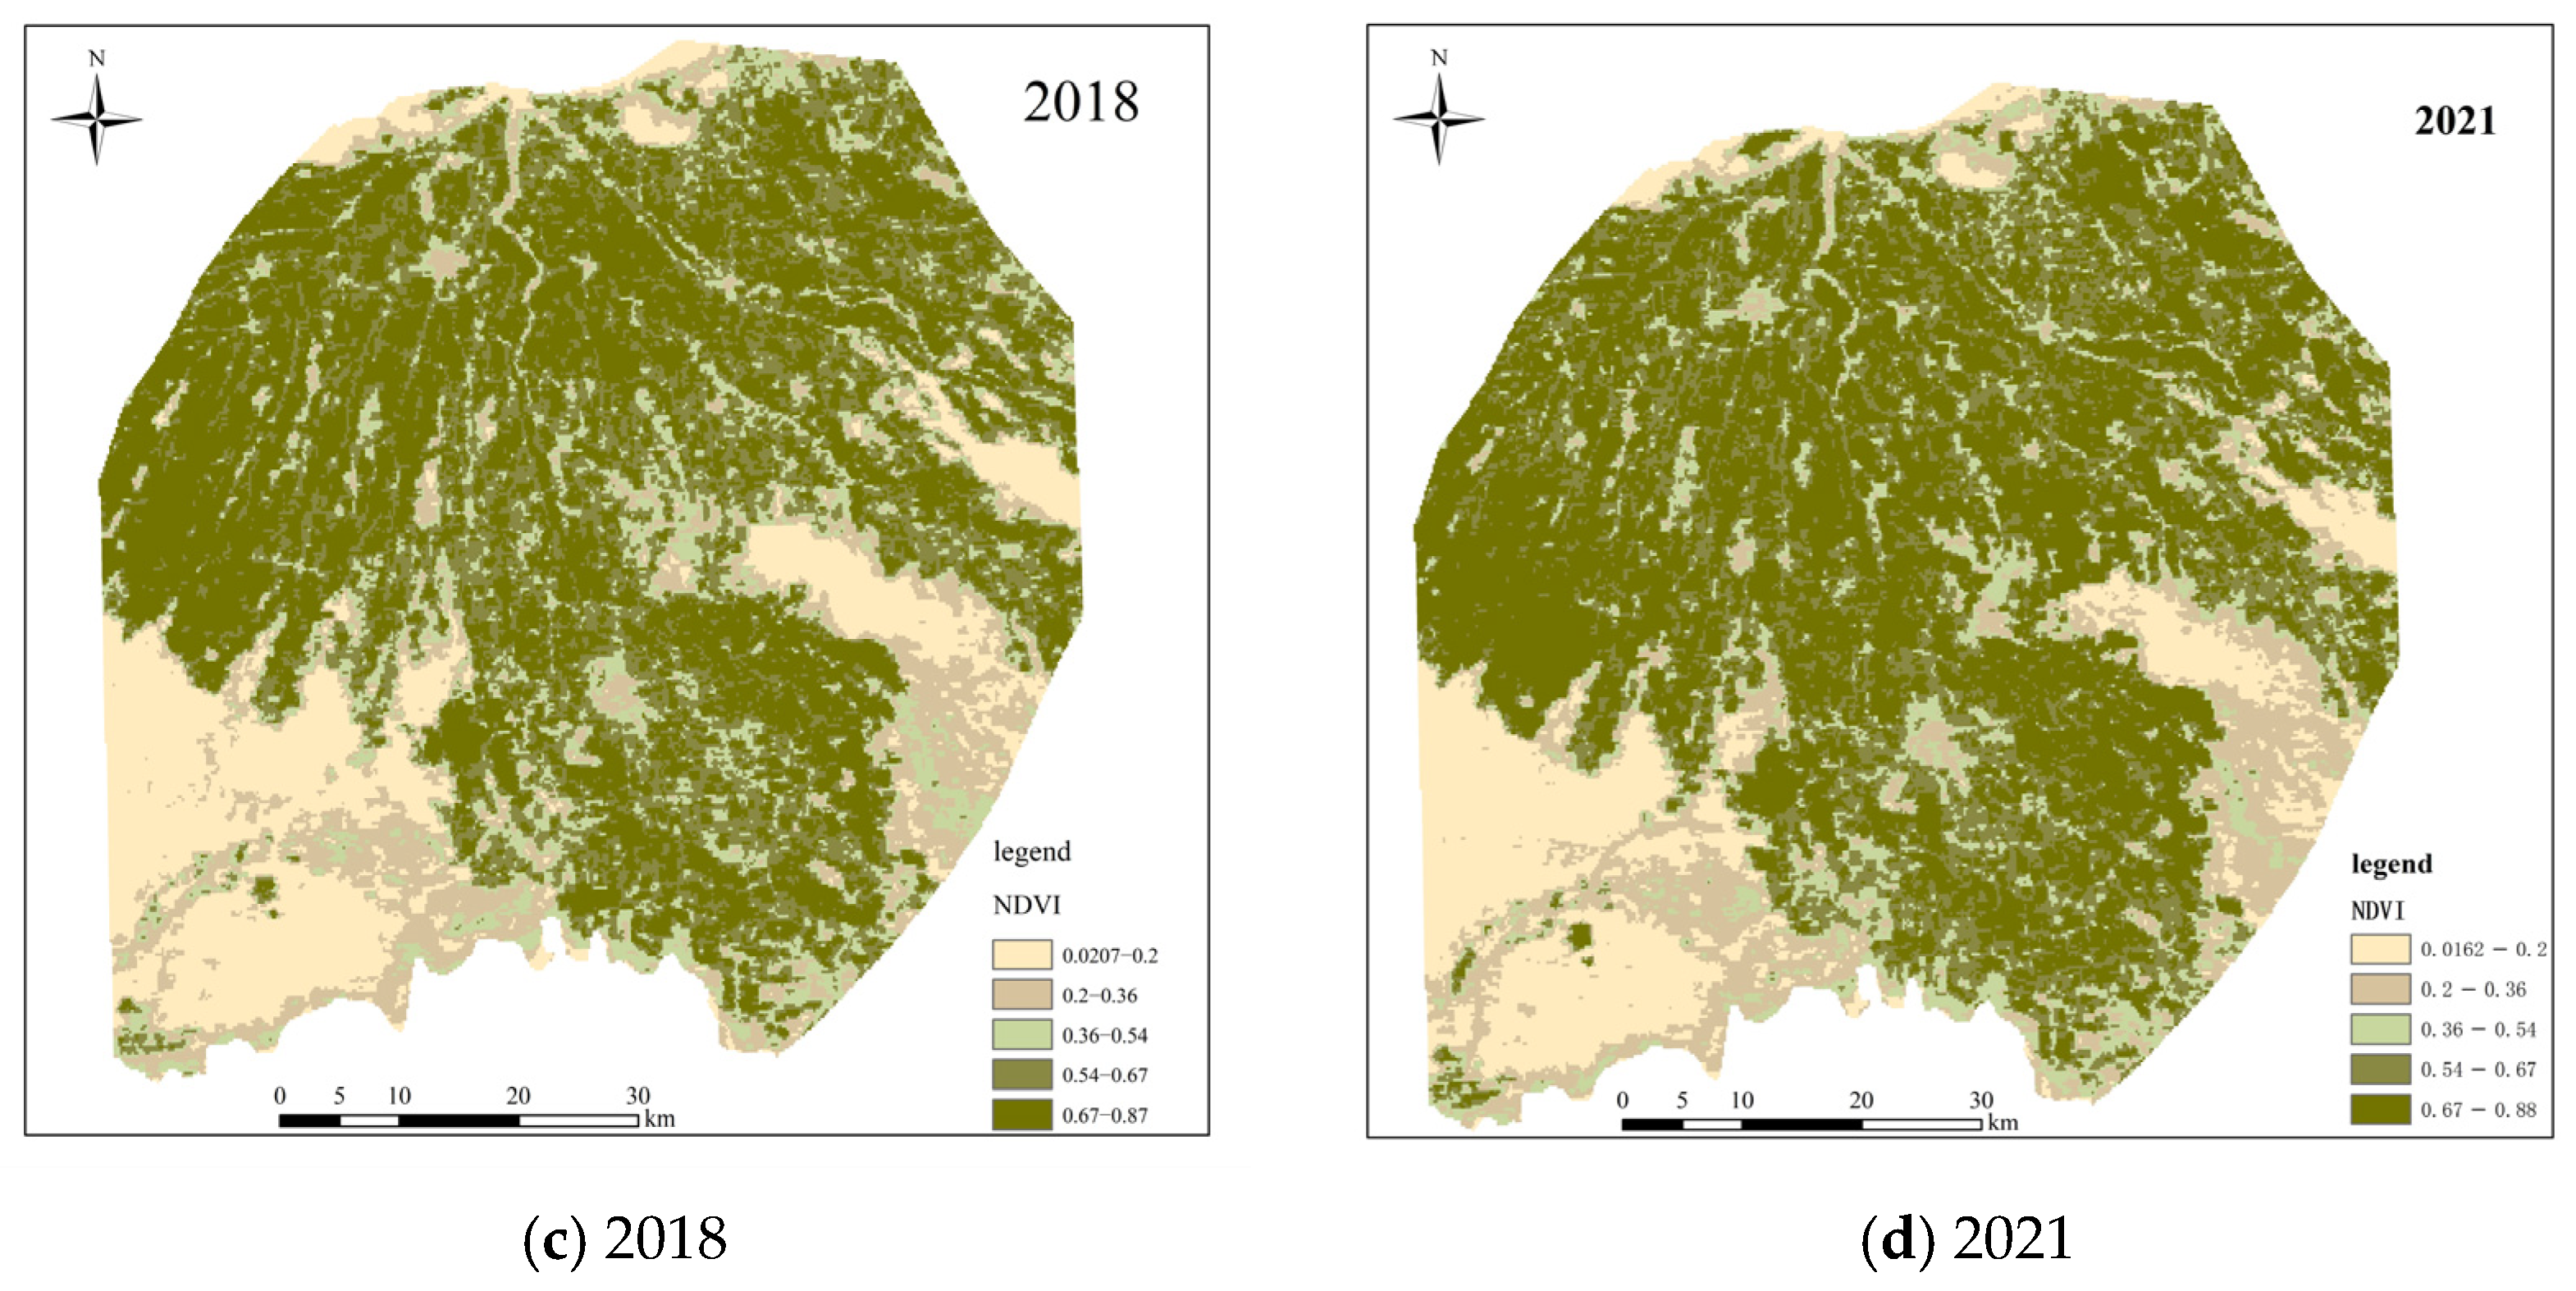
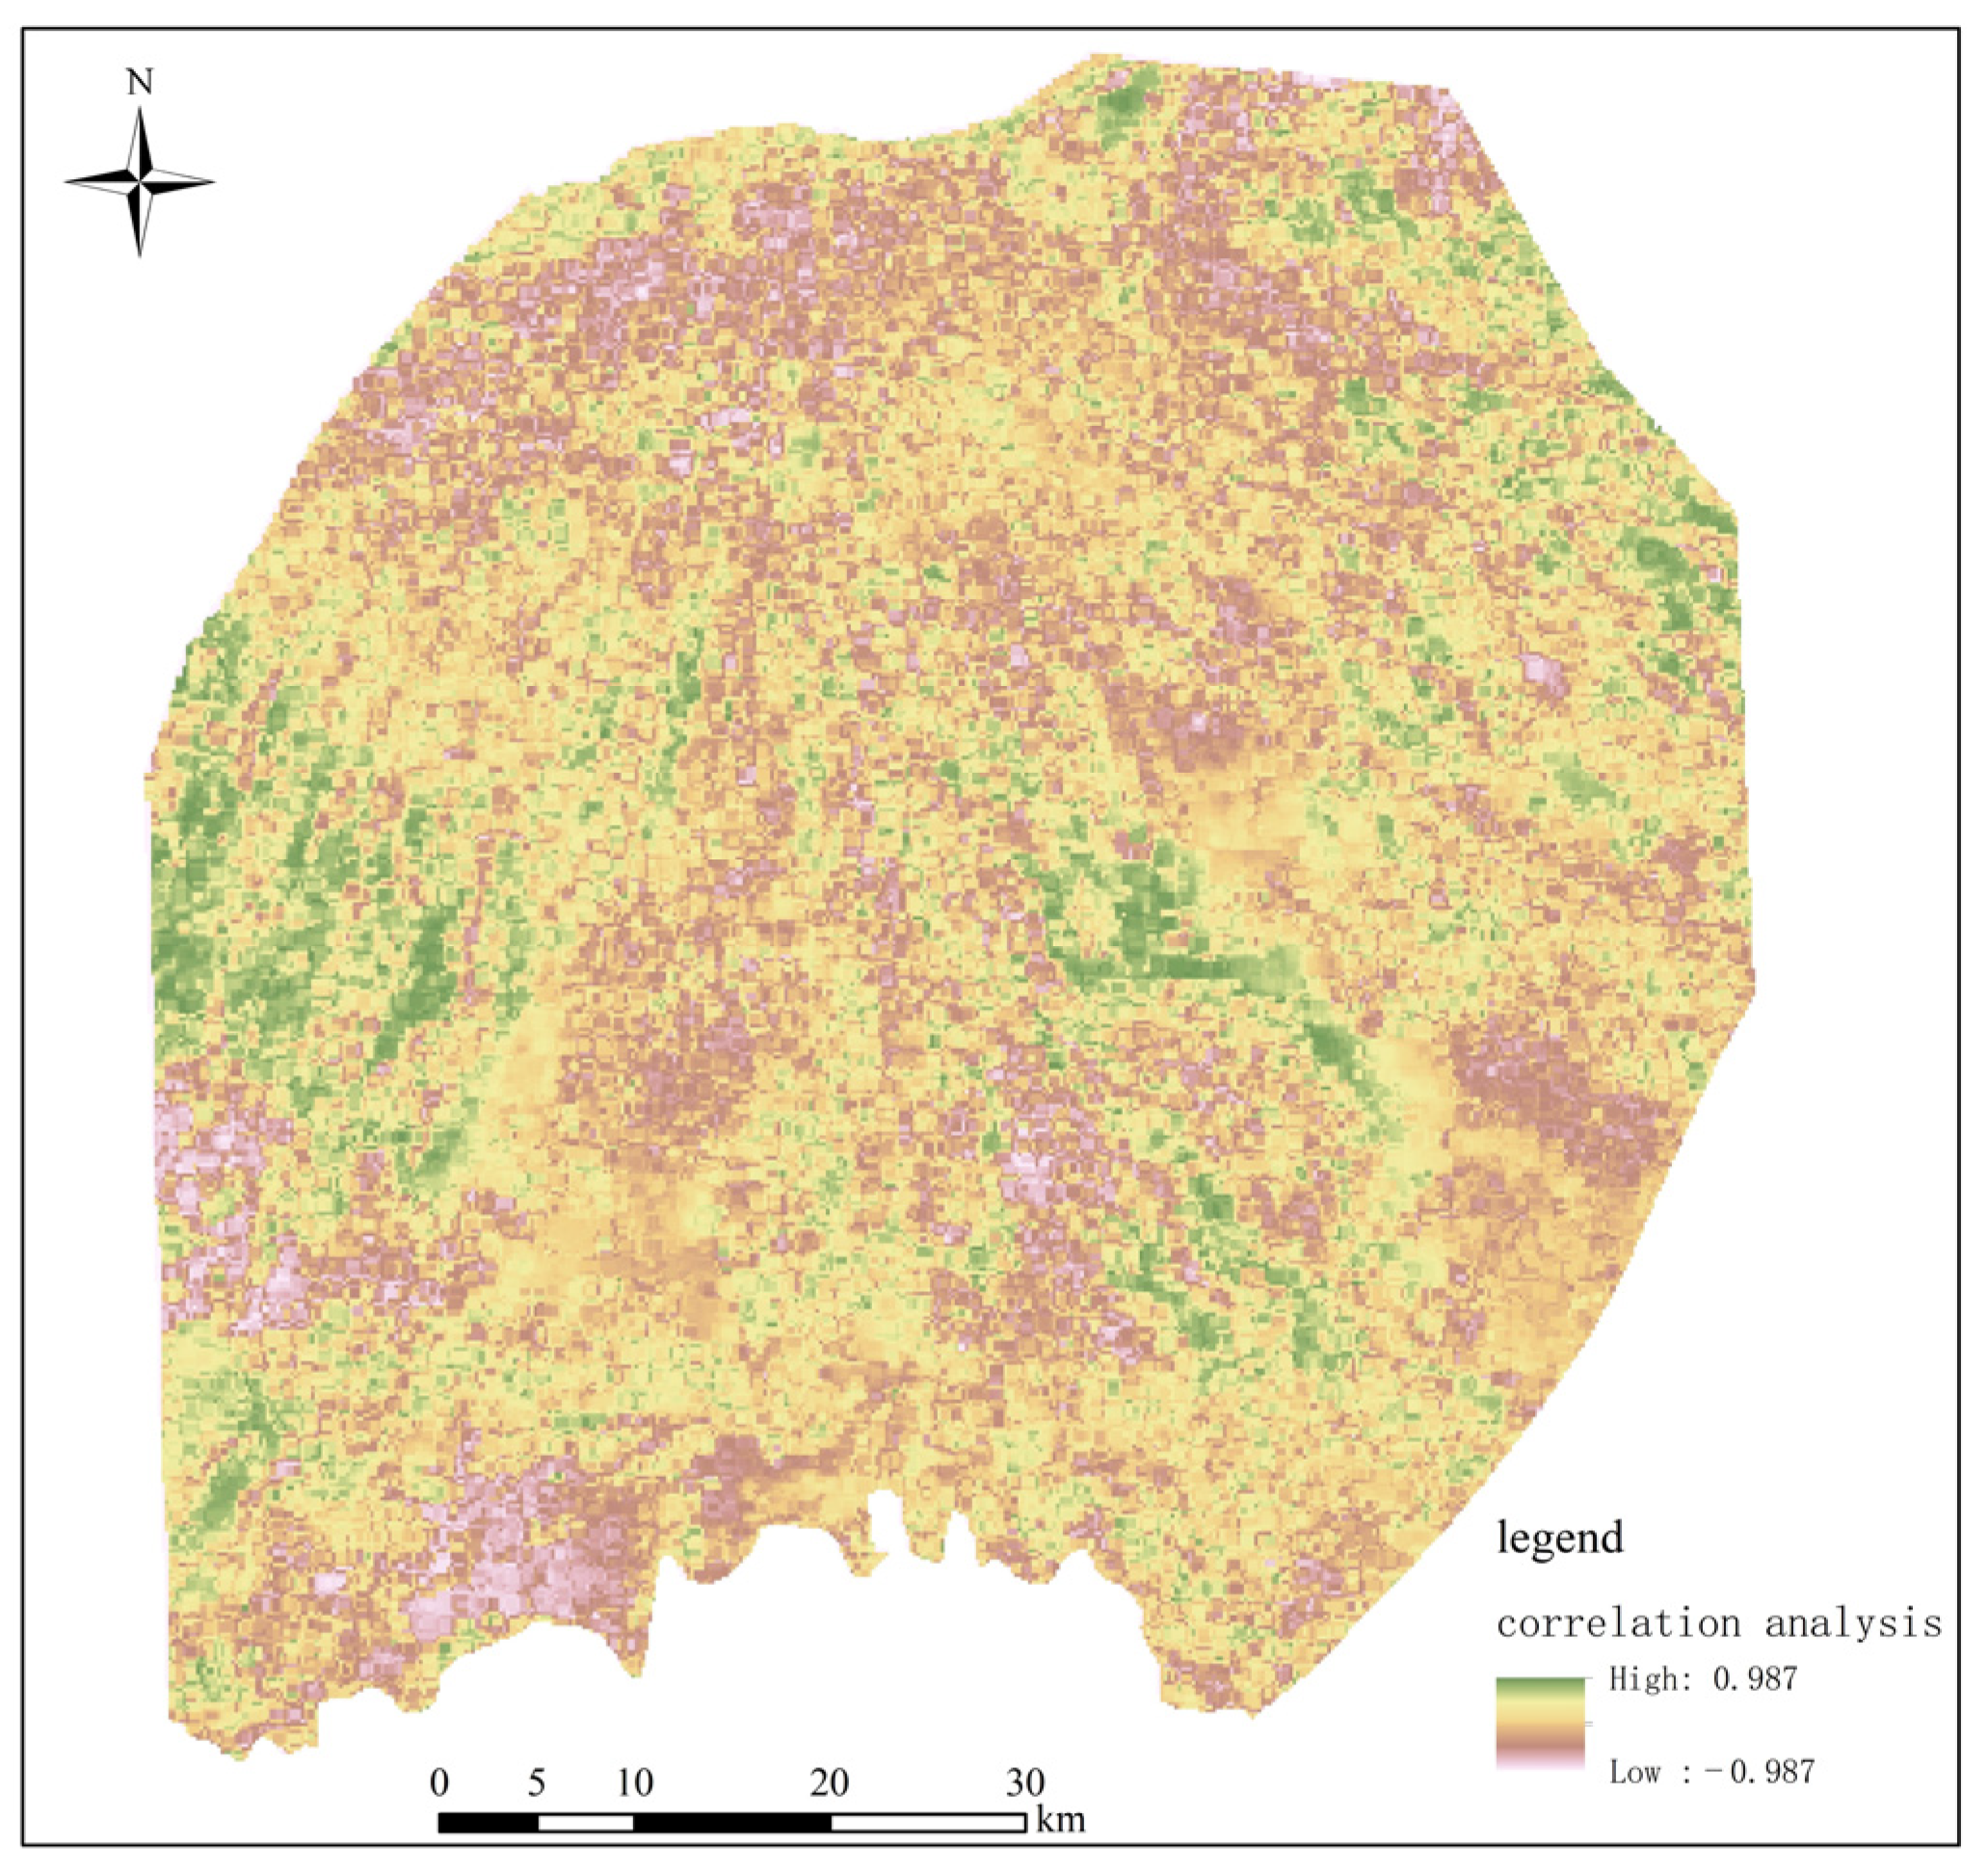
3.4. Spatiotemporal Variation Characteristics of NDVI in the Weigan River Irrigation District

From 2012 to 2021, the NDVI in the Weigan River irrigation district showed an overall growth trend, beginning to increase rapidly after reaching 0.5055 in 2015 and beginning to decrease slightly after reaching a maximum of 0.5574 in 2017, then showing floating growth (Figure 9). The average NDVI in the study area increased from 0.5005 in 2012 to 0.5467 in 2021, with an increase of 0.0461 in 10 years and a growth rate of 0.0047 units/a.
The spatial distribution of the NDVI change trend is shown in Figure 10. As can be seen in the figure, the vegetation in the study area showed a greening trend in general, with a significant increase in NDVI in 63.55% of the vegetation-covered areas (t > 1.96) and a significant decrease in NDVI in only 12.85% of the vegetation-covered areas (t < −1.96). The degraded areas were mainly concentrated in the irrigation areas, which may be related to the adjustment of the crop cultivation structure.
Figure 11 shows the spatial distribution of the annual average NDVI in 2012, 2015, 2018, and 2021. The NDVI in the study area had obvious spatial differentiation characteristics—that is, the NDVI values were higher in the upstream and middle reaches of the irrigation area. Additionally, large areas, except for localized areas with NDVI < 0.2, had an NDVI over 0.36. The NDVI of the downstream irrigation area was generally lower than that of the upstream and middle irrigation areas, and it was concentrated in 0.02–0.36 in some areas for many years.

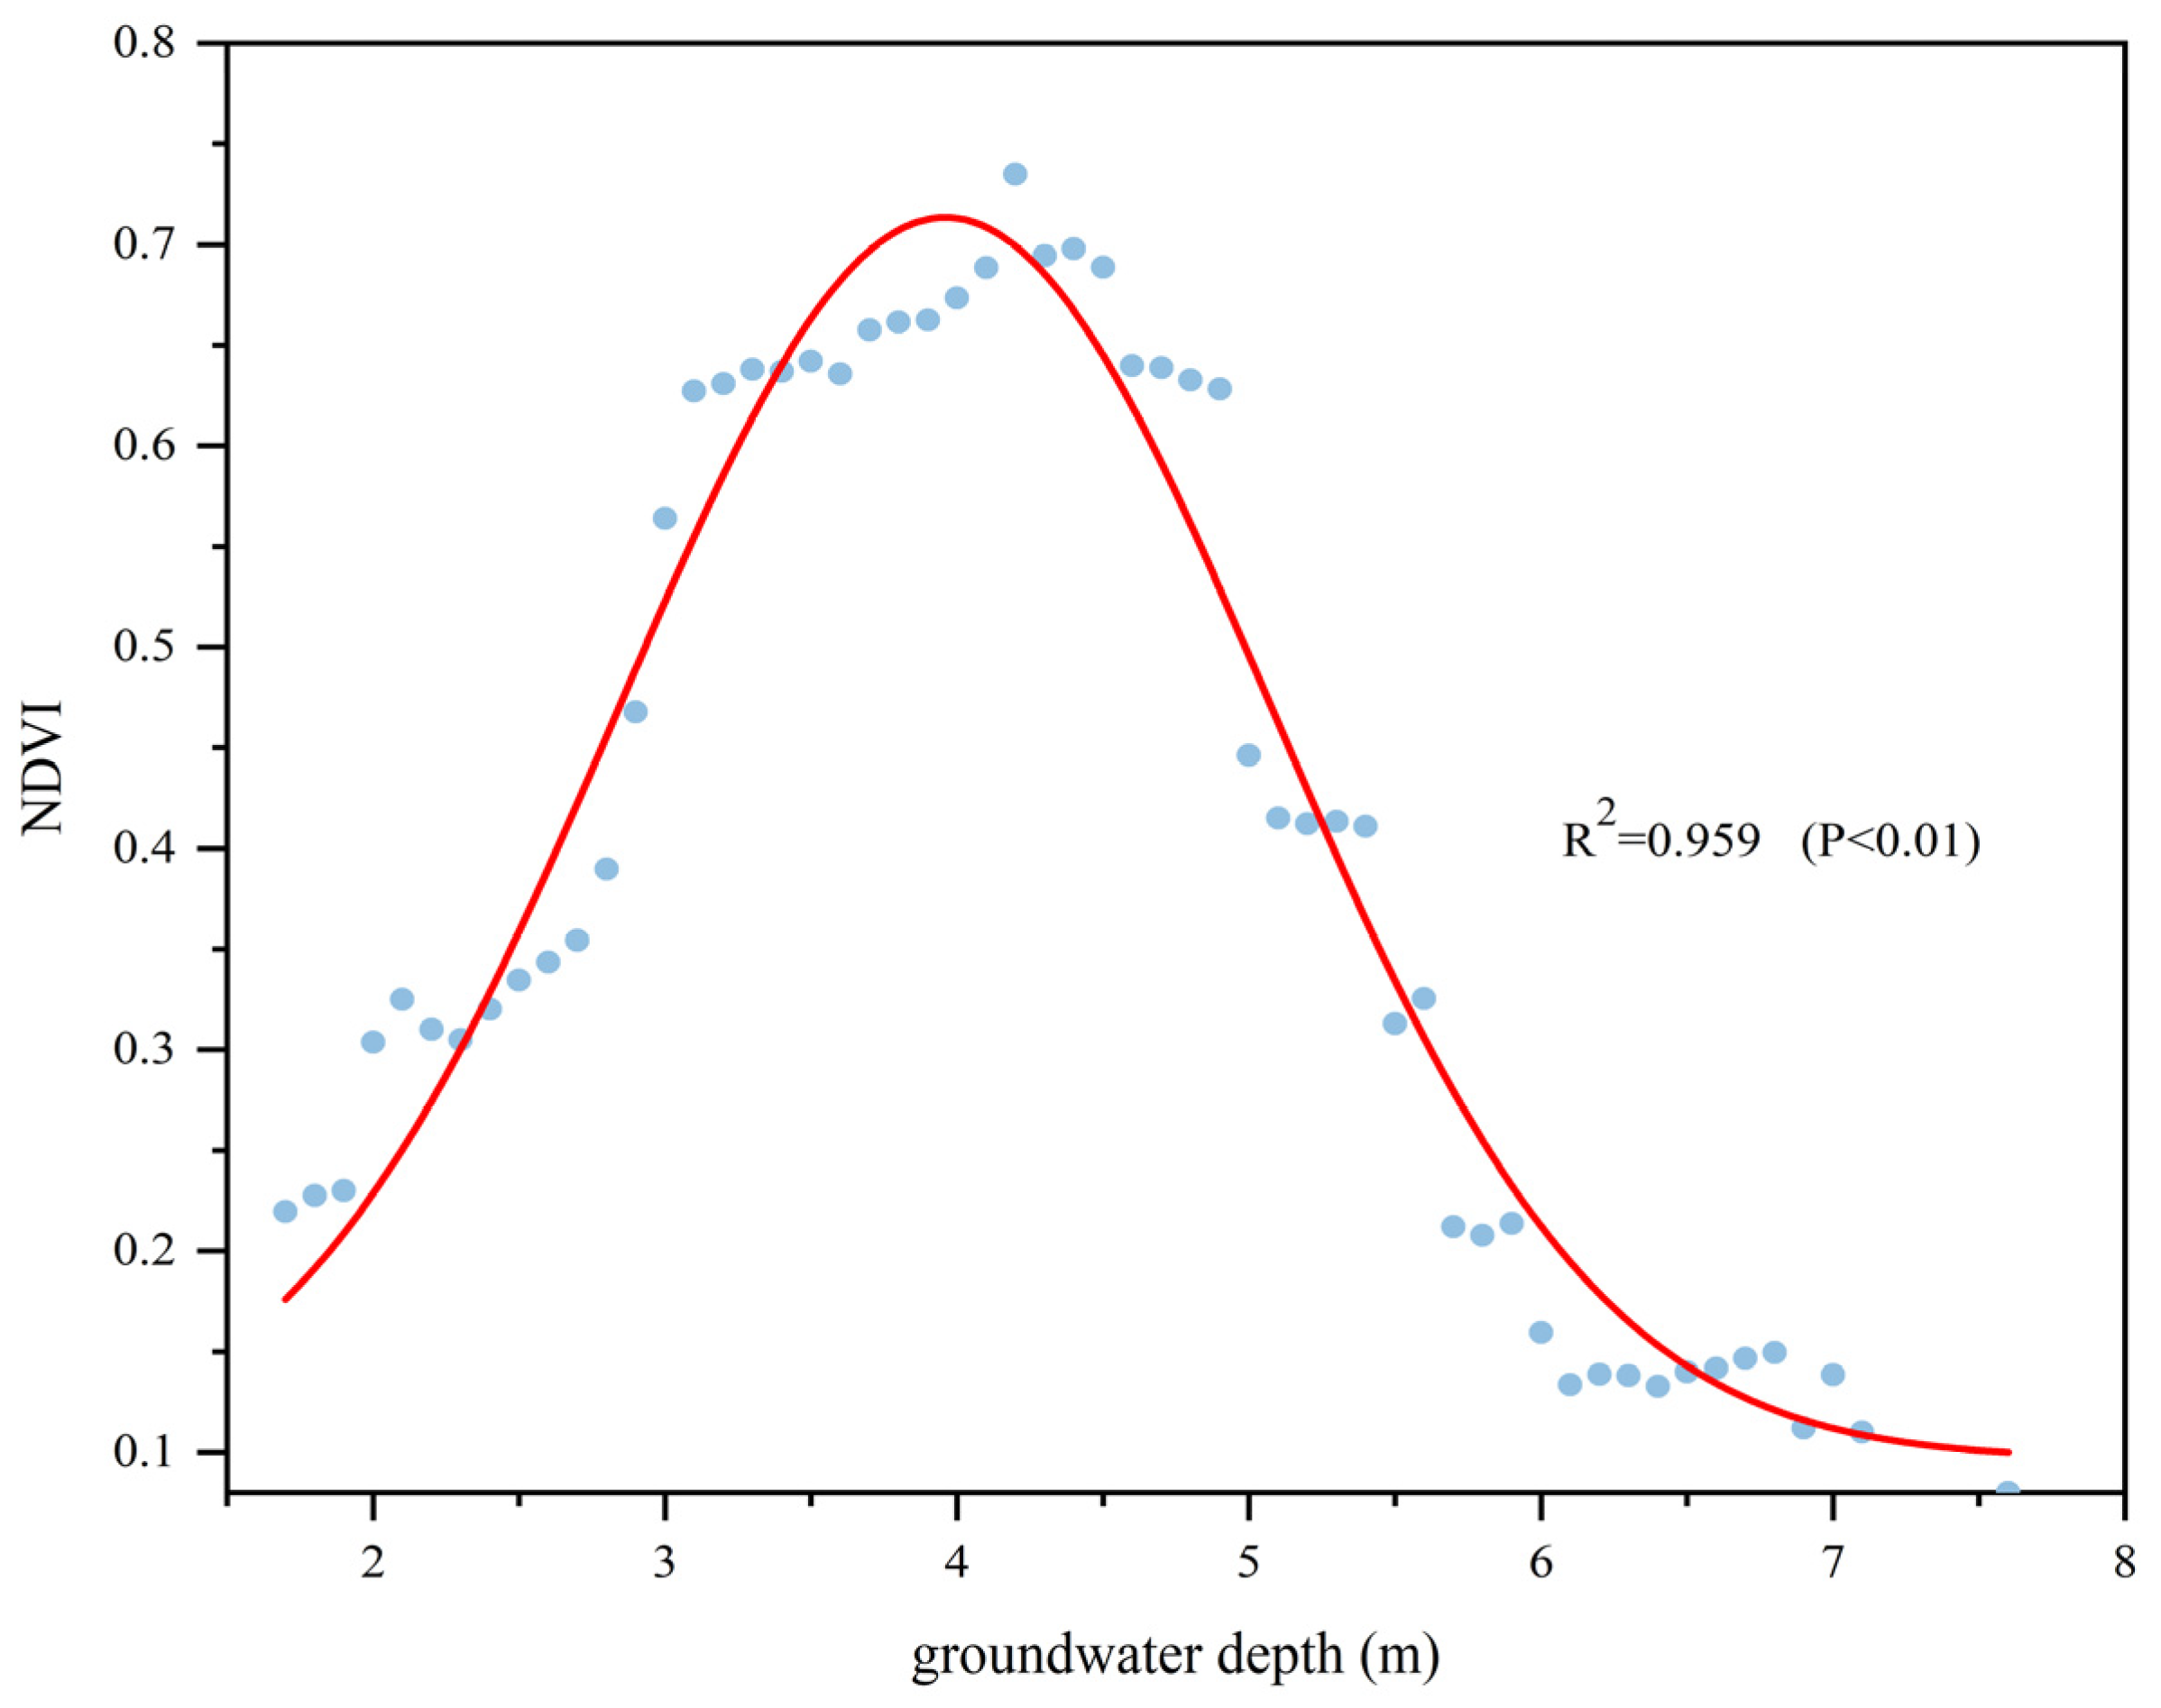
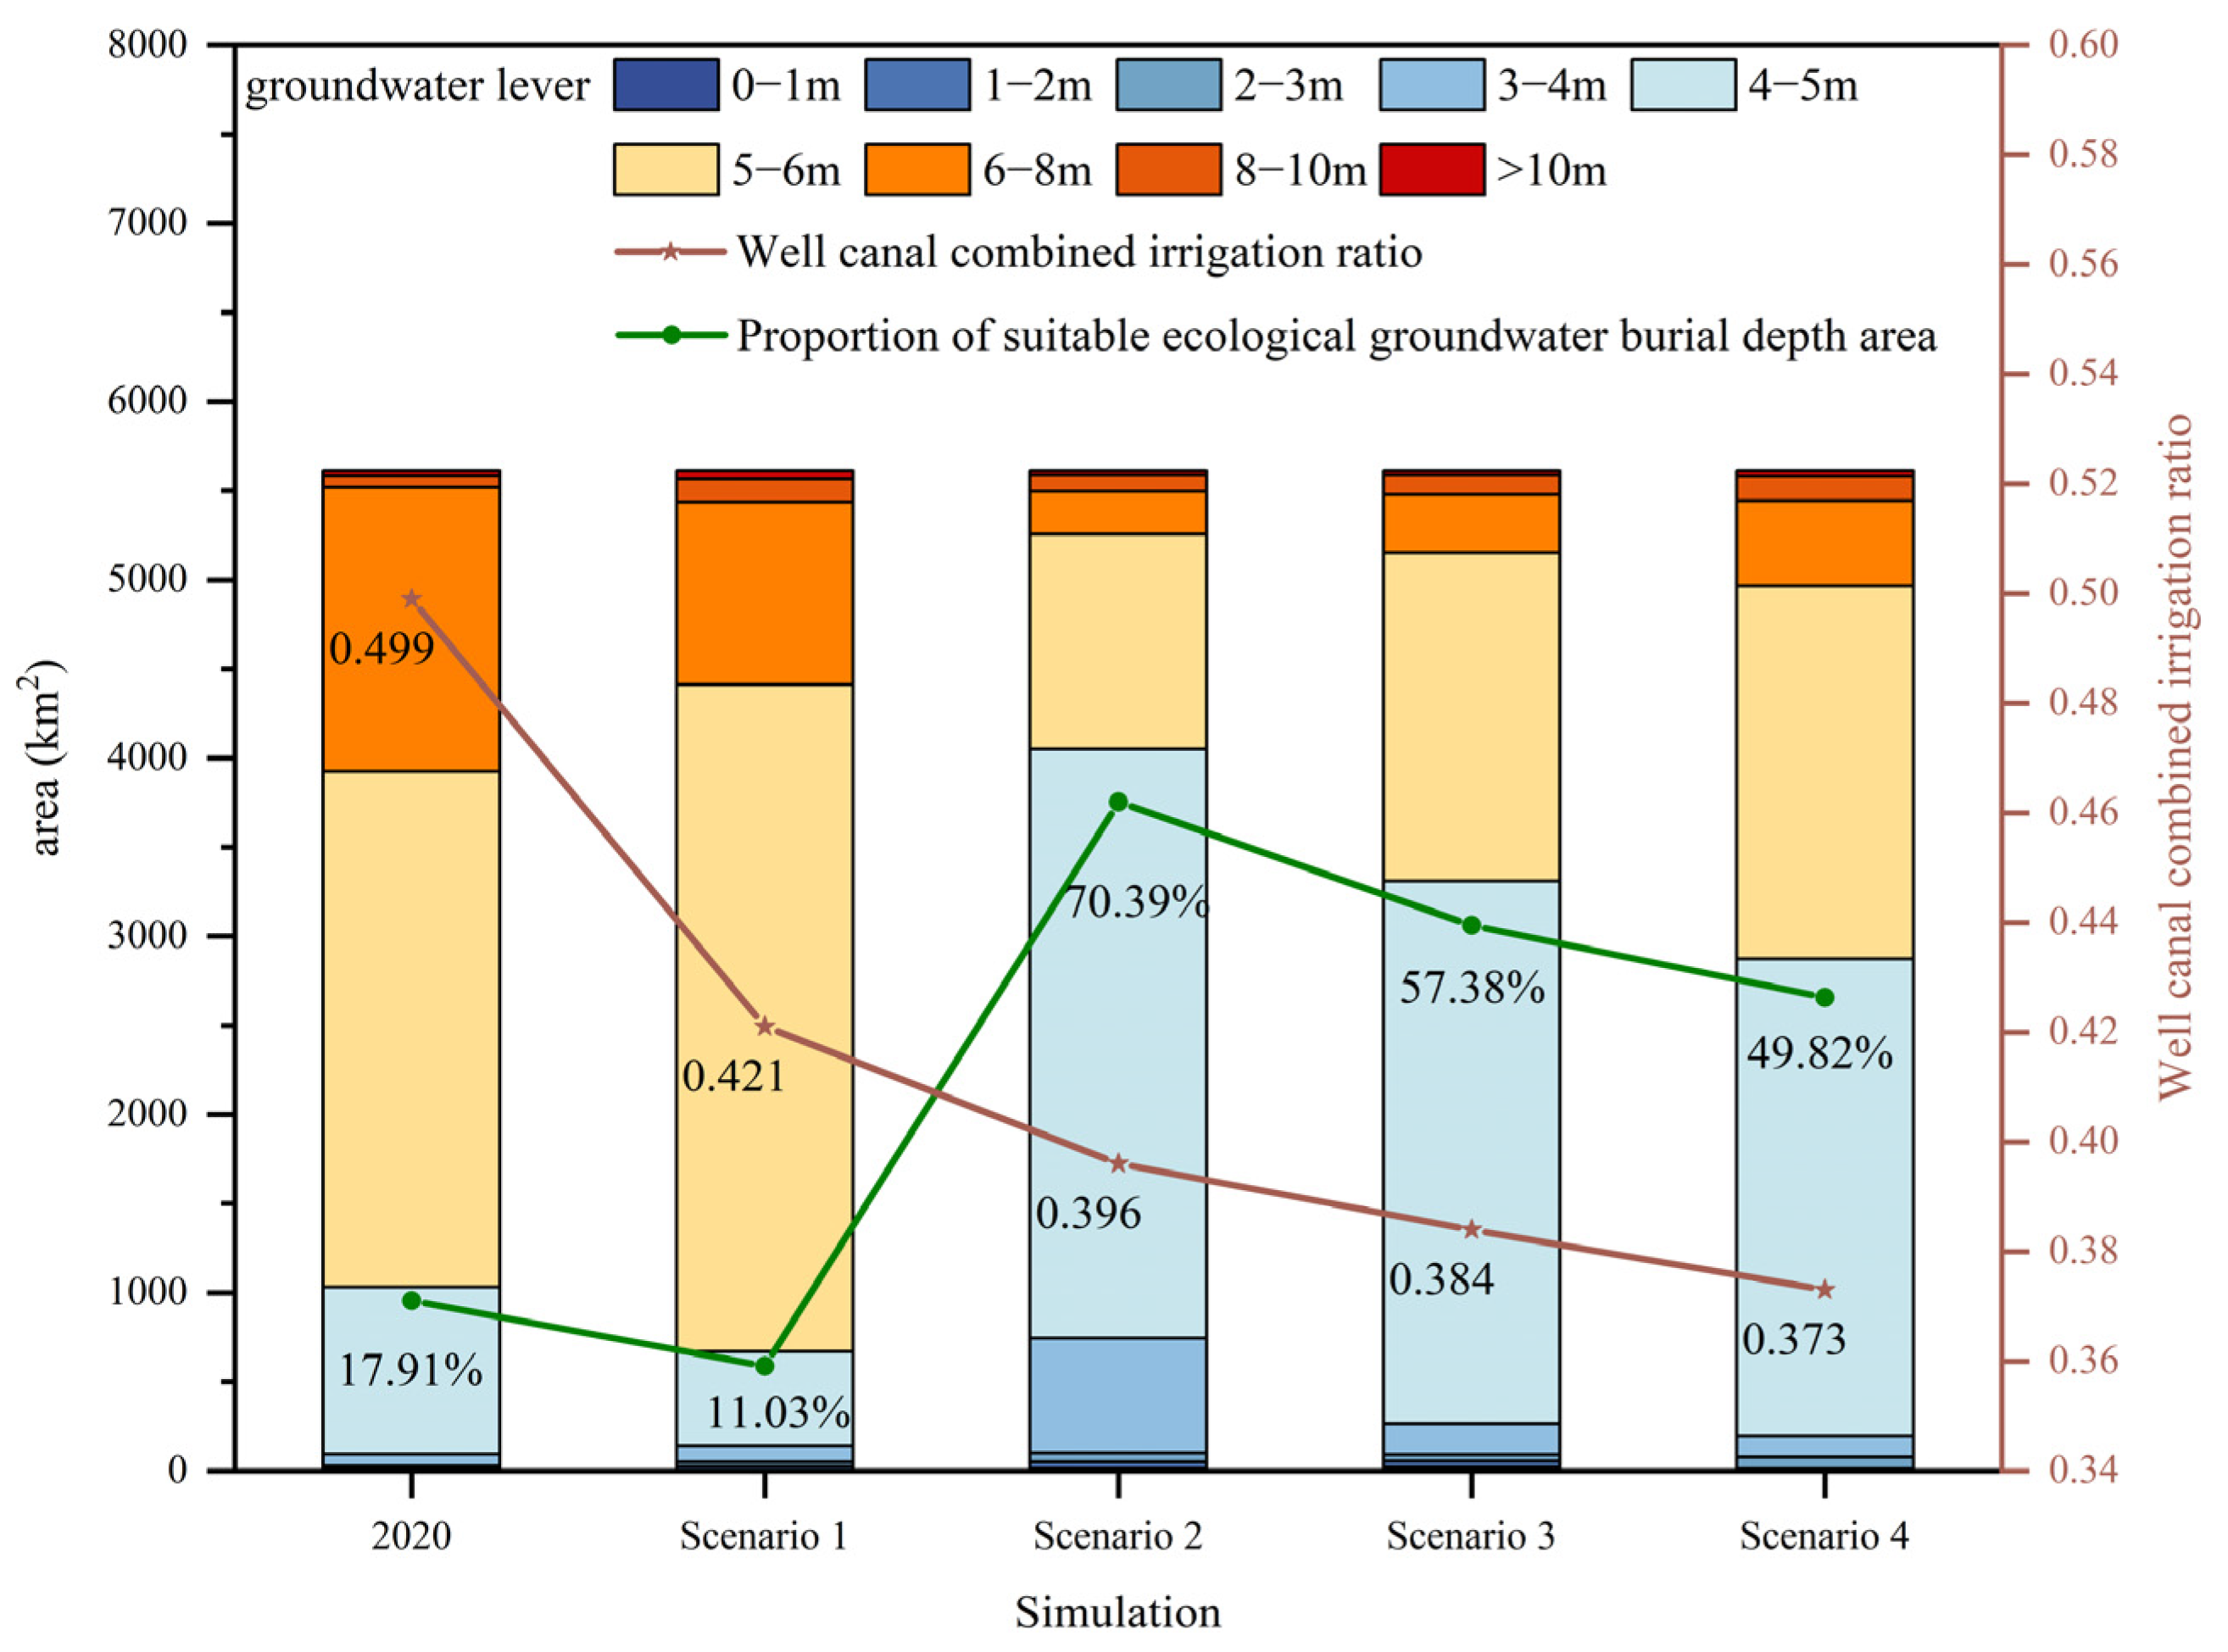
3.5. Analysis of Suitable Groundwater Depth in the Weigan River Irrigation District

The depth of groundwater and the corresponding average value of NDVI were counted at 0.1 m intervals, and the results are shown in Figure 12. When the groundwater depth was less than 4 m, NDVI increased with increasing groundwater depth. When the depth of the groundwater was more than 4 m, NDVI decreased with increasing the depths of groundwater. When the groundwater depth was maintained at 3–5 m, the corresponding NDVI value ranged from 0.564 to 0.731, the vegetation coverage rate was better, and the vegetation was in a good growth condition. When the depth of the groundwater was less than 3 m, although the groundwater recharge was more abundant, the diving evaporation was high, which generates a large amount of water dissipation and may lead to soil salinization, which is not conducive to the growth of vegetation. When the groundwater depth was maintained at 5~6 m, the groundwater depth was greater than the reasonable range suitable for crop growth, it was difficult for the root system of the vegetation to grow using the groundwater, and the vegetation coverage rate decreased accordingly. When the groundwater depth exceeded 6 m, the NDVI was less than 0.2, and the change in groundwater depth had little effect on vegetation coverage.

3.6. Analysis of Suitable Well–Canal Combined Irrigation Ratio in the Weigan River Irrigation District

Under the conditions that the irrigation area of the study region is 3786.17 km2 and the diversion water at the head of the canal is maintained at the current status of 2.3513 billion m3 (2020), the initial constraints kept the net irrigation water consumption unchanged in 2020 (1.9172 billion m3) and ensured that the amount of groundwater extraction did not exceed the recoverable amount of 973.1 million m3. Different well–canal combined irrigation ratio schemes were set by adjusting the effective utilization coefficient of irrigation water and the groundwater mining output in the irrigation area. Using the MODFLOW model to simulate the dynamic changes in the groundwater level, we explored a well–canal combined irrigation system that maintains a suitable ecological groundwater depth (3–5 m). Except for the mining output of groundwater, the boundary conditions of other models in each scheme were consistent with the situation in 2020, and the hydrogeological parameters involved in the MODFLOW model remained unchanged.
A total of four scenarios were formulated for simulation in this study (Table 3), and the effective use coefficient of irrigation water was increased by 0.002, 0.003, 0.004, and 0.005/year, respectively, for a total of fifteen years of simulation. In particular, in Scenario 3 and Scenario 4, since the groundwater exploitation amount is lower than the standard for the extractable quantity of groundwater in 2030, which belongs to the exploitable groundwater range, the groundwater exploitation amount after 2030 is assumed to remain unchanged, and it will still be exploited according to the 2030 exploitation amount. In 2035, the combined irrigation ratio of wells and canals in the four scenarios was adjusted to 0.421, 0.396, 0.384, and 0.373, respectively.
By comparing the groundwater depth maps under the current irrigation scheme (Figure 13) and different combined irrigation schemes (Figure 14), it can be seen that, compared with the current irrigation scheme, the groundwater level in Scenario 1 is rising and the groundwater depth is increasing year by year, and by 2035, the percentage of the area in the ecologically suitable groundwater depth zone decreases from 17.91% to 11.03%, with an overall decrease of 6.88%. The groundwater depth in Scenarios 2–4 has been reduced to varying degrees, in which 70.39% of the area in Scenario 2 is located in the suitable ecological groundwater depth interval, which is the largest proportion of ecological groundwater depth interval area in the four scenario simulations. In Scenario 3 and Scenario 4, the area where the groundwater depth is within the range of suitable ecological groundwater depth accounts for 57.38% and 49.81%, respectively, which is 39.47% and 31.91% higher than that in 2020. Therefore, from the point of view of suitable ecological groundwater depth, the well–canal combined irrigation ratio in Scenario 2 is 0.384, which is relatively suitable in the four scenarios of the Weigan River irrigation district (Figure 15).

4. Discussion

Clarifying the appropriate ratio of well–canal combined irrigation can help maintain the balance of extraction and replenishment of the groundwater system and ecological stability [43,44,45]. In this study, based on the ecological groundwater depth interval derived from the simulation using the MODFLOW model, the appropriate well–canal combined irrigation ratio in the study area is 0.396. It has been shown that in arid and semi-arid zones, alternating irrigation with multiple water sources is conducive to the sustainable use of water resources [46], and that the ratio of the implemented well–canal combined irrigation should not be greater than 0.4 [47,48,49], which also further validates the reasonableness of our simulation results.
Due to the specific climatic characteristics of arid zones with scarce rainfall and strong evaporation, the vegetation relies heavily on groundwater for evapotranspiration [50,51]. As shown in Figure 16, the correlation coefficients between the multi-year average depth of groundwater and NDVI in the irrigation area were in the range of −0.987~0.987. The areas with poor correlation between NDVI and groundwater depth were mostly agricultural fields, and although there was an increasing trend in the ratio of combined well–canal irrigation, canal water was still the main source of irrigation in the local area. Thus, the correlation is not high. For example, in 2018, the well–canal combined irrigation ratio reached a maximum of 0.58, which means that groundwater provided 36.7% of the irrigation water. The areas with strong correlation between NDVI and groundwater depth were mostly ecological forest plantation areas. In this study, the maximum value of NDVI was measured in the groundwater depth of 3–5 m, followed by 2–3 m. When the groundwater depth was greater than 6 m, the value of NDVI was less than 0.2, and with increases in the groundwater depth, NDVI continued to decrease. In the research on the relationship between vegetation growth and groundwater depth response in the arid zone, it has also been shown that the reasonable threshold for the appropriate growth of vegetation crops in the arid zone is 3–5 m [52], and the vegetation begins to suffer from growth stress at a depth of 6 m in the groundwater depth [38,53,54].
According to the “Survey and Evaluation Report of Planned Groundwater Resources in the Weigan River Basin of Aksu Region, Xinjiang”, Populus euphratica is the main ecological forest plantation species in the study area. The suitable groundwater depth for Populus euphratica is 3–5 m, and its stress water level is 6–8 m [54]. This is generally consistent with the pattern depicted in Figure 11, where NDVI shows a positive correlation with groundwater depths below 4 m and NDVI shows a negative correlation with groundwater depths above 4 m. Due to the low rainfall in arid areas such as the study area, groundwater is an important resource for supporting the growth of vegetation; however, the uncontrolled exploitation of groundwater will inevitably destroy the stability of the groundwater flow field in the natural vegetation area, meaning that the depth of the groundwater will continue to increase, resulting in drought stress of natural vegetation and even large-scale extinction [51,54].
There are still several aspects of uncertainty in the current study. First, because the groundwater extraction data obtained so far are the total amount of extraction in the whole irrigation area, the groundwater extraction was uniformly distributed in all grids when the model was built, which means that the results of the analysis of the appropriate well–canal combined irrigation ratio have a certain degree of uncertainty. For example, the buried depth in the upper and middle eastern irrigation areas was 5–8 m, which may be related to the centralized distribution of groundwater extraction. Subsequent research must further collect data on the spatial distribution of the extraction volume to study the spatial distribution characteristics of the appropriate ratio of wells and canals, and to provide better support for management of the local water resources in a refined manner. Second, evaporation is extensive in arid areas; therefore, a large portion of irrigation water is consumed by evaporation. In irrigation areas with shallow groundwater depths, submersible evaporation is also relatively strong. A large amount of evaporation may lead to soil salinization [55], which damages the ecosystem; therefore, it is necessary to incorporate the risk of soil salinization into the analysis of the ratio of suitable wells and canals for combined irrigation. Third, the availability of irrigation water sources was not considered in the scenario analysis. For example, the non-stationary response of surface water and groundwater levels to climatic conditions may make it impossible to achieve an ideal well–canal co-irrigation ratio in some seasons, and there may be a difference between the ideal well–canal co-irrigation ratio and the feasible well–canal co-irrigation ratio, which needs to be further analyzed.
Although the dynamic change in NDVI reflects the change in vegetation growth, it is worth noting that at present, most groundwater models do not show the input information regarding vegetation dynamics, nor can they display the complex coupling relationship between simulated vegetation dynamics and the groundwater system. Instead, the groundwater model is driven by input precipitation infiltration recharge, evaporation, and transpiration; therefore, the simulation and analysis results are uncertain, and water resource management measures are not formulated through dynamics. Groundwater models that tightly couple land use and vegetation information will be a valuable topic in the field of groundwater numerical simulation in the future.

5. Conclusions

(1) From 2012 to 2021, the groundwater depth in 82.9% of the area of the Weigan River irrigation district increased, and the average groundwater depth increased from 4.47 m in 2012 to 6.43 m in 2021, with an increase of 1.96 m. In the past 10 years, the groundwater depth in the upstream area has always been higher than that in the middle and lower reaches.
(2) The vegetation cover of the Weigan River irrigation district from 2012 to 2021 generally increased but fluctuated between years, and the spatial distribution of NDVI in the study area had obvious spatial differentiation characteristics and regional imbalances—that is, the NDVI value was higher in the upstream area and the middle reaches of the regional irrigation area, whereas the downstream regional irrigation area had a lower average value of NDVI compared with the upstream and the middle reaches of the regional irrigation area.
(3) When the groundwater depth in Weigan River irrigation district was less than 4 m, the NDVI increased with increasing groundwater depth, and when the groundwater depth was more than 4 m, the NDVI decreased with the increasing groundwater depth. The depth of the groundwater in the Weigan River irrigation district that was suitable for the growth of vegetation in the irrigation area ranged from 3 to 5 m, and the value of NDVI within this range concentrated around 0.564–0.731, with a good state of growth of vegetation.
(4) The well–canal combined irrigation ratio in the Weigan River irrigation district changed dramatically from 2012 to 2014, and the irrational extraction and replenishment relationship led to a rapid increase in the depth of the groundwater. Based on the constraints of suitable groundwater depth and exploitable amount, it is concluded that the appropriate ratio of combined well and canal irrigation in the Weigan River irrigation district is 0.396.

Author Contributions

Conceptualization, A.L.; methodology, W.Z. and X.D.; software, W.Z. and W.L.; validation, A.L., J.Z., Y.X., C.R. and W.L.; formal analysis, W.Z.; investigation, W.Z., X.D. and A.L.; resources, A.L. and X.D.; data curation, W.Z., X.D., A.L. and J.Z.; writing—original draft preparation, W.Z.; writing—review and editing, W.Z., X.D. and A.L.; visualization, W.Z., X.D. and W.L.; supervision, A.L.; project administration, A.L. and X.D.; funding acquisition, A.L. and X.D. All authors have read and agreed to the published version of the manuscript.

Funding

This study was conducted under the Xinjiang Third Scientific Expedition Program. It was supported by the Hydrology and Water Resources Survey and Water Resources Security Assessment of the Basin (Approval No. 2022xjkk0103; No. 2021xjkk0406) and the National Natural Science Foundation of China (Grant No. 52179028).

Institutional Review Board Statement

Not applicable.

Informed Consent Statement

Not applicable.

Data Availability Statement

Not applicable.

Conflicts of Interest

The authors declare no conflict of interest.

Appendix A

Table A1. Record sheet of double-ring field experiment in Xinhe County, Weigan River irrigation area.
Name of Water Source Area: Weigan River Irrigation DistrictTest Number: 1
Location: Xinhe CountyDate: 22 February 2023, 13:17
Coordinates: 41°37′32″ N, 82°34′54″ E
Experimental Water Addition FrequencyTime
(min)
Water Addition (cm3)Infiltration Flow Rate (cm3/min)Permeability
Coefficient
(m/d)
1532064.00 2.94
2529559.00 2.71
31055555.50 2.55
41052052.00 2.38
51570046.67 2.14
61568045.33 2.08
72086543.25 1.98
82086043.00 1.97
930129043.00 1.97
1030129043.00 1.97
Table A2. Record sheet of double-ring field experiment in Shaya County, Weigan River irrigation area.
Name of Water Source Area: Weigan River Irrigation DistrictTest Number: 2
Location: Shaya CountyDate: 23 February 2023, 14:50
Coordinates: 41°17′32″ N, 82°50′01″ E
Experimental Water Addition FrequencyTime
(min)
Water Addition cm3Infiltration Flow Rate (cm3/min)Permeability
Coefficient
(m/d)
1525050.00 2.29
2522044.00 2.02
31045045.00 2.06
41038038.00 1.74
51546030.67 1.41
61545030.00 1.38
72054027.00 1.24
82053526.75 1.23
93080526.83 1.23
103080526.83 1.23
Table A3. Record sheet of double-ring field experiment in Kuqa City, Weigan River irrigation district.
Name of Water Source Area: Weigan River Irrigation DistrictTest Number: 3
Location: Kuqa CityDate: 24 February 2023, 8:12
Coordinates: 41°30′45″ N, 83°21′52″ E
Experimental Water Addition FrequencyTime
(min)
Water Addition cm3Infiltration Flow Rate (cm3/min)Permeability
Coefficient
(m/d)
1539078.00 3.58
2533066.00 3.03
31063063.00 2.89
41060060.00 2.75
51579052.67 2.42
61578052.00 2.38
72097048.50 2.22
82096548.25 2.21
930144548.17 2.21
1030144548.17 2.21

References

  1. Ma, Y.; Tashpolat, N. Remote sensing monitoring of soil salinity in Weigan River-Kuqa River Delta Oasis based on two-dimensional feature space. Water 2023, 15, 1694. [Google Scholar] [CrossRef]
  2. Liu, T.; Shao, F.; Zhang, Z.; Li, T. Fluorine-rich shallow groundwater in Weigan River Basin (Xinjiang): Enrichment Factors and Spatial Distribution. Water 2023, 15, 926. [Google Scholar] [CrossRef]
  3. Thevs, N.; Peng, H.; Rozi, A.; Zerbe, S.; Abdusalih, N. Water allocation and water consumption of irrigated agriculture and natural vegetation in the Aksu-Tarim River Basin, Xinjiang, China. J. Arid. Environ. 2015, 112, 87–97. [Google Scholar] [CrossRef]
  4. Yiti, K. Analysis of groundwater level and water quality measurement in Kuche County. Shaan. Water Resour. 2022, 3, 111–2+5. (In Chinese) [Google Scholar]
  5. Wang, Q.; Hu, T.; Rui, S.; Chu, M.; Jiang, Y. Multi-objective optimal allocation of water resources in canal and well combined irrigation district based on simulation and optimization model. Water Sav. Irrig. 2022, 9, 30–38. (In Chinese) [Google Scholar]
  6. Xu, F.; Wang, Q.; Duan, Y.; Jiang, Y.; Pan, J. Quantification of canal and well irrigation water usage ratio in irrigation district based on a social hydrological model considering farmers’ irrigation behavior. Water Sav. Irrig. 2021, 11, 47–54+60. (In Chinese) [Google Scholar]
  7. Wang, L. Area Ratio of Canal to Well Irrigation Areas for Combined Use of Groundwater and Surface Water in Hetao Irrigation District. Master’s Thesis, Wuhan University, Wuhan, China, 2018. (In Chinese). [Google Scholar]
  8. Liu, S.; Wang, W.; Qu, S.; Zheng, Y.; Li, W. Specific types and adaptability evaluation of managed aquifer recharge for irrigation in the North China Plain. Water 2020, 12, 562. [Google Scholar] [CrossRef]
  9. Zhou, W.; Zeng, F. The groundwater level forecast and the rational ratio analysis for irrigation district with both wells and canals. J. Irrig. Drain. 2006, 1, 6–9. (In Chinese) [Google Scholar]
  10. Zhang, X. Conjunctive surface water and groundwater management under climate change. Front. Environ. Sci. 2015, 3, 59. [Google Scholar] [CrossRef]
  11. Mani, A.; Tsai, F.; Kao, S.; Naz, B.; Ashfaq, M.; Rastogi, D. Conjunctive management of surface and groundwater resources under projected future climate change scenarios. J. Hydrol. 2016, 540, 397–411. [Google Scholar] [CrossRef]
  12. Wang, K.; Chen, H.; Fu, S.; Li, F.; Wu, Z.; Xu, D. Analysis of exploitation control in typical groundwater over-exploited area in North China Plain. Hydrol. Sci. J. 2021, 66, 851–861. [Google Scholar] [CrossRef]
  13. Yue, W.; Zhan, C. A large-scale conjunctive management model of water resources for an arid irrigation district in China. Hydrol. Res. 2013, 44, 926–939. [Google Scholar] [CrossRef]
  14. Li, P.; Qian, H.; Wu, J. Conjunctive use of groundwater and surface water to reduce soil salinization in the Yinchuan Plain, North-West China. Int. J. Water Resour. Dev. 2018, 34, 337–353. [Google Scholar] [CrossRef]
  15. Liu, Y.; Zhu, Y.; Mao, W.; Sun, G.; Han, X.; Wu, J.; Yang, J. Development and application of a water and salt balance model for well-canal conjunctive irrigation in semiarid areas with shallow water tables. Agriculture 2022, 12, 399. [Google Scholar] [CrossRef]
  16. El-Rawy, M.; Zlotnik, V.; Al-Raggad, M.; Al-Maktoumi, A.; Kacimov, A.; Abdalla, O. Conjunctive use of groundwater and surface water resources with aquifer recharge by treated wastewater: Evaluation of management scenarios in the Zarqa River Basin, Jordan. Environ. Earth Sci. 2016, 75, 1146. [Google Scholar] [CrossRef]
  17. Li, Z.; Quan, J.; Li, X.; Wu, X.; Wu, H.; Li, Y.; Li, G. Establishing a model of conjunctive regulation of surface water and groundwater in the arid regions. Agric. Water Manag. 2016, 174, 30–38. [Google Scholar] [CrossRef]
  18. Seo, S.; Mahinthakumar, G.; Sankarasubramanian, A.; Kumar, M. Conjunctive management of surface water and groundwater resources under drought conditions using a fully coupled hydrological model. J. Water Resour. Plan. Manag. 2018, 144, 04018060. [Google Scholar] [CrossRef]
  19. Peng, P.; Wang, L.; He, B.; Yang, J.; Yu, J.; Zhu, Y. Improvement of the method for determining the regional distribution of the combination of wells and canals in Hetao irrigation district. China Rural Water Hydropower 2016, 9, 153–158. (In Chinese) [Google Scholar]
  20. Guo, F.; Guo, X.; Yuan, J.; Chen, Z.; Liu, Z.; Wang, Q. Advances in effects research of groundwater level on crop. China Rural Water Hydropower 2008, 1, 63–66. (In Chinese) [Google Scholar]
  21. Ma, X.; Li, R.; Li, X.; Pan, H.; Wang, X.; Li, Y. Combined effects of groundwater depth and soil salinization on enhanced vegetation index in Hetao irrigation area. Agric. Res. Arid Areas 2023, 41, 134–141+165. (In Chinese) [Google Scholar]
  22. Chen, C.; Park, T.; Wang, X.; Piao, S.; Xu, B.; Chaturvedi, R.; Fuchs, R.; Brovkin, V.; Ciais, P.; Fensholt, R.; et al. China and India lead in greening of the world through land-use management. Nat. Sustain. 2019, 2, 122–129. [Google Scholar] [CrossRef] [PubMed]
  23. Liu, T.; Sun, H.; Lu, B.; Zhang, L.; Yang, H.; Wu, F. Spatial-temporal variation and driving force analysis of vegetation coverage in the lli River Valley of Xinjiang from 1998 to 2018. J. N. For. Univ. 2023, 51, 68–74+79. (In Chinese) [Google Scholar]
  24. Xue, J.; Su, B. Significant remote sensing vegetation indices: A review of developments and applications. J. Sens. 2017, 2017, 1353691. [Google Scholar] [CrossRef]
  25. Peng, D.; Zhang, H.; Yu, L.; Wu, M.; Wang, F.; Huang, W.; Liu, L.; Sun, R.; Li, C.; Wang, D.; et al. Assessing spectral indices to estimate the fraction of photosynthetically active radiation absorbed by the vegetation canopy. Int. J. Rem. Sens. 2018, 39, 8022–8040. [Google Scholar] [CrossRef]
  26. Tong, X.; Yang, Z.; Zhang, Y.; Wu, Y.; Duan, L. Estimation of pasture aboveground biomass using different orders of differential hyperspectral vegetation indices. Acta Agrestia Sin. 2022, 30, 2438–2448. (In Chinese) [Google Scholar]
  27. Martín-Ortega, P.; García-Montero, L.; Sibelet, N. Temporal patterns in illumination conditions and its effect on vegetation indices using Landsat on Google Earth Engine. Remote Sens. 2020, 12, 211. [Google Scholar] [CrossRef]
  28. Sun, C.; Li, J.; Cao, L.; Liu, Y.; Jin, S.; Zhao, B. Evaluation of vegetation index-based curve fitting models for accurate classification of salt marsh vegetation using sentinel-2 time-series. Sensors 2020, 20, 5551. [Google Scholar] [CrossRef]
  29. Hu, P.; Sharifi, A.; Tahir, M.; Tariq, A.; Zhang, L.; Mumtaz, F.; Shah, S. Evaluation of vegetation indices and phenological metrics using time-series MODIS data for monitoring vegetation change in Punjab, Pakistan. Water 2021, 13, 2550. [Google Scholar] [CrossRef]
  30. Liu, K.; Wang, S.; Li, X.; Li, Y.; Zhang, B.; Zhai, R. The assessment of different vegetation indices for spatial disaggregating of thermal imagery over the humid agricultural region. Int. J. Remote Sens. 2020, 41, 1907–1926. [Google Scholar] [CrossRef]
  31. Kumari, N.; Saco, P.; Rodriguez, J.; Johnstone, S.; Srivastava, A.; Chun, K.; Yetemen, O. The Grass is not always greener on the other side: Seasonal reversal of vegetation greenness in aspect-driven semiarid ecosystems. Geophys. Res. Lett. 2020, 47, e2020GL088918. [Google Scholar] [CrossRef]
  32. Niu, T.; Yu, J.; Yue, D.; Yu, Q.; Hu, Y.; Long, Q.; Li, S.; Mao, X. Differential law and influencing factors of groundwater depth in the key agricultural and pastoral zones driven by the minimum hydrological response unit. Appl. Sci. 2020, 10, 7105. [Google Scholar] [CrossRef]
  33. Zhang, G.; Su, X.; Singh, V.P. Modelling groundwater-dependent vegetation index using Entropy theory. Ecol. Model. 2020, 416, 108916. [Google Scholar] [CrossRef]
  34. Deng, W.; Chen, M.; Zhao, Y.; Yan, L.; Wang, Y.; Zhou, F. The role of groundwater depth in semiarid grassland restoration to increase the resilience to drought events: A lesson from Horqin Grassland, China. Ecol. Indic. 2022, 141, 109122. [Google Scholar] [CrossRef]
  35. Sun, Z.; Chang, N.; Opp, C.; Hennig, T. Evaluation of ecological restoration through vegetation patterns in the lower Tarim River, China with MODIS NDVI data. Ecol. Inf. 2011, 6, 156–163. [Google Scholar] [CrossRef]
  36. Li, W.; Du, J.; Wang, W.; Qu, S.; Sun, X. Effect of managed aquifer recharge on drawdown cone in plain area of Linqing City, China. IOP Conf. Ser. Earth Environ. Sci. 2021, 621, 012128. [Google Scholar] [CrossRef]
  37. Páscoa, P.; Gouveia, C.; Kurz-Besson, C. A simple method to identify potential groundwater-dependent vegetation using NDVI MODIS. Forests 2020, 11, 147. [Google Scholar] [CrossRef]
  38. Qi, Z.; Xiao, C.; Wang, G.; Liang, X. Study on ecological threshold of groundwater in typical salinization area of Qian’an County. Water 2021, 13, 856. [Google Scholar] [CrossRef]
  39. Li, D.; Li, X.; He, X.; Yang, G.; Du, Y.; Li, X. Groundwater dynamic characteristics with the ecological threshold in the Northwest China Oasis. Sustainability 2022, 14, 5390. [Google Scholar] [CrossRef]
  40. Liu, R.; Li, Z.; Xin, X.; Liu, D.; Zhang, J.; Yang, Z. Water balance computation and water quality improvement evaluation for Yanghe Basin in semiarid area of North China using coupled MIKE SHE/MIKE 11 modeling. Water Supply 2022, 22, 1062–1074. [Google Scholar] [CrossRef]
  41. Ren, B.; Liang, J.; Dai, J.; Li, X.; Sun, T.; Han, Y. Trend prediction of regional groundwater level with GIS-FEFLOW model in Beijing Mihuaishun plain, China. IOP Conf. Ser. Earth Environ. Sci. 2019, 330, 052037. [Google Scholar] [CrossRef]
  42. Lu, L.; Li, S.; Gao, Y.; Ge, Y.; Zhang, Y. Analysis of the characteristics and cause analysis of soil salt space based on the basin scale. Appl. Sci. 2022, 12, 9022. [Google Scholar] [CrossRef]
  43. Lu, Y.; Wang, L.; Zhang, H. Study on law of groundwater-salt transportation in Pingluo well-canal combined irrigation district in Ningxia. J. Water Resour. Hydraul. Eng. 2017, 48, 165–170. (In Chinese) [Google Scholar]
  44. Hu, Y.; Huang, Z.; Qi, X.; Zhang, Y.; Liang, Z.; Zhao, Z. Study on Optimal Allocation of Water Resources in Irrigation District Based on Linear Programming and MODFLOW Coupling Technology. J. Irrig. Drain. 2019, 38, 85–92. (In Chinese) [Google Scholar]
  45. Liu, L.; Cui, Y.; Luo, Y. Integrated Modeling of Conjunctive Water Use in a Canal-Well Irrigation District in the Lower Yellow River Basin, China. J. Irrig. Drain. Eng. 2013, 139, 775–784. [Google Scholar] [CrossRef]
  46. Pan, C.; Yang, S.; Lou, S.; Liu, P.; Jin, Y.; Zhao, H. Effects of alternative irrigation with multiple water sources on growth characteristics and yield of maize. Soil Fertil. Sci. China 2020, 1, 165–171. (In Chinese) [Google Scholar]
  47. Yang, W.; Mao, W.; Yang, Y.; Yang, J. Optimizing Conjunctive Use of Groundwater and Cannel Water in Hetao Irrigation District Aided by MODFLOW. J. Irrig. Drain. 2021, 40, 93–101. (In Chinese) [Google Scholar]
  48. Wang, L.; Peng, P.; Hao, P.; Yu, J.; Yang, J.; Zhu, Y. Well-canal conjunctive irrigation mode and potential of water-saving amount based on the balance of exploitation and supplement for Hetao irrigation distric. China Rural. Water Hydropower 2016, 8, 18–24. (In Chinese) [Google Scholar]
  49. Li, H.; Hao, P.; He, B.; Yu, J.; Yang, J. Reasonable ratio of canal and well area in Hetao irrigation district and sensitivity analysis. J. Irrig. Drain. 2015, 34, 229–232. (In Chinese) [Google Scholar]
  50. Wang, W.; Chen, Y.; Chen, Y.; Wang, W.; Zhang, T.; Qin, J. Groundwater dynamic influenced by intense anthropogenic activities in a dried-up river oasis of Central Asia. Hydrol. Res. 2022, 53, 532–546. [Google Scholar] [CrossRef]
  51. Cui, H.; Zhang, G.; Wang, J.; Wang, Q.; Lang, X. Influence of multi-layered structure of vadose zone on ecological effect of groundwater in Arid Area: A Case Study of Shiyang River Basin, Northwest China. Water 2022, 14, 59. [Google Scholar] [CrossRef]
  52. Li, M.; Chen, C.; Zhang, M. Numerical simulation of three-dimensional groundwater flow in the Weigan River Basin, Xinjiang. Geol. Sci. Technol. Inf. 2005, 1, 74–78. (In Chinese) [Google Scholar]
  53. Zeng, Y.; Zhao, C.; Kundzewicz, Z.W.; Lv, G. Distribution pattern of Tugai forests species diversity and their relationship to environmental factors in an arid area of China. PLoS ONE 2020, 15, e0232907. [Google Scholar] [CrossRef] [PubMed]
  54. Cui, H.; Zhang, G.; Wang, Q.; Wang, J.; Liu, M.; Yan, M. Study on index of groundwater ecological function crisis classification and early warning in Northwest China. Water 2022, 14, 1911. [Google Scholar] [CrossRef]
  55. Pulido-Bosch, A.; Rigol-Sanchez, J.P.; Vallejos, A.; Andreu, J.M.; Ceron, J.C.; Molina-Sanchez, L.; Sola, F. Impacts of agricultural irrigation on groundwater salinity. Environ. Earth Sci. 2018, 77, 197. [Google Scholar] [CrossRef]
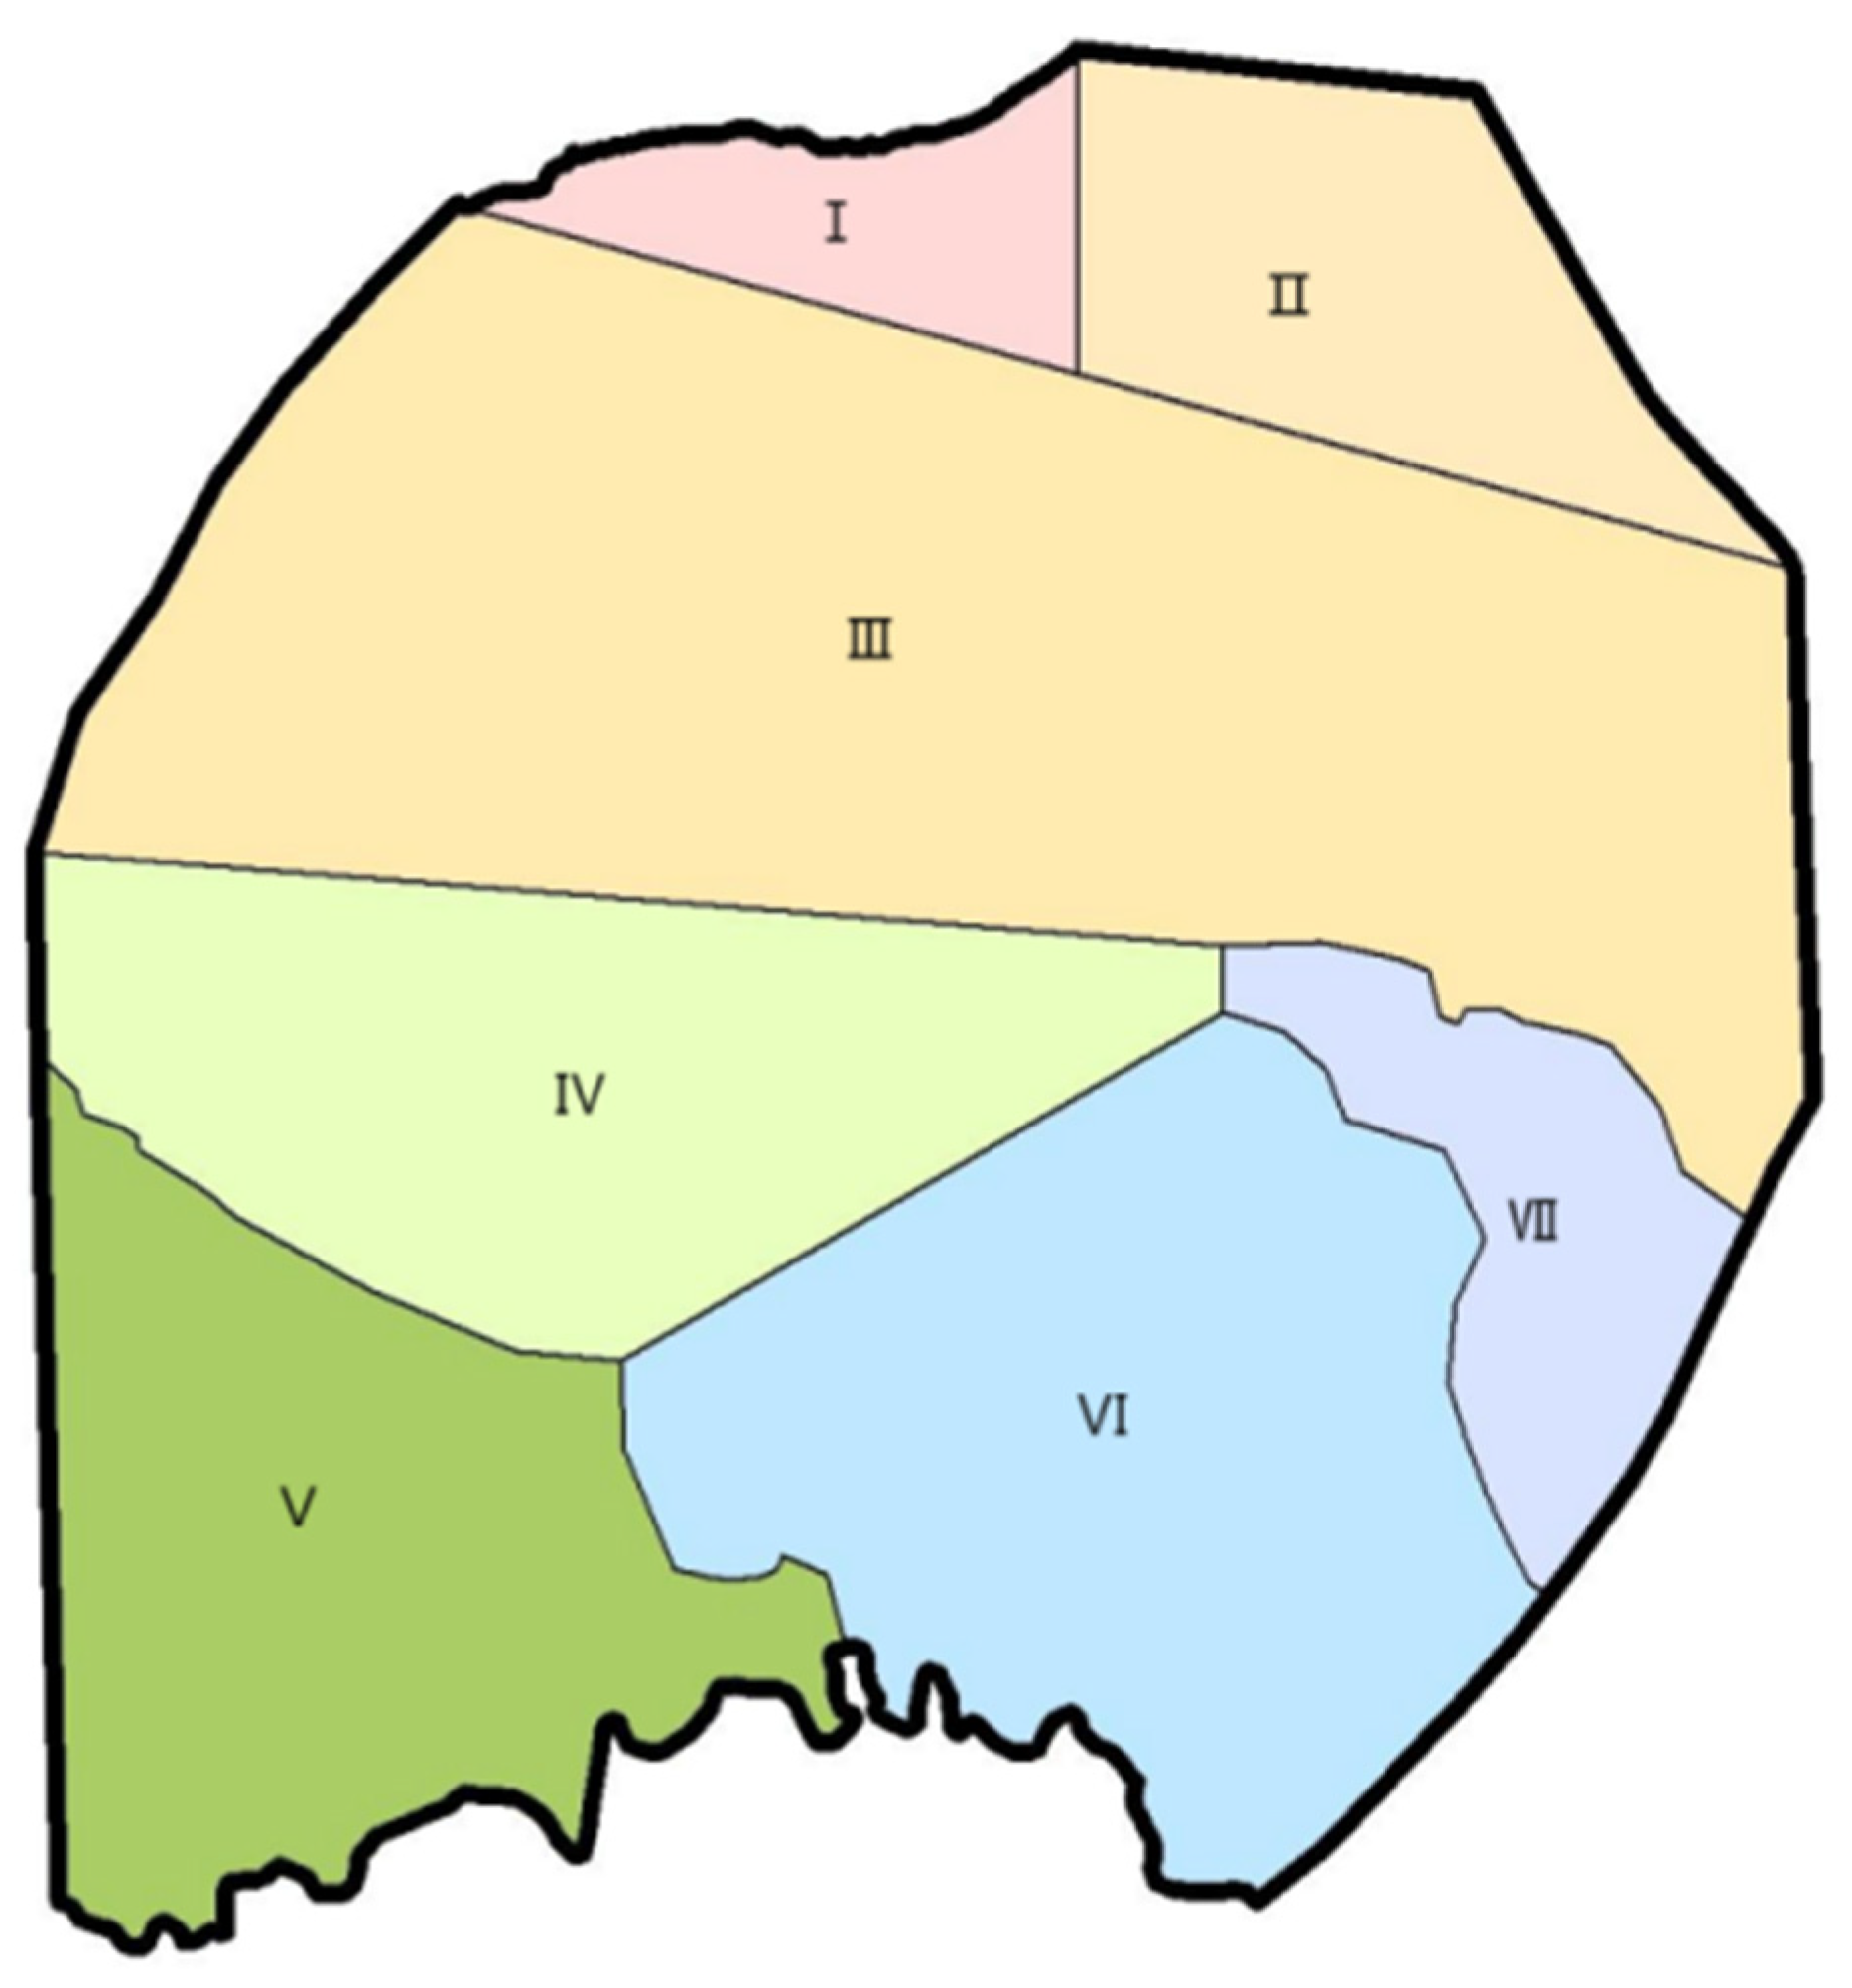
Figure 1. Overview of the geographic location of the study area.
Sustainability 15 15097 g001
Figure 2. Flowchart of the study.
Sustainability 15 15097 g002
Figure 3. Model initial heads and boundary conditions (2006).
Sustainability 15 15097 g003
Figure 4. Partition diagram of permeability coefficient.
Sustainability 15 15097 g004
Figure 5. (a,d,g) are the fitting diagrams of groundwater levels of some monitoring wells in the upstream, middle, and downstream irrigation areas of the Weigan River irrigation district from 2018 to 2021, respectively. (b,c,e,f,h,i) are the correlation analyses of the simulated subsurface measured values of some monitoring wells in the upstream, middle, and downstream irrigation areas of the Weigan River irrigation area, respectively.
Sustainability 15 15097 g005aSustainability 15 15097 g005b
Figure 6. Partial interannual spatial distribution variation in groundwater depth in the Weigan River irrigation district.
Sustainability 15 15097 g006aSustainability 15 15097 g006b
Figure 7. (a) Spatial distribution. (b) Percentage of area with change in groundwater depth in the Weigan River irrigation district in 2021 in comparison to 2012. (c) Proportions of areas with different depths from 2012 to 2021.
Sustainability 15 15097 g007
Figure 8. Response relationship between groundwater depth and well–canal combined irrigation ratio.
Sustainability 15 15097 g008
Figure 9. Average NDVI variation in the Weigan River irrigation district (2012 to 2021).
Sustainability 15 15097 g009
Figure 10. Spatial distribution of the NDVI MK trend test in the Weigan River irrigation district (2012 to 2021).
Sustainability 15 15097 g010
Figure 11. Spatial distribution of the annual average NDVI in the Weigan River irrigation district for 2012, 2015, 2018, and 2021.
Sustainability 15 15097 g011aSustainability 15 15097 g011b
Figure 12. Curve of NDVI versus groundwater depth in the Weigan River irrigation district.
Sustainability 15 15097 g012
Figure 13. Groundwater depth map of the Weigan River irrigation district under different irrigation statuses in 2020.
Sustainability 15 15097 g013
Figure 14. Variation map of groundwater depth in the Weigan River irrigation district under different well–canal irrigation combined ratios (2035).
Sustainability 15 15097 g014
Figure 15. Statistical map of groundwater depth intervals in the Weigan River irrigation district under different well–canal combined irrigation ratios.
Sustainability 15 15097 g015
Figure 16. Spatial distribution of the correlation between NDVI and groundwater depth in the Weigan River irrigation district.
Sustainability 15 15097 g016
Table 1. Hydrogeological parameter zoning table.
Partition NumberIIIIIIIVVVIVII
Permeability coefficient (m/d)1.972.41.51.61.231.343.1
Water content0.10.180.120.130.170.140.16
Table 2. Comparison of water balance calculation results from 2018 to 2021 (108 m3/a).
YearResearch MethodsRechargeExcretion Term Equilibrium
Difference
Rainfall InfiltrationRecharge
Irrigation
Lateral InfiltrationTotalSubmarine EvaporationLateral
Outflow, Tar River
Discharge
Quantity of Ore MinedTotal
2018WBM0.6416.780.9318.355.601.4013.3020.30−1.95
NSM17.380.7318.115.6814.7520.43−2.32
2019WBM0.9317.950.8619.745.921.8712.9820.77−1.03
NSM18.700.8119.515.4915.3620.85−1.34
2020WBM0.2916.211.6117.825.111.3211.7318.16−0.35
NSM16.641.0817.725.1612.9718.13−0.41
2021WBM1.2916.051.3618.706.121.4111.0918.620.08
NSM17.301.2618.566.2112.5818.79−0.23
Notes: WBM stands for the water balance method and NSM stands for the numerical simulation method.
Table 3. Scenario simulation of different well–canal combination irrigation ratios.
SimulationYearCanal Head Water Diversion (108 m3)Groundwater Withdrawal
(108 m3)
Total Water
Consumption
(108 m3)
Effective Utilization Coefficient of
Irrigation Water
Well–Canal
Combined
Irrigation Ratio
Scenario 1202023.51311.73035.2430.5440.499
202511.09434.6070.5540.472
203010.48133.9930.5640.446
20359.88933.4010.5740.421
Scenario 2202023.51311.73035.2430.5440.499
202510.48133.9930.5640.446
20309.31732.8300.5840.396
20359.31732.8300.6040.396
Scenario 3202023.51311.73035.2430.5440.499
202510.78534.2970.5590.459
20309.88933.4010.5740.421
20359.03832.5510.5890.384
Scenario 4202023.51311.73035.2430.5440.499
202510.18233.6950.5690.433
20308.76532.2770.5940.373
20358.76532.2770.6190.373
Disclaimer/Publisher’s Note: The statements, opinions and data contained in all publications are solely those of the individual author(s) and contributor(s) and not of MDPI and/or the editor(s). MDPI and/or the editor(s) disclaim responsibility for any injury to people or property resulting from any ideas, methods, instructions or products referred to in the content.

