Article

The Impact of Agricultural Employment and Technological Innovation on the Environment: Evidence from BRICS Nations Considering a Novel Environmental Sustainability Indicator

1
Southwest Minzu Research Institute, Southwest Minzu University, Chengdu 610041, China
2
Department of Economics, Noakhali Science and Technology University, Noakhali 3814, Bangladesh
3
Graduate School of Economics and Management, Ural Federal University Named after the First President of Russia B.N Yeltsin, Yekaterinburg 620002, Russia
4
Department of Agricultural Sciences, Texas State University, San Marcos, TX 78666, USA
*
Author to whom correspondence should be addressed.
Sustainability 2023, 15(20), 15083; https://doi.org/10.3390/su152015083
Submission received: 7 September 2023 / Revised: 12 October 2023 / Accepted: 16 October 2023 / Published: 20 October 2023
(This article belongs to the Special Issue Energy Economy and Agricultural Economy in Sustainable Development)

Abstract

:
This study fills a gap created by previous environmental investigations by including the impact of agricultural employment and technology on the load capacity factor (LCF) rather than solely focusing on CO2 or greenhouse gas (GHG) emissions, which only measure from the demand side; LCF provides a complete picture of environmental degradation by evaluating both the demand side and supply side. This connection is moderated further by considering the renewable energy and natural resource rent impacts. In this analysis, panel econometric methods are incorporated, including the cross-sectional dependence test. This study uses the Pooled Mean Group–Autoregressive Distributed Lag (PMG-ARDL) model to evaluate the level of effect independent factors had on the LCF of the BRICS (Brazil, Russia, India, China, and South Africa) nations from 1992 to 2020 in the presence of a heterogeneous integration order. The estimations recognize heterogeneity in the effects of agricultural employment, renewable energy, natural resource rent, and technology on LCF, in the short run and long run. According to the empirical results, agricultural employment significantly enhances the LCF both in the short run and long run, implying that employment in agriculture improves environmental sustainability. However, increasing the use of renewable energy protects the environment from degradation only in the long run; it has no significant impact in the short run. On the contrary, natural resource rent and technology lead to a decline in environmental sustainability in the long run. Hence, this study recommends prioritizing renewable energy intake over other energies, providing proper incentives to motivate agricultural entrepreneurship to ensure a sustainable environment.

1. Introduction

The sustainable growth of a country aims to meet present needs without endangering environmental sustainability for future generations [1]. However, one of the biggest problems in the world today is the continuous and growing degradation of the world’s natural resources and its atmosphere, which impedes sustainable development both for developing and developed countries [2]. As the global economy expands, so does the demand for fossil fuels, the rate of woodland loss, and the number of manufacturing operations; all these factors contribute to the release of GHGs into the atmosphere, which comes with an overall rise in surface temperatures and other major environmental alterations [3]. Since 1880, the average global temperature has increased by 0.14 °F every decade, and this rate increased by 0.32 °F from 1981 onwards—more than two times as rapidly [4]. In this regard, the Paris Convention’s adoption of COP21 drew attention to the fact that while several ecological issues are immediately confronting the world, appropriate climatic efforts are lacking [5]. In light of this consideration, experts express apprehension regarding the environment, while international organizations have been actively endeavoring to enhance public comprehension regarding the significance of sustainable practices. There have been several renowned programs, such as the Kyoto Protocol, Paris Agreement, Conference of Parties (COP) meetings, and UN Sustainable Development Goals (SDGs), aimed at achieving environmental and economic sustainability by shifting to a greener, more efficient economy through increasing the use of green technology, reducing natural resource rent, and ensuring GHG emission reduction through renewable energy.
As yet, most studies have focused on GHG or CO2 emissions—representing only air pollution—as an environmental indicator [6,7,8,9], while others have taken ecological footprint (EF) into account [10,11,12]. However, these parameters only account for human-caused environmental harm, not how nature reacts to such harms, and GHGs, CO2, or EF indicators disregard the input or supply side of the ecosystem as well as the country’s or society’s environmental capacity. Consequently, to account for the supply side of the ecosystem, Siche et al. [13] developed a new index, called the Load Capacity Factor (LCF), as a ratio of biocapacity to EF; this indicator is intended to determine the possibility of biological capacities to absorb EF [14]. The term “biocapacity” is used to describe the ability of ecological systems to meet human needs. EF, on the other hand, represents the environmental strain caused by human actions. When the value of LCF is equal to one, it indicates that the community or the country has an environmental capacity that is equal to its emissions, indicating the limits of sustainability. When the LCF value is greater than one, it indicates that the environment is still able to absorb EF, and this community has environmental sustainability. When the index drops below one, it indicates the deterioration of environmental capacity and the inability to absorb EF, which indicates that the environment is not sustainable in this case [13,14]. The LCF is intrinsically related to the SDGs, which stress the importance of maintaining a balanced environment across land, sea, and air. Therefore, the utilization of LCF as an environmental indicator offers valuable guidance to the authorities of BRICS nations (Brazil, Russia, India, China, and South Africa) in assessing environmental challenges. This is particularly relevant as these nations have experienced a decline in environmental sustainability over the past few decades, as evidenced by the decreasing value of LCF (Figure 1).
Previous research identifies multiple possible causes, including trade liberalization, the inflow of foreign investment, and the use of fossil fuels, as key drivers of the worldwide environmental crisis [1]. However, researchers recently started to link agriculture [1,15,16,17,18] and technology [19,20,21,22,23] with the environment. Most of the developing nations look to agriculture as the primary driver of economic expansion; this industry involves the excessive use of energy and chemicals in the processes of higher agri-production. Some researchers have linked this sector to greenhouse gas emissions and global warming, and others have called it “ultrasensitive” to climate change [24,25]. The usage of non-renewable energy such as natural gas and fossil fuels along with other chemical products may have increased production but also brought about significant climate changes. According to Charles, the food production sector is responsible for 37% of global GHG emissions, with approximately 13–21% coming from the agricultural sector [
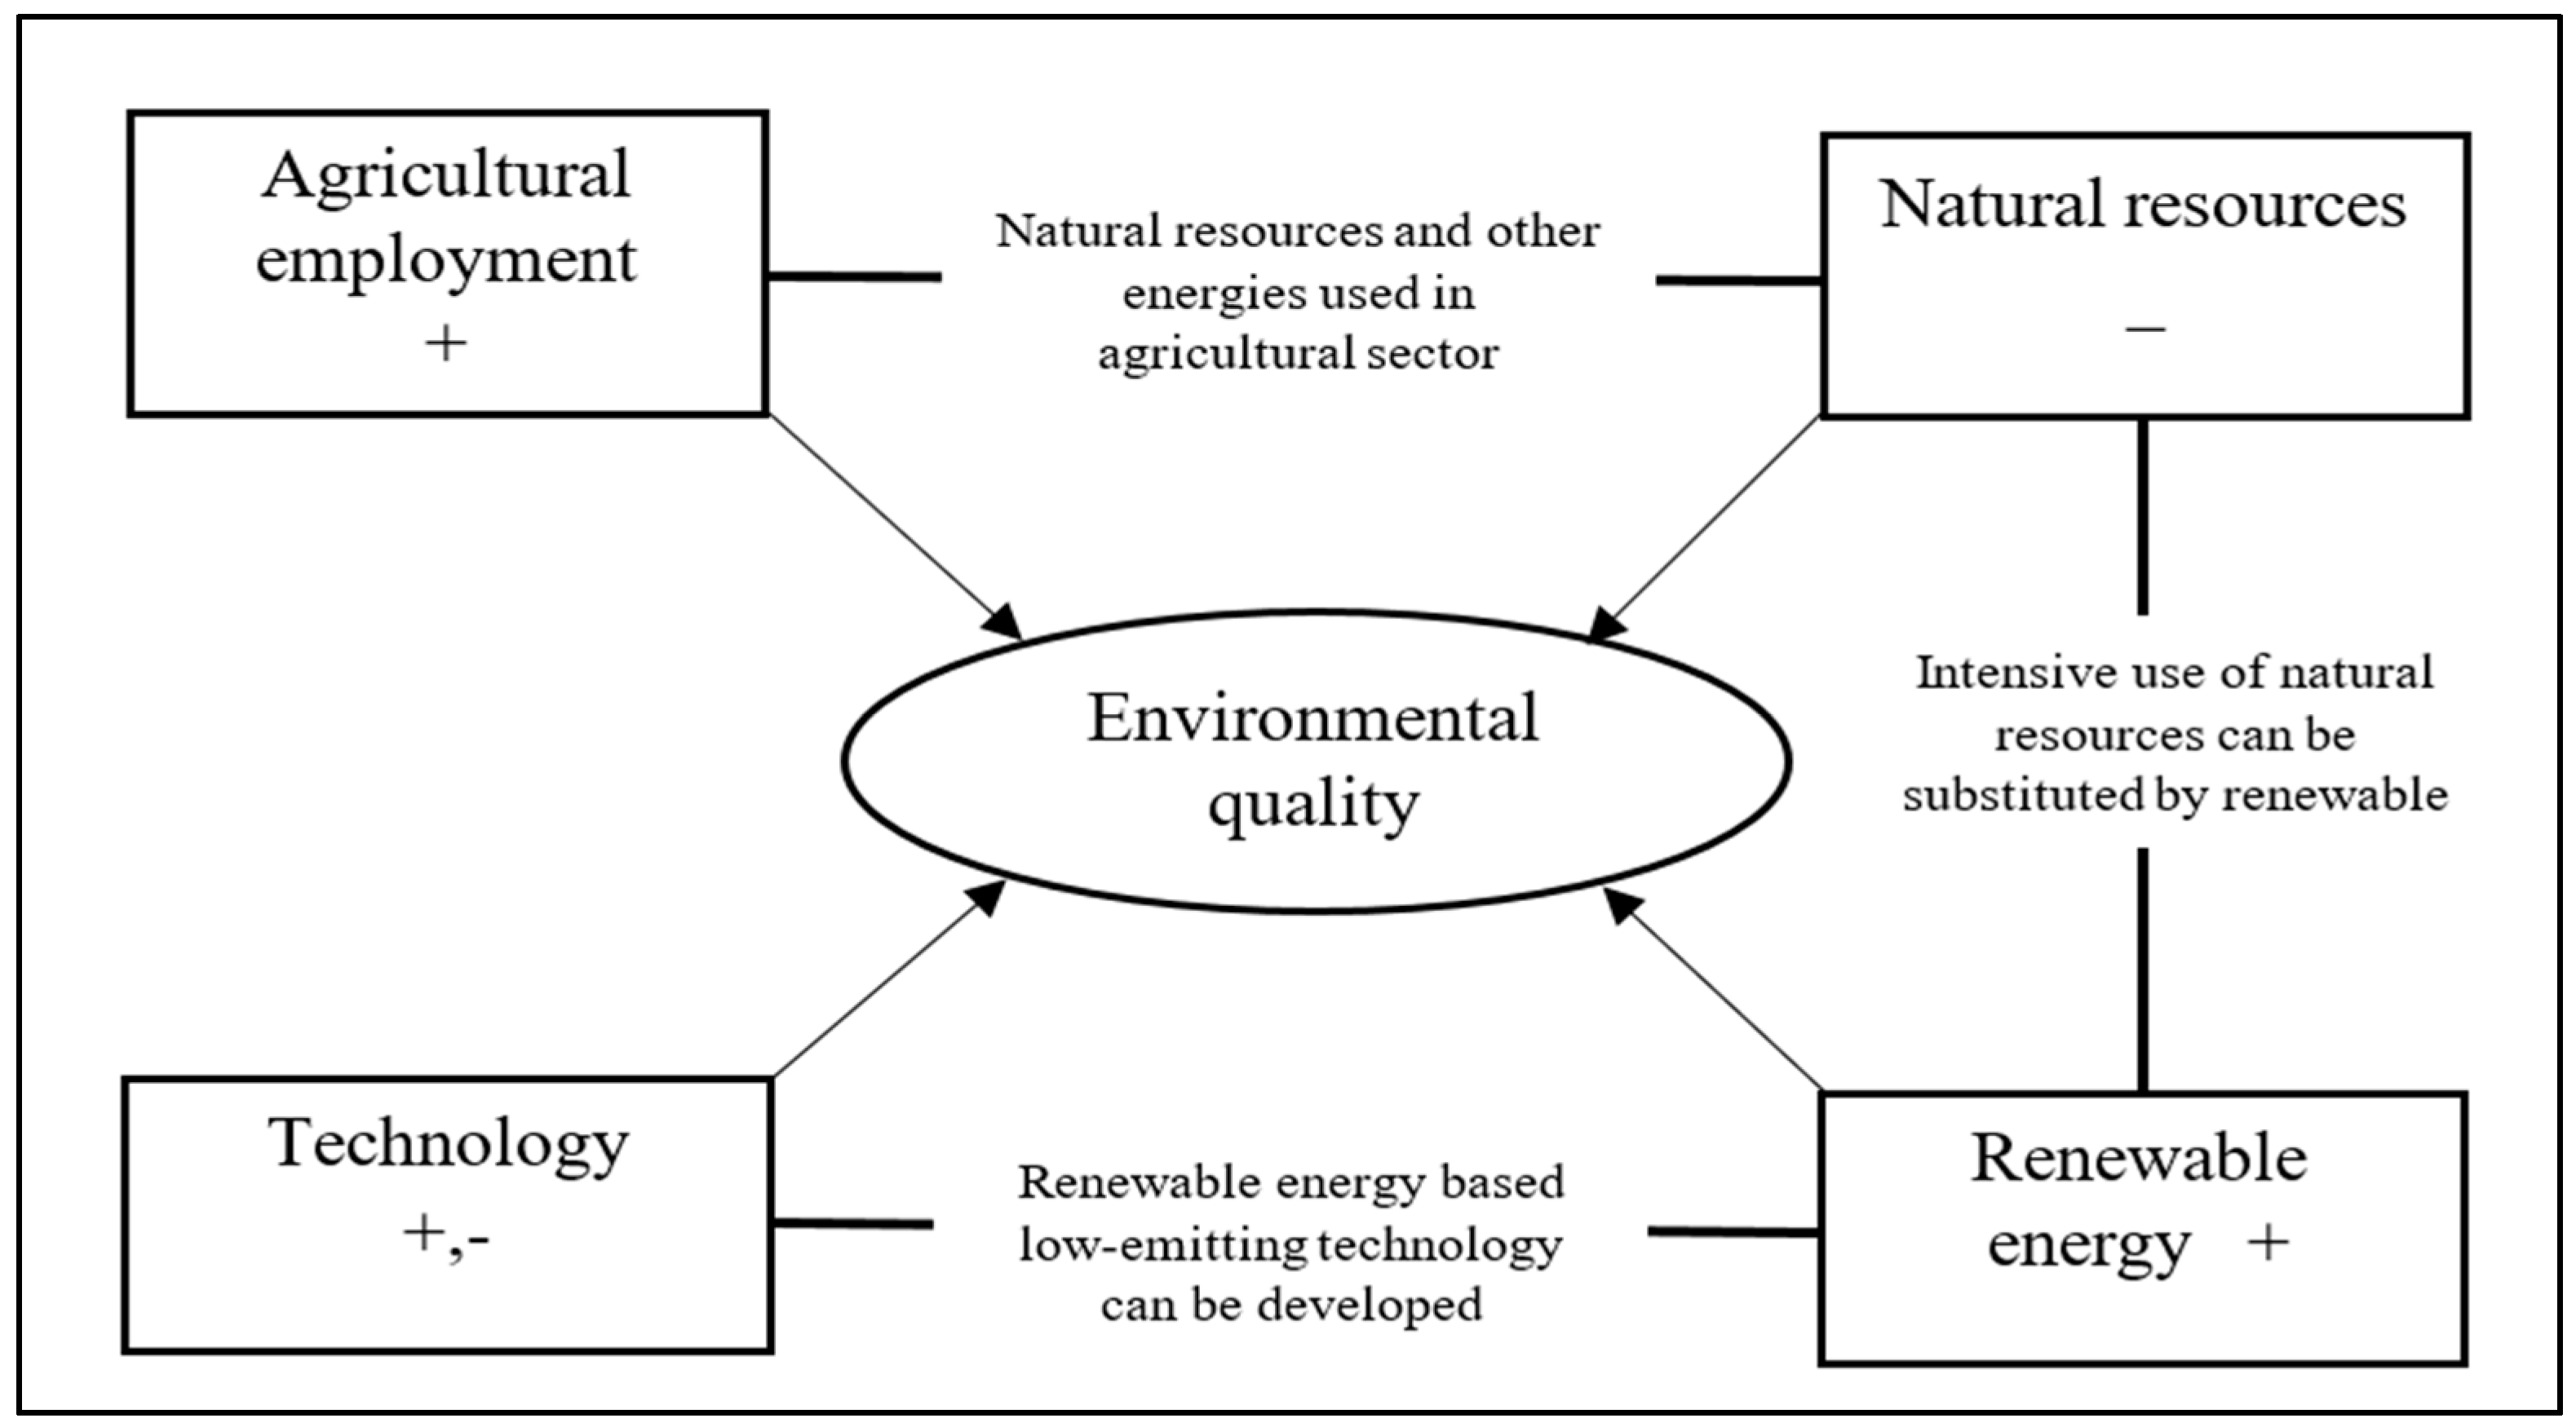
26]. An uptick in agricultural employment could help cut down on pollution and energy consumption. Agricultural employment exerts a substantial influence on the regenerative and absorptive capabilities of crop residue pollutants [27]. In the agriculture sector, the implementation of green jobs in particular aids in lowering energy combustion, safeguarding and restoring ecological systems and biological diversity, and even helping to lower the emission rate by reducing contamination [28]. Hence, it helps to ensure a sustainable environment. The BRICS countries heavily depend on the agriculture sector, either directly or indirectly, for their major supplies of staples or as suppliers of raw materials for industry. Consequently, a significant proportion of the labor population is engaged in the agricultural sector as a means of sustenance, contributing to the production of food and other commodities. This situation potentially has implications for the environmental circumstances of these nations.
The potential environmental consequences associated with the income generated by the sale of natural resources warrant consideration. According to ref. [29], if a nation utilizes these revenues to sustain present spending rather than allocating them toward capital investment and infrastructure development, it leads to a rise in pollution. To ensure growth, developing nations need to extract and consume more natural resources in order to increase their output, which will increase their production of hazardous materials [30]. So, there is a direct consequence of the widespread usage of resources in these sectors, resulting in a higher degree of pollution. Natural resource depletion is vital for development, but over-extraction of natural resources is a major contributor to higher energy consumption, which in turn causes larger carbon footprints [31] and hampers sustainability. Moreover, previous studies [12,31] have established a correlation between natural resources and the environment. The environmental dynamics of the BRICS nations, characterized by a significant population density and predominantly human-made surroundings, have been shaped by the extensive use of natural resources and fast urbanization. Due to significant advancements in these countries, there has been a notable depletion of natural resources, leading to the emergence of environmental issues that need appropriate attention and resolution.
According to ref. [32], advanced technological innovations are crucial for achieving long-term prosperity. Therefore, technological advancement is worthy of consideration when studying environmental conditions because it is vital in improving the use of energy and reducing the resultant pollution. Encouragement of the adoption of sophisticated technologies that enable clean and cost-effective energy use can reduce emissions. New technologies are being developed in a way that requires far less energy than their predecessors while the output supply remains uninterrupted [33]. To achieve sustainability in both environmental and economic terms, the world at large has been moving towards the use of greener technologies and alternative sources of energy such as renewable energy [14]. Nevertheless, it is important to acknowledge that all technologies, regardless of their use in agriculture, energy, or environmental sectors, have the potential to contribute to the carbon footprint. Consequently, it is imperative that technological advancements are pursued in a manner that aligns with ecologically sustainable practices and facilitates the promotion of the green transition. By using greener forms of energy, the world can lessen its carbon footprint through energy efficiency and ultimately protect the environment [34]. Moreover, using traditional renewable energy sources including hydro, solar, biomass, and wind power can lower the cost of energy imports [35]. This is why many countries are making the transition towards renewable energy sources. Consequently, there is a pressing need for studies to focus on agriculture, natural resource rent, technology, and renewable energy sources in the environmental context. Both lawmakers and governments will benefit from this connection as they make the transition toward sustainable economic growth and better environmental conditions. Considering the discussion above as a foundation, this study attempts to trace the following research questions (RQs):
  • RQ1: To what extent will the environmental sustainability of BRICS nations be affected by agricultural employment and technological innovation?
  • RQ2: How do renewable energy and natural resources contribute to the environmental sustainability of the BRICS nations?
The current study presents a number of contributions to the existing corpus of knowledge, as follows: (1) Rather than GHGs, CO2 emissions, or EF, this study considered LCF as an environmental indicator to elucidate both the demand and supply sides as well consider both EF and biocapacity. (2) The current study addresses a gap in the existing literature by examining the influence of agricultural employment on BRICS environmental sustainability, especially considering the absence of previous studies on LCF and the paucity of studies considering agricultural employment. (3) This study aims to provide a more precise analysis of the mixed effects of natural resource rent, technological innovation, and renewable energy in shaping the environmental conditions of the BRICS nations. Consequently, the research will offer substantial measures to address the environmental challenges alongside the promotion of long-term economic growth in BRICS nations. (4) Finally, this study employs a range of panel data econometric methodologies, including the Pooled Mean Group–Autoregressive Distributed Lag (PMG-ARDL) approach, accounting for cross-sectional dependency, to provide a robust estimate. The outcomes of this model can be considered in creating environmental policies in this region, taking into account the advancements in technology and the shift in agricultural labor forces.

Why BRICS?

Urbanization and industrialization have contributed significantly to global economic development in recent decades. In particular, the BRICS (Brazil, Russia, India, China, and South Africa) nations have grown dramatically, with an average yearly expansion of 6.5% [36] and an increase in contribution to the world economy of 31.5% [37]. Natural resources form a significant part of the BRICS states’ economic activities, accounting for approximately 3–15% of the GDP [38]. Moreover, consistent advancement in technology has boosted economic development but has also brought up massive environmental issues, most notably, increased carbon dioxide emissions [39]. The BRICS countries’ GDP is built in large part on agricultural activity [40]. Even though they are transitioning away from fossil fuels, their renewable energy use is significantly lower than that of wealthy nations [41]. According to LCF analysis, BRICS’ high EF in comparison to biocapacity has harmed the environment; this is especially true of India, China, and South Africa. Figure 1 presents the trends of LCF for BRICS nations. China has an EF of 5.3 gha in 2023 [42], with its biocapacity surpassing 302% of its EF as of 2017 [43], whereas this percentage is 171% in the case of India [44]. The BRICS nations are currently the top polluters worldwide, and their emission levels have been steadily rising for decades [45]. However, because of the 2015 Paris Agreement and COP26 in 2021, the BRICS countries have agreed to help reduce emissions and are now participants in the challenge to achieve net-zero emissions by 2050. Therefore, it is important to possess a comprehensive understanding of the causes and patterns of pollution protection in these nations to adequately address the escalating issue of environmental degradation.

2. Literature Review

Scholars have been concerned about the achievement of ecological sustainability due to the rapid degradation of the natural world. This pursuit involves the examination of the current condition of the environment, the identification of factors contributing to this degradation, and the implementation of corrective measures aimed at achieving environmental sustainability goals. Hence, this section provides a comprehensive assessment of the existing literature pertaining to variables related to environmental sustainability.

2.1. Renewable Energy and Environment Nexus

Previous studies extensively acknowledge the significance of renewable energy as a crucial factor in determining environmental sustainability. There is a growing body of research in favor of renewable energy transition policies on a worldwide scale. For instance, ref. [46] found that the environmental standard of BRICS-T (Brazil, Russia, India, China, South Africa, and Turkey) countries increases as a result of increased use of renewable energy consumption, and it is positively associated with LCF. Samour et al. [47] reported similar findings for the 1990–2018 period and likewise concluded that the state of the environment can be improved by increasing the utilization of energy from renewable sources. Using three different models—PMG, MG, and PNARDL—Adebayo and Samour [48] demonstrated how the increased use of renewable energy in BRICS nations contributes to environmental sustainability as estimated by LCF. They also found a positive correlation between renewable energy and environmental conditions. A comparable study was conducted by Dogan and Pata [49], who analyzed the effect of renewable energy utilization on LCF for the G7 countries from 1986 to 2017. The empirical results show that using renewable energy sources is crucial for increasing the G7 countries’ LCF over the long term.
Similarly, Dam and Sarkodie [50] found that the usage of renewable energy stimulates the LCF and helps to achieve a sustainability in selected OECD nations. This line of justification is also supported by Shang et al. [51] for ASEAN nations and Pata and Samour [52] for OECD countries. Another study confirmed that using renewable energy promotes environmental sustainability; the effect is magnified when renewable energy costs are combined with renewable energy usage [53]. However, ref. [54] showed that the use of renewable electricity did not affect the LCF and environmental sustainability. Hence, most of the literature supports the role of renewable energy in improving environmental sustainability.

2.2. Natural Resource Rent and Environment Nexus

Because of the potential for environmental damage during resource extraction, remediation, and consumption, several researchers have analyzed the consequences of natural resource rent on the environment. For instance, using CS-ARDL, Zhao et al. [55] analyzed its impact from an LCF perspective. According to their findings, the BRICS-T countries’ natural resource use has had a detrimental impact on the environment by lowering the LCF over the long and short term. Ni et al. [56] shared similar insights for high-resource-consuming countries. Long-term results of the ARDL approach show that excessive reliance on natural resources for growth significantly reduces the LCF and moves away from the goal of environmental sustainability. Under the load capacity curve (LCC) hypothesis in BRICS, Yang et al. [57] found that the resource rent factor negatively impacts the environment by lowering the LCF. Moreover, Li et al. [58] revealed that the total natural resource rent (i.e., the rent of minerals, natural gas, oil, and coal), along with globalization and economic growth, diminish the LCF and thus stimulate the degradation of the environment of Next-11 nations. In line with these studies, another investigation by Ibrahim and Ajide [59] on BRICS economies that included total natural resource rents, the development of financing, and regulatory effectiveness evidences an upsurge the degradation.
However, Pata and Ertugrul [60] demonstrated a counterintuitive comprehension for India, arguing that natural resource rent supports improvements in environmental quality through increasing the LCF over the 1988–2018 timeframe. Another study by Sun et al. [61] also found a positive association between natural resource rent and LCF for 17 Asian-Pacific Economic Cooperation (APEC) countries. Furthermore, the study of Balsalobre-Lorente et al. [62] claimed that natural resources replace highly emitting energy sources, paving the way toward environmental sustainability goals. Wang et al. [63] argued that increased natural resource rents promote ecological improvement via freer commerce. Their findings implied that the nation’s base of natural resources deserves to be taken into full account in the evolution of trade liberalization.

2.3. Agriculture and Environment Nexus

The involvement of agriculture in environmental degradation has been the subject of recent research. Some studies have focused on the consequences brought on by human activities, including fishing, dairy production, and agriculture, on the environment. Ridzuan et al. [64] demonstrated that the crops and fisheries segment of agriculture significantly reduced carbon emissions in the 1978 to 2016 period. Meanwhile, some other studies focus on the nexus between agricultural productivity and environmental sustainability. For instance, using DOLS and FMOLS methods and data from 1990 to 2014, Balsalobre-Lorente et al. [16] determined the negative effects of agriculture on the natural environment for BRICS economies. In the case of Bangladesh, Raihan et al. [18] found that CO2 emissions are reduced when agricultural productivity increases. Adapting the ARDL approach, Prastiyo et al. [17] found that CO2 emissions increase along with economic growth and urbanization, whereas value-added agriculture negatively impacts emissions and hence improves environmental conditions. According to Muoneke et al. [65], when it comes to addressing ecological sustainability, the farming sectors perform beyond the threshold required to maximize the growth advantages provided by the agricultural system. However, Pata [1] found no significant effect of agriculture on the ecological footprint of BRICS countries.
The sustainable development of regions, food safety, and environmentally friendly agricultural production have all been the primary focus of prior agricultural research [66,67]. Beyond this, Jiang et al. [27] investigated the connection between agricultural employment and environmental pollution. Their empirical findings revealed that employment in agriculture exaggerates environmental damage by increasing the EF. Thus, the literature review reveals that the relationship between employment in agriculture and environmental deterioration is not as well-studied as other topics in the field.

2.4. Technological Innovation and Environment Nexus

The impact of technology innovation on environmental sustainability objectives has been the subject of multiple studies. For example, taking LCF as a measure of environmental conditions, Mehmood et al. [68] utilized Cross-Section Improved Autoregressive Distributed Lag (CS-ARDL) estimation. The empirical results show that technological advances are good for the health of the environment. Ref. [19] examined the effect of technological development on the environmental impact of Brazil, India, China, and South Africa from 1990 to 2016; the results show that technological development has helped reduce environmental damage. Awosusi et al. [22] also support this trend of achieving environmental sustainability through technological adoption. A pair of recent studies [20,69] also acknowledged the role of technology in mitigating environmental degradation within G7 nations. Additionally, Wahab et al. [20] specifically highlighted that the adoption of technology has resulted in a reduction in consumption-based CO2 emissions. However, the ARDL estimation for the USA found no significant impact of clean energy technologies on LCF [70].
There exist opposing perspectives that technical advancements have a role in degrading environmental sustainability. Jahanger et al. [2] studied the nexus between technological innovation and environmental sustainability. Their findings indicate a negative correlation between the level of technological innovation and the LCF in the top SDG nations. Also, a study by Su et al. [21] provides evidence that the degradation of the Brazilian environment is a result of higher carbon emissions from new technologies. Similar insight was shared by Khan et al. [71] for the Belt & Road Initiative (BRI) countries. The impact of technological innovation on environmental degradation is significant, boosting the combustion of energy and thus carbon emission in these countries.

2.5. Literature Gap

Overall, the previous literature did not settle on a unified conclusion about the relationship between natural resource rent, technological innovation, renewable energy, agriculture, and the environment. Most studies focused on CO2 emissions or EF rather than LCF; moreover, there is no study on the impact of agricultural employment and technological innovation on the LCF in the BRICS context. In light of this knowledge vacuum, it makes sense to study how changes in agricultural employment and technology affect BRICS nations’ LCFs. Furthermore, a more robust PMG-ARDL estimator, which displays both short-run and long-run effects, is used in the present work to address the various econometric difficulties of the earlier investigations. This means that the findings of the current study are more accurate and efficient than those of previous research.

3. Materials and Methods

3.1. Data Description

Based on previous research [43,72,73], the current investigation used the LCF—an environmental indicator— as the dependent variable. The LCF compares biocapacity and EF to describe a certain ecological threshold. The quality of the environment improves if the LCF rises. LCF data were collected from the Global Footprint Network database [42]. Four different independent variables were selected. First, many recent papers have considered renewable energy as one of the core factors that improve environmental sustainability by reducing emissions [48,74,75]. Second, natural resources have attracted much attention in previous studies [76,77,78]. Due to the heavy reliance of BRICS nations on natural resource extraction in the production process, it is relevant to include. Third, technological advancement has led to severe unfavorable climatic implications [79]; on the other hand, it may improve environmental conditions through green transformation. So, the importance of technical advancement should not be overlooked when looking at the root causes of environmental degradation. Although these three factors were of huge concern previously, researchers paid little attention to the impact of agricultural employment on environmental states. In this regard, the present study selected these factors to be investigated from an environmental perspective. The World Development Indicator (WDI) served as the primary source of these variables. This study focuses on Brazil, Russia, India, China, and South Africa (together referred to as BRICS). The multivariate yearly panel dataset from 1992 to 2020 is used in this work for empirical analysis, and the availability of data justified this timing. Detailed information on the variables is presented in Table 1.
The LCF is measured as the ratio of biocapacity (gha per capita)/ecological footprint (gha per capita). The aggregate of natural resource rents includes oil rents, natural gas rents, coal rents (both hard and soft), mineral rents, and forest rents. The calculation of natural resource rents involves determining the difference between the market price of a given commodity and the mean production cost associated with its extraction. It is measured as the percentage of total Gross Domestic Product (GDP). The utilization of total patent applications serves as a surrogate measure for technological innovation, as shown in the literature, while renewable energy usage is measured as the percentage of total energy consumption. Moreover, the measurement of employment in the agricultural sector pertains to the entire labor force involved in agricultural activities, expressed as a proportion of the total employment within the economy. All variables were transformed into natural logarithmic (Ln) form to be considered elasticities.
The descriptive matrix regarding the aforementioned variables is shown in Table 2. Technological innovation has the highest mean and median value, LnLCF has the lowest maximum value, and LnNR has the lowest minimum value. The variables LnLCF, LnRE, and LnEA have a normal distribution, as evidenced by skewness and kurtosis. In terms of these two statistic values, the LnTI is not normally distributed, while the Jarque–Bera test resolves it: the probability value of the Jarque–Bera statistic contests this and asserts that LnTI follows a normal distribution.

3.2. Model Estimation

Following the preceding empirical framework proposed by [27,43,68], this study formulated an empirical log-linear model, Equation (1), to examine the pertinent factors’ impact on the load capacity factor.
L n L C F t = β 0 + β 1 L n R E t + β 2 L n N R t + β 3 L n E A t + β 4 L n T I t + μ t  
The transformation of the variables into logarithmic form (represented by Ln) allowed us to determine elasticity while avoiding non-normality and heteroscedasticity issues. In Equation (1), β 0 is the intercept coefficient; β 1 β 4 represent partial slope coefficients; the error term is represented by μ; t represents the time period of 1992–2020. The β 1 coefficient may postulate a positive association with LCF since increasing the ratio of renewable energy in overall energy intensity promotes environmental; β 2 , the natural resource rent coefficient, may illustrate a negative impact because BRICS nations are reliant on natural resource extractions that cause both soil and air pollution. In the case of agricultural employment, it improves the absorptive capabilities of crop residue pollutants and enriches the environmental status [27]. Therefore, the β 3 coefficient might illustrate a positive association. Lastly, technological innovation may intensify non-renewable energy combustion in the process of making such innovations operational, as BRICS countries are still far behind other developed countries in the case of renewable energy usage. Conversely, if technology advancements progress in a manner that prioritizes environmental consciousness and facilitates the production of power and other items by eco-friendly means, it is plausible that this may yield favorable effects on the LCF and hence enhance environmental sustainability. Therefore, the impact of technological innovation in BRICS nations can be either beneficial or detrimental, as will be demonstrated in the subsequent findings section. Figure 2 illustrates the connectivity and possible effect of the considered variables on LCF.

3.3. Econometric Methodology

The T > N panel dataset used in this work allows for a methodologically sound five-stage empirical analysis followed by (i) cross-sectional dependence (CSD) tests, (ii) multicollinearity check, (iii) second-generation unit root test of CIPS and CADF to check the stationarity, (iv) assessment of co-integration among the variables with the Kao test and the Johansen fisher panel co-integration test, and (v) elasticity estimation using the PMG-ARDL approach. Figure 3 depicts the methodological flow diagram of this research.

3.3.1. Multicollinearity, CSD, Unit Root, and Cointegration Check

A higher degree of correlation among two or more independent variables in a regression framework is a common issue in a dataset, known as multicollinearity, making it difficult to establish the individual impact of each variable on the dependent one. Hence, it is essential to detect multicollinearity to improve the statistical significance of the independent variables. For this purpose, this study tested variance inflating factors (VIFs). A VIF greater than four suggests the possibility of multicollinearity and necessitates additional study [80], while others have claimed that a VIF larger than 10 would be problematic for deriving reliable coefficient values.
Before diving into the data, the cross-sectional dependence (CSD) needs to be examined, as this study utilizes panel data. The CSD test was initially suggested by ref. [81] to examine dependence among cross-sections. Cross-country dependencies or unobserved shared variables may exist across the panel due to comparable economic and social factors [82,83]. Results can be distorted, inconsistent, and perplexing if the cross-country dependency is ignored under the premise that cross-sections are independent [84]. Therefore, four distinct CSD tests were employed in this investigation: Breusch–Pagan LM [85], Pesaran [86] scaled LM, Baltagi et al. [87] bias-correlated scaled LM, and Pesaran [86] CD tests with the null hypothesis of no cross-sectional dependence. Evaluation of CSD serves as a roadmap for other tests. With T > N, the most popular Breusch and Pagan LM test is as follows:
L M = i = 1 N 1 j = i + 1 N T ρ ^ i j χ 2 N ( N 1 ) 2
where the number of diagonal components in the residual covariance matrix and degrees of freedom are equal; T = time period; N = number of cross-sections; ρ ^ i j = cross-sections’ pair-wise correlation.
The CSD estimation is expressed as follows:
C S D = 2 T N ( N 1 ) i = 1 N 1 j = i + 1 N ρ ^ i j
where CSD → N (0, 1) for N up to infinity and T being sufficiently large under the null hypothesis of no-cross-sectional dependence.
After assessing the dependence across sections, the following stage in the analysis was to rank the co-integration order of the different variables in the study. In this context, the employment of panel unit tests of the first generation may yield inaccurate outcomes in the presence of cross-sectional dependence [88]. Pesaran [89] suggested using the cross-sectional augmented IPS (CIPS) and cross-sectional ADF (CADF) tests to account for the cross-sectional dependence across the variables, yielding more precise and reliable results. The equation for the CADF and CIPS is as follows:
y i t = α i + π i y i , t 1 + φ i y ¯ t 1 + l = 0 p ϕ i l Δ y ¯ t 1 + l = 1 p γ i l Δ y ¯ i , t 1 +   ε i t
where y ¯ = lagged cross-sectional average; y ¯ = first difference of the lagged cross-section. The CIPS equation is presented in Equation (5):
C I P S = 1 N i = 1 N C A D F i
where N indicates the total observation, and CADF is the cross-sectional augmented Dickey–Fuller value of the ith individual. Once the sequence of integration is identified, it is imperative to investigate the existence of long-term associations among the variables under consideration [90,91]. This study employed the Kao and Johansen Fisher panel co-integration tests to assess the stability of the long-term connection among the stochastic data series. Specifying individual cross-sectional intercepts with homogenous weights on the initial stage of regressors is a key feature of the residual-based test developed by ref. [90]. Additionally, this study employed another alternative Johansen-type test by Maddala and Wu [92] to identify the existence of co-integration, which aggregates the test statistics from separate cross-sections to obtain an overall panel test statistic. This test is designed with two statistics: the Fisher statistic from the trace test and the Fisher statistic from the maximum eigenvalue test. This study considers three lag orders for this test.

3.3.2. Pooled Mean Group–Autoregressive Distributed Lag (PMG-ARDL) Model

This investigation estimates both types of estimation, i.e., short-run and long-run. When dealing with panel data approaches regarding individual impacts, typical ARDL techniques fail to account for bias because of the connection between the mean-difference independent variables and the white noise error term [93]. This problem can be overcome by combining the ARDL approach with the PMG estimation method developed by ref. [94]. The Pool Mean Group (PMG) estimator, which is more resistant to lag ordering as well as outliers, makes it a more robust estimation method overall [94]. This strategy works well when the dataset has a mixed order of I(0) and I(1) but not I(2). Additionally, this approach produces heterogeneous results over the short run but homogenous results over the long run. Considering the PMG-ARDL preferred model, we evaluated Equation (1) using the following error correction (ECM) form:
L n L C F i , t = ϕ i E C T i , t + j = 0 q 1 γ i , j *   L n X i , t j + j = 1 p 1 δ i , j ˙ *   L n L C F i , t j + μ i , t  
where
E C T i , t = L n L C F i , t j θ i X i , t
ϕ i = ( 1 j = 1 p δ i , j ) θ i = j = 0 q γ i , j ϕ i δ i , j ˙ * = d = j + 1 p δ i , d γ i , j * = d = j + 1 q γ i , d
where Δ expresses the difference of the operators; LnLCF is the dependent variable load capacity factor; each cross-sectional unit i in t period is associated with a set of independent variables (NR, TI, RE, EA) represented by X with the same number of lags, q; ϕ and θ are the adjustment coefficient and long-run coefficient; once achieving the convergence, the latter one yields γ * and δ * ; and the error term is symbolized by μ .

4. Empirical Findings and Discussion

This part of the study reports the empirical outcomes of several econometric tests. First, this study tests the multicollinearity among the variables through VIF, and the results are shown in Table 3. Since all VIFs are less than four, and the mean VIF is far below this value, we can conclude that multicollinearity might not exist or is very low in this exploration.
In the next step of this empirical analysis, the results of the CSD tests are reported, as seen in Table 4. The goal of the CSD test is to ascertain whether an interruption within any of the representative entities (for instance, a nation) may have a ripple effect on the remainder of the entities and alter their economic circumstances because of mutual dependency. Furthermore, while examining a study topic such as technology, it becomes evident that this fact of interdependency is particularly true since numerous nations rely on one another for the acquisition of newly invented technological hardware and assistance. Among the most pressing concerns, CSD must be addressed in the case of panel data to generate valid results [95]. Therefore, in order to account for this issue, this study employs four tests to examine the existence of CSD: the Breusch–Pagan LM [85], Pesaran [86] scaled LM, Baltagi et al. [87] bias-correlated scaled LM, and Pesaran [86] CSD tests. The four CSD test results are displayed in Table 4 and show the existence of CSD within the entire dataset, as the significant findings endorse the acceptance of the alternative hypothesis of cross-sectional dependence among the study variables.
This research’s empirical analysis also necessitates the assessment of the stochastic nature of each variable to be determined employing stationary tests. The application of the first-generational unit root test should be avoided when CSD is present among the cross-sections since can lead to misleading results. In this regard, the CIPS and CADF tests, which are second-generation unit root tests, are utilized in this step. Moreover, the PMG-ARDL model requires level [I(0)] or first difference [I(1)] integration order of the study variables rather than second difference, [I(2)]. According to the unit root test results displayed in Table 5, it is noticeable that all the study variables validate this statement in both CIPS and CADF cases. All of the variables exhibit stationarity at this level, except for natural resource rent, which is stationary at the first difference. Consequently, it may be inferred from the results of both unit root tests that all series exhibit a mixed order of integration.
This research examines the long-term equilibrium relationship to determine whether the investigated variables are convergent or not. The Kao residual co-integration test was employed for this purpose, as outlined in Table 6. Based on the test outcomes, it can be concluded that there is an equilibrium connection over time between LCF, natural resource rent, renewable energy consumption, technological innovation, and employment in agriculture, with the acceptance of the alternative hypothesis of long-term co-integration at the 1% significance level. Moreover, the Johansen–Fisher test was employed in this study to further define the long-term connection. According to the demonstrated results in Table 7, this test is in harmony with the Kao test and claims a long-term co-integration relationship between the LCF and the independent variables under consideration for 1992–2020 in the BRICS nations.
Soon after satisfying the prerequisite criterion of long-term co-integration within the variables, the present analysis proceeded to examine the extent of these co-integrations by evaluating the coefficients. Therefore, we investigated the short-term and long-term effects of the predictor factors on LCF utilizing the PMG-ARDL approach, depicted in Table 8. According to the tabulated findings, with a convergence rate of 47%, the findings provide strong and reliable forecasting. This convergence rate is attributed to the influence of the explanatory variables on their respective equilibria. Hence, the error correction term (ECT) with statistical significance confirms the existence of a balanced connection among the parameters, and the divergence from equilibrium is adjusted by around 47% yearly.
The PMG-ARDL estimation finds that all parameters, except for LnEA, have an insignificant impact on the LCF in the short term, while all factors are observed to have a statistically significant impact on the LCF over the long run. The findings show that renewable energy and the LCF have a positive and statistically significant association in the long run, although this interaction is not significant in the short term, which means that renewable energy usage has no immediate effect on the BRICS natural environment. On the contrary, a 1% increase in renewable energy usage would improve the BRICS long-term LCF by 0.22%. BRICS member nations’ increasing environmental awareness in their developmental paths is likely the main rationale behind this phenomenon. The rapid increase in the use of renewable sources derived from electricity within BRICS nations has been observed to contribute to a notable deceleration in ecological degradation [96,97].
Moreover, renewable energy sources convey the necessary attributes of reliability and sustainability and yield environmental advantages through the reduction of CO2 and other GHG emissions, thereby averting any potential deceleration in the rate of advancement. However, several member states, like China and South Africa, still encounter challenges in achieving significant milestones in sustainable energy objectives. Brazil has successfully achieved its energy target and currently holds the greatest proportion of renewable energy utilization among the BRICS economies [47]. It is imperative to acknowledge that a significant challenge remains for the member nations that effectively achieved their renewable energy targets. The BRICS nations, however, are still making progress toward achieving environmental objectives by integrating renewable energy technology. The result of this study is consistent with those of others in this field [38,73,93].
Moving toward the influence of natural resource rent on the environment, it is seen that there is no substantial impact on the short-run LCF in the sampled countries. Apart from this, long-run natural resources exhibit a statistically significant detrimental impact on the BRICS nations. The long-run coefficient refers to an increase in natural resource use that leads to a 0.03% exacerbation of environmental degradation. The findings of [43,56,98,99] show consistency with this finding. This empirical finding implies that the revenue that the BRICS nations earn from extracting and processing raw materials has a major role in the environmental degradation that they are currently experiencing, since these revenues are re-invested in their industrialization processes. Moreover, industrialization, spurred by rapid economic growth, accelerates the demand for raw materials and their extraction. Consequently, it results in heightened levels of environmental degradation, manifested in phenomena such as air pollution and deforestation. The mining of natural resources and the overuse of fossil fuels are direct results of BRICS nations’ heavy reliance on industrial output. Among the BRICS countries, Russia, China, and Brazil are listed as the top natural resource producers and consumers in the world, and their oil, natural gas, and coal-based power stations significantly contribute to elevated levels of environmental pollution.
According to Table 8, the coefficients pertaining to employment in the agricultural sector exhibit statistical significance and demonstrate positive effects in both the short and long term. For each unit of increased agricultural employment, BRICS nations enrich their LCF by 0.21% and 0.20%, correspondingly, in the short and long run. Environmental quality is highly influenced by agricultural employment, particularly in agricultural areas; industrial zones remain the prime source of pollution. Furthermore, the utilization of cultivated land for agricultural operations helps lower atmospheric carbon dioxide levels by sequestering carbon in the soil. In addition, plants in croplands have the potential to effectively decrease dust concentrations. Likewise, the presence of farmland hedgerows and the associated riparian zones, such as riverbanks, exhibit a notable degree of biodiversity due to increased agricultural activities. Therefore, agricultural employment plays a leading role in maximizing the ability of the environment to recover from and absorb pollution. However, Jiang et al. [27] presented a contrasting perspective by asserting that the environmental quality is severely affected by agricultural employment since the extension of agricultural frontiers results in deforestation as well as the consequent production of trash and residue, leading to water and soil contamination.
The BRICS nations experience a notable and adverse influence on their LCF due to technical breakthroughs. This suggests that the increasing technological advancements in these countries are contributing to a decline in environmental sustainability, as seen by a long-term decrease in LCF at a pace of 0.09%. Nevertheless, it is important to note that the impact of technological innovation on LCF is not significant in the short run. This might be due to the fact that technological advancement is a complex and time-consuming process that cannot be fully developed instantly. In addition, it is worth noting that technical research trials necessitate a substantial duration. However, based on the findings of the PMG-ARDL analysis, it is found that advancement in technology does not contribute to long-term sustainable environmental development. The underlying cause of this outcome is that technical advancements might result in heightened utilization of resources, thus resulting in elevated emissions within the environment. This suggests that the BRICS countries are not making substantial investments in green technological innovation intended to mitigate environmental degradation. While the countries have adopted new technologies, the focus of these technologies is predominantly centered around industrial expansion. This pursuit often comes at the expense of environmental quality, as it leads to the creation of atmospheric contamination in these nations. Furthermore, the process of transitioning their technological and energy infrastructure to an eco-friendly technology framework requires a significant amount of time. This finding is consistent with the studies conducted by refs. [21,23,100]. On the other hand, research conducted by Awosusi et al. [22] indicated that technical advances boost LCF, which in turn leads to increase environmental sustainability. The summary of the PMG-ARDL model results is shown in Figure 4.

5. Conclusions and Policy Insights

5.1. Concluding Remarks

This study aimed to enhance the understanding of the environmental impact of renewable energy usage, natural resource rent, agricultural employment, and technological advancements on the BRICS nations’ LCF for the 1992–2020 period. This study is a pioneering investigation within the BRICS nations, focusing on the relationship between agricultural employment and environmental sustainability, specifically in terms of the load capacity factor. To achieve the objectives of the study, multiple panel methods from the first and second generations are used in this investigation. The dependence of cross-sections is included in the methodology. Additionally, the stationarity was tested using both the CIPS and CADF unit root tests, and the presence of a long-term co-integration between the variables was assessed using the panel co-integration methods developed by Kao and Johansen. These factual observations enabled us to establish the consistency of the estimators concerning the existing body of environment research and align with the specific attributes of the dataset. In addition, the PMG-ARDL approach is utilized to assess the impact of the regressors on the load capacity factor.
In general, the findings indicate (i) the presence of cross-sectional dependence; (ii) that the panel dataset exhibits a combination of stationary behavior at I(0) and I(1) orders; (iii) evidence in support of a long-term relationship; (iv) the results from the PMG-ARDL estimator show that, in the short run, except for agricultural employment, the regressors have no significant impact on the LCF. However, renewable energy and employment in the agricultural sector were found to contribute positively to the improvement of the long-run LCF and thus environmental sustainability. Conversely, the long-term reduction of LCF can be attributed to factors such as the depletion of natural resource rent and technological innovation.

5.2. Policy Recommendations

The results of this study can be used to propose multiple policy recommendations.
To enhance the environmental sustainability in BRICS nations, their governments should implement policies to increase the proportion of clean energy within the overall energy intake and encourage renewable energy investment. This can be accomplished through raising the tax rate for fossil fuels, which will push renewable energy intake. The implementation of energy-saving initiatives, which restrict the use of fossil fuels, would also be fruitful in achieving targets. In addition, policymakers can create educational initiatives aimed at raising awareness among individuals regarding the advantages associated with the use of renewable energy sources.
Instead of prioritizing aggregate technological advancements, it is recommended for BRICS nations to shift their focus towards cleaner and more environmentally friendly technologies. It is imperative for authorities to actively promote the engagement of foreign investors in environmentally friendly technology. Likewise, it is recommended that the allocation of funds for research and development be directed toward renewable-energy-based technology inventions.
It is imperative for BRICS countries to mitigate the risks associated with mining by adopting strategies that prioritize the utilization of renewable energies such as tidal, wind, and solar power. It is also recommended that governing bodies implement regulations on extraction practices employing rudimentary techniques to mitigate the contamination of the soil.
The empirical results suggest that boosting agricultural employment within the BRICS nations should be a top priority for policymakers. Government organizations are required to provide financial aid for agricultural entrepreneurship to encourage agricultural employment and the adoption of environmentally sustainable farming techniques. Additionally, standard-setting farmer education is important for raising farmers’ ecological consciousness, and appropriate institutions should be established to provide training for the farmers on modern, low-emitting agricultural techniques. Facilitating agro-research is also necessary for the development of more pollution-reducing crops and plants.

5.3. Limitations and Future Research Directions

It is essential to acknowledge and evaluate the constraints inherent in this work and to incorporate these considerations into further research endeavors. One weakness of this study is the inability to differentiate between the proportions of the labor force involved in agriculture based on technology-enabled or manual work, due to data constraints. However, future research has the potential to address this restriction by categorizing the labor force into manual and technological sectors, contingent upon the availability of relevant data. In addition, we employed total patent applications as a surrogate measure for technical innovation. Nonetheless, future investigations may explore the inclusion of patents related to agricultural advancements or renewable energy generation. Future studies may also explore additional variables that are pertinent to the BRICS states, such as indicators of institutional quality or governance, foreign direct investment, and industrialization, among others. Furthermore, linear modeling is employed in this study. However, future research endeavors may consider using nonlinear modeling techniques as well.

Author Contributions

Conceptualization, E.J. and M.G.K.; methodology, N.N.A.; software, M.G.K.; validation, M.E.H., E.U. and M.G.K.; formal analysis, M.G.K.; investigation, E.J.; resources, E.U.; data curation, N.N.A.; writing—original draft preparation, M.G.K., N.N.A. and E.J.; writing—review and editing, M.E.H. and E.U.; visualization, E.U.; supervision, M.E.H.; project administration, E.U.; funding acquisition, E.J. All authors have read and agreed to the published version of the manuscript.

Funding

This research received no external funding.

Institutional Review Board Statement

Not applicable.

Informed Consent Statement

Not applicable.

Data Availability Statement

Data sources are mentioned in the data description section of the manuscript.

Conflicts of Interest

The authors declare no conflict of interest.

References

  1. Pata, U.K. Linking renewable energy, globalization, agriculture, CO2 emissions and ecological footprint in BRIC countries: A sustainability perspective. Renew. Energy 2021, 173, 197–208. [Google Scholar] [CrossRef]
  2. Jahanger, A.; Ogwu, S.O.; Onwe, J.C.; Awan, A. The prominence of technological innovation and renewable energy for the ecological stainability in top SDGs nations: Insights from the load capacity factor. Gondwana Res. 2023, in press. [Google Scholar] [CrossRef]
  3. IPCC. IPCC Special Report on Global Warming of 1.5 °C w. 2018. Available online: https://www.ipcc.ch/sr15/ (accessed on 20 December 2022).
  4. Lindsey, R.; Dahlman, L. Climate Change: Global Temperature. 2021. Available online: https://www.climate.gov/news-features/understanding-climate/climate-change-global-temperature (accessed on 8 July 2023).
  5. Gyamfi, B.A.; Onifade, S.T.; Erdoğan, S.; Ali, E.B. Colligating ecological footprint and economic globalization after COP21: Insights from agricultural value-added and natural resources rents in the E7 economies. Int. J. Sustain. Dev. World Ecol. 2023, 30, 500–514. [Google Scholar] [CrossRef]
  6. Liu, H.; Wong, W.K.; Cong, P.T.; Nassani, A.A.; Haffar, M.; Abu-Rumman, A. Linkage among Urbanization, energy Consumption, economic growth and carbon Emissions. Panel data analysis for China using ARDL model. Fuel 2023, 332, 126122. [Google Scholar] [CrossRef]
  7. Sikder, M.; Wang, C.; Yao, X.; Huai, X.; Wu, L.; KwameYeboah, F.; Dou, X. The integrated impact of GDP growth, industrialization, energy use, and urbanization on CO2 emissions in developing countries: Evidence from the panel ARDL approach. Sci. Total Environ. 2022, 837, 155795. [Google Scholar] [CrossRef]
  8. Chien, F.; Hsu, C.C.; Ozturk, I.; Sharif, A.; Sadiq, M. The role of renewable energy and urbanization towards greenhouse gas emission in top Asian countries: Evidence from advance panel estimations. Renew. Energy 2022, 186, 207–216. [Google Scholar] [CrossRef]
  9. Usman, M.; Balsalobre-Lorente, D.; Jahanger, A.; Ahmad, P. Are Mercosur economies going green or going away? An empirical investigation of the association between technological innovations, energy use, natural resources and GHG emissions. Gondwana Res. 2023, 113, 53–70. [Google Scholar] [CrossRef]
  10. Kibria, M.G. Ecological footprint in Bangladesh: Identifying the intensity of economic complexity and natural resources. Heliyon 2023, 9, e14747. [Google Scholar] [CrossRef]
  11. Chu, L.K. Determinants of ecological footprint in OCED countries: Do environmental-related technologies reduce environmental degradation? Environ. Sci. Pollut. Res. 2022, 29, 23779–23793. [Google Scholar] [CrossRef]
  12. Alvarado, R.; Tillaguango, B.; Dagar, V.; Ahmad, M.; Işık, C.; Méndez, P.; Toledo, E. Ecological footprint, economic complexity and natural resources rents in Latin America: Empirical evidence using quantile regressions. J. Clean. Prod. 2021, 318, 128585. [Google Scholar] [CrossRef]
  13. Siche, R.; Pereira, L.; Agostinho, F.; Ortega, E. Convergence of ecological footprint and emergy analysis as a sustainability indicator of countries: Peru as case study. Commun. Nonlinear Sci. Numer. Simul. 2010, 15, 3182–3192. [Google Scholar] [CrossRef]
  14. Pata, U.K. Do renewable energy and health expenditures improve load capacity factor in the USA and Japan? A new approach to environmental issues. Eur. J. Health Econ. 2021, 22, 1427–1439. [Google Scholar] [CrossRef] [PubMed]
  15. Dogan, N. Agriculture and Environmental Kuznets Curves in the case of Turkey: Evidence from the ARDL and bounds test. Agric. Econ. 2016, 62, 566–574. [Google Scholar] [CrossRef]
  16. Balsalobre-Lorente, D.; Driha, O.M.; Bekun, F.V.; Osundina, O.A. Do agricultural activities induce carbon emissions? The BRICS experience. Environ. Sci. Pollut. Res. 2019, 26, 25218–25234. [Google Scholar] [CrossRef] [PubMed]
  17. Prastiyo, S.E.; Irham; Hardyastuti, S.; Jamhari, F. How agriculture, manufacture, and urbanization induced carbon emission? The case of Indonesia. Environ. Sci. Pollut. Res. 2020, 27, 42092–42103. [Google Scholar] [CrossRef] [PubMed]
  18. Raihan, A.; Muhtasim, D.A.; Farhana, S.; Hasan, M.A.U.; Pavel, M.I.; Faruk, O.; Mahmood, A. Nexus between economic growth, energy use, urbanization, agricultural productivity, and carbon dioxide emissions: New insights from Bangladesh. Energy Nexus 2022, 8, 100144. [Google Scholar] [CrossRef]
  19. Yang, B.; Jahanger, A.; Ali, M. Remittance inflows affect the ecological footprint in BICS countries: Do technological innovation and financial development matter? Environ. Sci. Pollut. Res. 2021, 28, 23482–23500. [Google Scholar] [CrossRef]
  20. Wahab, S.; Zhang, X.; Safi, A.; Wahab, Z.; Amin, M. Does energy productivity and technological innovation limit trade-adjusted carbon emissions? Econ. Res. Ekon. Istraživanja 2021, 34, 1896–1912. [Google Scholar] [CrossRef]
  21. Su, Z.W.; Umar, M.; Kirikkaleli, D.; Adebayo, T.S. Role of political risk to achieve carbon neutrality: Evidence from Brazil. J. Environ. Manag. 2021, 298, 113463. [Google Scholar] [CrossRef]
  22. Awosusi, A.A.; Kutlay, K.; Altuntaş, M.; Khodjiev, B.; Agyekum, E.B.; Shouran, M.; Kamel, S. A roadmap toward achieving sustainable environment: Evaluating the impact of technological innovation and globalization on load capacity factor. Int. J. Environ. Res. Public Health 2022, 19, 3288. [Google Scholar] [CrossRef]
  23. Adebayo, T.S.; Oladipupo, S.D.; Adeshola, I.; Rjoub, H. Wavelet analysis of impact of renewable energy consumption and technological innovation on CO2 emissions: Evidence from Portugal. Environ. Sci. Pollut. Res. 2022, 29, 23887–23904. [Google Scholar] [CrossRef] [PubMed]
  24. Ullah, A.; Khan, D.; Khan, I.; Zheng, S. Does agricultural ecosystem cause environmental pollution in Pakistan? Promise and menace. Environ. Sci. Pollut. Res. 2018, 25, 13938–13955. [Google Scholar] [CrossRef] [PubMed]
  25. Raihan, A.; Tuspekova, A. The nexus between economic growth, renewable energy use, agricultural land expansion, and carbon emissions: New insights from Peru. Energy Nexus 2022, 6, 100067. [Google Scholar] [CrossRef]
  26. Charles, K. Food Production Emissions Make Up More Than a Third of Global Total. New Scientist. 2021. Available online: https://www.newscientist.com/article/2290068-food-production-emissions-make-up-more-than-a-third-of-global-total/ (accessed on 21 July 2023).
  27. Jiang, G.; Alvarado, R.; Murshed, M.; Tillaguango, B.; Toledo, E.; Méndez, P.; Isik, C. Effect of agricultural employment and export diversification index on environmental pollution: Building the agenda towards sustainability. Sustainability 2022, 14, 677. [Google Scholar] [CrossRef]
  28. Rahman, M.M. Green Job Assessment in Agriculture and Forestry Sector of Bangladesh. 2009. Available online: https://www.ilo.org/wcmsp5/groups/public/---asia/---ro-bangkok/---ilo-dhaka/documents/publication/wcms_156139.pdf (accessed on 5 July 2023).
  29. Jarvis, M.; Lange, G.M.; Hamilton, K.; Ruta, G.; Chakraborti, L.; Desai, D.; Edens, B.; Li, H. The Changing Wealth of Nations: Measuring Sustainable Development in the New Millennium; World Bank, The International Bank for Reconstruction and Development: Washington, DC, USA, 2011. [Google Scholar]
  30. Sarkodie, S.A.; Strezov, V. Empirical study of the environmental Kuznets curve and environmental sustainability curve hypothesis for Australia, China, Ghana and USA. J. Clean. Prod. 2018, 201, 98–110. [Google Scholar] [CrossRef]
  31. Baloch, M.A.; Mahmood, N.; Zhang, J.W. Effect of natural resources, renewable energy and economic development on CO2 emissions in BRICS countries. Sci. Total Environ. 2019, 678, 632–638. [Google Scholar]
  32. Chen, M.; Sinha, A.; Hu, K.; Shah, M.I. Impact of Technological Innovation on Energy Efficiency in Industry 4.0 Era: Moderation of Shadow Economy in Sustainable Development. Technol. Forecast. Soc. Chang. 2021, 164, 120521. [Google Scholar] [CrossRef]
  33. Abbasi, K.R.; Awan, A.; Bandyopadhyay, A.; Rej, S.; Banday, T.P. Investigating the inverted N-shape EKC in the presence of renewable and nuclear energy in a global sample. Clean Technol. Environ. Policy 2023, 25, 1179–1194. [Google Scholar] [CrossRef]
  34. Kirikkaleli, D.; Adebayo, T.S. Do Renewable Energy Consumption and Financial Development Matter for Environmental Sustainability? New Glob. Evidence. Sustain. Develop. 2021, 29, 583–594. [Google Scholar] [CrossRef]
  35. Bhuiyan, M.R.A.; Mamur, H.; Begum, J. A brief review on renewable and sustainable energy resources in Bangladesh. Clean. Eng. Technol. 2021, 4, 100208. [Google Scholar] [CrossRef]
  36. World Bank. Annual Report 2017 End Extreme Poverty. Boost Shared Prosperity; World Bank: Washington, DC, USA, 2017. [Google Scholar]
  37. Devonshire-Ellis, C. The BRICS Has Overtaken the G7 In Global GDP. 2023. Available online: https://www.silkroadbriefing.com/news/2023/03/27/the-brics-has-overtaken-the-g7-in-global-gdp/#:~:text=The%20current%20BRICS%20five%20now,almost%20certainly%20bringing%20that%20forward (accessed on 5 July 2023).
  38. Ojekemi, O.S.; Ağa, M.; Magazzino, C. Towards Achieving Sustainability in the BRICS Economies: The Role of Renewable Energy Consumption and Economic Risk. Energies 2023, 16, 5287. [Google Scholar] [CrossRef]
  39. Dong, K.; Sun, R.; Hochman, G. Do natural gas and renewable energy consumption lead to less CO2 emission? Empirical evidence from a panel of BRICS countries. Energy 2017, 141, 1466–1478. [Google Scholar] [CrossRef]
  40. Usman, M.; Makhdum, M.S.A. What abates ecological footprint in BRICS-T region? Exploring the influence of renewable energy, non-renewable energy, agriculture, forest area and financial development. Renew. Energy 2021, 179, 12–28. [Google Scholar] [CrossRef]
  41. Magazzino, C.; Mele, M. A New Machine Learning Algorithm to Explore the CO2 Emissions-Energy Use-Economic Growth Trilemma. Ann. Oper. Res. 2022. [Google Scholar] [CrossRef]
  42. Ecological Footprint Network. Country Trend. 2023. Available online: https://data.footprintnetwork.org/#/countryTrends?cn=21&type=BCtot,EFCtot (accessed on 6 July 2023).
  43. Pata, U.K.; Isik, C. Determinants of the load capacity factor in China: A novel dynamic ARDL approach for ecological footprint accounting. Resour. Policy 2021, 74, 102313. [Google Scholar] [CrossRef]
  44. Alola, A.A.; Özkan, O.; Usman, O. Role of Non-Renewable Energy Efficiency and Renewable Energy in Driving Environmental Sustainability in India: Evidence from the Load Capacity Factor Hypothesis. Energies 2023, 16, 2847. [Google Scholar] [CrossRef]
  45. Khan, A.; Muhammad, F.; Chenggang, Y.; Hussain, J.; Bano, S.; Khan, M.A. The impression of technological innovations and natural resources in energy-growth-environment nexus: A new look into BRICS economies. Sci. Total Environ. 2020, 727, 138265. [Google Scholar] [CrossRef]
  46. Ullah, S.; Luo, R.; Adebayo, T.S.; Kartal, M.T. Paving the ways toward sustainable development: The asymmetric effect of economic complexity, renewable electricity, and foreign direct investment on the environmental sustainability in BRICS-T. Environ. Dev. Sustain. 2023, 1–25. [Google Scholar] [CrossRef]
  47. Samour, A.; Adebayo, T.S.; Agyekum, E.B.; Khan, B.; Kamel, S. Insights from BRICS-T economies on the impact of human capital and renewable electricity consumption on environmental quality. Sci. Rep. 2023, 13, 5245. [Google Scholar] [CrossRef]
  48. Adebayo, T.S.; Samour, A. Renewable energy, fiscal policy and load capacity factor in BRICS countries: Novel findings from panel nonlinear ARDL model. Environ. Dev. Sustain. 2023, 1–25. [Google Scholar] [CrossRef]
  49. Dogan, A.; Pata, U.K. The role of ICT, R&D spending and renewable energy consumption on environmental quality: Testing the LCC hypothesis for G7 countries. J. Clean. Prod. 2022, 380, 135038. [Google Scholar]
  50. Dam, M.M.; Sarkodie, S.A. Renewable energy consumption, real income, trade openness, and inverted load capacity factor nexus in Turkiye: Revisiting the EKC hypothesis with environmental sustainability. Sustain. Horiz. 2023, 8, 100063. [Google Scholar] [CrossRef]
  51. Shang, Y.; Razzaq, A.; Chupradit, S.; An, N.B.; Abdul-Samad, Z. The role of renewable energy consumption and health expenditures in improving load capacity factor in ASEAN countries: Exploring new paradigm using advance panel models. Renew. Energy 2022, 191, 715–722. [Google Scholar] [CrossRef]
  52. Pata, U.K.; Samour, A. Assessing the role of the insurance market and renewable energy in the load capacity factor of OECD countries. Environ. Sci. Pollut. Res. 2023, 30, 48604–48616. [Google Scholar] [CrossRef] [PubMed]
  53. Usman, O. Renewable energy and CO2 emissions in G7 countries: Does the level of expenditure on green energy technologies matter? Environ. Sci. Pollut. Res. 2023, 30, 26050–26062. [Google Scholar] [CrossRef]
  54. Jin, G.; Huang, Z. Asymmetric impact of renewable electricity consumption and industrialization on environmental sustainability: Evidence through the lens of load capacity factor. Renew. Energy 2023, 212, 514–522. [Google Scholar] [CrossRef]
  55. Zhao, W.X.; Samour, A.; Yi, K.; Al-Faryan, M.A.S. Do technological innovation, natural resources and stock market development promote environmental sustainability? Novel evidence based on the load capacity factor. Resour. Policy 2023, 82, 103397. [Google Scholar] [CrossRef]
  56. Ni, Z.; Yang, J.; Razzaq, A. How do natural resources, digitalization, and institutional governance contribute to ecological sustainability through load capacity factors in highly resource-consuming economies? Resour. Policy 2022, 79, 103068. [Google Scholar] [CrossRef]
  57. Yang, M.; She, D.; Abbas, S.; Ai, F.; Adebayo, T.S. Environmental cost of financial development within the framework of the load capacity curve hypothesis in the BRICS economies: Do renewable energy consumption and natural resources mitigate some burden? Geol. J. 2023, 58, 3915–3927. [Google Scholar] [CrossRef]
  58. Li, X.; Sun, Y.; Dai, J.; Mehmood, U. How do natural resources and economic growth impact load capacity factor in selected Next-11 countries? Assessing the role of digitalization and government stability. Environ. Sci. Pollut. Res. 2023, 30, 85670–85684. [Google Scholar] [CrossRef]
  59. Ibrahim, R.L.; Ajide, K.B. The dynamic heterogeneous impacts of nonrenewable energy, trade openness, total natural resource rents, financial development and regulatory quality on environmental quality: Evidence from BRICS economies. Resour. Policy 2021, 74, 102251. [Google Scholar] [CrossRef]
  60. Pata, U.K.; Ertugrul, H.M. Do the Kyoto Protocol, geopolitical risks, human capital and natural resources affect the sustainability limit? A new environmental approach based on the LCC hypothesis. Resour. Policy 2023, 81, 103352. [Google Scholar] [CrossRef]
  61. Sun, Y.; Usman, M.; Radulescu, M.; Pata, U.K.; Balsalobre-Lorente, D. New insights from the STIPART model on how environmental-related technologies, natural resources and the use of the renewable energy influence load capacity factor. Gondwana Res. 2023, in press. [Google Scholar] [CrossRef]
  62. Balsalobre-Lorente, D.; Shahbaz, M.; Roubaud, D.; Farhani, S. How economic growth, renewable electricity and natural resources contribute to CO2 emissions? Energy Policy 2018, 113, 356–367. [Google Scholar] [CrossRef]
  63. Wang, Q.; Sun, J.; Li, R.; Pata, U.K. Linking Trade Openness to Load Capacity Factor: The Threshold Effects of Natural Resource Rent and Corruption Control. Gondwana Res. 2023, in press. [Google Scholar] [CrossRef]
  64. Ridzuan, N.H.A.M.; Marwan, N.F.; Khalid, N.; Ali, M.H.; Tseng, M.L. Effects of agriculture, renewable energy, and economic growth on carbon dioxide emissions: Evidence of the environmental Kuznets curve. Resour. Conserv. Recycl. 2020, 160, 104879. [Google Scholar] [CrossRef]
  65. Muoneke, O.B.; Okere, K.I.; Nwaeze, C.N. Agriculture, globalization, and ecological footprint: The role of agriculture beyond the tipping point in the Philippines. Environ. Sci. Pollut. Res. 2022, 29, 54652–54676. [Google Scholar] [CrossRef]
  66. Gong, Z.; Guo, W.; Słowinski, R. Transaction and interaction behavior-based consensus model and its application to optimal carbon emission reduction. Omega 2021, 104, 102491. [Google Scholar] [CrossRef]
  67. Ma, Q.; Murshed, M.; Khan, Z. The nexuses between energy investments, technological innovations, emission taxes, and carbon emissions in China. Energy Policy 2021, 155, 112345. [Google Scholar] [CrossRef]
  68. Mehmood, U.; Tariq, S.; Aslam, M.U.; Agyekum, E.B.; Uhunamure, S.E.; Shale, K.; Khan, M.F. Evaluating the impact of digitalization, renewable energy use, and technological innovation on load capacity factor in G8 nations. Sci. Rep. 2023, 13, 9131. [Google Scholar] [CrossRef]
  69. Sharif, A.; Saqib, N.; Dong, K.; Khan, S.A.R. Nexus between green technology innovation, green financing, and CO2 emissions in the G7 countries: The moderating role of social globalisation. Sustain. Dev. 2022, 30, 1934–1946. [Google Scholar] [CrossRef]
  70. Pata, U.K.; Caglar, A.E.; Kartal, M.T.; Depren, S.K. Evaluation of the role of clean energy technologies, human capital, urbanization, and income on the environmental quality in the United States. J. Clean. Prod. 2023, 402, 136802. [Google Scholar] [CrossRef]
  71. Khan, A.; Chenggang, Y.; Hussain, J.; Kui, Z. Impact of technological innovation, financial development and foreign direct investment on renewable energy, non-renewable energy and the environment in belt & Road Initiative countries. Renew. Energy 2021, 171, 479–491. [Google Scholar]
  72. Akadiri, S.S.; Adebayo, T.S.; Riti, J.S.; Awosusi, A.A.; Inusa, E.M. The effect of financial globalization and natural resource rent on load capacity factor in India: An analysis using the dual adjustment approach. Environ. Sci. Pollut. Res. 2022, 29, 89045–89062. [Google Scholar] [CrossRef]
  73. Pata, U.K.; Kartal, M.T.; Dam, M.M.; Kaya, F. Navigating the Impact of Renewable Energy, Trade Openness, Income, and Globalization on Load Capacity Factor: The Case of Latin American and Caribbean (LAC) Countries. Int. J. Energy Res. 2023, 2023, 6828781. [Google Scholar] [CrossRef]
  74. Algarni, S.; Tirth, V.; Alqahtani, T.; Alshehery, S.; Kshirsagar, P. Contribution of renewable energy sources to the environmental impacts and economic benefits for sustainable development. Sustain. Energy Technol. Assess. 2023, 56, 103098. [Google Scholar] [CrossRef]
  75. Khan, U.; Khan, A.M.; Khan, M.S.; Ahmed, P.; Haque, A.; Parvin, R.A. Are the impacts of renewable energy use on load capacity factors homogeneous for developed and developing nations? Evidence from the G7 and E7 nations. Environ. Sci. Pollut. Res. 2023, 30, 24629–24640. [Google Scholar] [CrossRef]
  76. Hossain, M.E.; Islam, M.S.; Bandyopadhyay, A.; Awan, A.; Hossain, M.R.; Rej, S. Mexico at the crossroads of natural resource dependence and COP26 pledge: Does technological innovation help? Resources Policy. 2022, 77, 102710. [Google Scholar] [CrossRef]
  77. Muhammad, B.; Khan, M.K.; Khan, M.I.; Khan, S. Impact of foreign direct investment, natural resources, renewable energy consumption, and economic growth on environmental degradation: Evidence from BRICS, developing, developed and global countries. Environ. Sci. Pollut. Res. 2021, 28, 21789–21798. [Google Scholar] [CrossRef]
  78. Caglar, A.E.; Guloglu, B.; Gedikli, A. Moving towards sustainable environmental development for BRICS: Investigating the asymmetric effect of natural resources on CO2. Sustain. Dev. 2022, 30, 1313–1325. [Google Scholar] [CrossRef]
  79. Awan, A.; Alnour, M.; Jahanger, A.; Onwe, J.C. Do technological innovation and urbanization mitigate carbon dioxide emissions from the transport sector? Technol. Soc. 2022, 71, 102128. [Google Scholar] [CrossRef]
  80. Corporate Finance Institute. Variance Inflation Factor (VIF). 2022. Available online: https://corporatefinanceinstitute.com/resources/data-science/variance-inflation-factor-vif/#:~:text=Generally%2C%20a%20VIF%20above%204,that%20needs%20to%20be%20corrected (accessed on 10 July 2023).
  81. Pesaran, M. General Diagnostic Tests for Cross Section Dependence in Panels. IZA Discussion Paper No. 1240. August 2004. Available online: https://www.google.com.hk/url?sa=t&rct=j&q=&esrc=s&source=web&cd=&cad=rja&uact=8&ved=2ahUKEwjIvPTcv4OCAxXZ0GEKHfcmCLYQFnoECAkQAQ&url=https%3A%2F%2Fftp.iza.org%2Fdp1240.pdf&usg=AOvVaw2UKizJ_lfLrkp9jA9xIOvU&opi=89978449 (accessed on 10 July 2023).
  82. Chudik, A.; Pesaram, H. Large Panel Data Models with Cross-Sectional Dependence: A Survey; Munich: CESifo Working Paper No. 4371; Centre for Economic Studies and IFO Institutes: Munich, Germany, 2013. [Google Scholar]
  83. Andrews, D. Cross-section regression with common shocks. Econometrica 2005, 73, 1551–1585. [Google Scholar] [CrossRef]
  84. Westerlund. Testing for error correction in panel data. Oxf. Bull. Econ. Stat. 2007, 69, 709–748. [Google Scholar] [CrossRef]
  85. Breusch, T.S.; Pagan, A.R. The Lagrange multiplier test and its applications to model specification in econometrics. Rev. Econ. Stud. 1980, 47, 239–253. [Google Scholar] [CrossRef]
  86. Pesaran, M.H. General Diagnostic Test for Cross Section Dependence in Panels; Working Paper; University of Cambridge & USC: Cambridge, UK, 2004. [Google Scholar]
  87. Baltagi, B.H.; Bresson, G.; Pirotte, A. Panel unit root tests and spatial dependence. J. Appl. Econom. 2007, 22, 339–360. [Google Scholar] [CrossRef]
  88. Dogan, E.; Seker, F. Determinants of CO2 emissions in the European Union: The role of renewable and non-renewable energy. Renew. Energy 2016, 94, 429–439. [Google Scholar] [CrossRef]
  89. Pesaran, M.H. A simple panel unit root test in the presence of cross-section dependence. J. Appl. Economet. 2007, 22, 265–312. [Google Scholar] [CrossRef]
  90. Kao, C. Spurious regression and residual-based test for cointegration in panel data. J. Econom. 1999, 90, 1–44. [Google Scholar] [CrossRef]
  91. Larsson, R.; Lyhagen, J.; Löthgren, M. Likelihood-based cointegration tests in heterogeneous panels. Econom. J. 2001, 4, 109–142. [Google Scholar] [CrossRef]
  92. Maddala, G.S.; Wu, S. A comparative study of unit root tests with panel data and a new simple test. Oxf. Bull. Econ. Stat. 1999, 61, 631–652. [Google Scholar] [CrossRef]
  93. Bekun, F.V.; Alola, A.A.; Sarkodie, S.A. Toward a sustainable environment: Nexus between CO2 emissions, resource rent, renewable and nonrenewable energy in 16-EU countries. Sci. Total Environ. 2019, 657, 1023–1029. [Google Scholar] [CrossRef] [PubMed]
  94. Pesaran, M.H.; Shin, Y.; Smith, R.P. Pooled mean group estimation of dynamic heterogeneous panels. J. Am. Stat. Assoc. 1999, 94, 621–634. [Google Scholar] [CrossRef]
  95. Agubata, N.S.; Okolo, L.I.; Ogwu, S.O. Effect of employee benefits on organizational growth of consumer goods firms in Nigeria. Stud. Univ. Vasile Goldiș Arad Ser. Științe Econ. 2022, 32, 116–137. [Google Scholar] [CrossRef]
  96. Çıtak, F.; Şişman, M.Y.; Bağcı, B. Nexus between disaggregated electricity consumption and CO2 emissions in Turkey: New evidence from quantile-on-quantile approach. Environ. Ecol. Stat. 2021, 28, 843–860. [Google Scholar] [CrossRef]
  97. Farhani, S.; Shahbaz, M. What role of renewable and non-renewable electricity consumption and output is needed to initially mitigate CO2 emissions in MENA region? Renew. Sustain. Energy Rev. 2014, 40, 80–90. [Google Scholar] [CrossRef]
  98. Nathaniel, S.P.; Yalçiner, K.; Bekun, F.V. Assessing the environmental sustainability corridor: Linking natural resources, renewable energy, human capital, and ecological footprint in BRICS. Resour. Pol. 2020, 70, 101924. [Google Scholar] [CrossRef]
  99. Adedoyin, F.F.; Alola, A.A.; Bekun, F.V. An assessment of environmental sustainability corridor: The role of economic expansion and research and development in EU countries. Sci. Total Environ. 2020, 713, 136726. [Google Scholar] [CrossRef]
  100. Sinha, A.; Sengupta, T.; Alvarado, R. Interplay between technological innovation and environmental quality: Formulating the SDG policies for next 11 economies. J. Clean. Prod. 2020, 242, 118549. [Google Scholar] [CrossRef]
Figure 1. Load Capacity Factor trends in BRICS nations.
Sustainability 15 15083 g001
Figure 2. Connectivity and interaction towards environmental quality. Note: The “+” sign indicates a positive impact on environmental quality (LCF), while the “−“ sign indicates a detrimental impact on LCF.
Sustainability 15 15083 g002
Figure 3. Estimation methodology.
Sustainability 15 15083 g003
Figure 4. Summary of the PMG-ARDL estimations. Note: SR refers to short run; LR is long run; LCF represents the load capacity factor; ‘/’ indicates the effect is null; ‘+’ and ‘−’ indicate positive effect and negative effect.
Sustainability 15 15083 g004
Table 1. Descriptive analysis of the variables.
VariableSignifierUnit of MeasurementSources
Load capacity factorLnLCFBiocapacity/ecologicalGlobal footprint network
Natural resource rentLnNR% of GDPWDI
Technological innovationLnTITotal patent applicationsWDI
Renewable energy useLnRE% of total final energy consumptionWDI
Employment in agricultureLnEA% of total employmentWDI
Table 2. Preliminary statistics of the variables.
LnLCFLnNRLnTILnRELnEA
Std. Dev.0.4006820.3183220.6018740.4218660.302236
Mean−0.1272360.6076884.4320381.2302121.339097
Median−0.3324330.5828754.3979231.2688121.275416
Max0.6464861.3324936.1880851.7117231.800126
Min−0.644104−0.0636003.4969300.5024270.765912
Skewness0.6338270.3658471.179001−0.5122970.016533
Kurtosis1.9505732.6159134.3782571.8342081.817678
Jarque-Bera1.362314.1258524.069421.553562.452155
Probability0.7830.1270.1350.7650.553
Observations145145145145145
Table 3. VIF test.
Table 3. VIF test.
VariablesVIF
LnRE3.06
LnNR2.50
LnEA1.63
LnTI1.16
Mean VIF2.09
Table 4. Cross-sectional dependence tests.
Cross-Section TestsVariables
LnLCFLnNRLnTILnRELnEA
Breusch–Pagan LM139.3720 *** (0.0000)115.3745 *** (0.0000)122.4192 ***
(0.0000)
127.7515 *** (0.0000)233.9747 *** (0.0000)
Pesaran scaled LM28.92846 *** (0.0000)23.56245 *** (0.0000)25.13770 *** (0.0000)26.33004 *** (0.0000)50.08226 *** (0.0000)
Bias-corrected scaled LM28.83917 *** (0.0000)23.47316 *** (0.0000)25.04842 *** (0.0000)26.24075 *** (0.0000)49.99298 *** (0.0000)
Pesaran CD7.965212 *** (0.0000)10.24121 *** (0.0000)10.39918 *** (0.00000)8.924698 *** (0.0000)15.20244 *** (0.0000)
Note: Null hypothesis (H0) of no cross-sectional dependency is rejected for all variables at a 1% significance level (corresponding p value). *** p < 0.01.
Table 5. Stationarity check.
VariablesCIPSCADF
Level Level
LnLCF−3.060 ***−2.535 ***
LnRE−2.559 ***−2.862 ***
LnNR−1.969−5.026 ***−1.435−2.899 ***
LnEA−2.787 ***−2.599 ***
LnTI−4.293 ***−2.981 ***
Note: Level and ∆ reported stationarity at the level and at first difference, respectively. *** p < 0.01.
Table 6. Kao residual co-integration test.
t-Statisticp-Value
ADF−2.627477 ***0.0043
Residual variance0.000302
HAC variance0.000222
Notes: *** p < 0.01.
Table 7. Johansen–Fisher panel co-integration test results.
Hypothesized Fisher Stat.Fisher Stat.
No. of CE(s)Trace TestProb.Max-Eigen TestProb.
None69.67 ***0.000037.08 ***0.0001
At most 139.23 ***0.000026.64 ***0.0030
At most 220.08 ***0.028513.500.1970
At most 314.020.17229.1150.5212
At most 421.53 ***0.017721.53 ***0.0177
Notes: *** p < 0.01.
Table 8. PMG-ARDL results.
VariableCoef.z-Valuep-Value
Short-run estimation
LnRE0.26496981.610.108
LnNR−0.0254352−1.200.232
LnEA0.2137037 ***4.880.000
LnTI0.01288640.370.710
Cons.−0.1566996−1.170.242
ECT(-1)−0.4700233 ***−2.430.015
Long-run estimation
LnRE0.2180437 ***9.030.000
LnNR−0.0259223 **−2.090.037
LnEA0.2015597 ***4.020.000
LnTI−0.0913487 ***−10.820.000
Notes: *** p < 0.01, ** p < 0.05.
Disclaimer/Publisher’s Note: The statements, opinions and data contained in all publications are solely those of the individual author(s) and contributor(s) and not of MDPI and/or the editor(s). MDPI and/or the editor(s) disclaim responsibility for any injury to people or property resulting from any ideas, methods, instructions or products referred to in the content.

