1. Introduction
Recently, the application of Internet of Things (IoT) technology in agricultural practices has proved to have great potential in terms of developing dynamic pest management practices. One of the major effective applications is the utilization of IoT devices to classify and inspect pests in agricultural settings. With the help of a network of sensors that capture environmental images and data, farmers gain clearer insights into the existence of pests and their activities [
1]. Such sensors gather vital data, namely soil moisture, temperature, humidity, and the images of crops along with the surrounding vegetation. With real-time data analytics and processing techniques, the system rapidly identifies the pest outbreaks and immediately alerts the agricultural experts or farmers, thus allowing them to proceed with timely and targeted pest management measures [
2]. This combination of the IoT and pest classification techniques has the potential to revolutionize pest control in agriculture, causing more sustained practices, decreased pesticide use, and, ultimately, maximum crop yields.
Insect detection in IoT-based agricultural practice is vital to advancing sustainability by enabling accurate and targeted pest management practices. By leveraging the IoT technologies, farmers can observe the insect populations on a real-time basis, which in turn enables them to reduce the indiscriminate use of pesticides, optimize resources, and mitigate environmental impact. This type of data-driven approach not only preserves essential resources but also promotes various other features such as biodiversity preservation, crop health, and resilience in the face of climate change, aligning agricultural practices with the overarching goal of sustainable and environmentally responsible food production. Early identification of pest infestations enables timely intervention and also prevents massive crop damage. Further, this preemptive process helps in maintaining the crop yield and also minimizing the risks of crop failure, thus contributing to food security and sustainable agricultural production. Sustainable agriculture often involves conservation and improvement of biodiversity. IoT-based insect detection techniques help farmers to differentiate the harmful pests from beneficial insects, such as pollinators and natural predators. It is vital to protect these beneficial species in order to maintain a balanced ecosystem within agricultural environments, which in turn supports long-term sustainability.
Pest attack is one of the major problems encountered by the agricultural sector, and it degrades the quality of crops and accordingly the yield [
3]. Weeds, pests, and germs cause heavy losses to the crops and negatively impact the market for final goods. So, it is of immense importance to identify innovative ways to obtain even small growths in efficacy [
4]. Extra caution should be taken regarding pest attacks on crops that greatly affect the quality and yield of the crop. The high demand for cash crops mainly contributes to the large scale of production. The key reason behind the degradation of crop quality is insects, which also diminish the crop yield [
5]. On the other hand, it is essential to evaluate and monitor the losses incurred due to insects so as to overcome the safety and crop quality issues in agriculture. Manual identification and classification of insects necessitate professional knowledge of the field and are also time-consuming processes [
6]. Conventionally, expert entomologists classify insects through manual procedures. However, it is challenging for non-professionals to categorize insects without entomological knowledge. Thus, the study of automatic detection of insect types using image processing technology is extremely useful [
7].
Computer vision techniques have been successfully adopted for monitoring soil and crop environments, insect pest recognition, plant disease detection, and fruit grading. Various developments have been achieved recently in agriculture with the involvement of machine learning (ML) techniques to classify and detect insects in stored grain settings [
8]. Yet, the prevailing ML methods have some limitations if applied in the image detection process due to the compromised performance of the hand-engineered features that affect the whole results. Further, learning such features is a complicated and time-consuming task considering that the system has to be changed when the dataset changes or new problems arise. Hence, these features demand expensive efforts that hinge on professionals and are ineffective [
9]. Many researchers have established that deep learning (DL) techniques possess substantial benefits in terms of feature extraction from the images [
10].
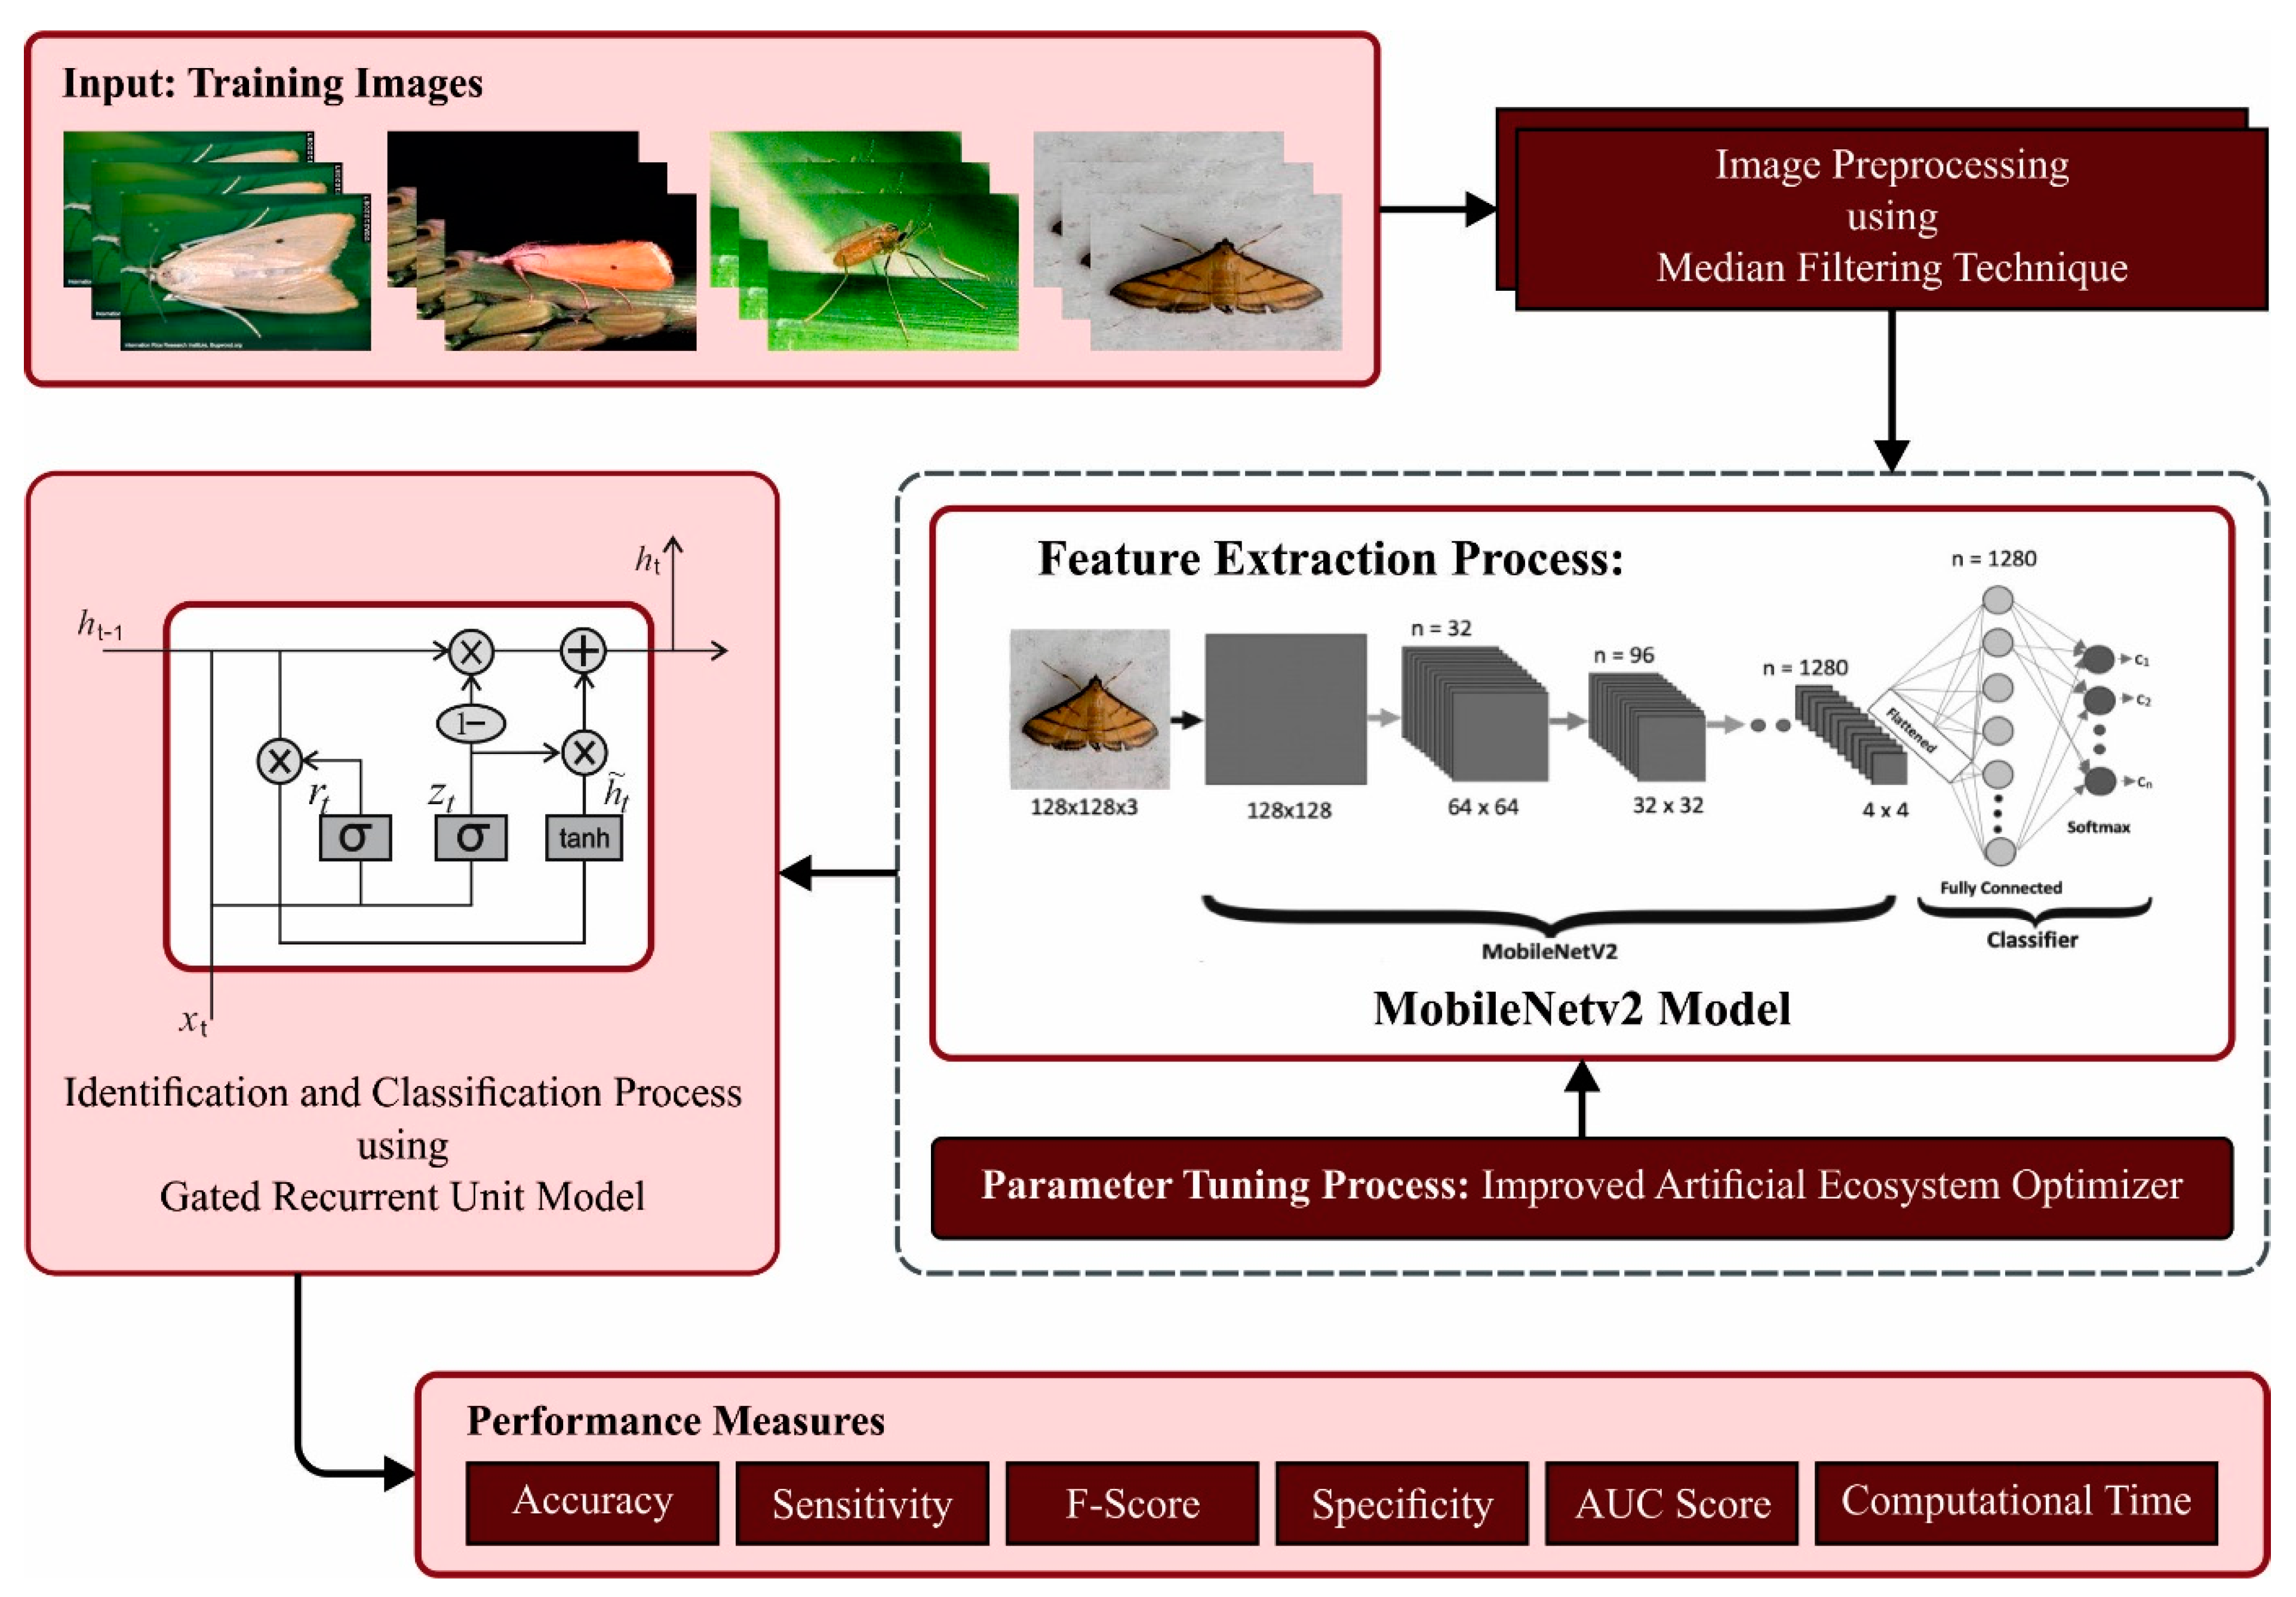
In this context, the current research article concentrates on the design of an improved artificial-ecosystem-based optimizer with deep-learning-based insect detection and classification (IAEODL-IDC) approach in the IoT-based agricultural sector. The IoT sensors are primarily used for data collection purposes. The presented IAEODL-IDC technique uses the median filtering (MF)-based noise removal process. In addition, the IAEODL-IDC method makes use of the MobileNetv2 system for feature vector generation. Meanwhile, the IAEO methodology is also exploited for optimal hyperparameter tuning of the MobileNetv2 system. Lastly, the gated recurrent unit (GRU) methodology is exploited for an effective recognition and classification of insects. An extensive range of simulations were conducted to exhibit the superior performance of the IAEODL-IDC algorithm. The key contributions of the current study are summarized as follows:
Development of the automated IAEODL-IDC technique comprising MF-based preprocessing, a MobileNetv2 feature extractor, IAEO-based parameter tuning, and GRU-based classification for insect detection in the IoT-based agricultural sector. To the best of the authors’ knowledge, there are no existing reports on the IAEODL-IDC technique in the literature.
Design of a new IAEO technique by integrating the lens imaging dynamic learning approach and the AEO algorithm to overcome the local optima problem.
Hyperparameter optimization of the GRU model using the IAEO algorithm with cross-validation, which helps in boosting the predictive outcome of the IAEODL-IDC model for unseen data.
2. Related Works
Kundu et al. [
11] developed a process named the ‘Automated and Intelligent Data Collector and Classifier’ structure by incorporating the IoT and DL techniques. This ‘Custom-Net’ technique was utilized on the cloud server. The Grad-CAM was also applied for visualizing the attributes derived by ‘Custom-Net’. Additionally, the effect of the TL on Inception ResNetV2, ‘Custom-Net’, InceptionV3, VGG19, VGG16, and ResNet50 is shown in this study. Kusrini et al. [
12] presented an advanced ML approach to detect the onset of biological threats with the help of CV and DL technologies and examine large-scale mango fields. The ML method extended the pre-trained VGG16 DL approach in order to supplement the final layer with FC network training. In Reference [
13], a pest detection technique was modeled using the improved YOLOv5-based method with high precision. Firstly, the Transformer (C3TR) and SWin Transformer (SWinTR) systems were incorporated into the YOLOv5 network in such a way that a larger number of global features are captured, which can increase the receptive sector.
In a previous study [
14], an insect pest detection technique was presented with contour detection and foreground extraction in order to identify insects. To enhance the outcome of the classification method, a 9-fold cross-validation method was implemented. The highest classifier rates of 90% and 91.5% were attained for 9 and 24 class insects through the convolutional neural network (CNN) method. Li and Chao [
15] devised an artificial neural network (ANN)-based continual classification technique through retrieval and memory storage with two advantages, namely high flexibility and few data. The presented ANN-based method integrated both a CNN and a generative adversarial network (GAN). Islam et al. [
16] examined the performances of several ML approaches such as the random forest (RF), K-nearest neighbor (KNN), and a support vector machine (SVM) to detect weeds through UAV images captured in chili crop fields. Rong et al. [
17] presented an object detection technique based on the enhanced Mask RsCNN method that is targeted at enhancing the efficiency and accuracy in the pest detection process. In Reference [
18], the authors presented non-destructive approaches to find the syndromes that affect tomato crops such as the target spot (TS), bacterial spot (BS) and tomato yellow leaf curl (TYLC) for two tomato types utilizing hyperspectral sensing under two conditions: (a) in the field using a drone-based application and (b) in the lab (benchtop scanning).
3. The Proposed Model
In the current study, an automated insect recognition technique, i.e., the IAEODL-IDC technique, has been developed to properly classify various types of insects. The presented IAEODL-IDC technique comprises MF-based noise removal, MobileNetv2 feature extraction, IAEO-based hyperparameter optimization, and GRU-based classification.
Figure 1 exhibits the workflow of the IAEODL-IDC approach.
3.1. Image Pre-processing
Initially, the MF system is employed to eradicate the noise present in the images. The MF system is a digital signal processing method that is used for the removal of noise from signals or images [
19]. This system works by replacing all the pixels in an image with the median values of the nearby pixel in a predetermined neighborhood. MF is a non-linear filter, i.e., the output of the filter relies on the order of input.
3.2. Feature Extraction
In order to develop the feature vectors, the MobileNetv2 model is utilized in this study. A CNN is an NN with more than one layer, and it involves multiple convolutional pooling layer pairs along with full-connection output layers [
20]. The aim of a typical CNN is to recognize that an image’s shape remains partially invariant to the position of the shape. In the convolution layer, the input image is convolved with the help of the 2D filter. For instance, when a 2D image I is fed as an input and a 2D convolutional kernel
is applied, then
Next, the feature map following the convolution filter is downsized to small instances from the pooling layer. Both the network filters (kernel) and the weights in the convolution layer are learnt via the backpropagation model in order to mitigate the classification error. The network is exploited to train
filters in total, sized at
. The input image is convolved by the kernel that is to be trained, and later it is passed over the
output function to generate the output map in the convolutional layer. The map of the
-th feature is attained using the following equation:
In Equation (2),
signifies the weight matrix for the
th filter, and
characterizes the bias values; for
and
signify the input image. In this work, the
filter has
dimensions,
and
. The
output function is designated as ReLu.
The result of the convolution layer is an
vector sized at
. The
-pooling layer is a full-connection layer with two outcomes that characterize the MI of L.H.S and R.H.S [
21]. Here, the BP model is utilized for learning the CNN parameters. Using the presented method, the network is provided with the labeled trained set, and the error
is calculated by assuming that the selected output is dissimilar to the actual output. Then, the gradient descent model is exploited to minimize the error
that takes place with changes in the mode parameter and is represented as follows.
where
signifies the weight matrix for kernel
,
refers to the learning rate, and
characterizes the bias value. Eventually, the trained network is used to categorize the new sample in the testing set.
3.3. Hyperparameter Tuning
The IAEO algorithm is exploited for the optimal hyperparameter tuning process. AEO is a metaheuristic optimization technique that is modeled on the flow of energy in the Earth’s ecosystem [
22], such as production, consumption, and the decomposition processes. In such a system, food offers energy together with sunlight, CO
2, nutrients, and water generated by decomposers. The generation operator supports the AEO in arbitrarily replacing the preceding one
with a novel individual
. The production behavior is determined as given below.
Here, denotes the size of the population, implies the maximal iteration count of this technique, and and denote the upper and lower boundaries of the searching space, respectively.
During the AEO, random walking, at a point dependent upon Levy flight (LF), is termed as the consumption feature and is calculated as follows.
Herbivore: The consumption design of the herbivore is as follows
Carnivore: The consumption design of the carnivore is expressed using Equation (12):
Omnivore: When a consumer assumes another consumer, it could either eat the consumer, which has high energy, or the producer. This performance is determined as follows:
implies the random number from the interval. During the decomposition procedure, the decomposer decomposes the situation, when the individual dies. The decomposition procedures are determined as follows.
The lens imaging dynamic learning system can be assumed to prevent the AEO technique from becoming trapped in the local optima. Hence, on the L.H.S of the -axis, the person is noticeable with , whereas its estimate on the -axis is exposed with , and distance in the -axis is noticeable with . If accepted by a convex lens, the proceeds with an inverse where the image on the -axis is referred to as , and its distance in the -axis is determined as . The person and the opposite person are chosen.
is attained as follows.
The scaling, dependent upon non-linear dynamic reduction
, is determined as follows.
where
and
signify the upper and lower scaling features (
and
), respectively. Equation (18) is determined for
-dimensional space as given below.
Here, and denote the and X mechanisms in the dimension , and and signify the upper and lower limits of the dimension , respectively.
The IAEO technique not only develops a fitness function (FF) from attaining a supreme classifier solution, but it also expresses a positive integer to exemplify the high efficacy of candidate performances. A reduced classifier rate of errors is regarded as an FF and is expressed as follows.
3.4. Image Classification
Lastly, the GRU technique subjects the image to class labeling. The GRU is composed of several GRU cells, and the number of hidden states is fixed at 2 [
23]. Here, the update gate is used for controlling the extent to which the data of the preceding moment are taken into the existing state. The reset gate is the same gate as the forget gate in LSTM, which controls the number of data that are neglected from the preceding moment.
In each GRU cell, the forward propagation formula is given as follows:
In Equation (22), refer to the active layers of the present hidden node outcome, the update gate, reset gate, and candidate layer of the existing hidden node at time , respectively; denotes the input vector to all the GRU cells; denotes the component-wise multiplication; and imply the weight matrices learned during model training; denotes the sigmoid activation function; shows the bias vector; and indicates the hyperbolic tangent function.
4. Results and Discussion
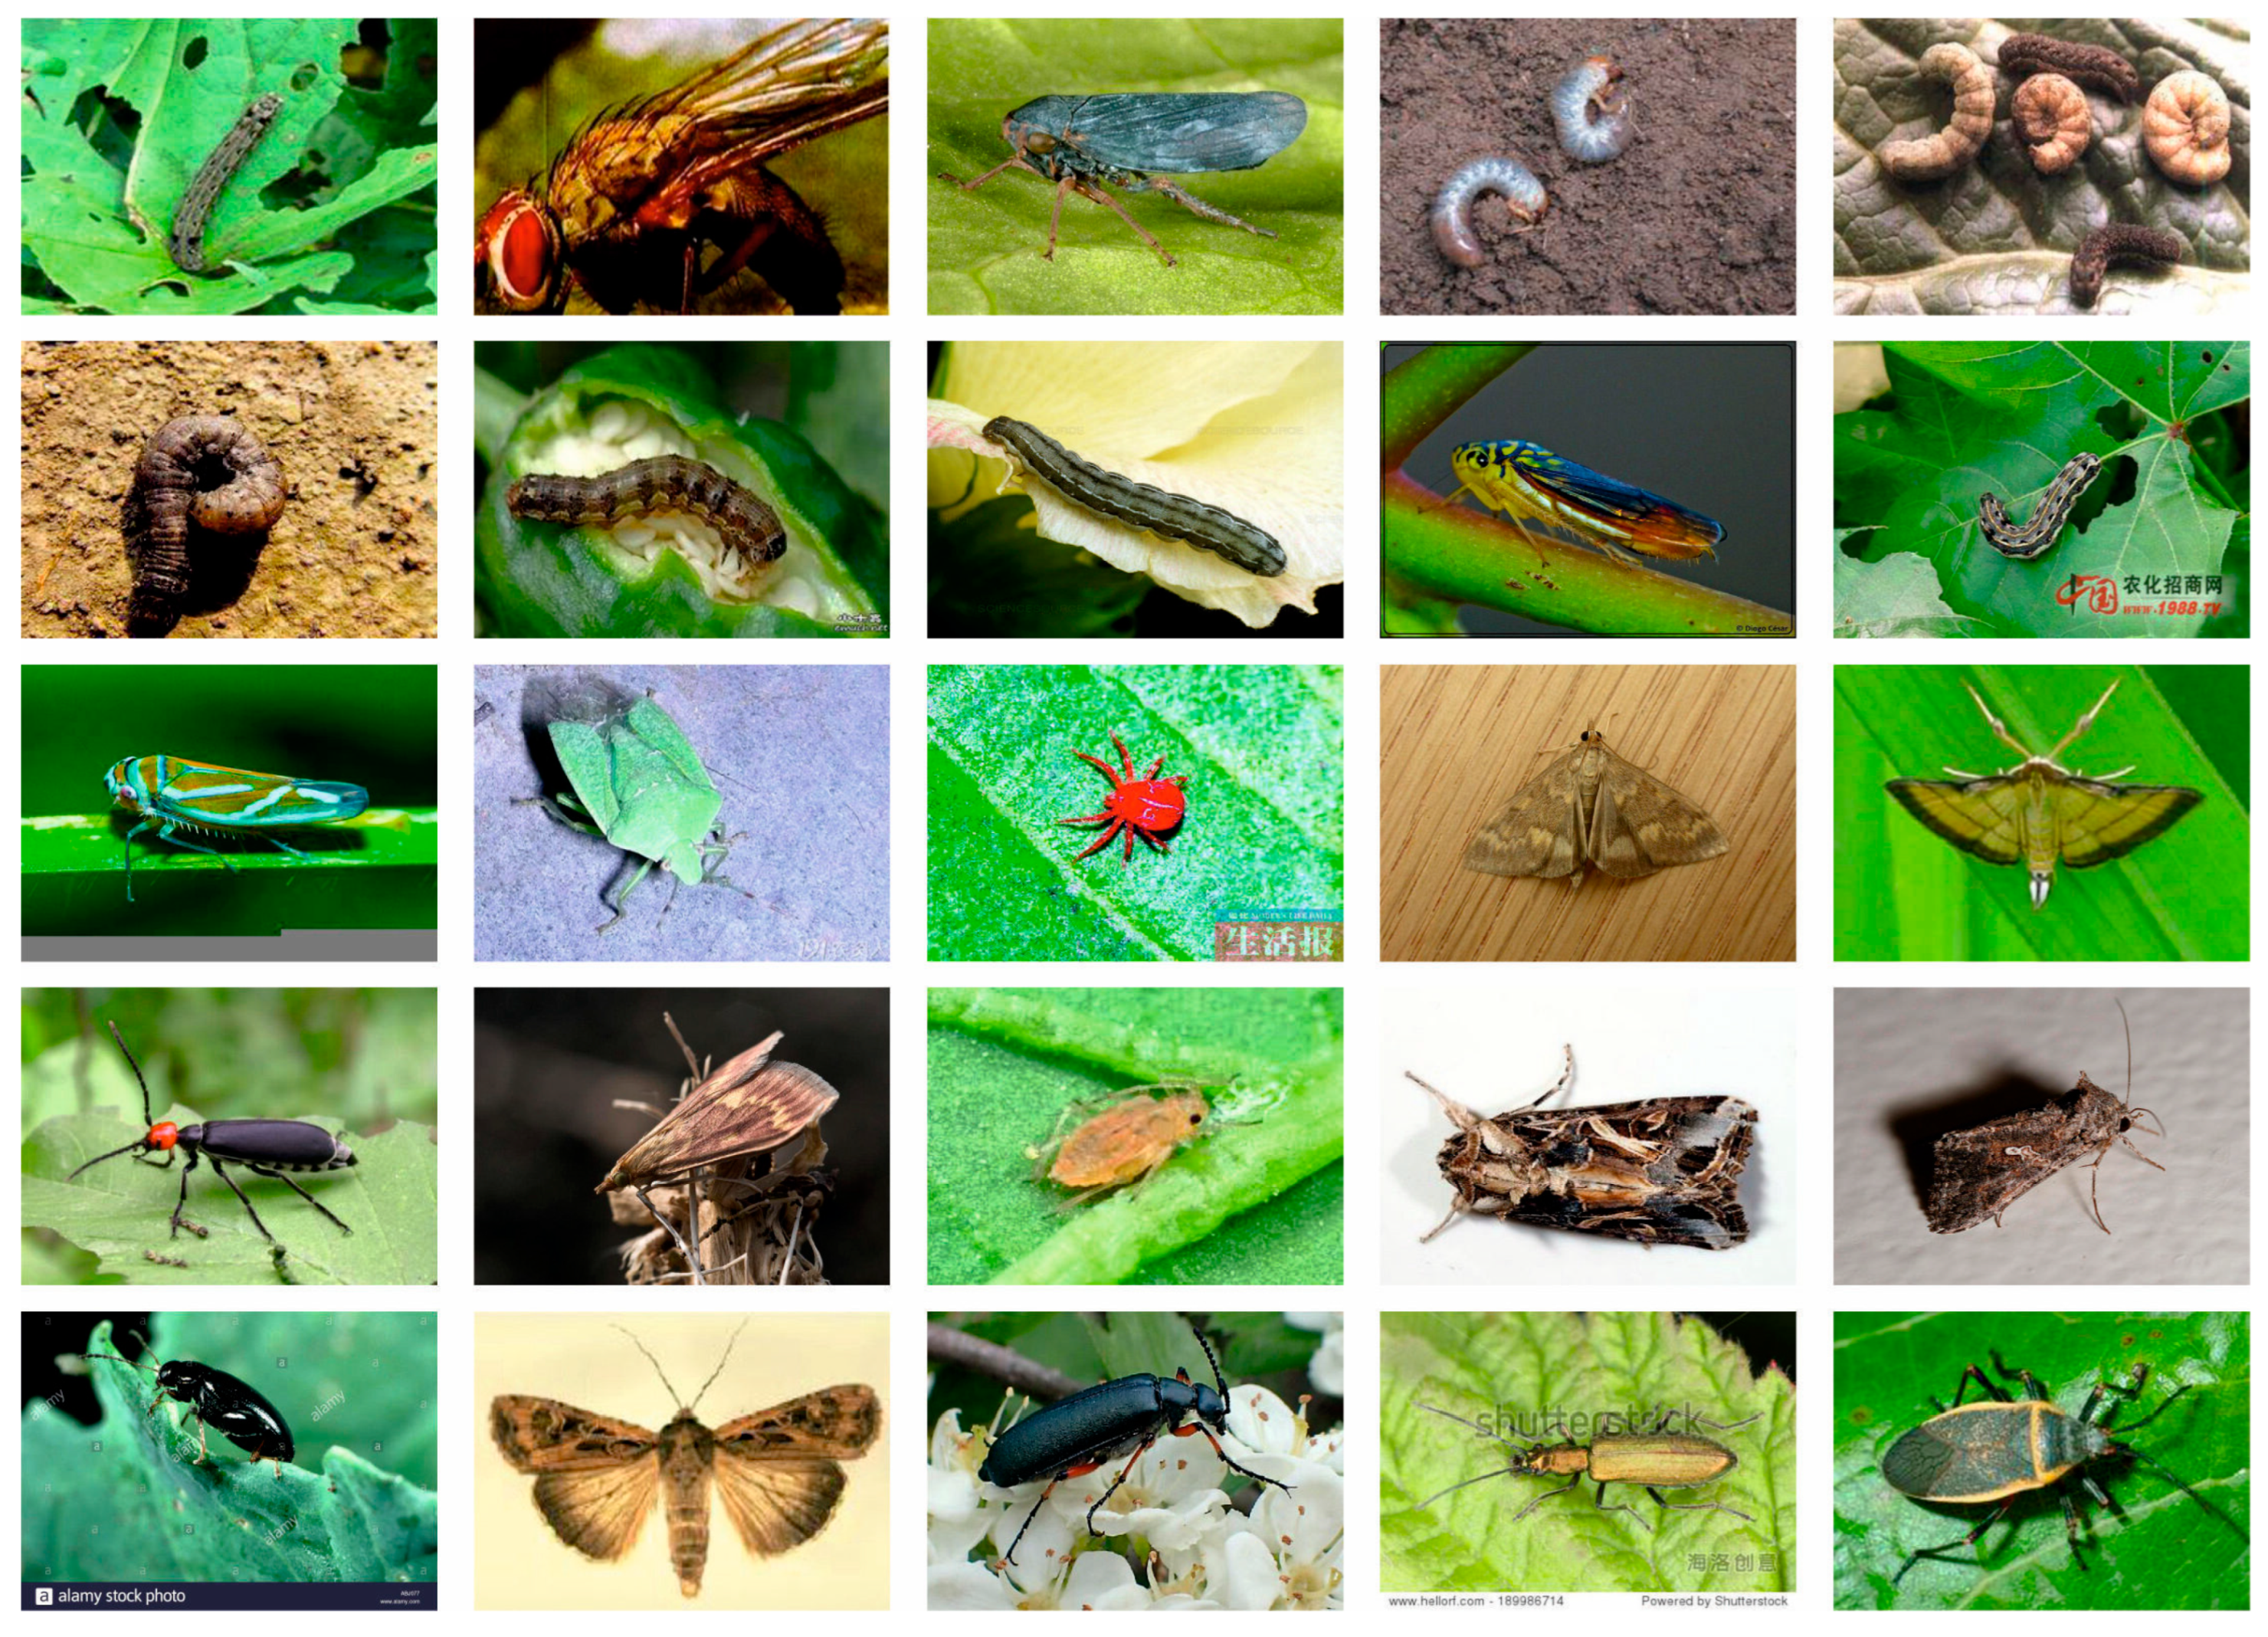
The proposed model was simulated using Python 3.6.5 on a PC configured with an i5-8600k CPU, a GeForce 1050Ti 4 GB GPU, 16 GB RAM, a 250 GB SSD, and a 1 TB HDD. The insect classification performance of the IAEODL-IDC algorithm was validated using the IP102 database [
24], containing 300 instances for six classes, as represented in
Table 1. The IP102 database has a hierarchical taxonomy, and the insect pests that mainly affect one specific agricultural product are grouped in the same upper-level category.
Figure 2 shows some of the sample images.
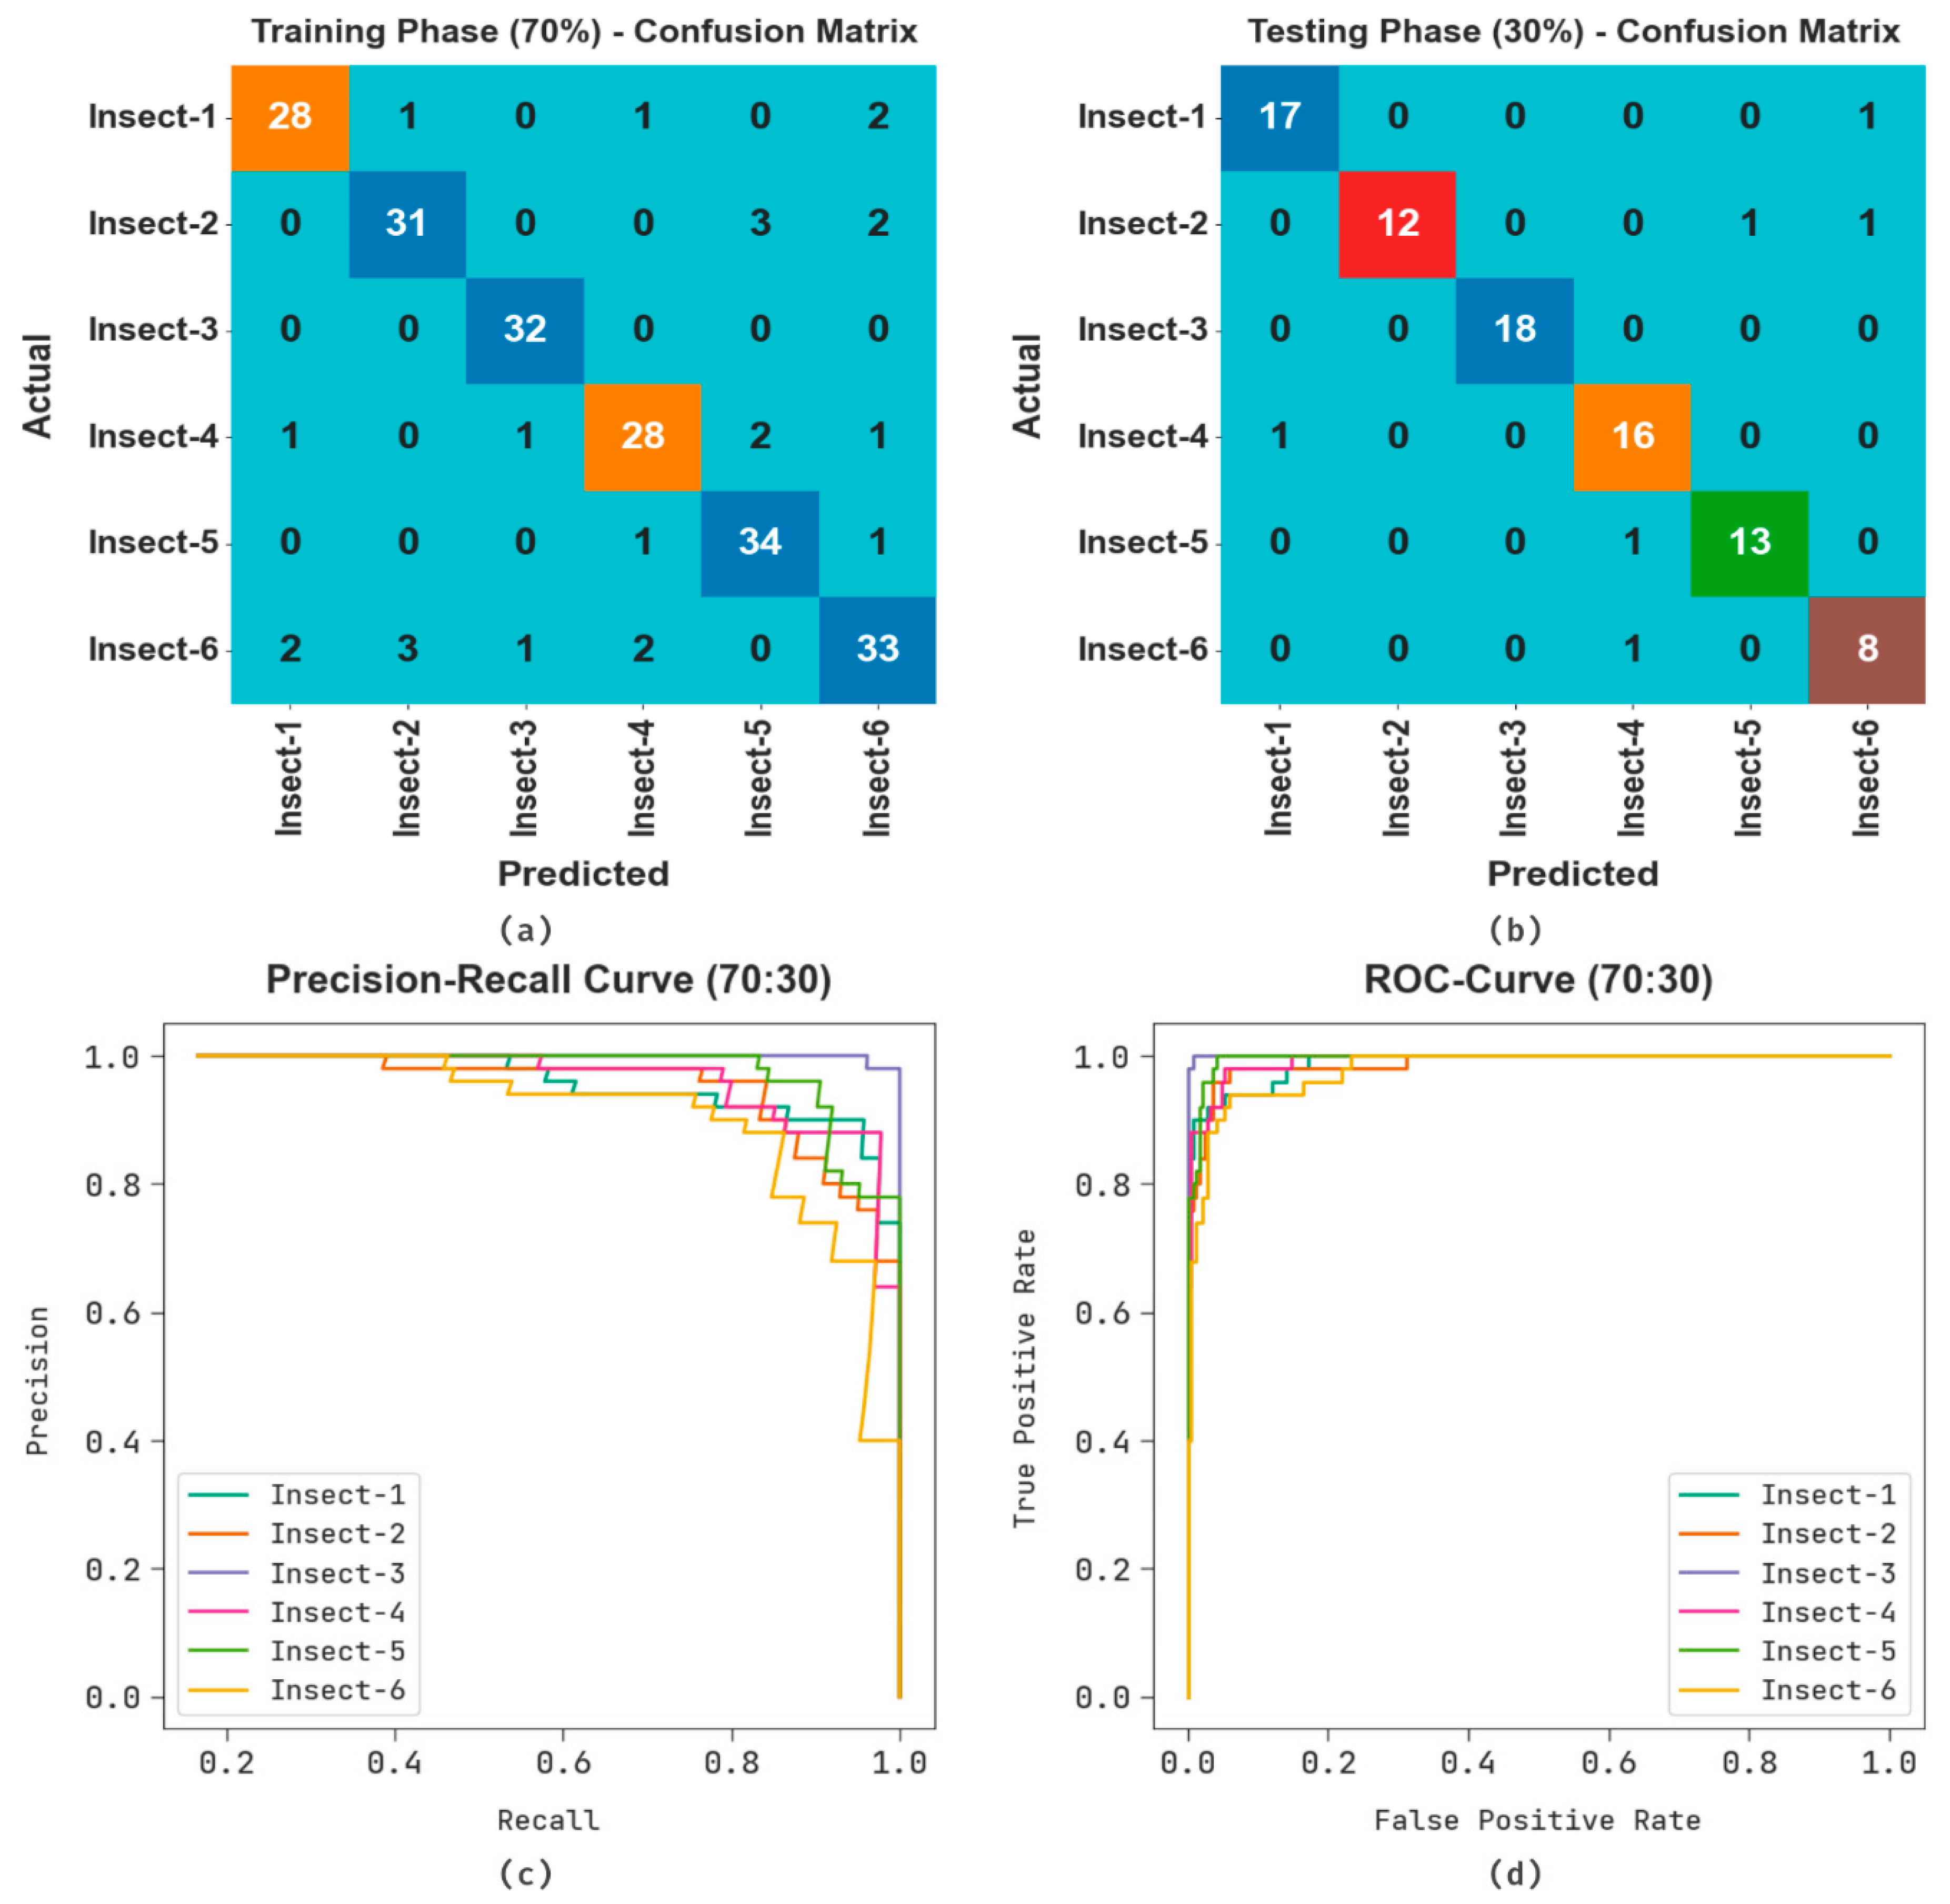
Figure 3 exhibits the classification results achieved by the IAEODL-IDC approach with the 70:30 TR/TS sets.
Figure 3a,b show the confusion matrices generated by the ACC-CBOEFF algorithm with the 70:30 TR/TS sets. The outcomes denote that the ACC-CBOEFF method identified and classified all six class labels accurately. Also,
Figure 3c demonstrates the PR investigation outcomes of the IAEODL-IDC algorithm with the 70:30 TR/TS sets. The outcome signifies that the IAEODL-IDC algorithm attained enhanced PR solutions in all the classes. On the other hand,
Figure 3d exhibits the ROC investigation results achieved by the IAEODL-IDC model with the 70:30 TR/TS sets. The outcomes demonstrate that the IAEODL-IDC system achieved excellent results with maximal ROC values for all six class labels.
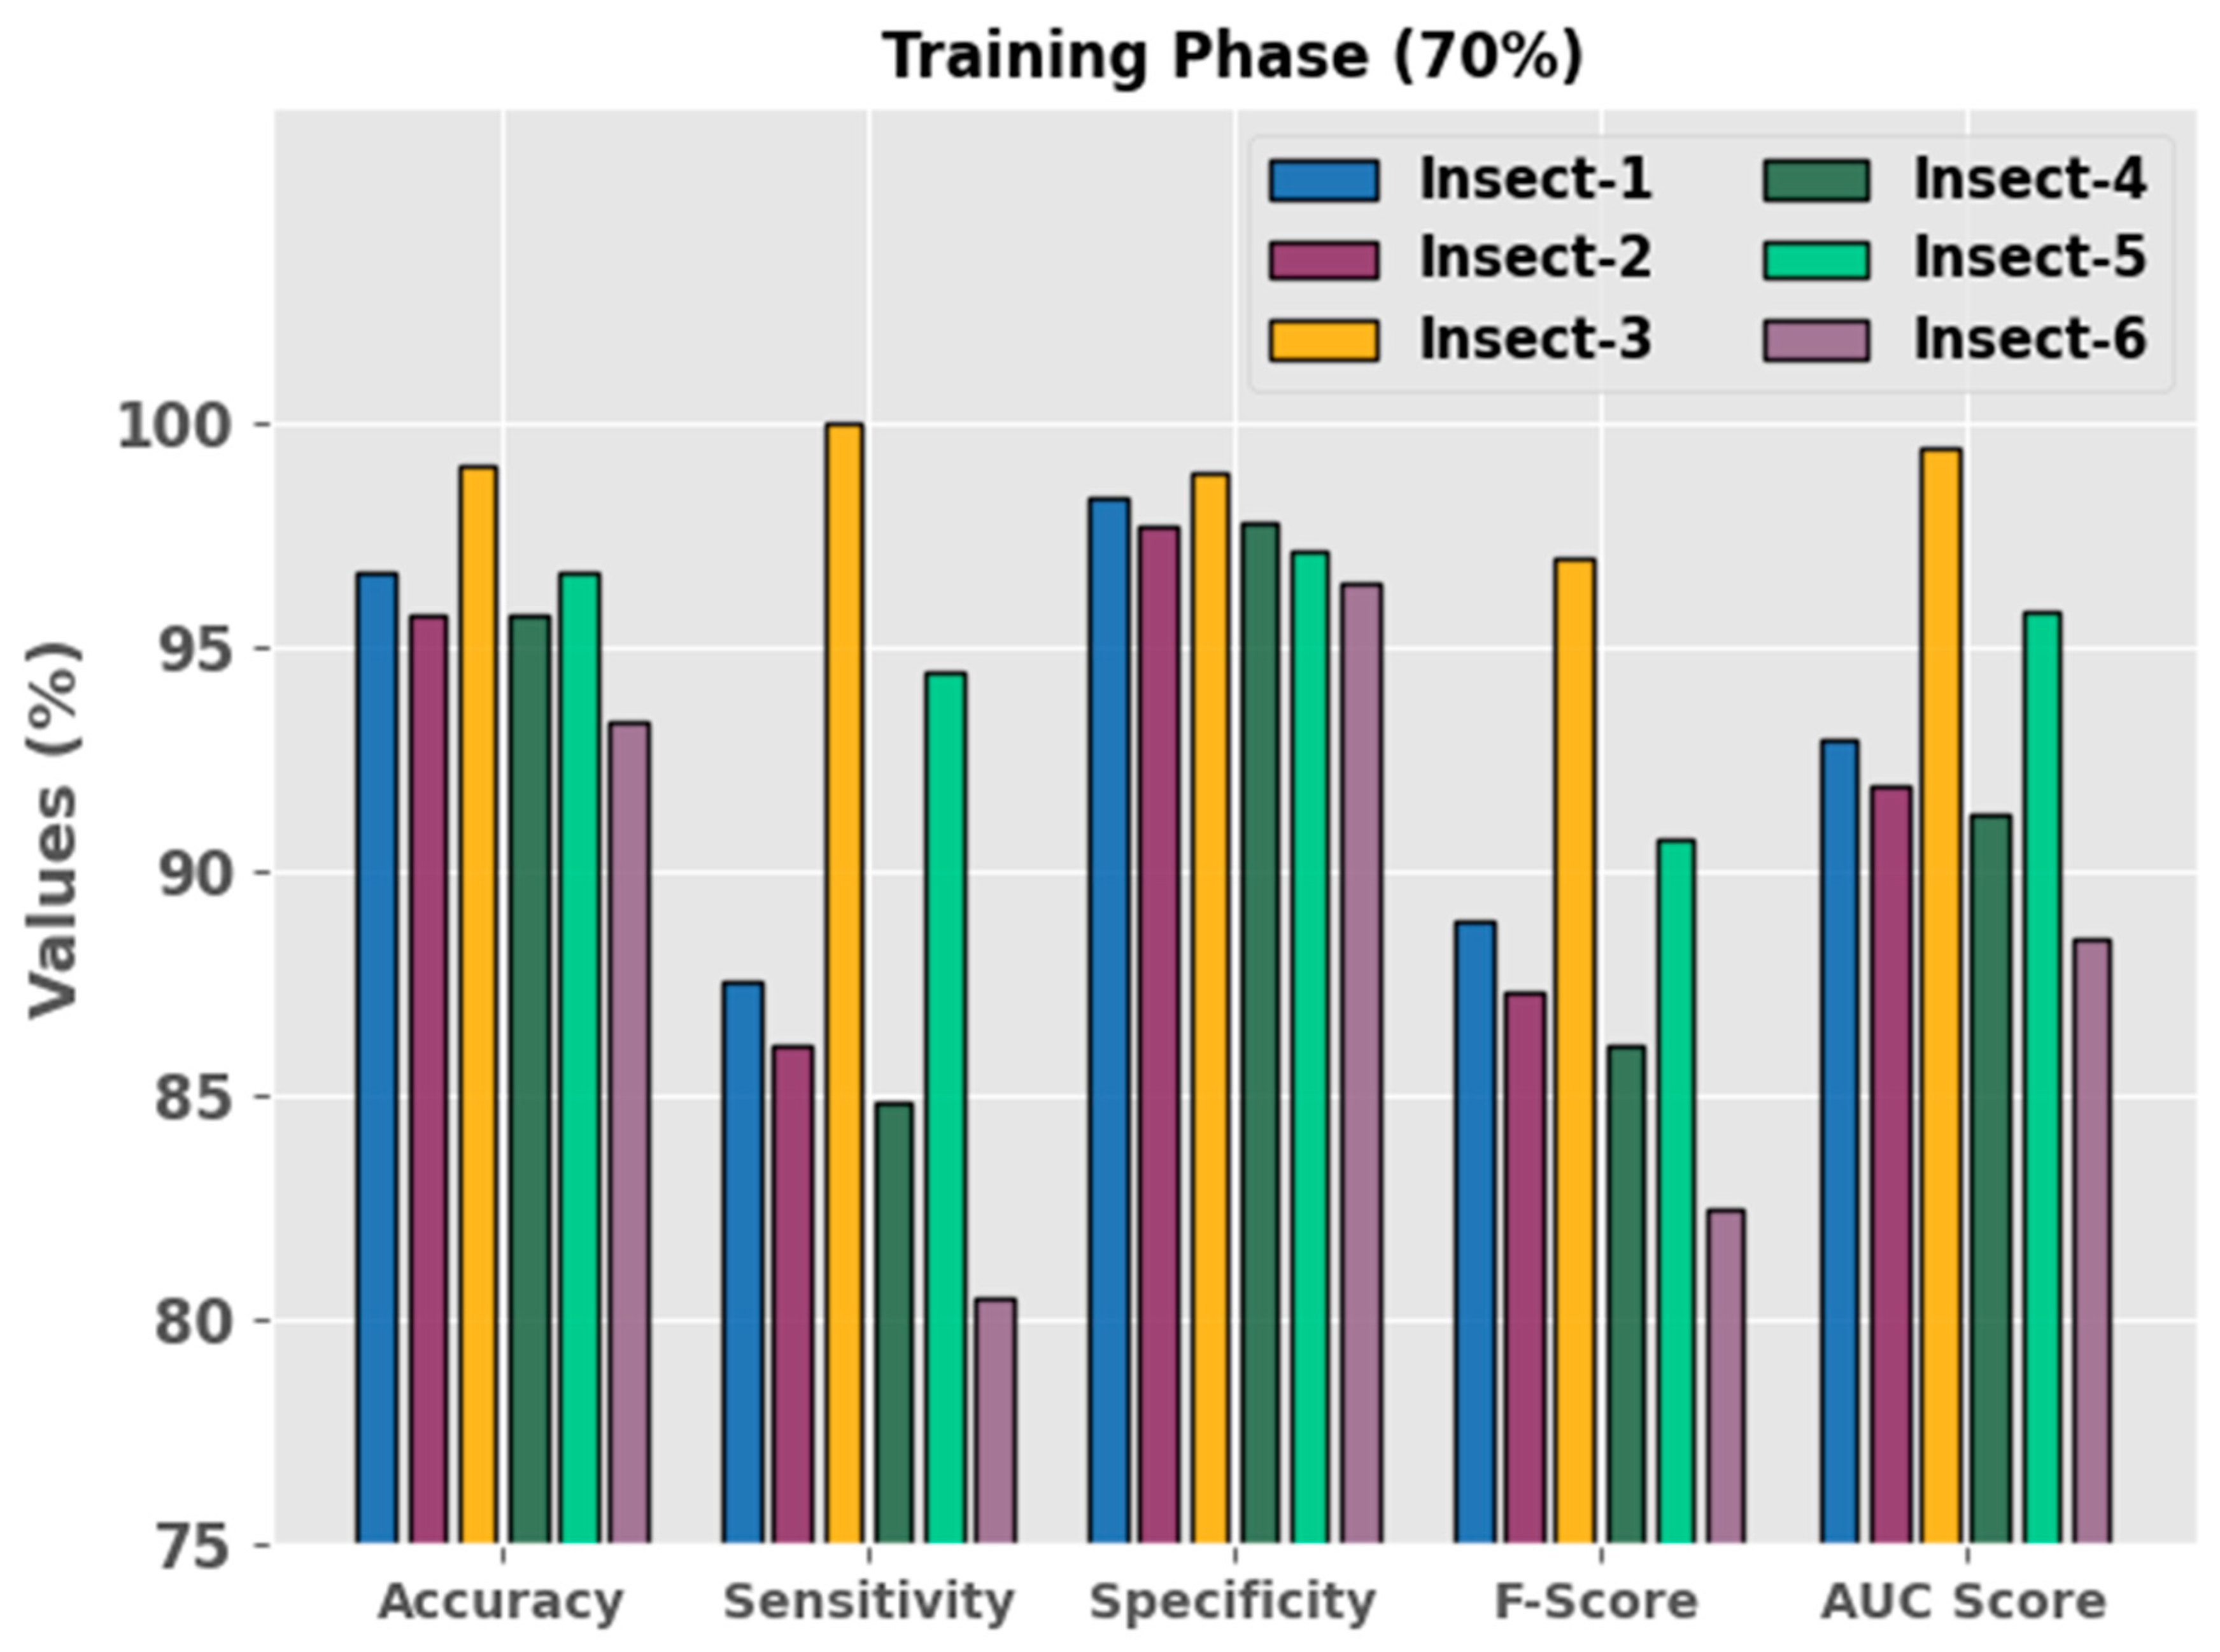
Figure 4 exhibits the classification performance of the IAEODL-IDC system for the 70% TR set. The results show that the IAEODL-IDC technique determined all six types of insects. For the insect-1 class, the IAEODL-IDC technique obtained an
of 96.67%,
of 87.50%,
of 98.31%,
of 88.89%, and an
of 92.91%. Meanwhile, for the insect-3 class, the IAEODL-IDC system achieved an
of 99.05%,
of 100%,
of 98.88%,
of 96.97%, and an
of 99.44%. Furthermore, for the insect-6 class, the IAEODL-IDC technique reached an
of 93.33%,
of 80.49%,
of 96.45%,
of 82.50%, and an
of 88.47%.
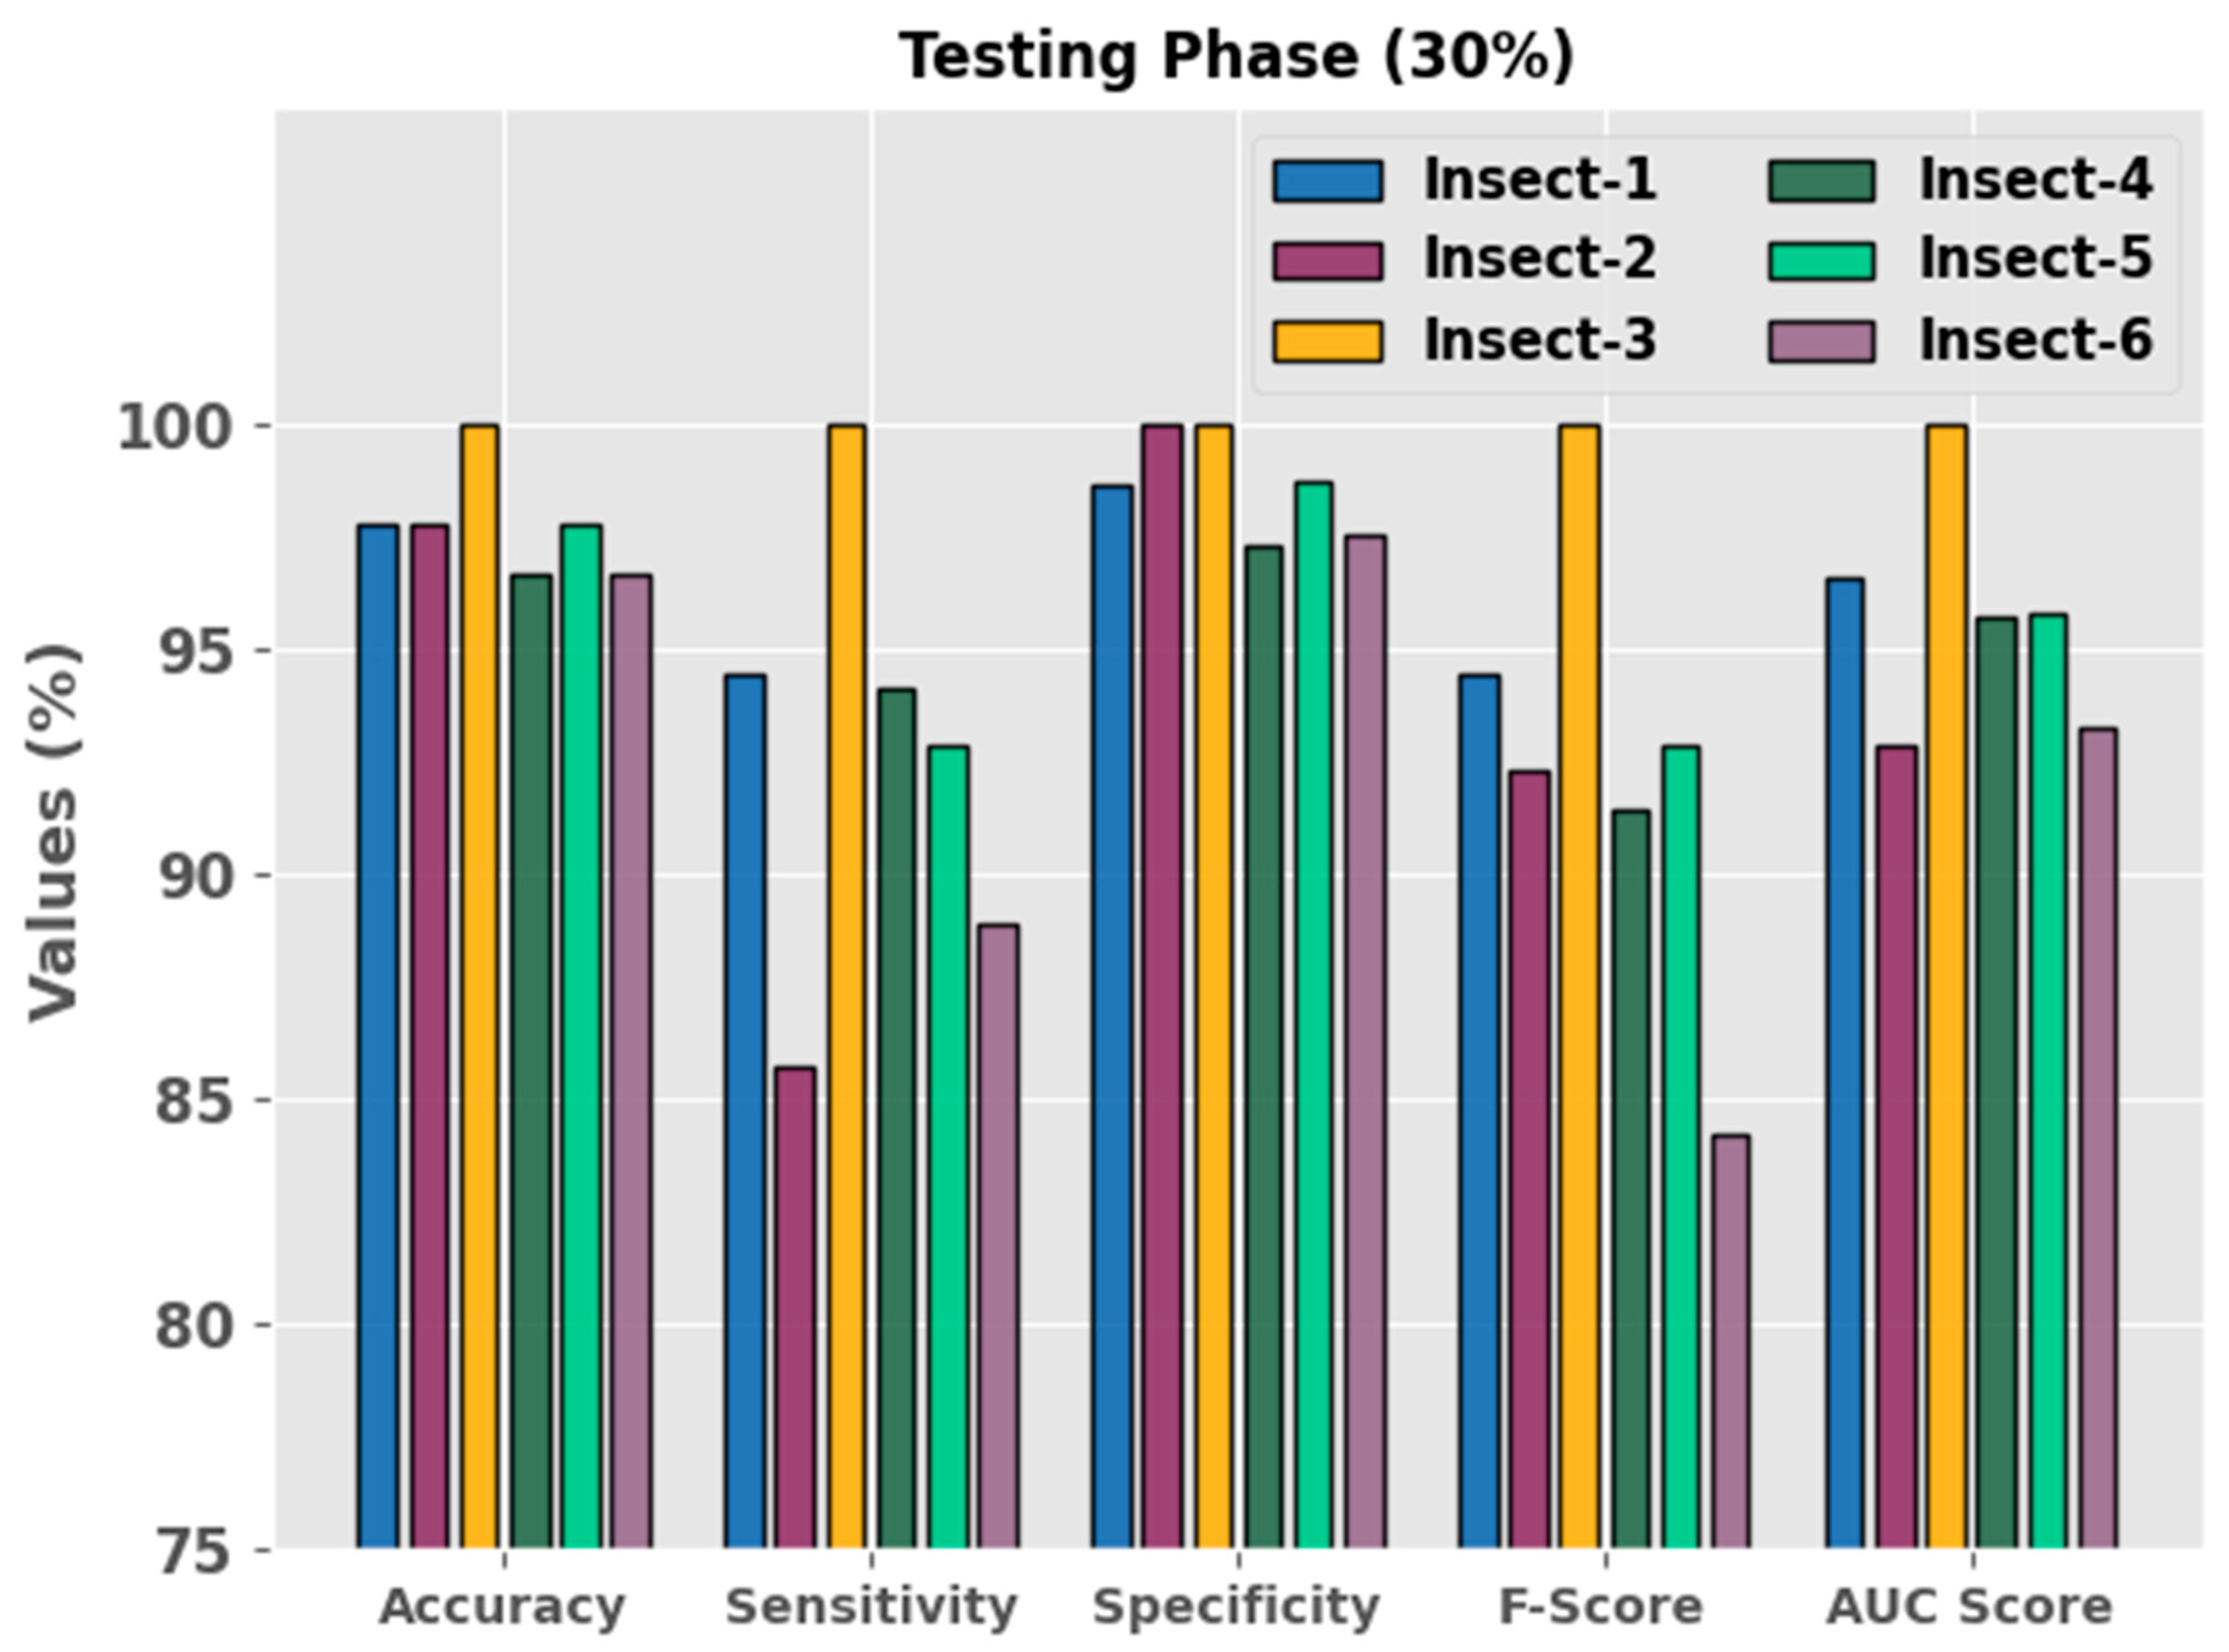
Figure 5 exhibits the classification outcomes of the IAEODL-IDC approach for the 30% TS set. The outcome depicts that the IAEODL-IDC system determined all six types of insects. For the insect-1 class, the IAEODL-IDC technique obtained an
of 97.78%,
of 94.44%,
of 98.61%,
of 94.44%, and an
of 96.53%. Meanwhile, for the insect-4 class, the IAEODL-IDC system achieved an
of 96.67%,
of 94.12%,
of 97.26%,
of 91.43%, and an
of 95.69%. Additionally, in the insect-6 class, the IAEODL-IDC algorithm achieved an
of 96.67%,
of 88.89%,
of 97.53%,
of 84.21%, and an
of 93.21%.
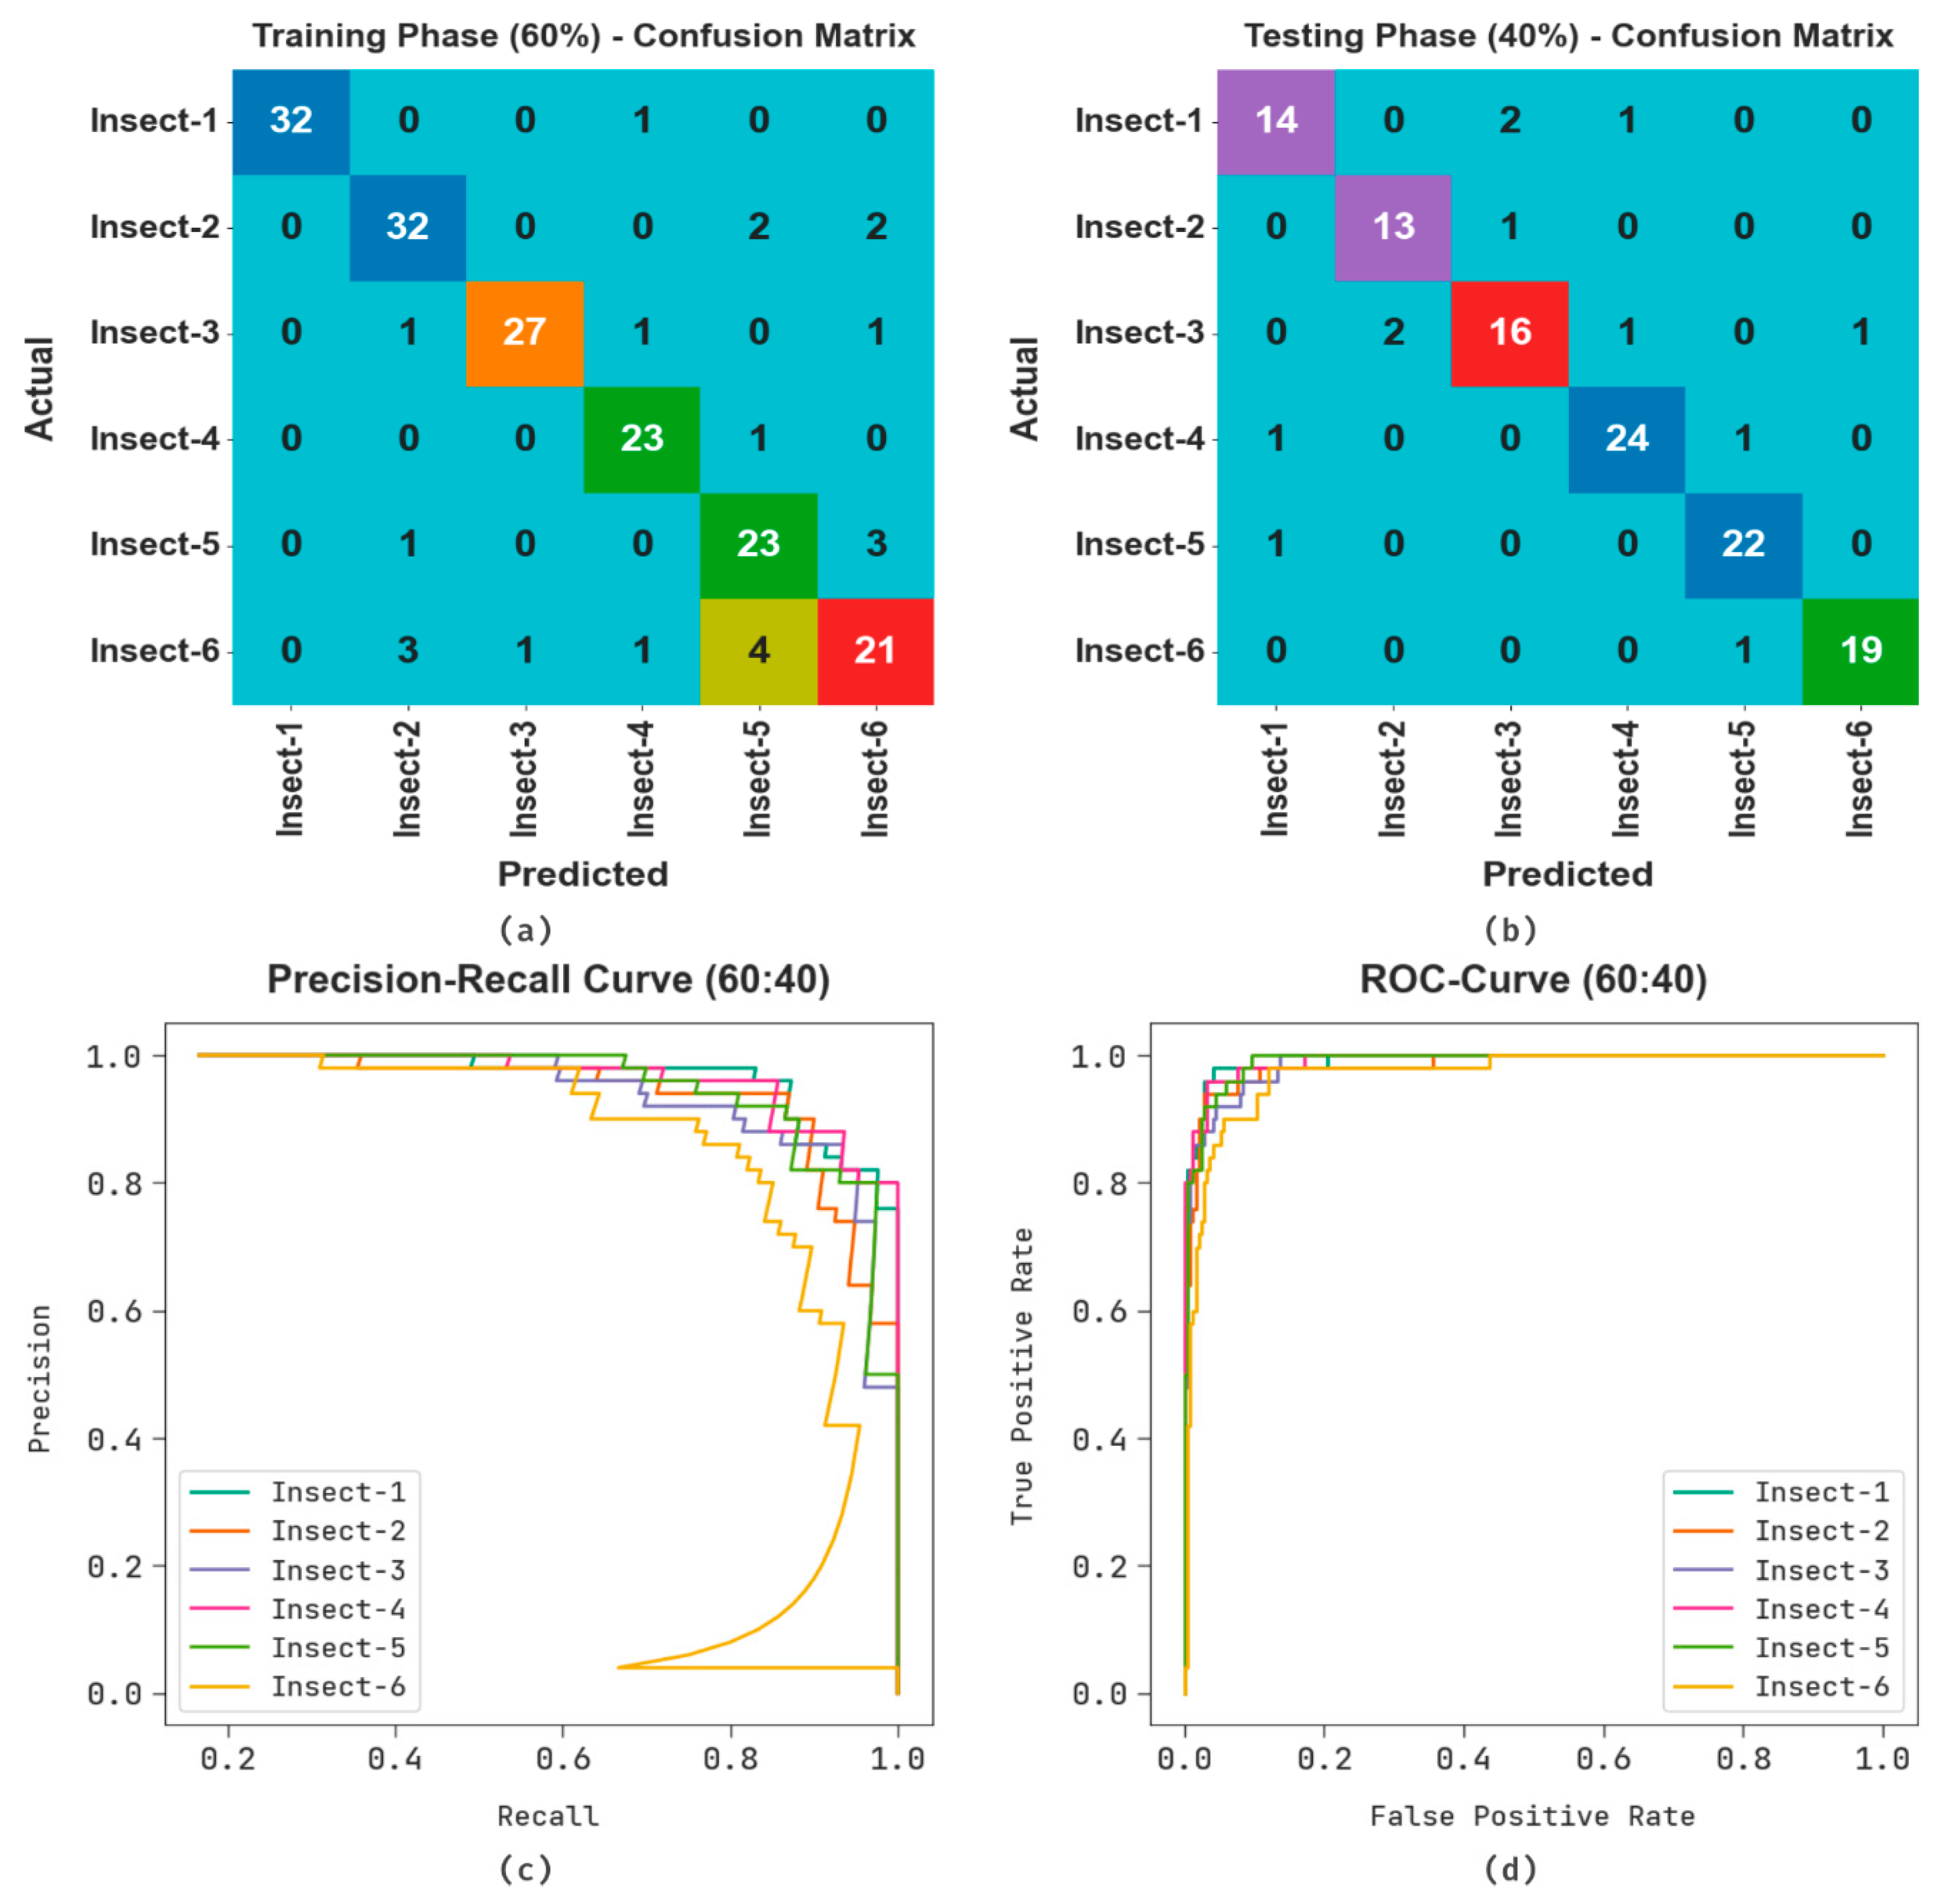
Figure 6 demonstrates the classification outcomes of the IAEODL-IDC methodology for the 60:40 TR/TS sets.
Figure 6a,b depict the confusion matrices generated by the ACC-CBOEFF algorithm for the 60:40 TR/TS sets. The outcomes show that the ACC-CBOEFF method recognized and classified all six class labels accurately. Next,
Figure 6c displays the PR curve of the IAEODL-IDC method for the 60:40 TR/TS sets. The results state that the IAEODL-IDC method obtained the highest PR curve in all six classes. Lastly,
Figure 6d shows the ROC investigation outcomes of the IAEODL-IDC system for the 60:40 TR/TS sets. The figure exhibits that the IAEODL-IDC method achieved excellent outcomes with the highest ROC values for dissimilar class labels.
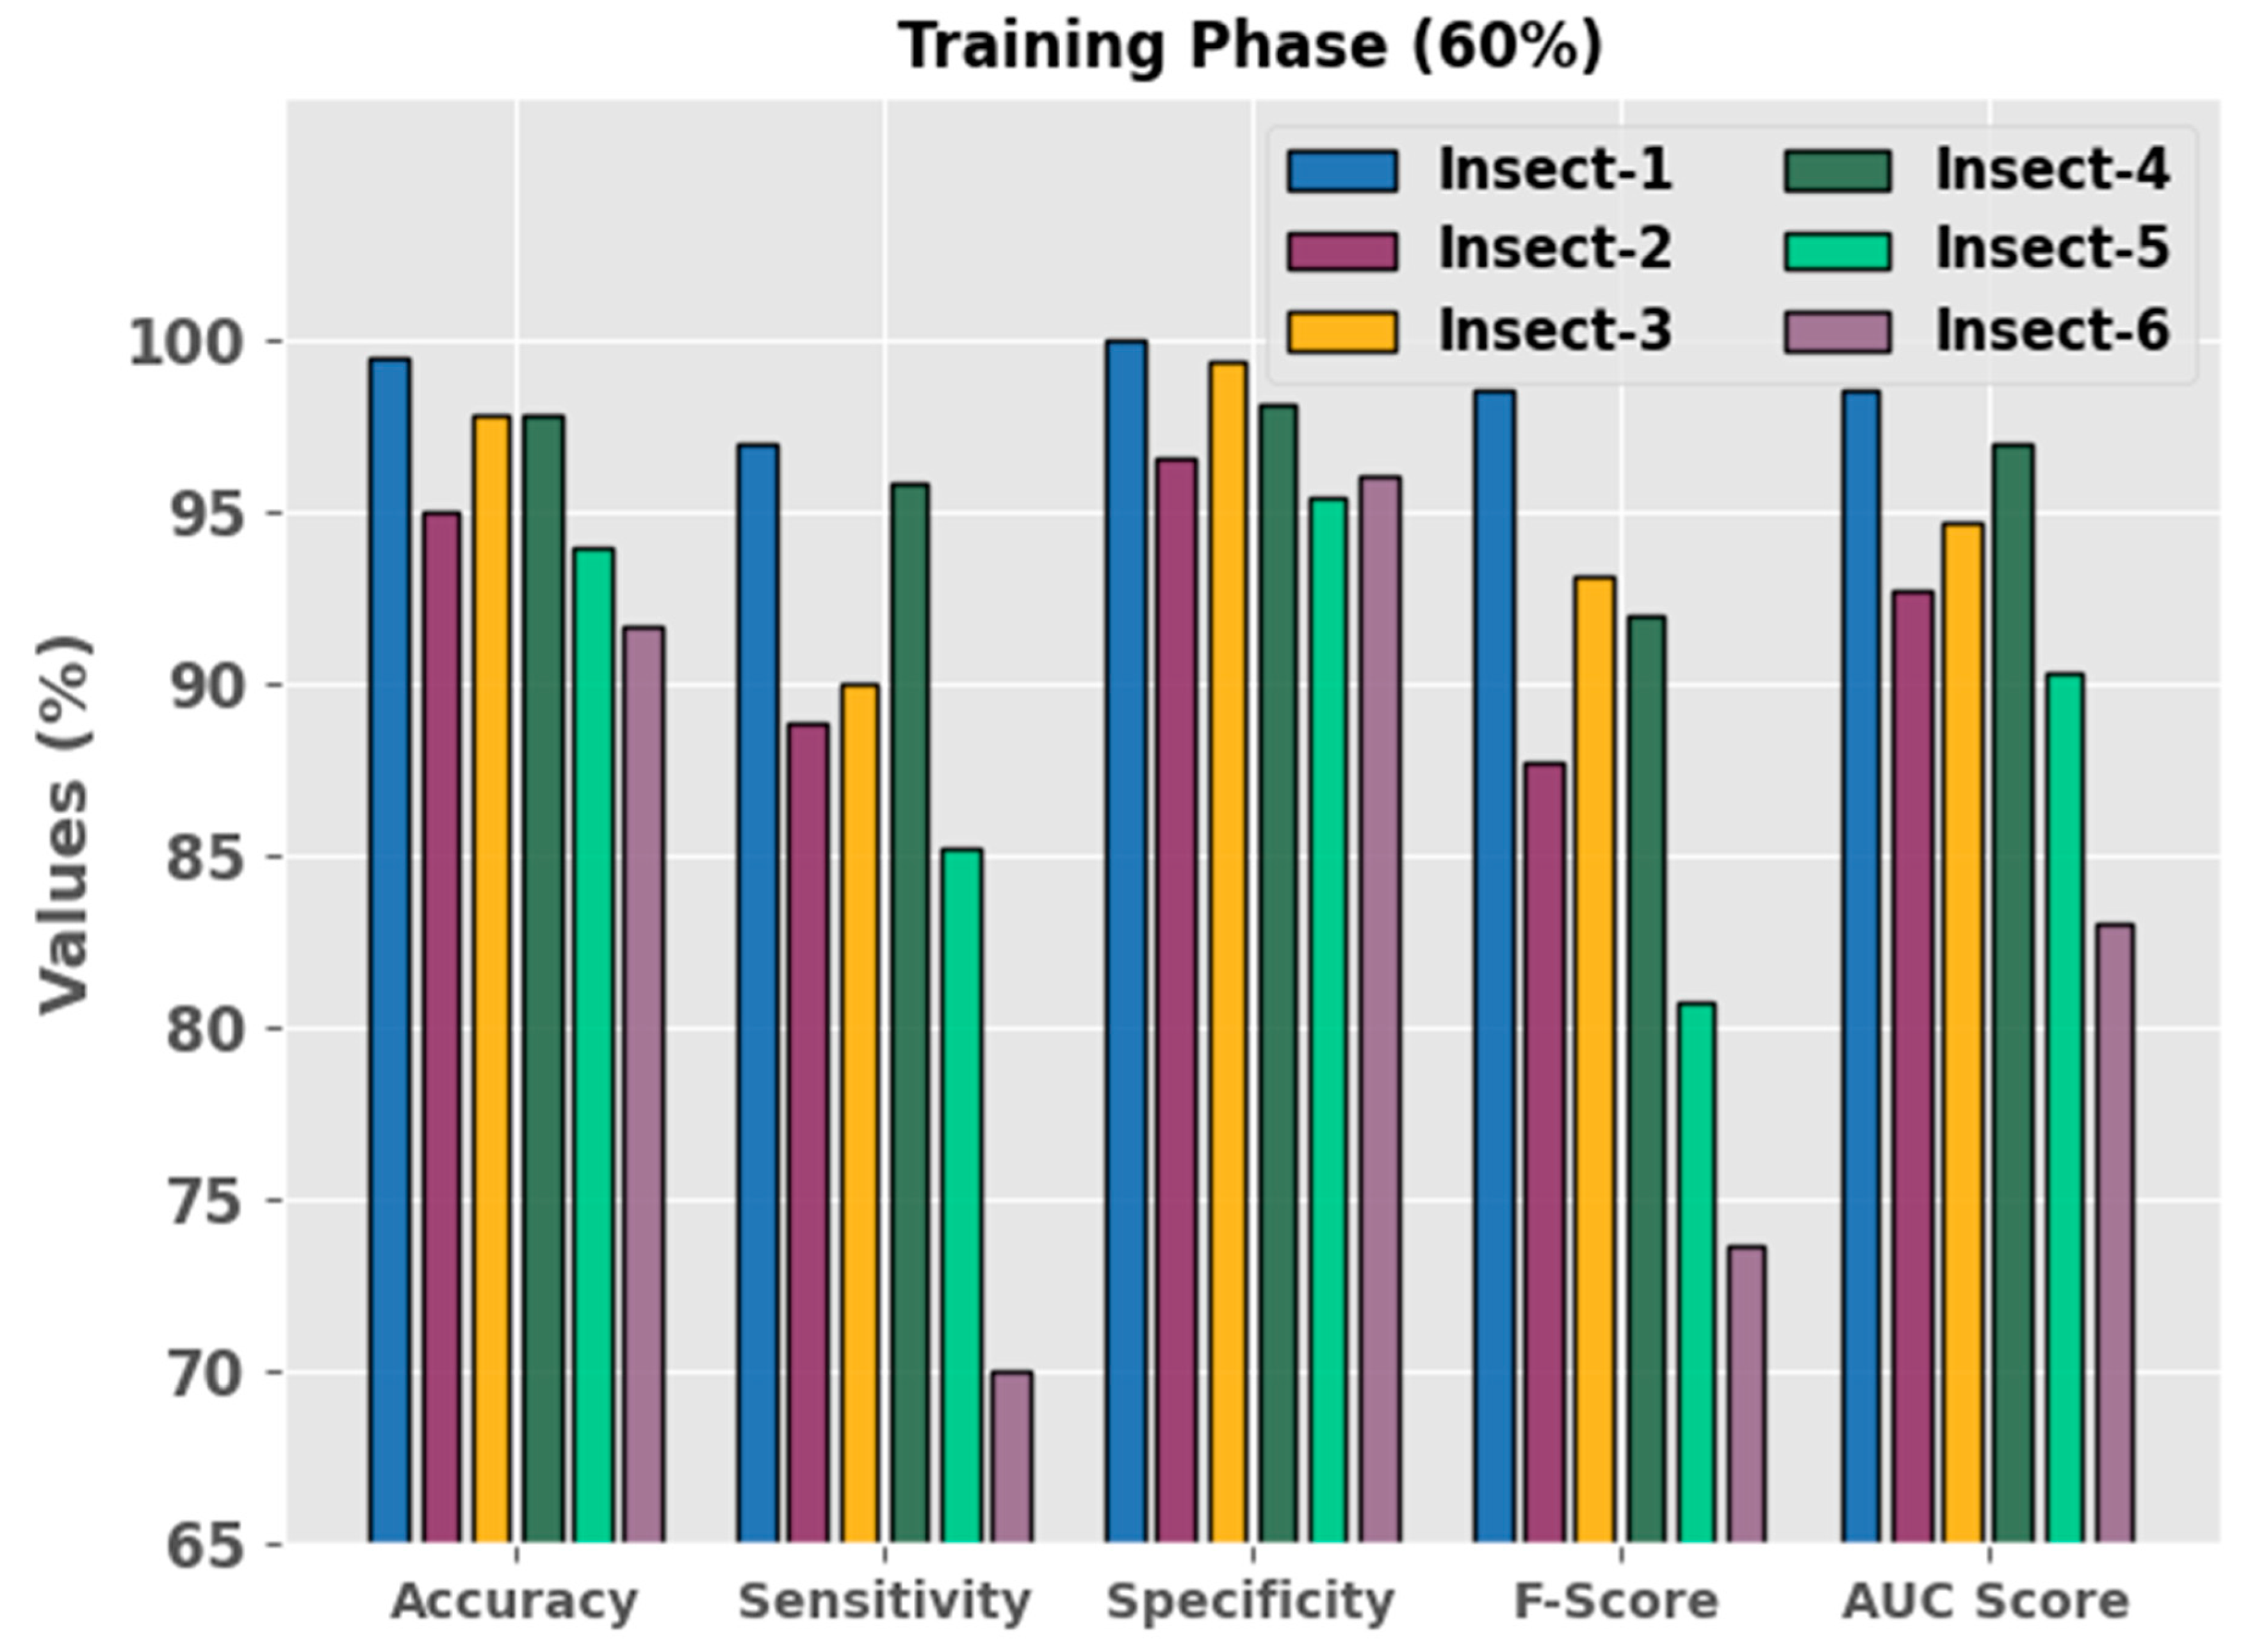
Figure 7 exhibits the classification outcomes of the IAEODL-IDC method for the 60% TR set. The results show that the IAEODL-IDC method determined all six types of insects. In the insect-1 class, the IAEODL-IDC method attained an
of 99.44%,
of 96.97%,
of 100%,
of 98.46%, and an
of 98.48%. Meanwhile, for the insect-3 class, the IAEODL-IDC technique achieved an
of 97.78%,
of 90%,
of 99.33%,
of 93.10%, and an
of 94.67%. Moreover, for the insect-6 class, the IAEODL-IDC method yielded an
of 91.67%,
of 70%,
of 96%,
of 73.68%, and an
of 83%.
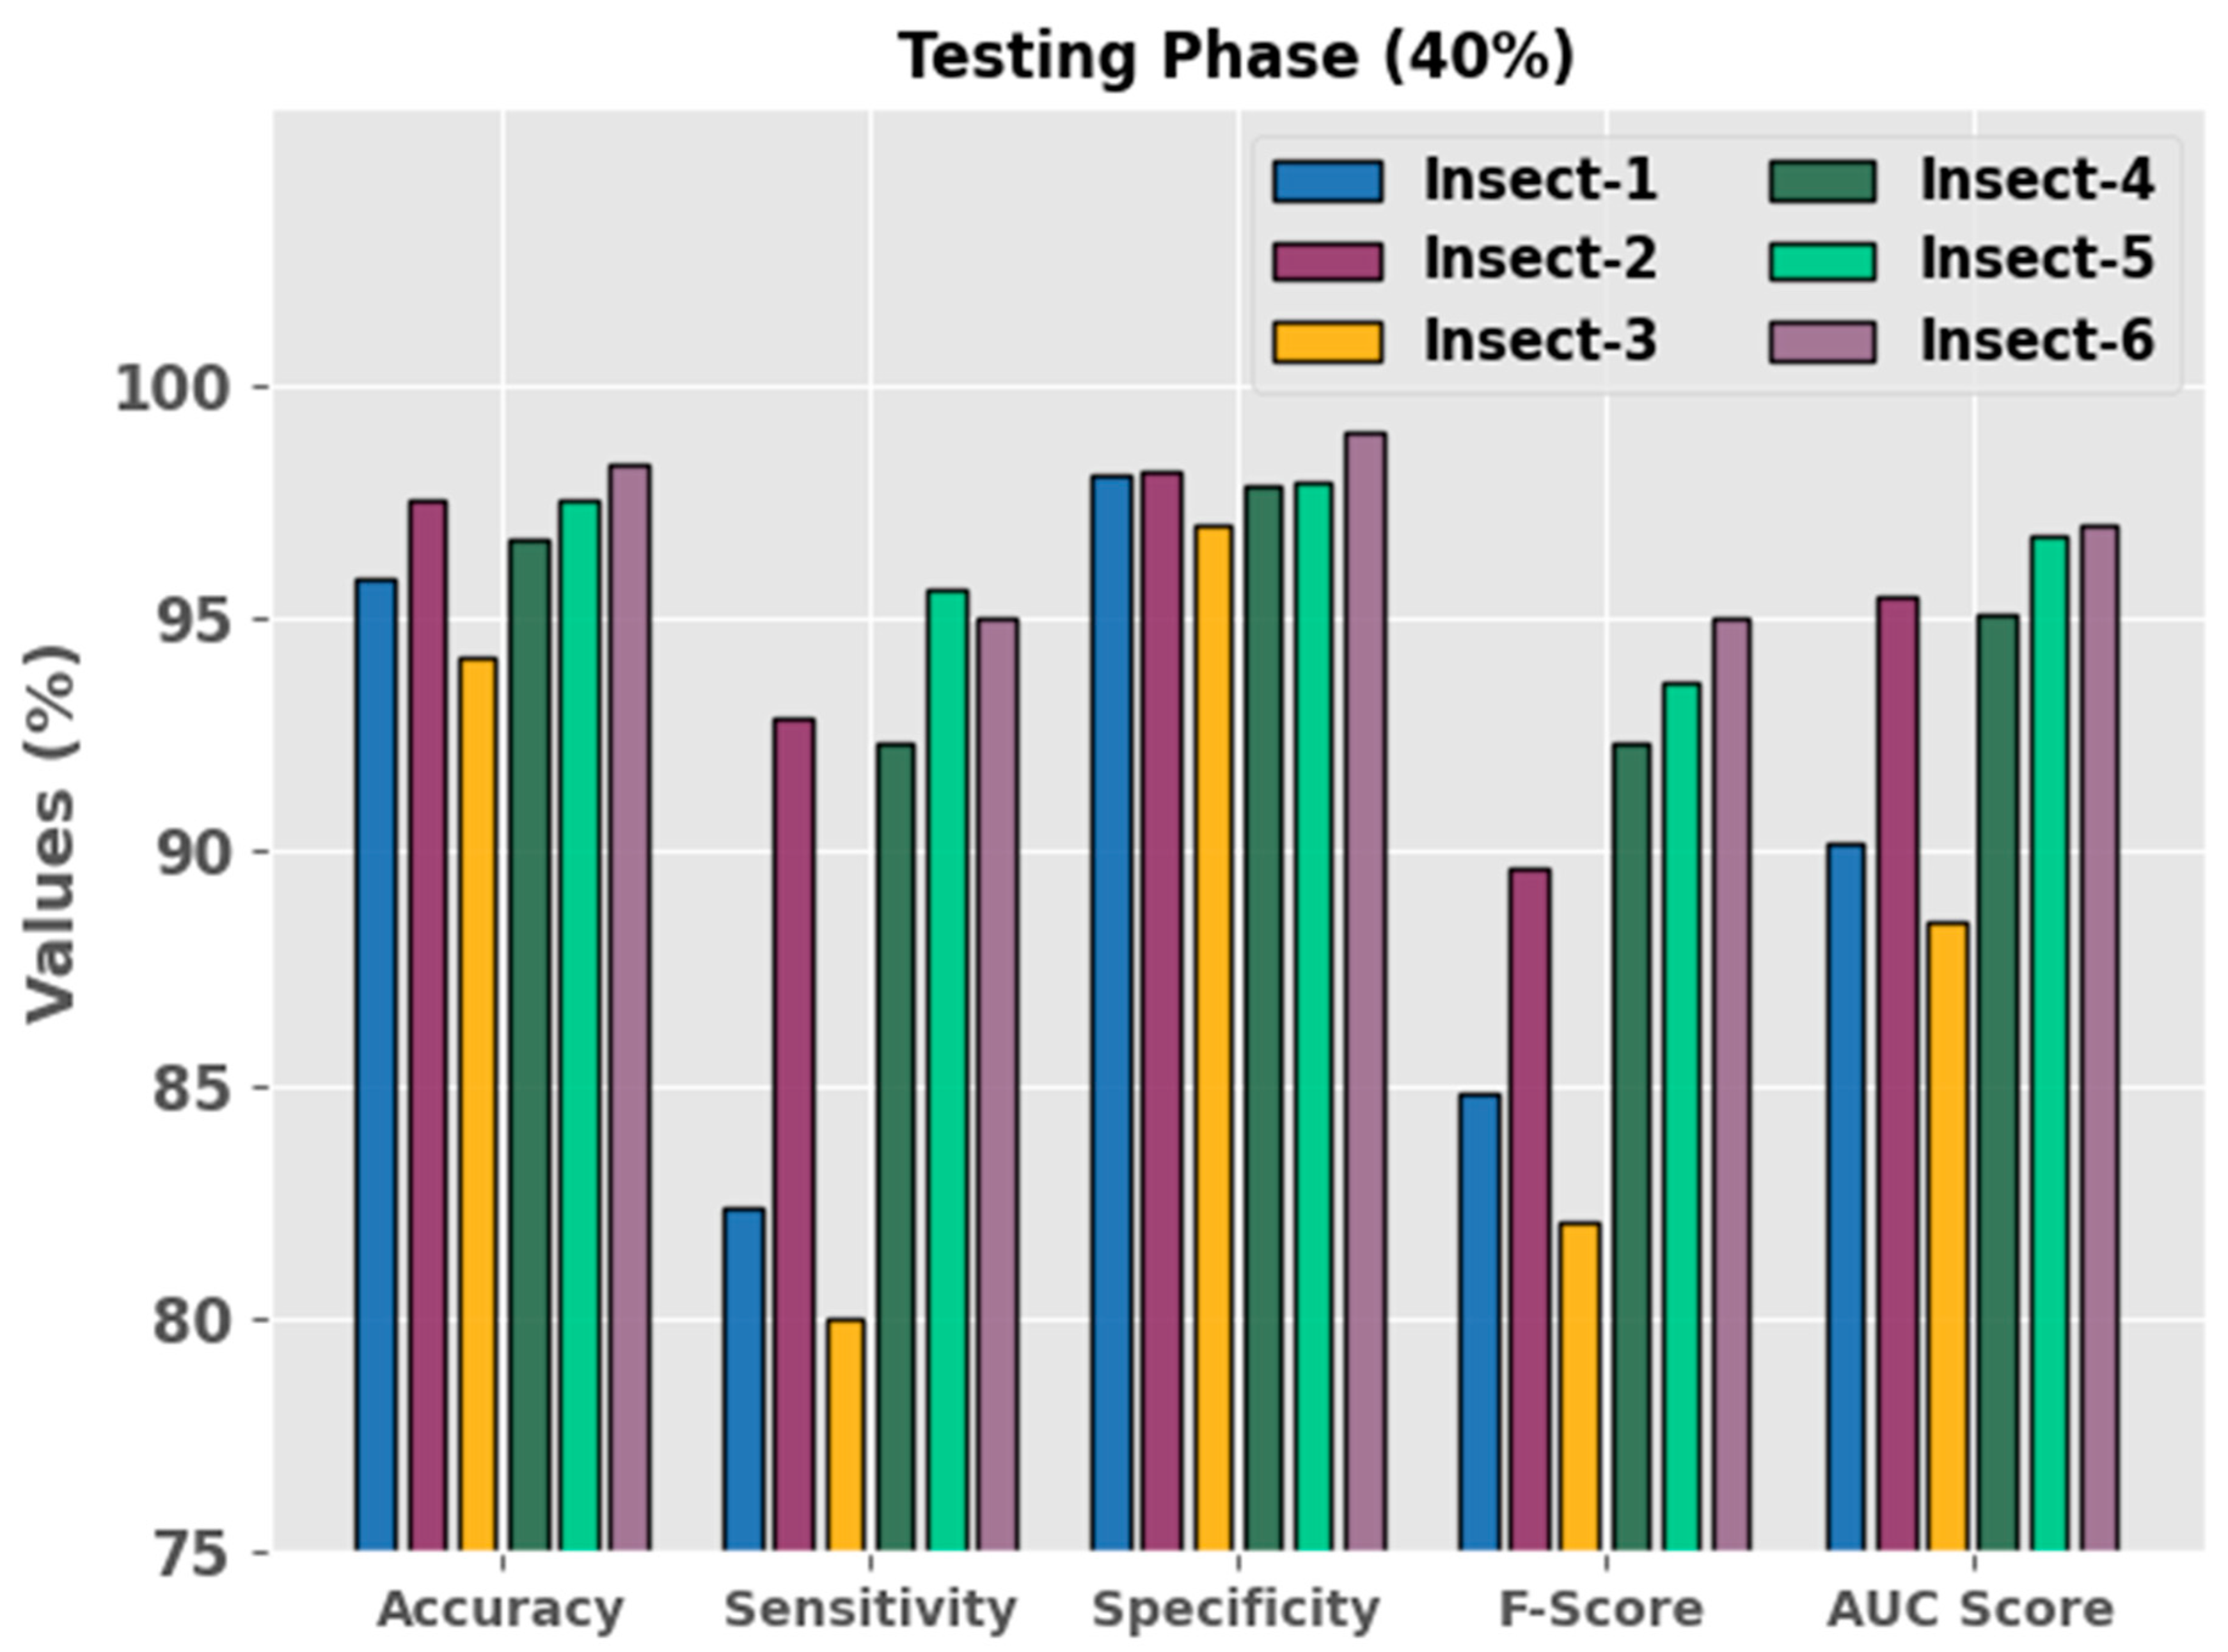
Figure 8 displays the overall classification outcomes of the IAEODL-IDC system for the 40% TS set. The results demonstrate that the IAEODL-IDC system determined all six types of insects. For the insect-1 class, the IAEODL-IDC technique obtained an
of 95.83%,
of 82.35%,
of 98.06%,
of 84.85%, and an
of 90.21%. Meanwhile, for the insect-4 class, the IAEODL-IDC method attained an
of 96.67%,
of 92.31%,
of 97.87%,
of 92.31%, and an
of 95.09%. Moreover, for the insect-6 class, the IAEODL-IDC method reached an
of 98.33%,
of 95%,
of 99%,
of 95%, and an
of 97%.
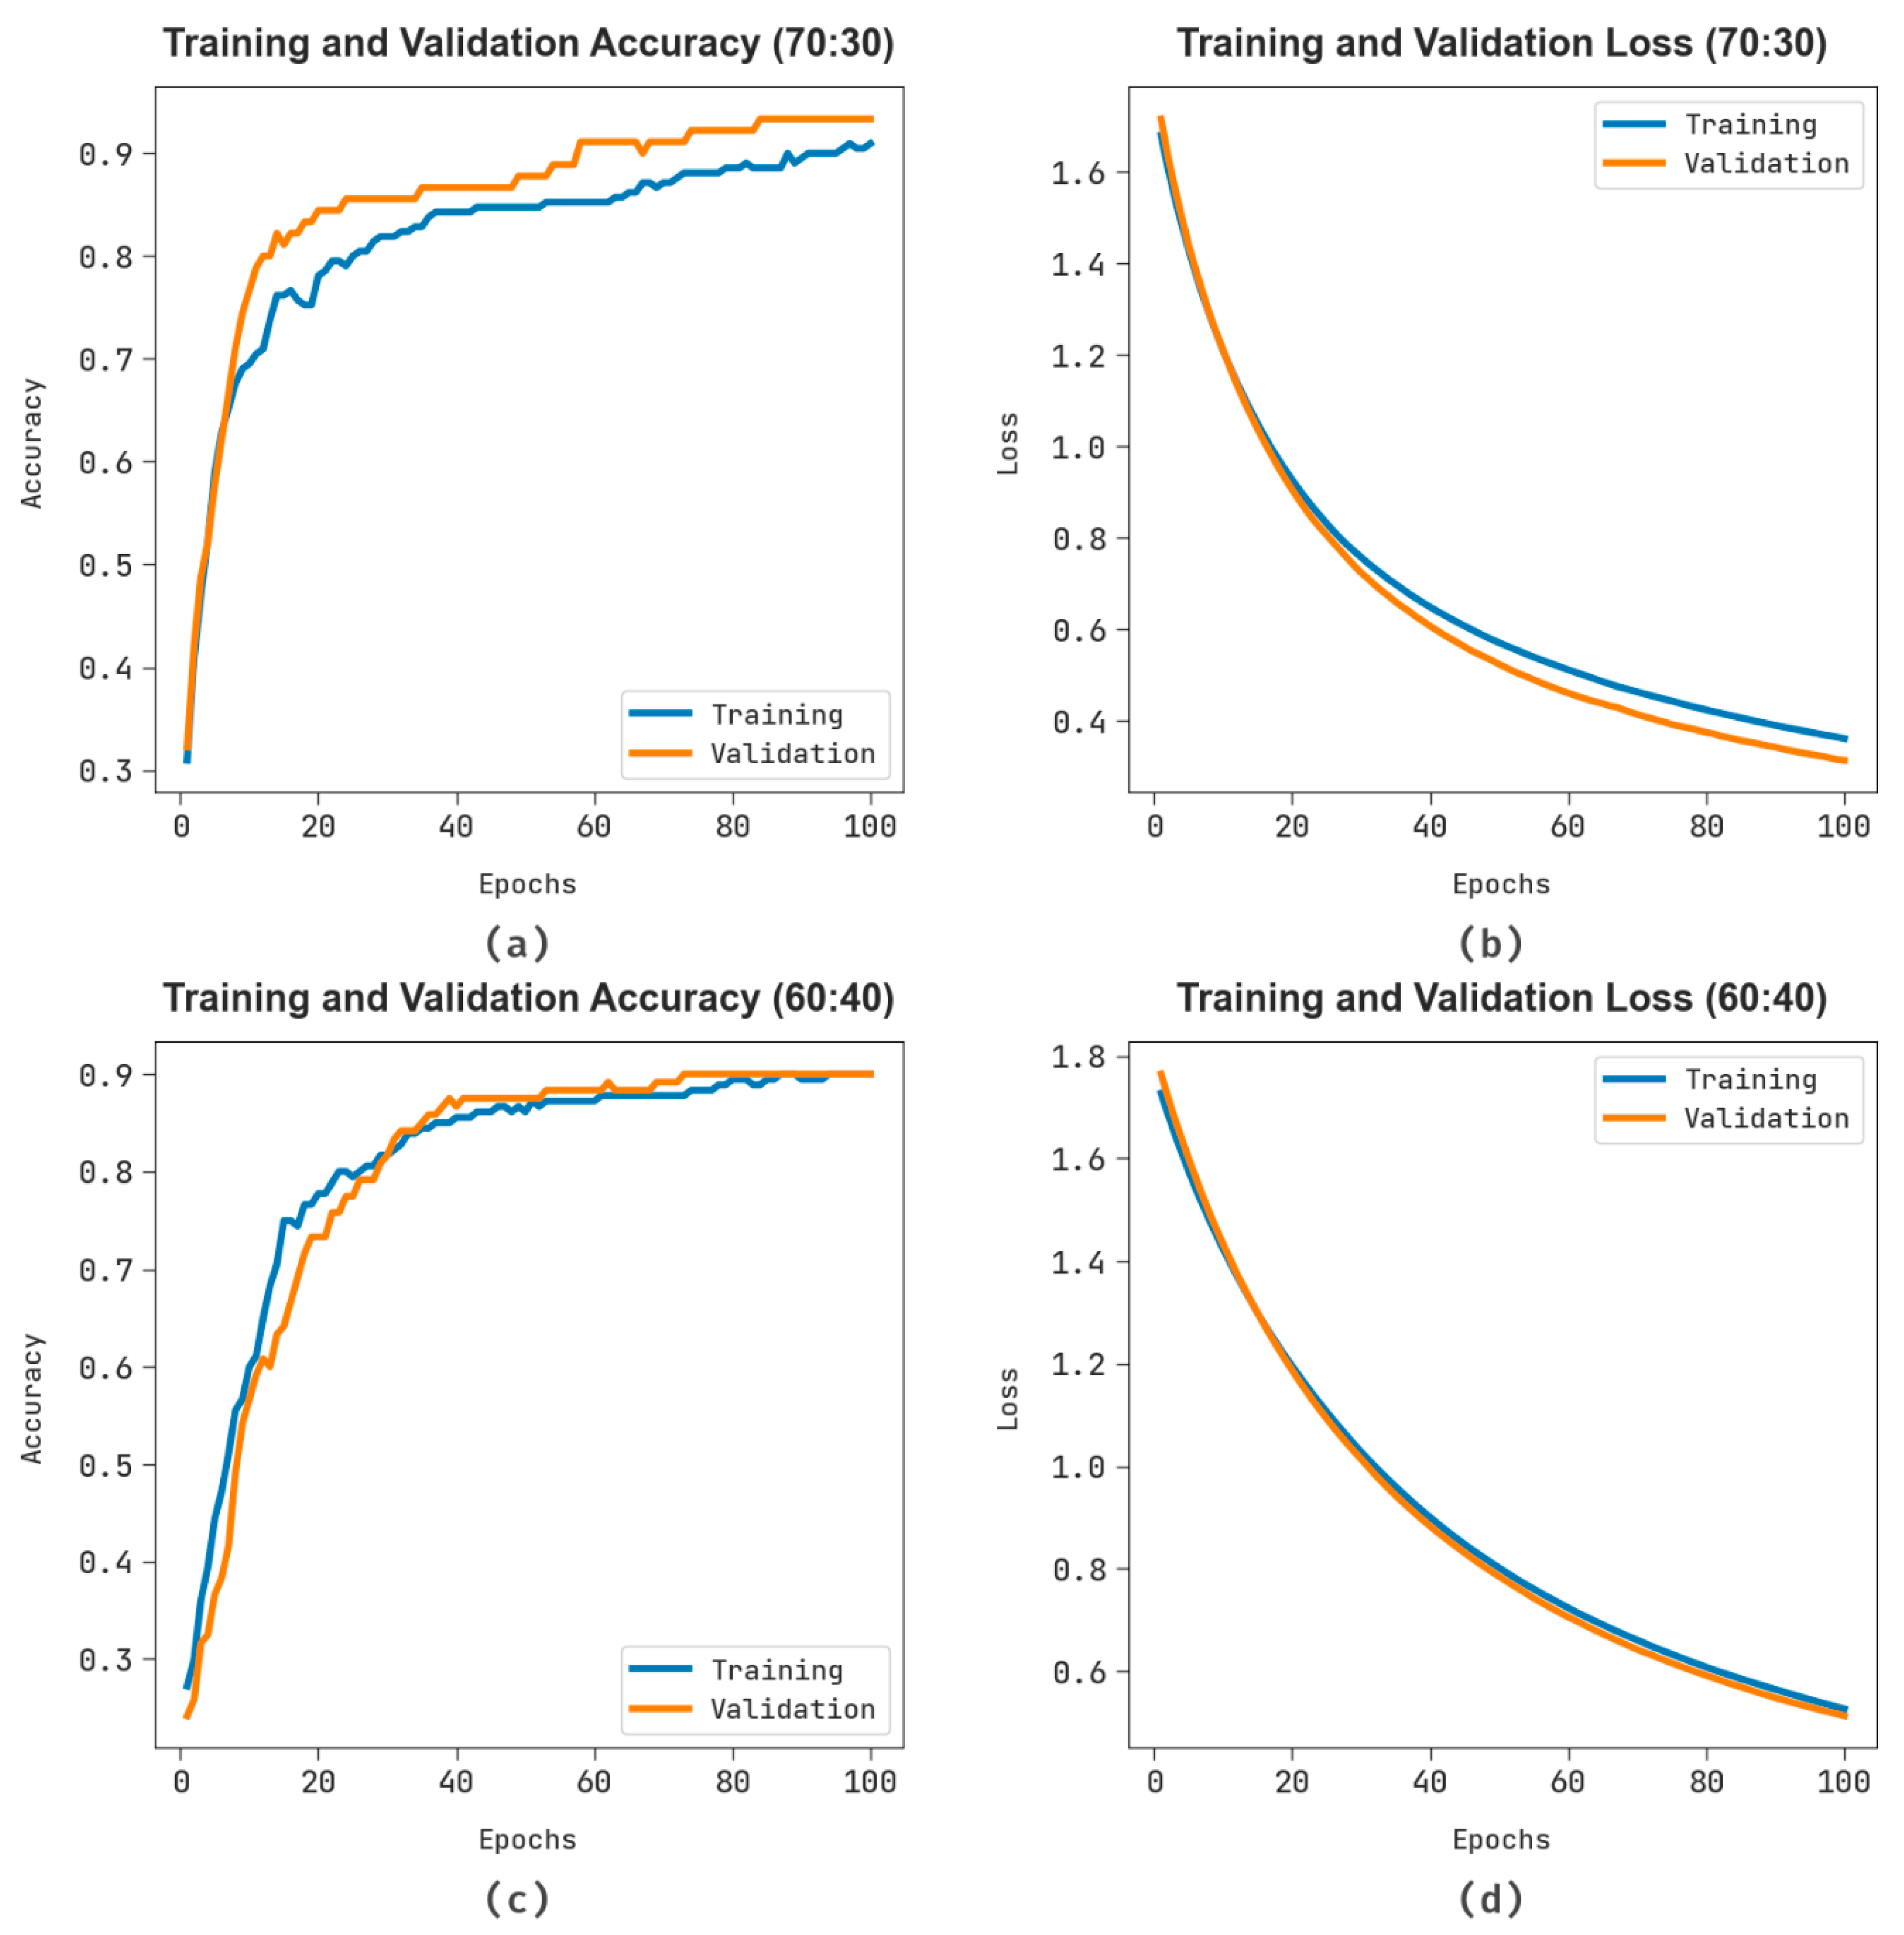
Figure 9 exhibits the classifier outcomes of the IAEODL-IDC method with the 70:30 and 60:40 datasets.
Figure 9a,c show the
analysis outcomes achieved by the IAEODL-IDC methodology with the 70:30 and 60:40 datasets. The outcome demonstrates that the IAEODL-IDC system obtained the maximum
values with an increase in the number of epochs. In addition, the maximum
over
exhibits that the IAEODL-IDC methodology learns efficiently. Lastly,
Figure 9b,d exhibit the loss examination outcomes of the IAEODL-IDC algorithm with the 70:30 and 60:40 datasets. The outcomes illustrate that the IAEODL-IDC methodology obtained nearby
and
loss values. The IAEODL-IDC system obtained effective outcomes with the test database.
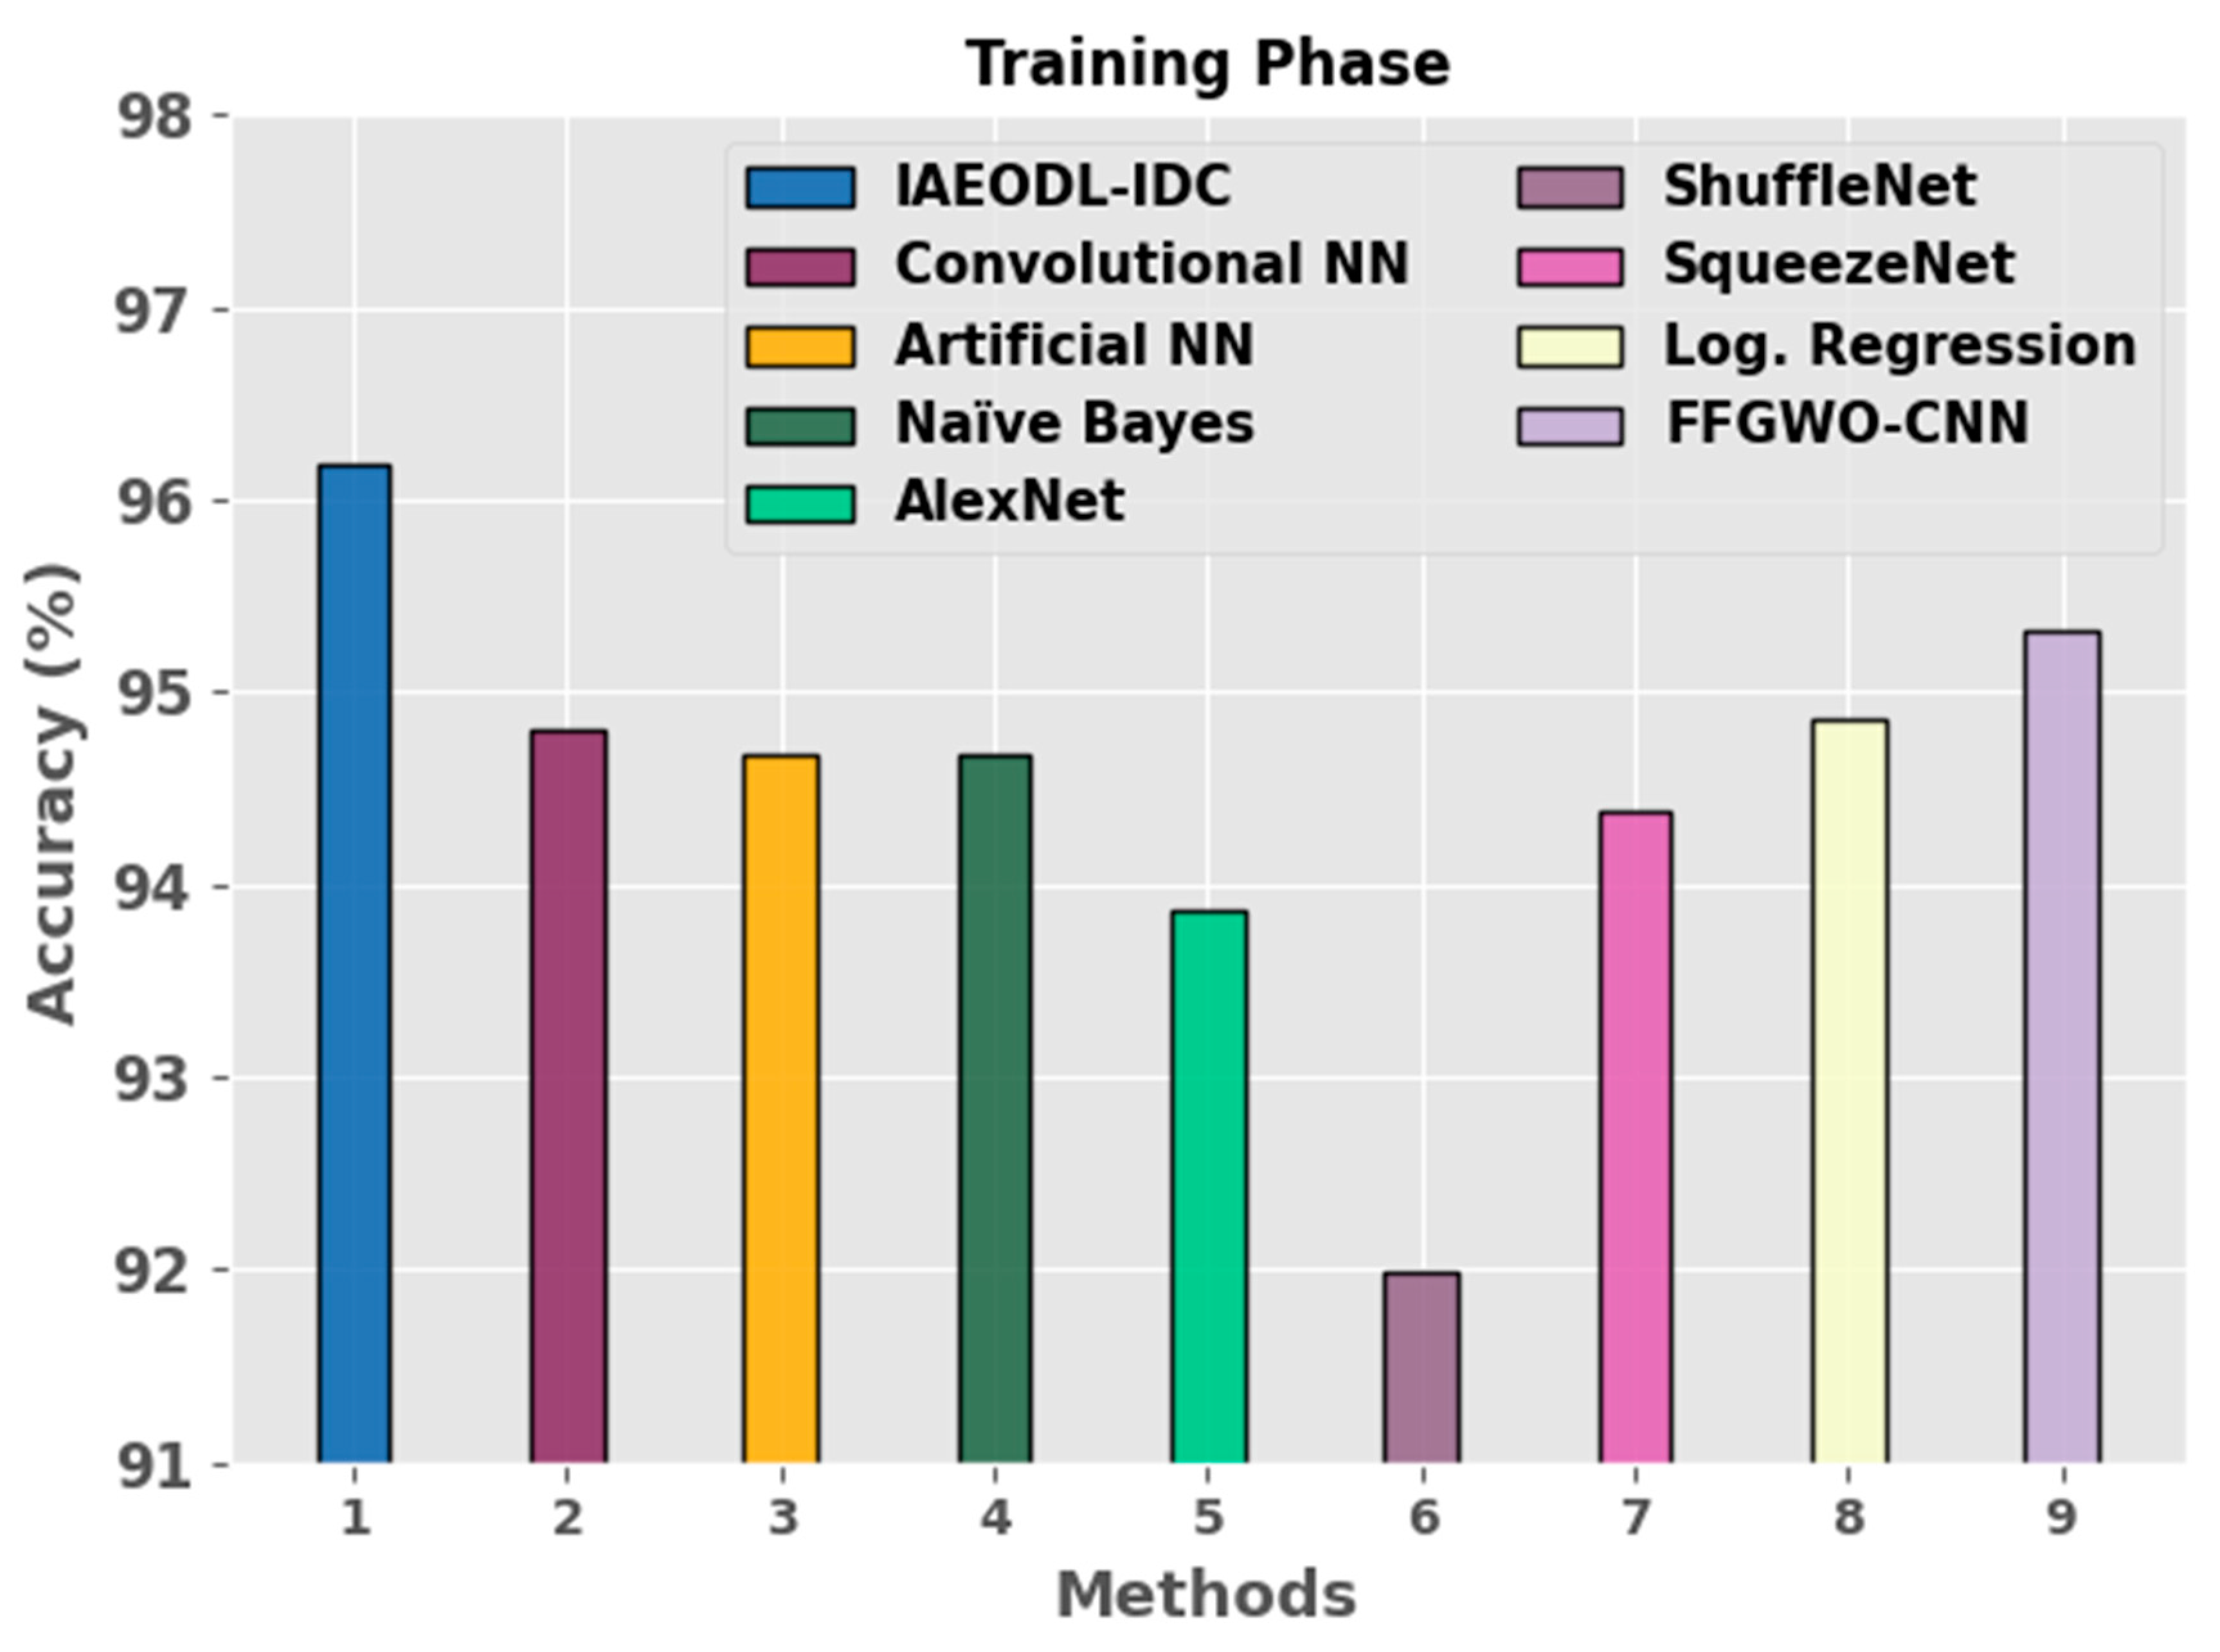
Figure 10 shows the
examination outcomes of the IAEODL-IDC system and other existing methods [
14,
25,
26] for the TR set. The results indicate that the SqueezeNet, LR, CNN, ANN, NB, AlexNet, and ShuffleNet models reached low
values of 94.38%, 94.86%, 94.80%, 94.68%, 94.67%, 93.87%, and 91.99%, respectively. Though the FFGWO-CNN model attained a reasonable
of 95.32%, the IAEODL-IDC technique outperformed all other models and achieved a maximum
of 96.19%.
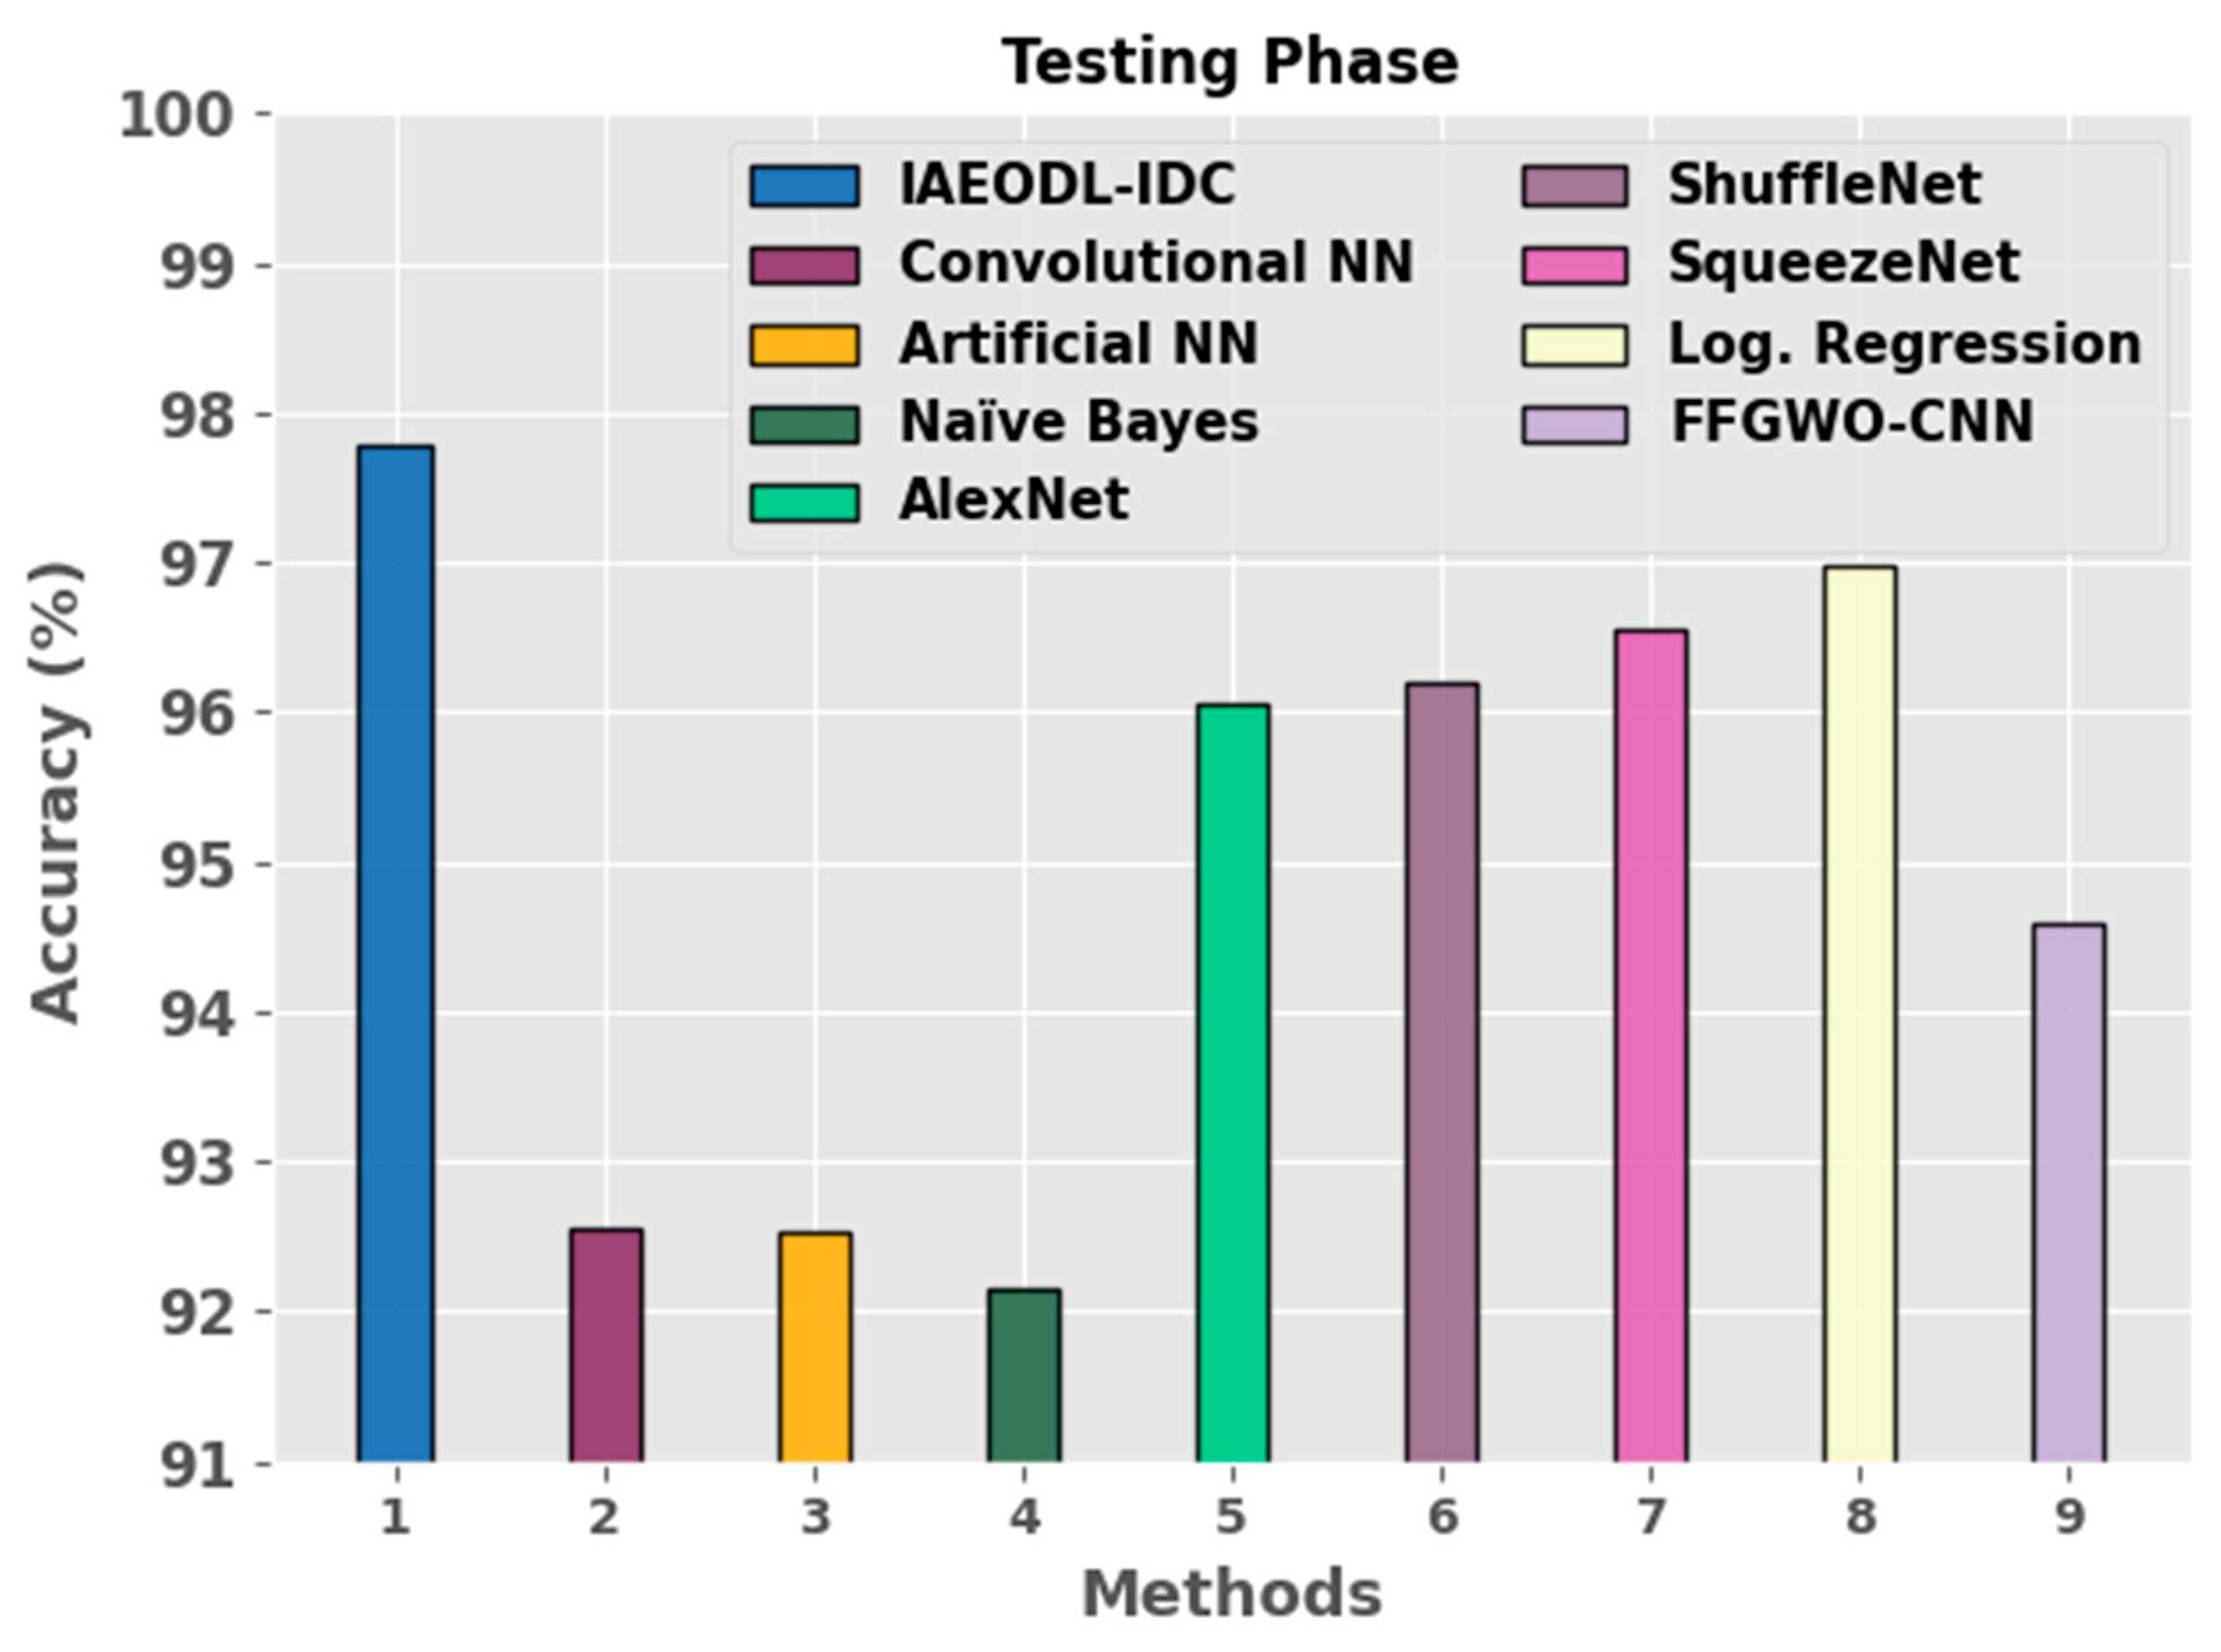
Figure 11 depicts the
examination results achieved by the proposed IAEODL-IDC technique and other methods for the TS set. The outcome demonstrates that the SqueezeNet, FFGWO-CNN, CNN, ANN, NB, AlexNet, and ShuffleNet methods attained the lowest
values of 96.55%, 94.58%, 92.56%, 92.52%, 92.16%, 96.06%, and 96.20%, respectively. Though the LR method obtained a reasonable
of 96.98%, the IAEODL-IDC technique outperformed the rest of the methods and achieved the highest
of 97.78%.
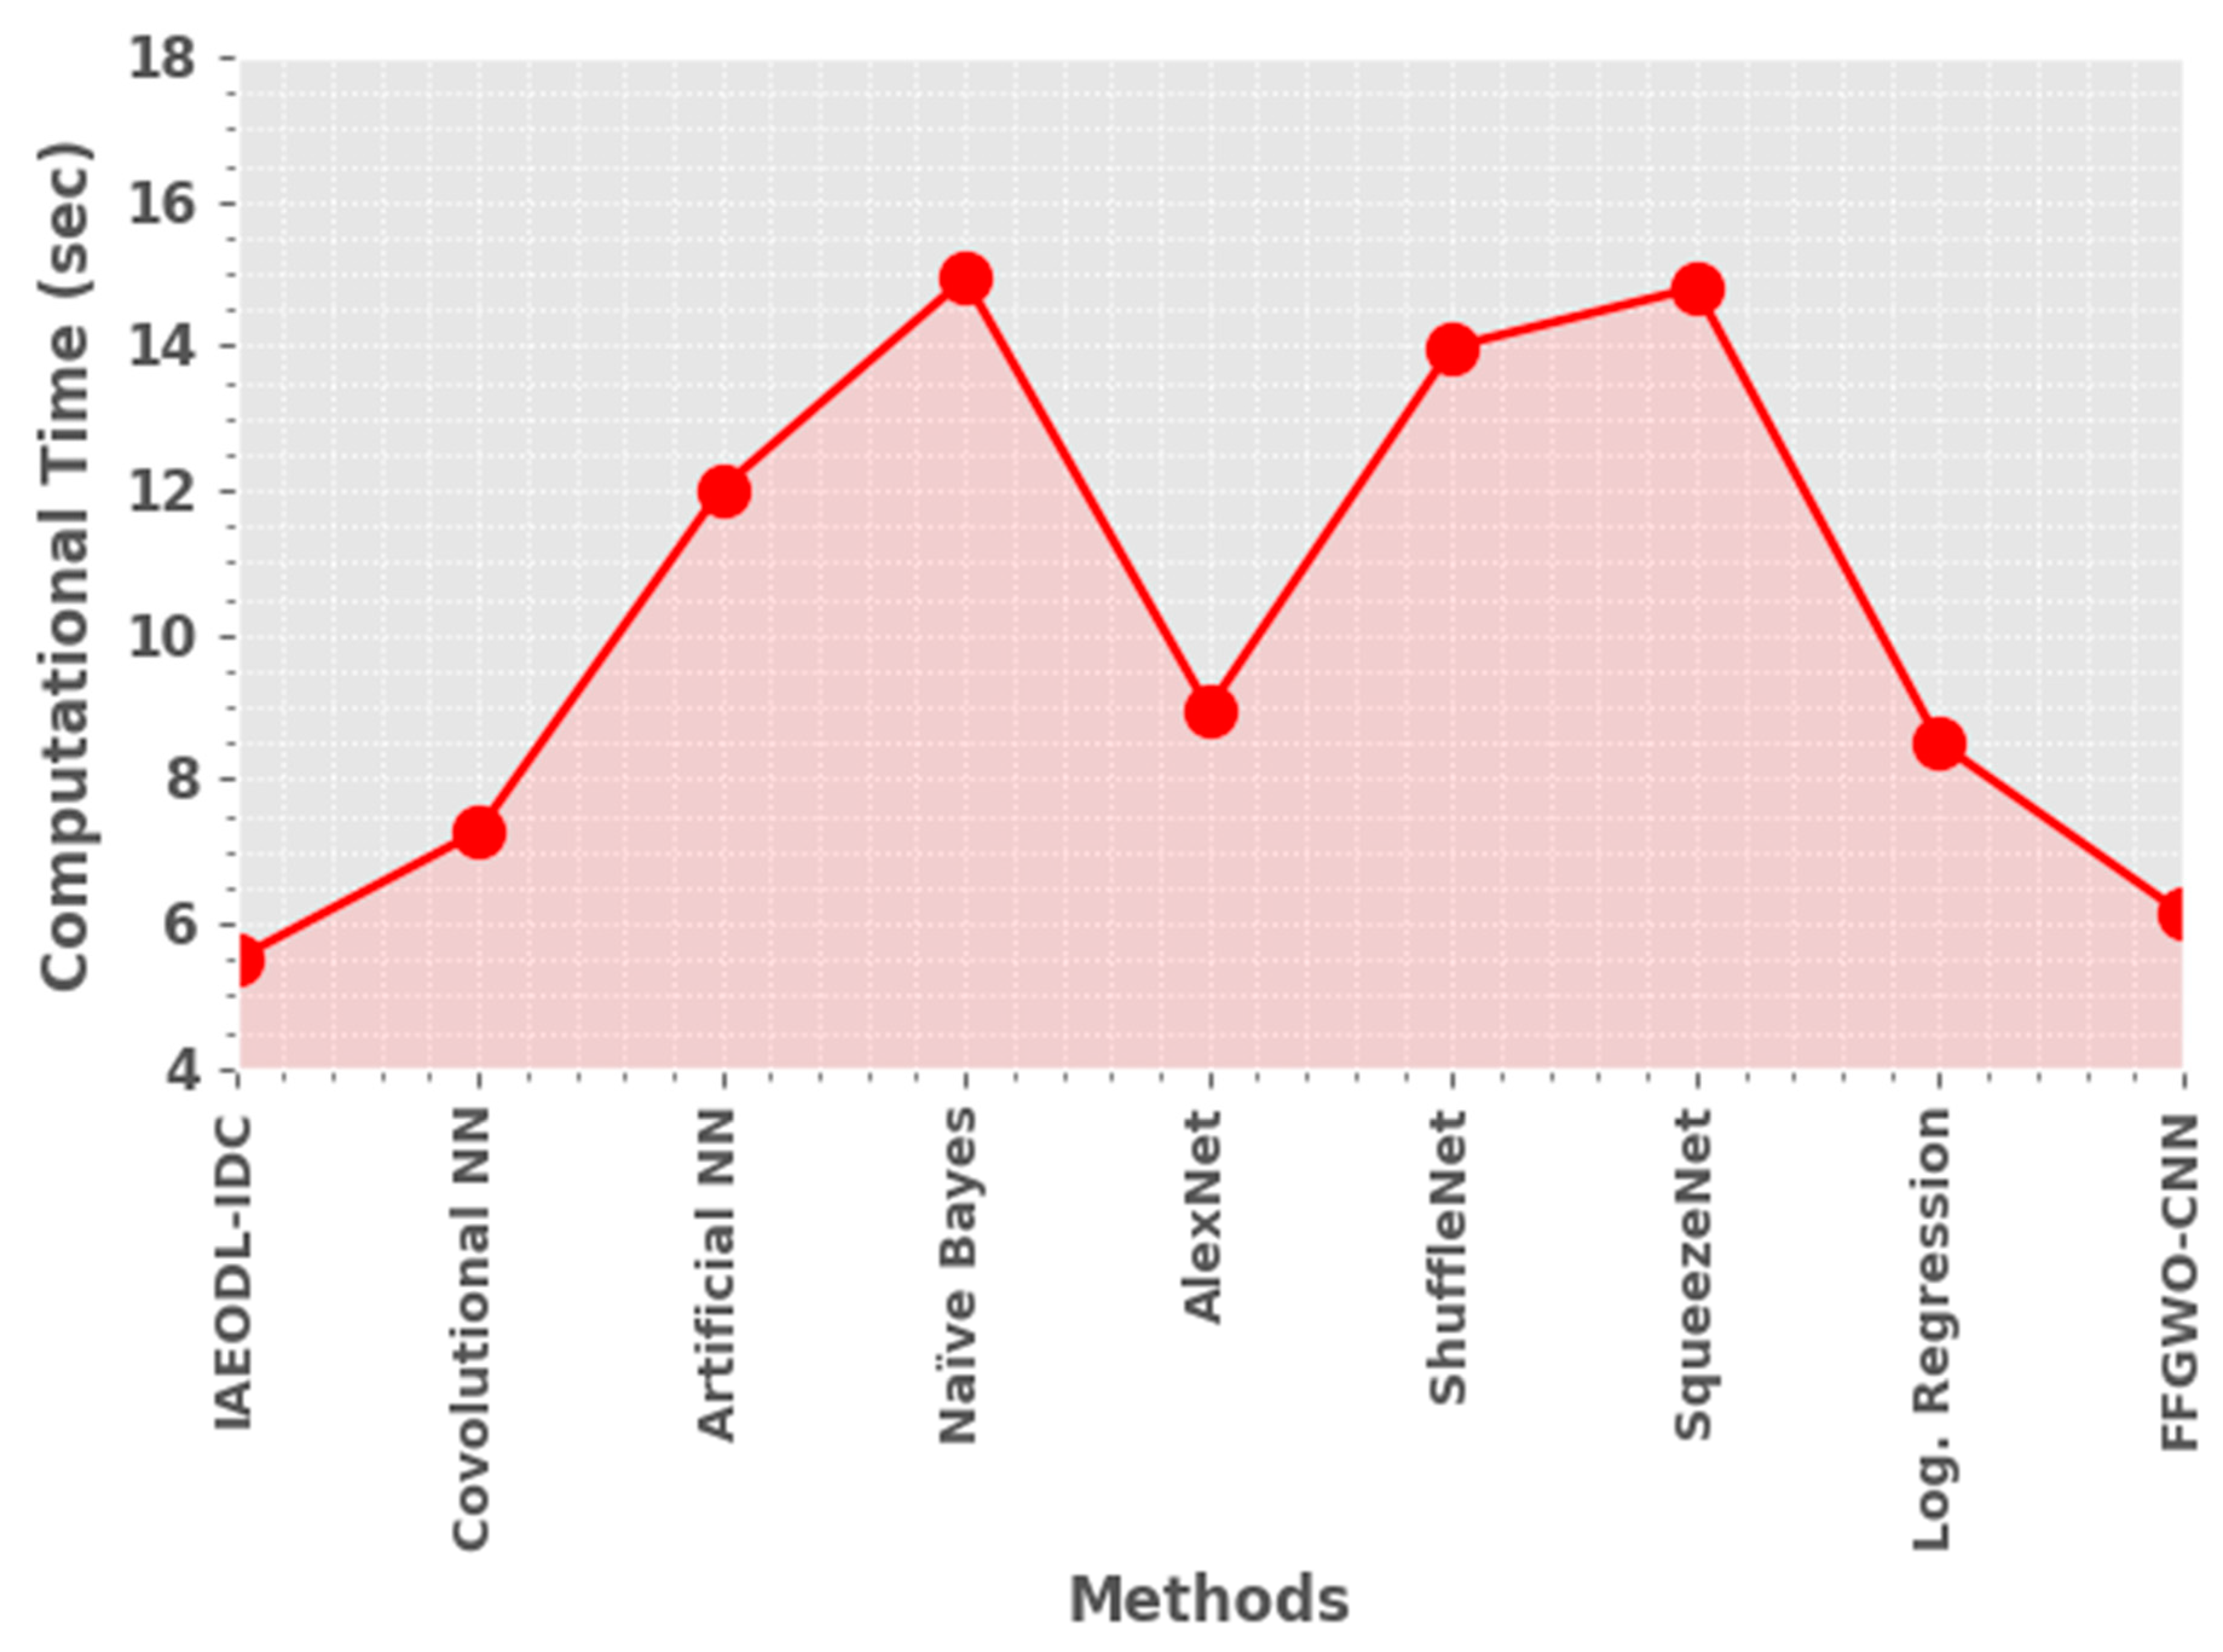
Lastly, a computation time (CT) analysis was conducted for the IAEODL-IDC methodology and other existing approaches, and the results are shown in
Figure 12.
The outcomes demonstrate that the IAEODL-IDC technique achieved better performance over existing models with a minimal CT of 5.49 s. These results establish the superior performance of the IAEODL-IDC system as an insect classification model.


