Article

System Design, Optimization and 2nd Law Analysis of a 100 MWe Double Reheat s-CO2 Power Plant at Full Load and Part Loads

by
Sreekanth Manavalla
1,2,
Feroskhan M.
2,*,
Joseph Daniel
2,
Sivakumar Ramasamy
2,
T. M. Yunus Khan
3,
Rahmath Ulla Baig
4,
Naif Almakayeel
4 and
Bhanu Kiran Voddin Tirumalapur
2
1
Electric Vehicle Incubation, Testing and Research Centre, Vellore Institute of Technology Chennai, Chennai 600127, India
2
School of Mechanical Engineering, Vellore Institute of Technology Chennai, Chennai 600127, India
3
Department of Mechanical Engineering, College of Engineering, King Khalid University, Abha 61421, Saudi Arabia
4
Department of Industrial Engineering, College of Engineering, King Khalid University, Abha 61421, Saudi Arabia
*
Author to whom correspondence should be addressed.
Sustainability 2023, 15(20), 14677; https://doi.org/10.3390/su152014677
Submission received: 20 May 2023 / Revised: 22 September 2023 / Accepted: 26 September 2023 / Published: 10 October 2023

Abstract

:
Super-critical Carbon dioxide (s-CO2) power plants are considered to be efficient and environmentally friendly compared to the traditional Rankine cycle-based steam power plants and Brayton cycle-based gas turbine power plants. In this work, the system design of a coal-fired 100 MWe double reheat s-CO2 power plant is presented. The system is also optimized for efficiency with turbine inlet pressures and the recompression ratio as the variables. The components needed, mass flow rates of various streams and their pressures at various locations in the system have been established. The plant has been studied based on 1st and 2nd laws at full load and at part loads of 80%, 60% and 40%. Operating parameters such as mass flow rate, pressure and temperature have considerably changed in comparison to full load operation. It was also observed that the 1st law efficiency is 53.96%, 53.93%, 52.63% and 50% while the 2nd law efficiency is 51.88%, 51.86%, 50.61% and 48.1% at 100%, 80%, 60% and 40% loads, respectively. The power plant demonstrated good performance even at part loads, especially at 80% load, while the performance deteriorated at lower loads. At full load, the highest amount of exergy destruction is found in the main heater (36.6%) and re-heaters (23.2% and 19.6%) followed by the high-temperature recuperator (5.7%) and cooler (4.1%). Similar trends were observed for the part load operation. It has been found that the recompression ratio should be kept high (>0.5) at lower loads in order to match the performance at higher loads. Combustion and heat exchange due to finite temperature differences are the main causes of exergy destruction, followed by pressure drop.

1. Introduction

The modern world is undergoing rapid development which is reflected in the increased per capita energy consumption. Developing countries such as India are experiencing exponential growth and, at the same time, awareness of climate change is catching up and governments worldwide are looking at environmentally friendly power generation technologies that are also efficient and sustainable. Renewable energy sources are known to be environmentally friendly and even though power from solar and wind energy is becoming competitive [1], they are not reliable and sustainable without the support of bulky energy storage devices such as batteries. Conventional power generation technologies involving fossil fuels have the advantage of being mature and well understood while they suffer from an environmental regulations viewpoint [2]. Several innovative ways of utilizing fossil fuels and reducing their impact on the environment have been explored and are still being investigated [3]. Some of the methods are fluidized bed combustion [4], oxy-fuel combustion [5], chemical looping combustion [6], etc., which aim at reducing the pollutants at the combustion stage itself. In addition, the application of fossil fuels is being investigated in high-end thermal power plants such as ultra super-critical power plants [7]. However, they need expensive materials due to high pressure and temperatures. Some technologies are designed to handle the pollutants after the combustion process, and carbon capture and storage (CCS) is one among them [8]. It would be useful if the captured and stored carbon dioxide could be put to further use. One such application is to use carbon dioxide as a refrigerant while another application is to use it in power generation [9], such as in s-CO2 power plants.
The primary benefit of using CO2 as a working fluid in power generation is that it can replace water as a working fluid, thereby preserving and conserving a more important natural resource. Moreover, large amounts of CO2 generated by burning fossil fuels (~963 tons/day by a 100 MWe plant) [10] can be utilized and thereby decrease its contribution to global warming. Other benefits of CO2 as a working fluid are the fact that it is inert, non-toxic, non-corrosive, has low ozone depletion potential, is accessible and affordable, has good thermal characteristics for heat exchange, a low compression work around critical point, higher thermal efficiency and the equipment is compact due to high density [11]. In addition to fossil fuels, the necessary heat for a s-CO2 power plant can also be sourced from geothermal, solar and/or waste heat energies [12].
Despite having several benefits mentioned above and having been introduced several decades ago in the 1960s by Angelino [13] and Feher [14], the power generation technology using s-CO2 is still at the testing stage with test facilities in the 1–250 kW range and the largest pilot plant being of 10 MWe capacity built by the Gas Turbine Institute, Southwest Research Institute and General Electric Global Research together in San Antonio, Texas, USA [15]. Several review articles were recently published highlighting the benefits, drawbacks, state-of-the-art and future work to be taken up to make s-CO2 power a reality at a higher scale [11,12,16,17,18,19,20]. Sarkar [16] emphasized the need for more experimental research on transcritical Rankine cycles to carry out a techno-economic comparison of CO2 with other working fluids. Crespi et al. [17] have stated that high efficiencies in the range of 50–60% can be achieved by using combined cycle layouts involving s-CO2. Ahn et al. [12] suggested that the focus should be on developing pilot power plants bigger than 10 MWe so as to explore the commercial benefits due to scale-up. Yin et al. [18] carried out a review on the application of s-CO2 with concentrated solar power and suggested that future research should focus on the materials used, thermodynamic analysis at the design point and off-design point as well as transient modeling. White et al. [19] highlighted areas of research in the turbomachinery, heat exchangers, materials and control systems. Yu et al. [20] found that identifying an efficient cycle for a given heat source is an unanswered question and needs to be studied for various heat sources. They also suggested that CO2-based gas mixtures also need to be evaluated for usage in these power plants.
Based on the reported research and review articles, it can be found that several thermodynamic configurations involving s-CO2 have been studied. All these studies aimed at maximizing the thermal efficiency either by using a single cycle or a combined cycle. Sun et al. [21] proposed a bottoming cycle for a coal-fired s-CO2 power plant to effectively utilize the heat in the exhaust gases. They reported an efficiency of 47% with a double reheat recompression cycle with CO2 parameters as 620 °C temperature and 30 MPa pressure. Chen et al. [22] compared two recompression cycles, one with a single reheat and another with a double reheat. They found that the double reheat cycle is more efficient than the single reheat cycle. Moreover, they have evaluated the exergy destruction in the combustion, heat transfer and pressure drop and found that most of the exergy is destructed during combustion followed by heat transfer. Bai et al. [23] proposed an improved recompression s-CO2 coal-fired power plant. Rogalev et al. [24] explored the possibility of replacing steam with s-CO2 in a nuclear power plant and found it to be an attractive option for a working fluid temperature above 455 °C.
Some studies on the part load performance of s-CO2 plants have been reported in the literature. Sanchez et al. [25] analyzed a hybrid system comprising a molten carbonate fuel cell and s-CO2 cycle to evaluate the control strategies at part loads and concluded that mixed strategies give better results compared to individual control strategies. Fan et al. [26] considered simple supercritical and trans-critical plants to conduct thermodynamic analysis and determine the control strategy. Yang et al. [27] studied four simple and separate layouts powered by solar energy and compared different cycles at full and part loads. Tong et al. [28] studied a coal-powered single reheat recompression cycle and evaluated the boiler’s part load performance. Lee et al. [29] developed a CFD model to study the part load performance of radial flow turbines used in s-CO2 plants with a maximum deviation of 10%. Alfani et al. [30] considered four different system layouts powered by waste heat and carried out a 1st law and techno-economic analysis and optimization. They also compared the performance with organic Rankine cycle technology and concluded that s-CO2 has a better performance even at part loads. Fan and Dai [31] combined a simple s-CO2 with the Kalina cycle and a recompression s-CO2 with the Kalina cycle and carried out thermo-economic analysis and optimization of the system. They found the recompression-Kalina cycle to be a better performer both thermodynamically and economically. Fan et al. [32] studied a nuclear energy-powered s-CO2 plant combined with an organic Rankine cycle to carry out 1st law and economic analysis. Wang et al. [33] considered a fuel oil-powered recompression cycle and compared different control strategies at part loads. They concluded that inventory and anti-surge control is better than valve controls. Xingyan et al. [34] studied four different cycles and evaluated their performance based on layout and control strategies. Gini et al. [35] evaluated a simple recuperated cycle powered by molten salt for control strategy development at part loads. It is evident that some studies on the part load performance of s-CO2 plants have been reported, and a few studied the specific components [28,29] in the plant. There is no study that reported a part load study on a double reheat recompression cycle powered by coal. Table 1 summarizes the reported literature on part load studies of s-CO2 power plants.
From the summary of the literature presented above, it can be seen that several thermodynamic cycle layouts have been investigated and reported in the open literature. However, to the best of the authors’ knowledge, there is no study which considered the system design and optimization of a 100 MWe double reheat s-CO2 power plant and thermodynamic analysis at part loads. Since the existing systems would eventually be scaled up and part load operation would be inevitable and important, as emphasized by Yin et al. [18], the present study aims to predict the performance at full load as well as part loads of an s-CO2 power plant. Since it is generally understood that a double reheat recompression cycle has a high efficiency in comparison to other configurations [17,22], the same has been considered in the present study. The objectives of the present study are listed below:
  • To perform a system design of a 100 MWe coal-fired double reheat recompression s-CO2 system based on the parameters and configurations reported by Chen et al. [22].
  • To evaluate its performance at full load as well as at part loads of 80%, 60% and 40% based on 1st and 2nd laws of thermodynamics.
  • To optimize the performance based on thermal efficiency (1st law efficiency) at full load.
  • Identify the crucial operational parameters that influence thermal efficiency.
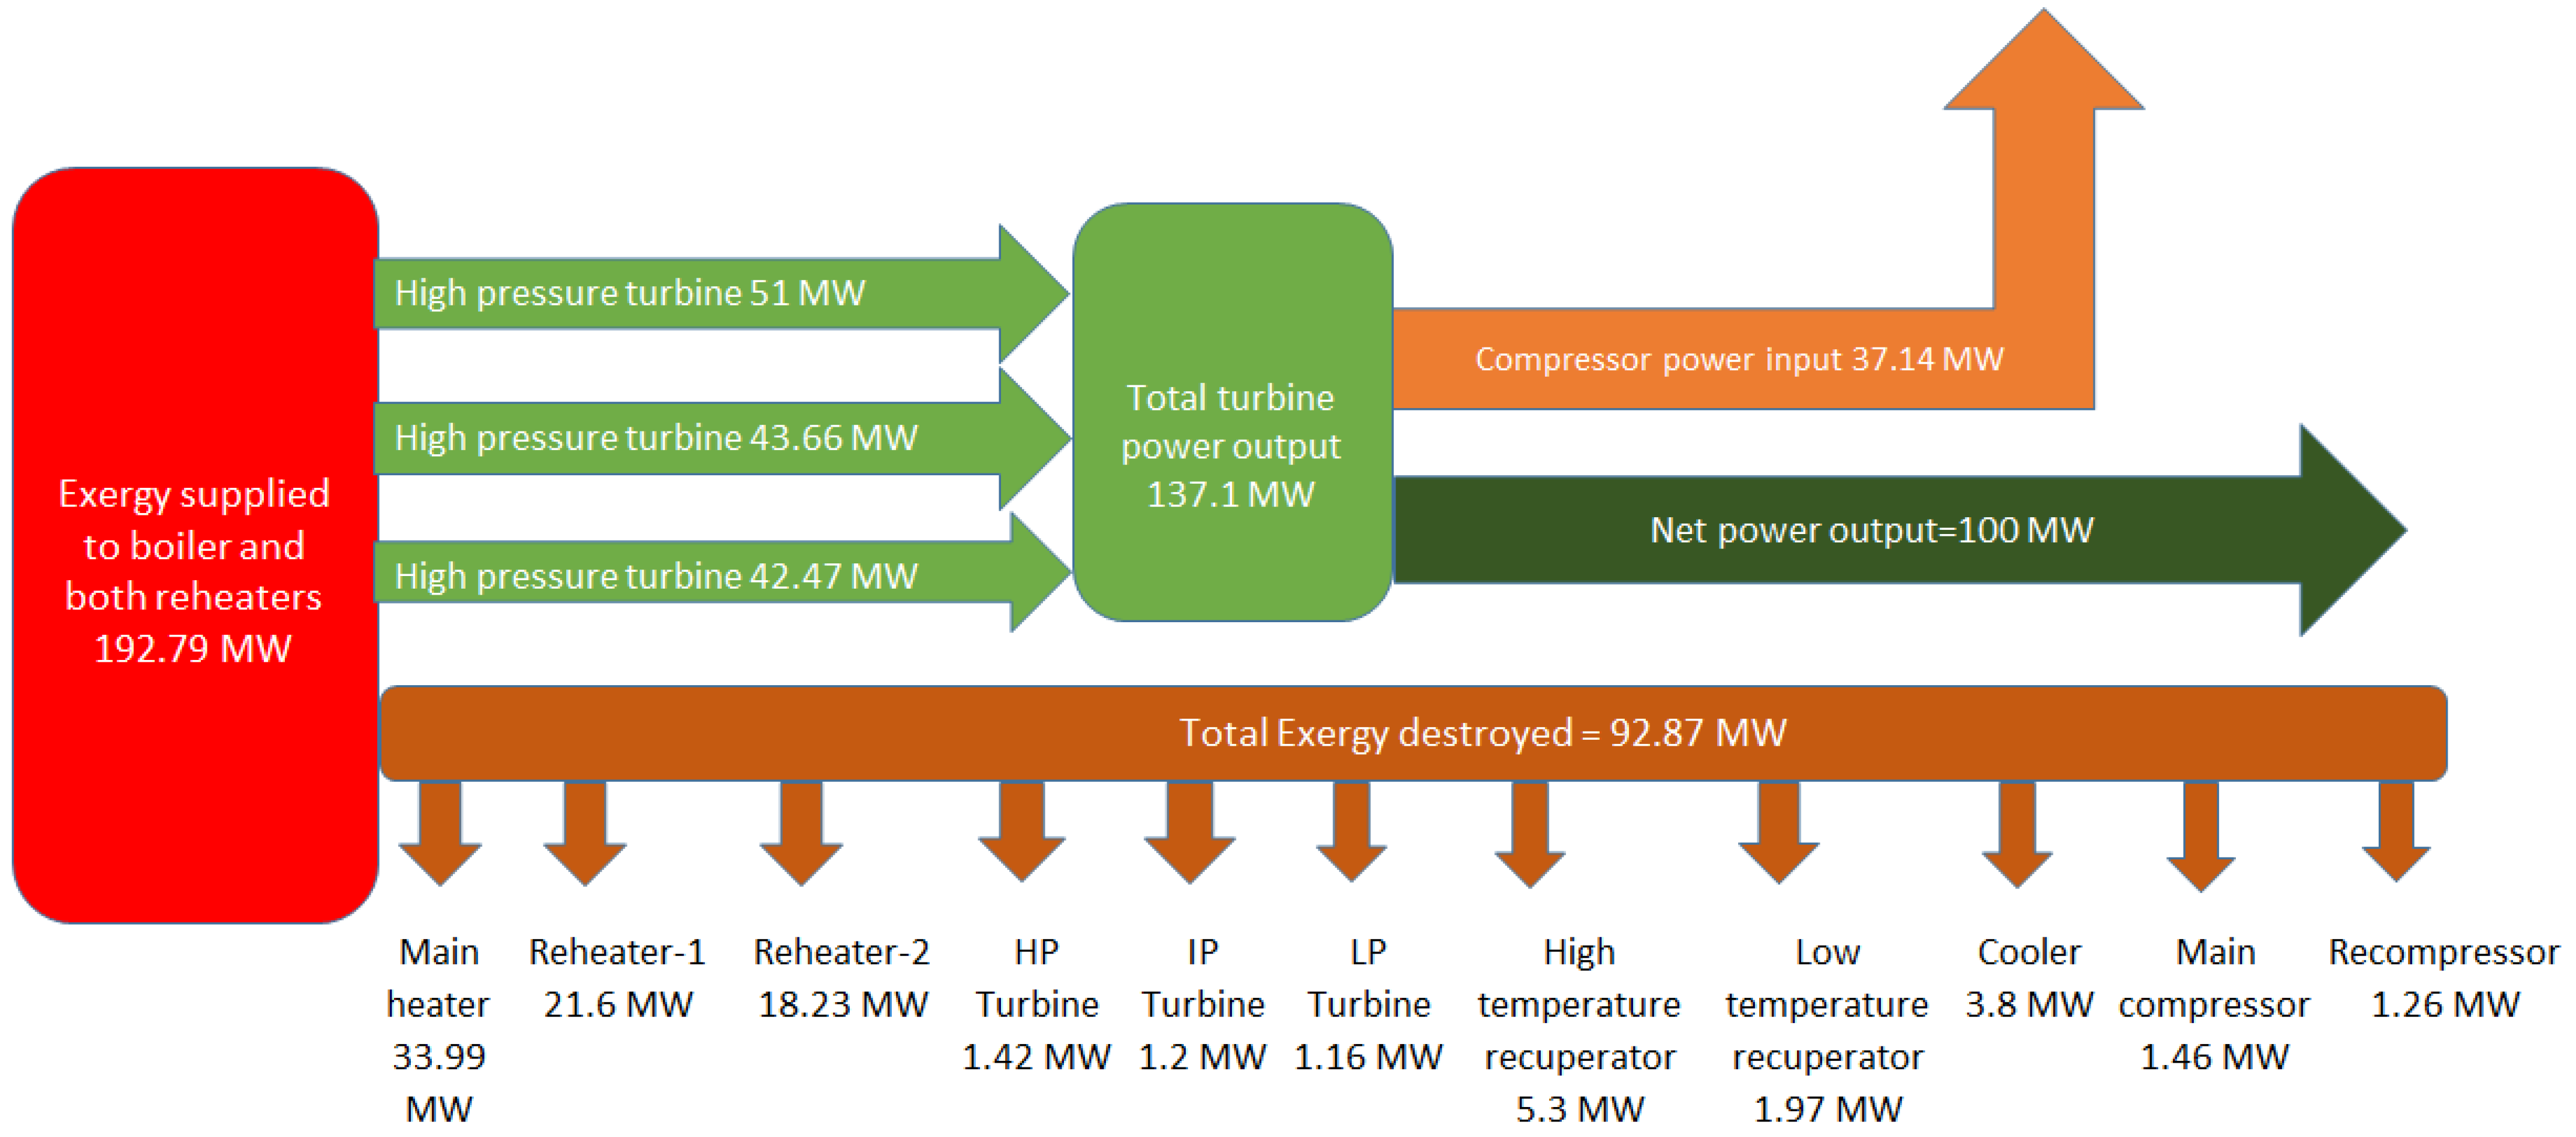
  • Identify the system components that contribute to high exergy destruction.

2. System Layout Description

The s-CO2 power plant system layout considered for the present study is a double reheat recompression cycle, as described by Chen et al. [
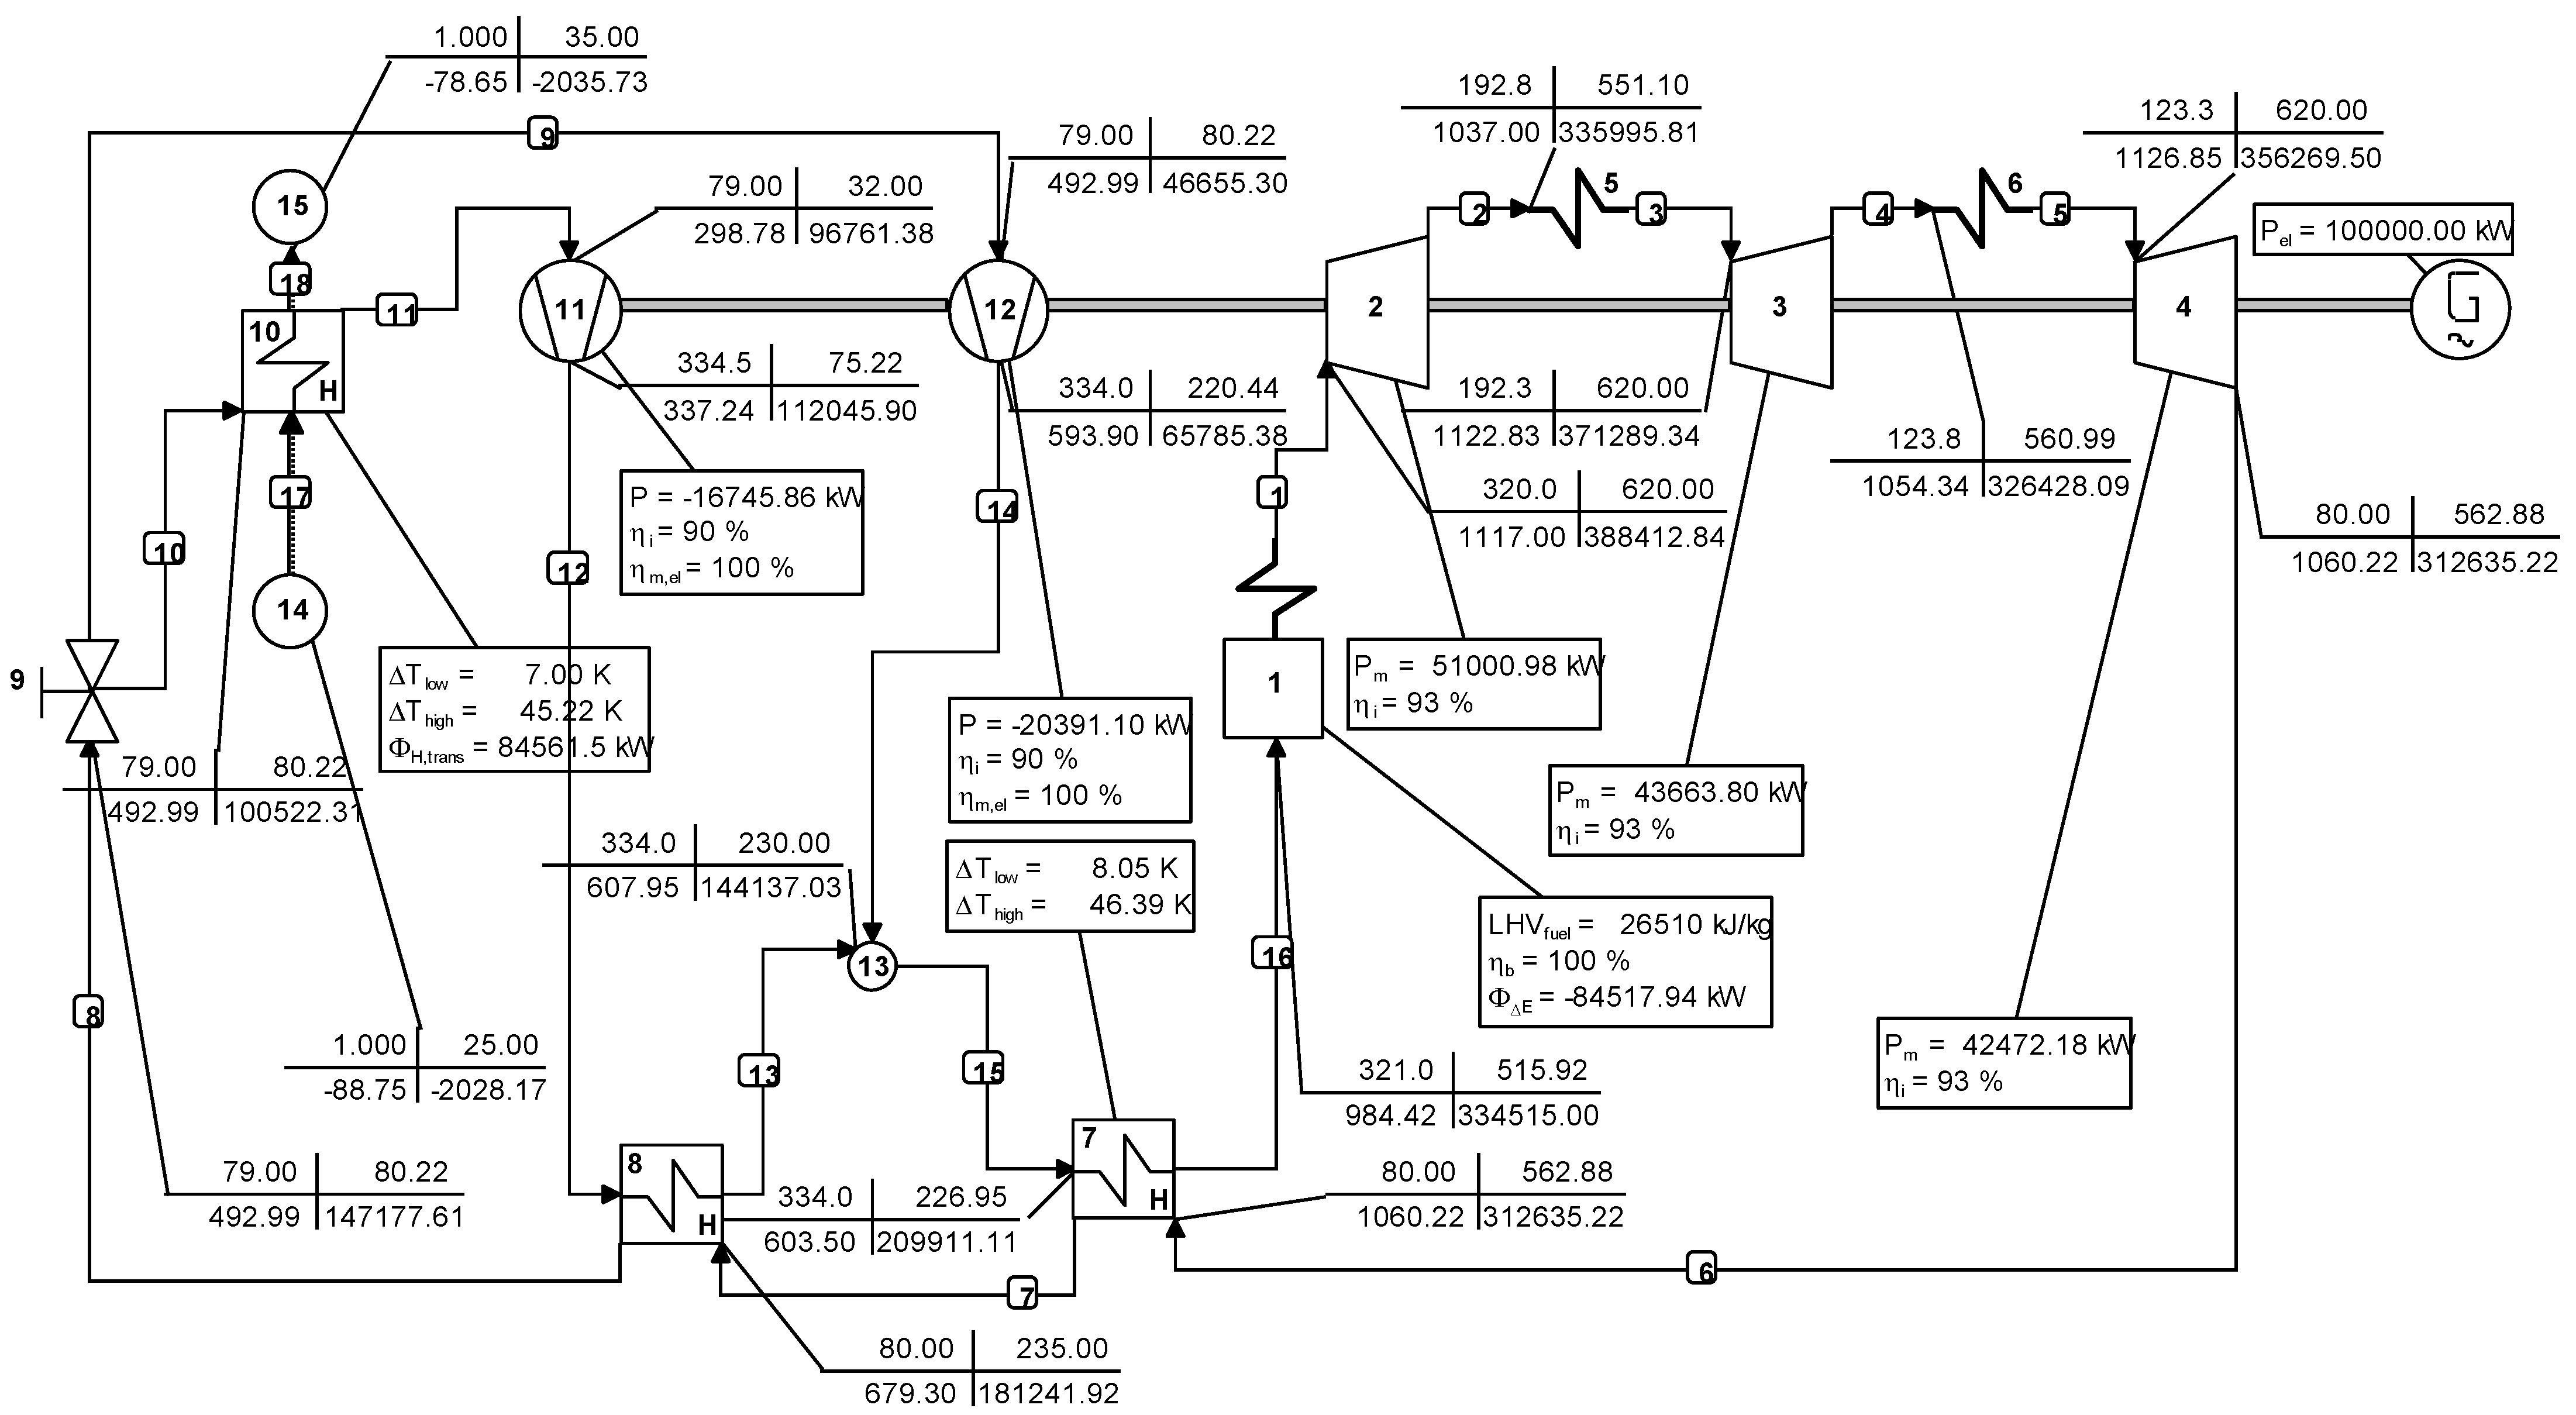
22]. The schematic of the layout is shown in Figure 1. Carbon dioxide is heated to the rated supercritical condition in the heater using the heat generated by coal firing. This s-CO2 expands in the high-pressure turbine, then enters the reheater-1 to undergo a rise in temperature, further expands in the intermediate-pressure turbine followed by a temperature rise in reheater-2 and, finally, expands in the low-pressure turbine. The low-pressure turbine exhaust is still at moderate pressure and temperature and its energy is partly recovered in the high and low-temperature recuperators in which heat is transferred from the low-pressure turbine exhaust to the CO2 emerging from the compressors. This is meant to save input heat energy in the form of fuel. After the low-temperature recuperator, the s-CO2 is split into two streams, one of which is cooled in the cooler using ambient air before it enters the main compressor while the other stream is directed into the re-compressor. The main compressor handles cooler s-CO2 and hence saves energy. After compression and heat exchange in the low-temperature recuperator, both the compressor exit streams are mixed in a direct contact heat exchanger named a ‘junction’ in Figure 1. Subsequently, heat exchange takes place in the high-temperature recuperator and the CO2 enters the heater to receive heat from coal combustion. In the figure, the coal flow stream and flue gas stream have not been shown for the sake of simplicity. Part of the power produced by the turbines is consumed by the compressors as indicated by the shaft connecting the turbines and compressors.
The corresponding Temperature vs. Entropy diagram is shown in Figure 2. Important processes have been marked in the T-S diagram.
The fuel properties and important operating parameters of the plant are shown in Table 2. Operating parameters are chosen in such a way that the CO2 remains in a super critical state through the entire operation.
Model Formulation:
The following assumptions were made in the model formulation and analysis:
  • All components operate at a steady state.
  • Changes in kinetic and potential energies are neglected for all fluid streams.
  • All components are perfectly insulated and there is no heat exchange with the surroundings.
  • The heat exchangers (recuperators and cooler) are the shell and tube type.
  • The dead state conditions are taken to be 1 bar and 30 °C.
The following equations are framed and solved for all the components in the steady flow system.
  Mass Balance : i n m ˙ = o u t m ˙
    Energy Balance : i n E ˙ = o u t E ˙
For multiple streams ,   Q ˙ W ˙ = o u t m ˙ h i n m ˙ h
For multiple streams , Q ˙ W ˙ = m ˙ [ h 2 h 1 ]
Energy Balance :   X ˙ i n X ˙ o u t Rate   of   net   exergy transfer   by   heat ,   work ,   and   mass X ˙ d e s t r o y e d = 0
X ˙ h e a t = ( 1 T 0 T ) Q ˙
X ˙ w o r k = W ˙ u s e f u l
X ˙ m a s s = m ˙ ψ
ψ = ( h h 0 ) T 0 ( s s 0 )
X ˙ d e s t r o y e d = T 0 S ˙ g e n
η I = Net   Power m ˙ fuel × LCV   of   fuel
η I I = Net   Power m ˙ fuel × Exergy   of   fuel
Fuel   exergy   =   1.04 × LCV   of   fuel
Recompression ratio ,   Φ = Main compressor flow rate Total flow rate
The chemical exergy factorized in Equation (13), 1.04, is estimated using the method proposed by Kotas [36]. The individual equations for mass, energy and exergy balance for each component are shown in Table 3. Heat and power terms shown in Table 2 are positive quantities. The subscripts in the equations correspond to the pipe numbers shown in Figure 1. The exergy destroyed in the equations corresponds to the respective component. Exergy associated with heat transfer is computed using Equation (6) while the flow exergy of each component is evaluated using Equation (9).
The equations shown in Table 3 are framed and solved by the flow-sheeting software Cycle-Tempo 5.1 based on the inputs given using the graphical user interface. The property values of carbon dioxide are computed using RefProp 10 add-in software.
The system shown in Figure 1 and the inputs shown in Table 3 are used to solve the system and the output is validated by comparing the present results with those of Chen et al. [22] after adjusting some inputs so as to make the model relevant to theirs. The results have been compared to validate the present model and are shown in Table 4.
The maximum error is found to be less than 4%. This could be due to the different software used by Chen et al. [22] and in the present work to compute fluid properties. Moreover, the convergence criteria of the two software could be different. Moreover, some commonly used parameters (such as the recompression ratio, chemical exergy factor) which are not provided by Chen et al. [22] have been assumed or indirectly estimated in the present work. Considering all these reasons, a maximum error of less than 4% is concluded to be reasonable and hence the present model is concluded to be satisfactory.

3. Results and Discussion

The results of mass and energy balance calculations are shown in the Figure 3 at full load (100 MWe) conditions. The compressors, turbines and generator are shown mounted on the same shaft indicating that part of the power generated in the turbines is consumed by the compressor while the rest is converted to electric energy in the generator. Due to the heat recovery processes, the amount of heat supplied in the main heater is lower and hence results in better efficiency. It can also be seen that the HP turbine, IP turbine and LP turbines produce 51 MW, 43.6 MW and 42.47 MW, respectively, while the main compressor and re-compressor consume 16.75 MW and 20.4 MW, respectively, resulting in a net power output of 100 MW. The exergy flow is shown in Figure 4. The total exergy supplied to the main heater and two re-heaters is 192.79 MW, out of which 100 MW is converted to net power output while 92.87 MW is destroyed in various components, with the major culprit being the main heater. This results in a 2nd law efficiency of 51.87%.

3.1. Optimization

Recompression ratio, ϕ, is an important operational parameter of choice that can decide the performance of the plant [24,37]. Hence, we studied the influence of it on the 1st law efficiency of the power plant. The recompression ratio has been varied from 0.1 to 0.75 at full load and the efficiency is estimated and plotted in Figure 5 for two different pressure ratios of the turbines. At this point, it should be mentioned that as per the design of Chen et al. [22], the high-pressure turbine pressure ratio is 1.66, the intermediate-pressure turbine pressure ratio is 1.56 and that of the low-pressure turbine is 1.54. For studying the influence of the recompression ratio in the present study, this has been kept the same for all turbines at 1.5 for the 1st and 2 for the second case.
Opposite trends can be noticed. At a pressure ratio of 1.5, there is a monotonous rise in efficiency while there is a drop for a pressure ratio of 2. Rogalev et al. [24] observed a maximum efficiency at a recompression ratio of around 0.35 for a fixed pressure ratio. Hence, it can be understood that there is a possibility of optimization with the recompression ratio and turbine pressure ratio as parameters. However, there are other parameters to be considered for optimization. The base case of full load has been considered for optimization with respect to the thermal efficiency. For this purpose, the present work has used the Optimization tool in Cycle-Tempo to maximize the efficiency of the plant. The turbine inlet parameters and recompression ratio have been chosen as the variables and 1st law efficiency has been chosen as the target parameter to be optimized. At the same time, 2nd law efficiency has also been evaluated with the dead state taken as 1 bar and 30 °C. The results of the optimization study have been tabulated in Table 5.
After optimization, few changes in the parameters have taken place. The inlet pressure of the high-pressure turbine remains the same while that of the intermediate and low-pressure turbine marginally increases to 206.9 and 130.5 bar from 192.3 and 123.3 bar, respectively. In the range of study, it can be seen that the 1st law efficiency reached a maximum of 61.7% while the 2nd law efficiency reached 59.3%. There was a very small rise in the 1st law efficiency when the recompression ratio was kept the same. However, when the recompression ratio was increased, there was a good amount of rise in efficiency. The maximum efficiencies were seen at a recompression ratio of 1 which means all the working fluid is compressed in the main compressor, thereby minimizing the power consumed. There is no change in the turbine inlet pressures at different recompression ratios. The pressure ratios of the optimized system turbines are 1.55, 1.58 and 1.63 for the high-pressure turbine, intermediate-pressure turbine and low-pressure turbine, respectively. The same for the base case are 1.66, 1.55 and 1.54, respectively. The optimization process is aimed at increasing the 1st law efficiency and hence the pressures and temperatures are altered by the software algorithm to provide heat addition at a higher possible temperature.

3.2. Part Load Performance

Part load performance is inevitable for all power plants and pressure control plays a crucial role in operating power plants at off-design conditions [38]. The part load calculations have been carried out using the part load option in Cycle-Tempo which is based on Traupel’s formula. The base case of full load operation at 100 MW has been used as the basis for the parameters. In this procedure, the data from the full load simulation are input into the part load simulations along with the heat exchanger surfaces, turbine operational parameters as well as compressor parameters. Since the available sizes of heat exchangers, turbine and compressor sizes do not change even at part load, the turbine inlet pressure, temperature, fluid flow rate and a few other parameters should be altered at part load. Table 6 shows the power produced in the turbines and that consumed in the compressors at various loads. The negative sign for compressors indicates power consumption. As per intuition, the power produced and consumed decreases at part load compared to full load. However, the powers shown in Table 5 at part load are not simply the fraction of it at full load. In plain terms, at 80% load, the high-pressure turbine’s output is not 80% of 51 MW but 81.7% of 51 MW. Likewise, at 60% load and 40% load, the power output is 64.3% and 45.7%, respectively.
The fluid mass flow rates are supposed to decrease at part loads. This is investigated and shown below. Table 7 compares the mass flow rates of the fluids (CO2 and air in pipes 17 and 18) in various pipelines at different loads. The pipe numbers can be referred to in Figure 1. It must be noted that the flow rates at different loads in pipes 1 to 8 are the same because these pipes carry the s-CO2 through the main heater, turbines, reheaters and recuperators before bifurcating at the cooler. These flows merge downstream in pipe 15. Intuitively, the flow rates should decrease to 80%, 60% and 40% of that at full load. However, the flow rate of CO2 has reduced to 86.1%, 72.4% and 57.7% of the full load for part load operation at 80%, 60% and 40%, respectively. This is because the pressures and temperatures at a few salient points have changed at part loads when compared to full loads. These have been shown in Table 8 and Table 9.
Some of the pressures at various locations in the power plant are also supposed to change at part loads. This has been investigated and compared in Table 8. These pressure changes would be brought about by pressure control methods such as sliding pressure control, etc. Unlike the mass flow rate, the pressures in the cycle keep reducing from pipe 1 to pipe 11 as the expansion takes place and before being compressed. This can also be observed in the part load operation. The general trend is that the pressures have decreased at part loads while they remained the same at a few points. This was observed by Adibhatla and Kaushik [38] in their part load performance study on a super-critical steam thermal power plant. They also noted that sliding pressure control is better than constant pressure control. The high-pressure turbine inlet pressure decreased to 86.6%, 73.9% and 60.7% of the full load pressure of 320 bar at 80%, 60% and 40% loads, respectively. At the exit of the high-pressure turbine, the pressures are 88.6%, 78.1% and 67.2% of the full load value of 192.8 bar at 80%, 60% and 40% loads, respectively. Pressure is an important parameter from an operation and safety viewpoint. Since the pressures at the part load did not increase, the design of the pressure vessels and pipelines for pressure can be based on the full load value without worrying about pressure spikes at part loads.
Temperatures at various locations also change at part loads and are compared in Table 9. Similar to the pressures, the temperatures drop as the cycle proceeds from pipe 1 to 11. The lowest temperature and pressure in the cycle are kept above the critical point of CO2. It can be seen that the turbine inlet temperatures have remained the same as that in the full load (620 °C) while the exit temperatures have increased. This is in contrast to the behavior of power, mass flow rate, and pressure, which reduced at part loads considered in the present study. This is to increase the temperature of heat addition in the re-heaters so as to keep the overall temperature of heat addition high and thereby operate at the best possible thermal efficiency at that particular part load. It can be observed that the exit temperature of the high-pressure turbine has increased by 0.6%, 1.4% and 2.6% for 80%, 60% and 40% loads, respectively. This implies that the temperatures at the inlet and outlet of the high-pressure turbine are practically remaining constant. A similar observation can be made for the remaining salient points.
From the comparison of mass flow rates, pressures and temperatures, it can be concluded that there is considerable change in the first two parameters while there is only a minute change in the last one when compared to the full load values.
Figure 6 shows the percentage exergy loss in various components compared to the total exergy loss. Most of the exergy is lost in the main and re-heaters and this can be attributed to the heat transfer by finite temperature difference. In the study carried out by Adibhatla and Kaushik [38], it was found that the boiler experiences the highest amount of exergy destruction followed by the turbines, which is similar to what can be noticed in Figure 6. Moreover, these components operate at high temperatures which contributes more to the lost exergy. The same can be observed to a certain extent in the high-temperature recuperator and cooler. Even though the temperature difference between the hot and cold fluids in the cooler is high, the exergy lost is low due to both fluids being at a relatively low temperature.
Figure 7 shows the value diagrams of the heat-exchanging equipment in the plant, namely, the high-temperature recuperator (HTR), low-temperature recuperator (LTR) and Cooler. The value diagram gives an understanding of the amount of useful work that can be produced if a heat engine is operated between the ambient and the heat exchanger. This can be seen on the y-axis showing the Carnot efficiency and also as the shaded region between the two curves. This value is greatest for the HTR and least for the LTR. The cooler also has some exergy lost on par with the two recuperators because of the high-temperature difference between the two fluids at the hot end. This is difficult to avoid as the ambient air is used for cooling the CO2 in the cooler. However, the exergy lost in the cooler is lower because it operates in the low-temperature region compared to the recuperators. To decrease this exergy loss, the temperature of carbon dioxide in the cooler needs to be reduced further, which implies greater heat transfer in the HTR and LTR, which in turn can increase the exergy lost in them. So, a balance needs to be struck between the exergy lost in the cooler and that in the recuperators.
Specific work is an indicator of the amount of working fluid necessary to generate a given quantity of work. Higher magnitude indicates better utilization of the working fluid by the choice of its operational parameters such as pressure and temperature [26]. Figure 8 shows the specific work as a function of the recompression ratio at different loads. As anticipated, the full-load plant has the highest amount of specific work while the 40% load has the lowest amount. The specific work also increases as the recompression ratio increases, which is in agreement with the results of the optimization study. This is because at a low recompression ratio between 0.1 and 0.2, 80–90% of the flow takes place in the re-compressor, which operates at higher temperatures, resulting in greater compression work and hence lower specific work. Moreover, the specific work at 80% load is almost equal to that at full load, especially at a low recompression ratio. An interesting observation for the recompression ratio between 0.1 and 0.2 is that at full load the specific work is slightly lower than that at 80% load. This could be due to the magnitude of differences in the mass flow rates, pressures and temperatures in the main and re-compressor at 100% and 80% loads. At the full load and 80% load, the mass flow rates are 435.4 and 374.76 kg/s, the main and re-compressor exit pressures are 334.5/280.8 bar and 334/278 bars while the respective temperatures are 75.22/68.3 and 220.44/192.93 °C, respectively, for the main and re-compressors. It can be seen that the mass flow rates and pressures have changed greatly during part load operation while the temperatures changed only by a small fraction. This along with the fact that about 80–90% of the flow takes place in the re-compressor for the recompression ratio 0.1–0.2 could have resulted in a slight reduction in specific work at full load. At lower loads, the drastic drop in the mass flow rate could have resulted in consistent behavior in the entire range of the recompression ratio considered.
The 1st law and 2nd law efficiencies at various loads are compared in Figure 9. The 2nd law efficiency is understandably always lower than the 1st law efficiency. In addition, both the efficiencies remain almost the same at full and 80% loads while there is a drastic drop at 60% and 40% loads. A similar observation was made by Yang et al. [27] during their study on the 1st law-based performance of an s-CO2 power plant at full and part load even though their system is not a double reheat recompression one like in the present study. This drop in efficiencies is due to the off-design operation where the components are designed for full load. This results in unnecessary losses in the fluid flow as well as increased irreversibilities. Hence, it is not advisable to operate this power plant below 60% load. Moreover, exergo-economic studies need to be conducted at part loads to see if it is worthwhile to operate even at 80% or not.
Sanchez et al. [25] reported about 34% 1st law efficiency at full load and about 32% at 40% load. Fan et al. [26] reported a thermal efficiency of 35 to 38% from 35% load to 100% load, respectively, under both an inventory control strategy as well as a turbine throttling strategy. In comparison to the present study, their efficiencies have a drop of 3 percentage points while in the present study the drop is by 4 percentage points. This could be due to the combined cycles of Sanchez et al. [25] and Fan et al. [26], which evened out the variation to a greater extent. This is supported by the results reported by Yang et al. [27] where their thermal efficiencies varied between 37% and 43% for a load range of 40% to 100%. These efficiencies are lower than those reported in the present work. This could be due to the simple single reheat cycle they implemented while the present work implemented a double reheat recompression system. Wang et al. [33] studied the influence of different control strategies on thermal efficiency and found that inventory control and coupled control are the best choices for part load operation. The present work implemented the inventory control method for part load operation. They also found the efficiency to be ranging between 22% and 30% for a load ranging between 40% and 100% and the lower efficiencies can be attributed to the simplicity of the system. Gini et al. [35], who considered a simple recuperated s-CO2 system, also showed that the thermal efficiency dropped to 80% of the full load value at 50% load. From this comparison with the studies reported in the literature, it can be understood that a combined or hybrid system involving s-CO2 yields more or less constant thermal efficiency at loads even down to 40% while simple systems perform poorly at low loads.

4. Conclusions

In the present study, the system design of a 100 MWe double reheat recompression s-CO2 power plant was carried out, various operational parameters were estimated and the system was optimized at full load. Part load performance at 80% down to 40% was evaluated. The recompression ratio was found to be a crucial parameter that influences the performance both at full and part loads. Based on the 2nd law analysis, the components that are responsible for high exergy destruction were also identified. Key observations are objectively listed below:
  • Recompression ratio and turbine inlet pressures as well as pressure ratios were identified as crucial for improving the performance of the power plant. The power plant at full load was optimized and an estimated 1st law efficiency of 61.7% and 2nd law efficiency of 59.3% were attained.
  • The specific work was highest (~160 kJ/kg) at full load and almost the same at 80% load, especially at low recompression ratios. It dropped rapidly at lower loads, indicating that the recompression ratio should be kept high at lower loads.
  • The power plant operated almost equally well at full load and 80% load while a drastic drop in efficiency was noticed at 60% and 40% loads compared to those at 100% load.
  • Operational pressures decreased at part loads while few temperatures, especially at the turbine exit, increased marginally. The mass flow rate reduced at part load when compared to full load.
  • Most of the exergy is destroyed in the main heater (>35%), re-heater (>20%), followed by the high-temperature recuperator and cooler.

Author Contributions

Conceptualization, S.M. and F.M.; methodology, J.D. and S.R.; software, S.M., T.M.Y.K., R.U.B. and N.A.; validation, S.M., T.M.Y.K., N.A. and J.D.; formal analysis, B.K.V.T., N.A. and S.M.; investigation, S.M., F.M. and J.D.; data curation, S.M.; writing—original draft, S.M., F.M. and J.D. All authors have read and agreed to the published version of the manuscript.

Funding

This work was funded by King Khalid University under grant number R.G.P. 2/118/44.

Institutional Review Board Statement

Not Applicable.

Informed Consent Statement

No humans were involved in the research.

Data Availability Statement

Data not available.

Acknowledgments

The authors extend their appreciation to the Deanship of Scientific Research at King Khalid University for funding this work through research groups program under grant number R.G.P. 2/118/44.

Conflicts of Interest

The authors declare no conflict of interest.

Nomenclature

SymbolName
E ˙ Rate of energy transfer, kW
hSpecific enthalpy, kJ/kg
h0Dead state specific enthalpy, kJ/kg
m ˙ Mass flow rate, kg/s
Q ˙ Rate of heat transfer, kW
SSpecific entropy, kJ/kg-K
S0Dead state specific entropy, kJ/kg-K
SgenEntropy generated, kJ/K
TAbsolute temperature, K
T0Dead state temperature, K
W ˙ Rate of work, kW
X ˙ Rate of Exergy Transfer, kW
X ˙ d e s Exergy destroyed, kW
ϕRecompression ratio, (-)

References

  1. Furlan, C.; Mortarino, C. Forecasting the impact of renewable energies in competition with non-renewable sources. Renew. Sustain. Energy Rev. 2018, 81, 1879–1886. [Google Scholar] [CrossRef]
  2. Javidkia, F.; Hashemi-Tilehnoee, M.; Zabihi, V. A comparison between fossil and nuclear power plants pollutions and their environmental effects. J. Energy Power Eng. 2011, 5, 811–820. [Google Scholar]
  3. Ryzhkov, A.F.; Bogatova, T.F.; Maslennikov, G.E.; Osipov, P.V.; Nizov, V.A. Creation of energy-efficient and environmentally friendly energy sources on fossil fuels to address global climate issues. J. Physics: Conf. Ser. 2020, 1677, 012115. [Google Scholar] [CrossRef]
  4. Sreekanth, M.; Kumar, R.R.; Kolar, A.K.; Leckner, B. Estimation of wood char size at the end of devolatilization in a bubbling fluidized bed combustor. Fuel 2008, 87, 3393–3402. [Google Scholar] [CrossRef]
  5. Yin, C.; Yan, J. Oxy-fuel combustion of pulverized fuels: Combustion fundamentals and modeling. Appl. Energy 2016, 162, 742–762. [Google Scholar] [CrossRef]
  6. Pragadeesh, K.S.; Regupathi, I.; Sudhakar, D.R. Insitu gasification—Chemical looping combustion of large coal and biomass particles: Char conversion and comminution. Fuel 2021, 292, 120201. [Google Scholar] [CrossRef]
  7. Yang, M.; Duan, L.; Tong, Y. Design and Performance Analysis of New Ultra-Supercritical Double Reheat Coal-Fired Power Generation Systems. Energies 2021, 14, 238. [Google Scholar] [CrossRef]
  8. Osman, A.I.; Hefny, M.; Maksoud, M.I.A.A.; Elgarahy, A.M.; Rooney, D.W. Recent advances in carbon capture storage and utilisation technologies: A review. Environ. Chem. Lett. 2021, 19, 797–849. [Google Scholar] [CrossRef]
  9. Pipitone, G.; Bolland, O. Power generation with CO2 capture: Technology for CO2 purification. Int. J. Greenh. Gas Control. 2009, 3, 528–534. [Google Scholar] [CrossRef]
  10. Available online: https://www.epa.gov/energy/greenhouse-gases-equivalencies-calculator-calculations-and-references#:~:text=Home%20electricity%20use&text=The%20national%20average%20carbon%20dioxide,EIA%202020b%3B%20EPA%202021 (accessed on 9 February 2023).
  11. Liao, G.; Liu, L.; Jiaqiang, E.; Zhang, F.; Chen, J.; Deng, Y.; Zhu, H. Effects of technical progress on performance and application of supercritical carbon dioxide power cycle: A review. Energy Convers. Manag. 2019, 199, 111986. [Google Scholar] [CrossRef]
  12. Ahn, Y.; Bae, S.J.; Kim, M.; Cho, S.K.; Baik, S.; Lee, J.I.; Cha, J.E. Review of supercritical CO2 power cycle technology and current status of research and development. Nucl. Eng. Technol. 2015, 47, 647–661. [Google Scholar] [CrossRef]
  13. Angelino, G. Carbon Dioxide Condensation Cycles for Power Production. J. Eng. Power 1968, 90, 287–295. [Google Scholar] [CrossRef]
  14. Feher, E.G. The supercritical thermodynamic power cycle. Energy Convers. 1968, 8, 85–90. [Google Scholar] [CrossRef]
  15. Marion, J. Mwe Supercritical Carbon Dioxide (sCO2) Pilot Power Plant. December. Available online: https://www.gti.energy/wp-content/uploads/2019/01/STEP-Project-Detailed-Description-Dec2018.pdf (accessed on 9 February 2023).
  16. Sarkar, J. Review and future trends of supercritical CO2 Rankine cycle for low-grade heat conversion. Renew. Sustain. Energy Rev. 2015, 48, 434–451. [Google Scholar] [CrossRef]
  17. Crespi, F.; Gavagnin, G.; Sánchez, D.; Martínez, G.S. Supercritical carbon dioxide cycles for power generation: A review. Appl. Energy 2017, 195, 152–183. [Google Scholar] [CrossRef]
  18. Yin, J.; Zheng, Q.; Peng, Z.; Zhang, X. Review of supercritical CO2 power cycles integrated with CSP. Int. J. Energy Res. 2019, 44, 1337–1369. [Google Scholar] [CrossRef]
  19. White, M.T.; Bianchi, G.; Chai, L.; Tassou, S.A.; Sayma, A.I. Review of supercritical CO2 technologies and systems for power generation. Appl. Therm. Eng. 2021, 185, 116447. [Google Scholar] [CrossRef]
  20. Yu, A.; Su, W.; Lin, X.; Zhou, N. Recent trends of supercritical CO2 Brayton cycle: Bibliometric analysis and research review. Nucl. Eng. Technol. 2020, 53, 699–714. [Google Scholar] [CrossRef]
  21. Sun, E.; Hu, H.; Li, H.; Liu, C.; Xu, J. How to Construct a Combined S-CO2 Cycle for Coal Fired Power Plant? Entropy 2018, 21, 19. [Google Scholar] [CrossRef]
  22. Chen, Z.; Wang, Y.; Zhang, X. Energy and exergy analyses of S–CO2 coal-fired power plant with reheating processes. Energy 2020, 211, 118651. [Google Scholar] [CrossRef]
  23. Bai, W.; Li, H.; Zhang, L.; Zhang, Y.; Yang, Y.; Zhang, C.; Yao, M. Energy and exergy analyses of an improved recompression supercritical CO2 cycle for coal-fired power plant. Energy 2021, 222, 119976. [Google Scholar] [CrossRef]
  24. Rogalev, N.; Rogalev, A.; Kindra, V.; Komarov, I.; Zlyvko, O. Structural and Parametric Optimization of S–CO2 Nuclear Power Plants. Entropy 2021, 23, 1079. [Google Scholar] [CrossRef] [PubMed]
  25. Sánchez, D.; Chacartegui, R.; de Escalona, J.M.; Muñoz, A.; Sánchez, T. Performance analysis of a MCFC & supercritical carbon dioxide hybrid cycle under part load operation. Int. J. Hydrogen Energy 2011, 36, 10327–10336. [Google Scholar]
  26. Fan, G.; Li, H.; Du, Y.; Chen, K.; Zheng, S.; Dai, Y. Preliminary design and part-load performance analysis of a recompression supercritical carbon dioxide cycle combined with a transcritical carbon dioxide cycle. Energy Convers. Manag. 2020, 212, 112758. [Google Scholar] [CrossRef]
  27. Yang, J.; Yang, Z.; Duan, Y. Part-load performance analysis and comparison of supercritical CO2 Brayton cycles. Energy Convers. Manag. 2020, 214, 112832. [Google Scholar] [CrossRef]
  28. Tong, Y.; Duan, L.; Pang, L. Off-design performance analysis of a new 300 MW supercritical CO2 coal-fired boiler. Energy 2020, 216, 119306. [Google Scholar] [CrossRef]
  29. Lee, S.; Yaganegi, G.; Mee, D.J.; Guan, Z.; Gurgenci, H. Part-load performance prediction model for supercritical CO2 radial inflow turbines. Energy Convers. Manag. 2021, 235, 113964. [Google Scholar] [CrossRef]
  30. Alfani, D.; Binotti, M.; Macchi, E.; Silva, P.; Astolfi, M. sCO2 power plants for waste heat recovery: Design optimization and part-load operation strategies. Appl. Therm. Eng. 2021, 195, 117013. [Google Scholar] [CrossRef]
  31. Fan, G.; Dai, Y. Thermo-economic optimization and part-load analysis of the combined supercritical CO2 and Kalina cycle. Energy Convers. Manag. 2021, 245, 114572. [Google Scholar] [CrossRef]
  32. Fan, G.; Du, Y.; Li, H.; Dai, Y. Off-design behavior investigation of the combined supercritical CO2 and organic Rankine cycle. Energy 2021, 237, 121529. [Google Scholar] [CrossRef]
  33. Wang, R.; Wang, X.; Shu, G.; Tian, H.; Cai, J.; Bian, X.; Li, X.; Qin, Z.; Shi, L. Comparison of different load-following control strategies of a sCO2 Brayton cycle under full load range. Energy 2022, 246, 123378. [Google Scholar] [CrossRef]
  34. Xingyan, B.; Wang, X.; Wang, R.; Cai, J.; Tian, H.; Shu, G. Optimal selection of supercritical CO2 Brayton cycle layouts based on part-load performance. Energy 2022, 256, 124691. [Google Scholar] [CrossRef]
  35. Gini, L.; Maccarini, S.; Traverso, A.; Barberis, S.; Guedez, R.; Pesatori, E.; Bisio, V. A prototype recuperated supercritical CO2 cycle: Part-load and dynamic assessment. Appl. Therm. Eng. 2023, 225, 120152. [Google Scholar] [CrossRef]
  36. Kotas, T.J. The Exergy Method of Thermal Plant Analysis; Krieger Publishing, Co.: Malabar, FL, USA, 1995. [Google Scholar]
  37. Sathish, S.; Kumar, P.; Nassar, A. Analysis of a 10 MW recompression supercritical carbon dioxide cycle for tropical climatic conditions. Appl. Therm. Eng. 2020, 186, 116499. [Google Scholar] [CrossRef]
  38. Adibhatla, S.; Kaushik, S. Energy and exergy analysis of a super critical thermal power plant at various load conditions under constant and pure sliding pressure operation. Appl. Therm. Eng. 2014, 73, 51–65. [Google Scholar] [CrossRef]
Figure 1. Schematic layout of the double reheat recompression s-CO2 power generation system.
Sustainability 15 14677 g001
Figure 2. Temperature–Entropy diagram of the double reheat recompression s-CO2 plant at full load.
Sustainability 15 14677 g002
Figure 3. Values of pressure, temperature, enthalpy and mass flow rates at various locations in the double reheat 100 MWe s-CO2 power plant. The major legend is to be read as shown here Sustainability 15 14677 i001.
Sustainability 15 14677 g003
Figure 4. Exergy flow in the full load (100 MWe) plant.
Sustainability 15 14677 g004
Figure 5. Influence of recompression ratio on 1st law efficiency.
Sustainability 15 14677 g005
Figure 6. Percentage of exergy lost in various components.
Sustainability 15 14677 g006
Figure 7. Value diagram of (a) HT recuperator, (b) LT recuperator and (c) Cooler.
Sustainability 15 14677 g007
Figure 8. Specific work as a function of recompression ratio at various loads.
Sustainability 15 14677 g008
Figure 9. Comparison of 1st and 2nd law efficiencies at various loads.
Sustainability 15 14677 g009
Table 1. Part load or off-design studies reported in the literature.
S. NoReferenceSource of EnergyType of SystemObjective
1Sanchez et al. [25]Natural gasMCFC and s-CO2 hybrid system1st law analysis, inventory control strategy
2Fan et al. [26]Nuclear energyCombined super critical and trans-critical1st and 2nd law analysis, identify a control strategy
3Yang et al. [27]Solar energySimple recuperative, reheat, recompression and intercooling cycles studied separately1st law analysis, performance comparison between different cycles
4Tong et al. [28]CoalSingle reheat recompressionFocusses on boiler furnace part load performance
5Lee et al. [29]--Focusses on turbine part load performance
6Alfani et al. [30]Waste heatSimple recuperative, simple recuperative cycle with bypass and turbine split flow configurations1st law and Techno-economic analysis and optimization
7Fan and Dai [31] Nuclear energyCombined s-CO2 and Kalina cycle1st and 2nd law analysis, Thermo-economic optimization and evaluate different control strategies
8Fan et al. [32]Nuclear energyCombined s-CO2 with Organic Rankine Cycle1st law and economic analysis
9Wang et al. [33]Fuel oilRecompression s-CO2 Brayton cycleComparison of control strategies
10Xingyan et al. [34]-Simple recuperated, recompression, single reheat, intercooling cycles considered separatelyPerformance evaluation based on layout and control strategies
11Gini et al. [35]Molten saltSimple recuperated s-CO2 cycleControl strategy development
Present workCoalDouble reheat recompressionSystem design, 1st and 2nd law analysis and parameter optimization for better efficiency
Table 2. Fuel and operational parameters used in the simulation at full load [22].
ParameterValue
Lower heating value of coal26.51 MJ/kg
Exergy of coal27.57 MJ/kg
Pressure/Temperature of CO2 at HP turbine inlet320 bar/620 °C
Temperature of CO2 at IP and LP turbine inlet620 °C
Pressure of CO2 at IP turbine inlet192.3 bar
Pressure of CO2 at LP turbine inlet123.3 bar
Pinch points in heat exchangers5 °C
Turbine isentropic efficiency93%
Compressor isentropic efficiency90%
Pressure drop in heater1 bar
Pressure drop in recuperators0.5 bar
Recompression ratio0.683
Table 3. Equations of mass, energy and exergy balance of individual components.
ComponentMass BalanceEnergy BalanceExergy Balance
Heater m ˙ 16 = m ˙ 1 Q ˙ = m ˙ 1 ( h 1 h 16 ) X ˙ 16 + X ˙ Q X ˙ 1 X ˙ d e s = 0
High Pressure Turbine m ˙ 1 = m ˙ 2 W ˙ = m ˙ 1 ( h 1 h 2 ) X ˙ 1 W ˙ X ˙ 2 X ˙ d e s = 0
Reheater-1 m ˙ 2 = m ˙ 3 Q ˙ = m ˙ 2 ( h 3 h 2 ) X ˙ 2 + X ˙ Q X ˙ 3 X ˙ d e s = 0
Intermediate Pressure Turbine m ˙ 3 = m ˙ 4 W ˙ = m ˙ 3 ( h 3 h 4 ) X ˙ 3 W ˙ X ˙ 4 X ˙ d e s = 0
Reheater-2 m ˙ 4 = m ˙ 5 Q ˙ = m ˙ 4 ( h 5 h 4 ) X ˙ 4 + X ˙ Q X ˙ 5 X ˙ d e s = 0
Low Pressure Turbine m ˙ 5 = m ˙ 6 W ˙ = m ˙ 5 ( h 5 h 6 ) X ˙ 5 W ˙ X ˙ 6 X ˙ d e s = 0
High Temperature Recuperator m ˙ 6 = m ˙ 7 m ˙ 15 = m ˙ 16 m ˙ 6 ( h 6 h 7 ) = m ˙ 15 ( h 16 h 15 ) X ˙ 6 + X ˙ 15 X ˙ 7 X ˙ 16 X ˙ d e s = 0
Low Temperature Recuperator m ˙ 7 = m ˙ 8 m ˙ 12 = m ˙ 13 m ˙ 7 ( h 7 h 8 ) = m ˙ 12 ( h 13 h 12 ) X ˙ 7 + X ˙ 12 X ˙ 8 X ˙ 13 X ˙ d e s = 0
Flow Control valve m ˙ 8 = m ˙ 9 + m ˙ 10 m ˙ 8 h 8 = m ˙ 9 h 9 + m ˙ 10 h 10 X ˙ 8 X ˙ 9 X ˙ 10 X ˙ d e s = 0
Cooler m ˙ 10 = m ˙ 11 m ˙ 17 = m ˙ 18 m ˙ 10 ( h 10 h 11 ) = m ˙ 17 ( h 18 h 17 ) X ˙ 10 + X ˙ 17 X ˙ 11 X ˙ 18 X ˙ d e s = 0
Main Compressor m ˙ 11 = m ˙ 12 W ˙ = m ˙ 11 ( h 12 h 11 ) X ˙ 11 + W ˙ X ˙ 12 X ˙ d e s = 0
Re-Compressor m ˙ 9 = m ˙ 14 W ˙ = m ˙ 9 ( h 14 h 9 ) X ˙ 9 + W ˙ X ˙ 14 X ˙ d e s = 0
Junction m ˙ 13 + m ˙ 14 = m ˙ 15 m ˙ 13 h 13 + m ˙ 14 h 14 = m ˙ 15 h 15 X ˙ 13 + X ˙ 14 X ˙ 15 X ˙ d e s = 0
Table 4. Model validation by comparing with the results of Chen et al. [22].
Temperature, °CPressure, barMass Flow Rate, kg/s
S. No.Chen et al. [22]This Work% ErrorChen et al. [22]This work% ErrorChen et al. [22]This Work% Error
16206200320320039.56540.9823.58
2550.92550.760.03192.3192.3039.56540.9823.58
36206200192.3192.3039.56540.9823.58
4560.73560.460.05123.3123.3039.56540.9823.58
56206200123.3123.3039.56540.9823.58
6561.9562.880.1779801.2739.56540.9823.58
723523507979.50.6339.56540.9823.58
886.7386.7307979039.56540.9823.58
986.7386.7307979027.02327.9913.58
1032.6532.440.647979027.02327.9913.58
1180.8977.73.94334.5334.5027.02327.9913.58
12230225.421.99334334027.02327.9913.58
13229.7229.570.06334334012.54212.9913.58
14515.63516.130.1333.5333.5039.56540.9823.58
15543.63545.50.341105.9656.0110.77
16506.7512.721.191105.5345.5320.04
Table 5. Design and optimized parameters at different recompression ratios at full load.
DesignOptimized at Different Recompression Ratio
Recompression ratio, φ0.6830.6830.750.80.91
High pressure turbine inlet pressure, bar320320320320320320
Intermediate pressure turbine inlet pressure, bar192.3206.9206.9206.9206.9206.9
Low pressure turbine inlet pressure, bar123.3130.5130.5130.5130.5130.5
1st law efficiency, ηI, %53.9253.9455.5756.7759.261.7
2nd law efficiency, ηII, %51.8551.8753.4254.5956.9459.3
Table 6. Power production/consumption details at various loads.
Net Power (Turbine/Compressor)Full Load,
100 MW
80% Load,
80 MW
60% Load,
60 MW
40% Load,
40 MW
High Pressure Turbine5141.732.823.34
Intermediate Pressure Turbine43.634.125.216.2
Low Pressure Turbine42.4729.919.6610.98
Main Compressor−16.75−11.6−7.92−4.74
Re-compressor−20.4−14.17−9.7−5.8
Table 7. Comparison of fluid mass flow rates (in kg/s) at full and part loads in different pipelines (refer to Figure 1).
Pipe100 MW80 MW60 MW40 MW
1637.5548.69461.9367.97
2637.5548.69461.9367.97
3637.5548.69461.9367.97
4637.5548.69461.9367.97
5637.5548.69461.9367.97
6637.5548.69461.9367.97
7637.5548.69461.9367.97
8637.5548.69461.9367.97
9202.1173.94146.4116.65
10435.4374.76315.48251.33
11435.4374.76315.48251.33
12435.4374.76315.48251.33
13435.4374.76315.48251.33
14202.1173.94146.4116.65
15637.5548.69461.9367.97
16637.5548.69461.9367.97
178370.56836.3654814093.88
188370.56836.3654814093.88
Table 8. Comparison of fluid pressures (in bar) at full and part loads in different pipelines (refer to Figure 1).
Pipe100 MW80 MW60 MW40 MW
1320277.3236.7194.3
2192.8170.9150.3129.4
3192.3170.4149.8128.9
4123.8114.2105.697.27
5123.3113.7105.196.77
680808080
780808080
879797979
979797979
1079797979
1179797979
12334.5280.8240.2197.8
13332.5278.8238.2195.8
14334278.8238.2195.8
15334278.8238.2195.8
16333.5278.3237.7195.3
171111
181111
Table 9. Comparison of temperatures (in °C) at full and part loads in different pipelines (refer to Figure 1).
Pipe100 MW80 MW60 MW40 MW
1620620620620
2551.1554.4558.75565.4
3620620620620
4560.99566.53573.26582.33
5620620620620
6562.88573.39583.71594.62
7235235235235
880.2273.7368.3262.03
980.2273.7368.3262.03
1080.2273.7368.3262.03
1132323232
1275.2268.7363.3257.03
13230230230230
14220.44192.93169.95142.82
15227.08217.93210.03200.17
16516.64522.43529.32536.52
1725252525
1835353535
Disclaimer/Publisher’s Note: The statements, opinions and data contained in all publications are solely those of the individual author(s) and contributor(s) and not of MDPI and/or the editor(s). MDPI and/or the editor(s) disclaim responsibility for any injury to people or property resulting from any ideas, methods, instructions or products referred to in the content.

