Article

Application of HSMAAOA Algorithm in Flood Control Optimal Operation of Reservoir Groups

1
School of Water Resources, North China University of Water Resources and Electric Power, Zhengzhou 450011, China
2
Research Center on Flood and Drought Disaster Reduction, China Institute of Water Resources and Hydropower Research, Beijing 100038, China
*
Author to whom correspondence should be addressed.
Sustainability 2023, 15(2), 933; https://doi.org/10.3390/su15020933
Submission received: 11 November 2022 / Revised: 8 December 2022 / Accepted: 29 December 2022 / Published: 4 January 2023

Abstract

:
The joint flood control operation of reservoir groups is a complex engineering problem with a large number of constraints and interdependent decision variables. Its solution has the characteristics of strong constraint, multi-stage, nonlinearity, and high dimension. In order to solve this problem, this paper proposes a hybrid slime mold and arithmetic optimization algorithm (HSMAAOA) combining stochastic reverse learning. Since ancient times, harnessing the Yellow River has been a major event for the Chinese nation to rejuvenate the country and secure the country. Today, flood risk is still the greatest threat to the Yellow River basin. This paper chooses five reservoirs in the middle and lower reaches of the Yellow River as the research object, takes the water level of each reservoir in each period as the decision variable, and takes the peak clipping of Huayuankou control point as the objective to build an optimization model. Then, HSMAAOA is used to solve the problem, and the results are compared with those of the slime mold algorithm (SMA) and particle swarm optimization (PSO). The peak clipping rates of the three algorithms are 52.9% (HSMAAOA), 48.69% (SMA), and 47.55% (PSO), respectively. The results show that the HSMAAOA algorithm is better than other algorithms. This paper provides a new idea to solve the problem of the optimal operation of reservoir flood controls.

1. Introduction

Since ancient times, floods have been the biggest threat to the Yellow River Basin, and our ancestors made great efforts to ensure the peace of the Yellow River. In order to reduce the losses caused by floods, a large number of flood control projects have been built. So far, a flood control and disaster reduction engineering system has been basically formed in the middle and lower reaches of the Yellow River, which is based on embankments, with trunk and branch water reservoirs as the backbone, and flood storage and detention areas and river training projects as the coordination [1]. However, the engineering measures cannot completely eliminate the hidden danger of flood. Scientific management and reasonable reservoir operation are also important means to ensure the Yellow River’s stability. Only by combining engineering and non-engineering measures scientifically can disaster prevention and mitigation be more effective [2,3,4,5].
When the reservoir in the basin is operated independently, it is difficult to fully realize its role in flood control due to a lack of cooperation [6]. In order to give full play to the flood control ability of reservoirs, it is necessary to carry out the joint operation of reservoir groups. The flood control operation of the reservoir group is to takes reservoir group as a system. Under the condition of ensuring the safety of each reservoir and the downstream flood control point, each reservoir rationally uses its own regulation and storage function to regulate the upstream inflow, so as to maximize the flood control benefits of the basin [7].
There are complex hydrological and hydraulic connections among the elements of the flood control system, so the flood control operation problem of reservoir groups has the characteristics of strong constraint, multi-stage, nonlinearity, and high dimension [8]. In the past, most scholars used traditional algorithms, such as dynamic programming [9,10,11] and linear programming [12,13], to solve this problem. However, with the increase in the operation period and the number of reservoirs, the problems of slow convergence and “dimension disaster” will appear [14]. With the development of intelligent optimization algorithms, the genetic algorithm [15,16,17,18,19], particle swarm optimization algorithm [18,20,21,22], immune algorithm [23], firefly algorithm [24], and their improved algorithms are also used in reservoir flood control operation. The intelligent optimization algorithm has solved the “dimension disaster” problem of reservoir flood control operation, but the randomness is too strong, and it is easy to fall into the local optimal solution, and the solution result is not stable.
The slime mold algorithm (SMA), proposed by Li S in 2020, is a meta-heuristic algorithm based on the natural vibration mode of slime molds [25]. This algorithm simulates the behavior and morphological changes in slime molds in the process of foraging, and has the characteristics of few parameters and strong optimization ability. However, there are also problems, such as low development efficiency, slow convergence speed, and that it is easy to fall into a local optimal value. In response to this problem, Jia proposed a hybrid slime mold and arithmetic optimization algorithm (HSMAAOA) that integrates stochastic reverse learning [26]. This algorithm integrates SMA algorithm and arithmetic optimization algorithm (AOA) organically, and uses a stochastic reverse learning strategy to improve the convergence speed. The algorithm retains part of the position update formula of SMA global exploration, and replaces the contraction mechanism of SMA with multiplication and division operators in the local development stage, so as to improve the randomness of the algorithm and the ability to jump out of the local extreme value. This substitution makes the individual slime molds better able to explore, and effectively avoids falling into the local optimal solution, thus, improving the convergence speed. As a novel algorithm, HSMAAOA has not been applied to the flood control operation of reservoir groups. In this paper, HSMAAOA is used to solve this problem.
In order to verify the feasibility of the HSMAAOA in joint flood control scheduling of reservoir groups, this paper takes the five reservoirs in the middle and lower reaches of the Yellow River, namely Luhun, Guxian, Hekoucun, Sanmenxia, and Xiaolangdi as the research objects, establishes the Huayuankou flood maximum peak clipping model, applies HSMAAOA to solve this model, and compares the calculation results with SMA and PSO. The results show that the performance of HSMAAOA is better than the other algorithms selected in this paper. This algorithm provides a new idea for the joint flood control operation of reservoir groups.
The structure of this paper is as follows: Section 2 is the joint flood control scheduling model for reservoir groups; Section 3 briefly introduces the HSMAAOA algorithm, and performs function tests to prove its superiority; Section 4 is a case analysis, explaining the results of joint scheduling of reservoir groups in the study area and discussing the results; Section 5 presents the conclusion of this paper.

2. Joint Flood Control Operation Model of Reservoir Groups

2.1. Objective Function

The purpose of the flood control operation of reservoir groups is to ensure the safety of the flood control point as much as possible on the premise of ensuring the safety of the reservoir itself. The safety degree of the flood control point gradually increases with the decrease in flood peak flow. Therefore, the magnitude of the peak flow can reflect the safety degree of the flood control point. In this paper, the objective function is established based on the maximum peak clipping criterion, as follows:
ob = max Q l ( t ) + Q g ( t ) + Q h ( t ) + Q x ( t ) + Q s ( t )
where Q l ( t ) is the flow process from the discharge flow of Luhun reservoir to the Huayuankou section; Q g ( t ) is the flow process from the discharge flow of Guxian reservoir to the Huayuankou section; Q h ( t ) is the flow process from the discharge flow of Hekoucun reservoir to the Huayuankou section; Q x ( t ) is the flow process from the discharge flow of Xiaolangdi reservoir to the Huayuankou section; Q s ( t ) is the flow process formed by all interval floods at the Huayuankou section.

2.2. Constraint Condition

2.2.1. Water Balance Constraint

V t + 1 i V t i = I Δ t i q Δ t i Δ t
where V t i , V t + 1 i are the storage capacity of the i-th reservoir at the t-th time and the t+1-th time, respectively; I t i is the average inflow flow of the i-th reservoir during the Δ t period; q t i is the average discharge flow of the i-th reservoir during the Δ t period.

2.2.2. Water Level Constraint

Z min i Z t i Z max i
where Z min i , Z max i are the flood limit water level and the flood control high water level of the i -th reservoir, respectively; Z t i is the initial water level of the i-th reservoir at the t-th time.

2.2.3. Initial Water Level Constraint

Z 1 i = Z b e g i n i
where Z 1 i is the initial water level at the initial moment of operation for the i-th reservoir; Z b e g i n i is the starting water level of the i-th reservoir.

2.2.4. End Water Level Constraint

Z T i = Z e n d i
where Z T i is the water level at the end of the i-th reservoir operation period; Z e n d i is the expected water level at the end of the i-th reservoir operation period.

2.2.5. Discharge Capacity Constraint

q Δ t i q Z t i
where q Z t i is the maximum discharge capacity of the i-th reservoir in the t-th period when the water level is Z t i .

2.2.6. Maximum Safe Discharge Constraint

q Δ t i Q max i
where Q max i is the maximum discharge flow allowed by the i-th reservoir to ensure the safety of the downstream river.

3. HSMAAOA Algorithm

3.1. SMA

The SMA algorithm is inspired by the diffusion and foraging behavior of slime molds. It uses a mathematical model to simulate the foraging behavior and morphological changes in slime molds. It has the characteristics of fast convergence and strong optimization ability.
Slime molds first approach food through the smell in the air. The higher the concentration of food in the area, the more slime molds will gather in the area. On the contrary, slime molds will turn to explore other areas. The mathematical formula is expressed as follows:
X t + 1 = X b t + v b W × X A t X B t , r < p v c × X t , r p
p = tanh S i D F , i = 1 , 2 , 3 , , N
a = arctanh 1 t / T
where X(t+1) and X(t) are the positions of the slime molds in the t+1-th generation and the t-th generation, respectively; X b t is the position with the highest food concentration in the t-th iteration; X A t and X B t are two slime mold individuals randomly selected at the t-th iteration; the scope of vb is a , a ; the range of vc decreases linearly from 1 to 0; r is a random number between 0 and 1; S(i) is the fitness value of the i-th slime mold individual; DF is the optimal fitness value in the iterations; N is the number of slime mold populations; T is the maximum number of iterations; W is the weight of the slime mold, the formula for which is as follows:
W s m e l l i n d e x i = 1 + r × log b F S i b F w F + 1 , c o n d i t i o n 1 + r × log b F S i b F w F + 1 , o t h e r s
s m e l l i n d e x i = s o r t S
where condition represents the individuals whose fitness value ranks in the first half; others represents the remaining individuals; bF and wF represent the optimal fitness and the worst fitness in the current iteration, respectively.
After the slime molds find a good food source, they continue to explore other areas to obtain a higher quality food source. The location update formula is as follows:
X t + 1 = r a n d × u b l b + l b , r < z X b t + v b W × X A t X B t , r < p v c × X t , r p
where ub and lb are the upper and lower bounds of the search space, respectively; Z is a parameter used to balance the search and development stages, and is set to 0.03 in this paper.

3.2. HSMAAOA

3.2.1. Stochastic Reverse Learning Strategy

In recent years, the reverse learning strategy [27] has been widely used in the improvement of intelligent algorithms. Its main idea is to compare the fitness value of the current solution and its reverse solution, and to select the optimal solution. The formula for the reverse solution is as follows:
X ^ = l b + u b X
where X ^ is the reverse solution; X is the current solution.
The reverse learning strategy can increase the diversity of the population by adding reverse solutions, but because the distance between the current solution and the reverse solution is a fixed value, it lacks randomness and cannot effectively enhance the diversity of the population. Long W proposed a random reverse learning strategy [28], which was solved by Formula (15), which improved the ability of random exploration of the population, effectively enhanced the diversity of the population, and helped the population jump out of the local optimum. Formula (15) is as follows:
X ^ rand = l b + u b r × X
where X ^ rand is the reverse solution.

3.2.2. Integrate AOA Strategy

When SMA performs a global search, the oscillation effect of vb increases the ability of the global search, but, as the number of iterations increases, the oscillation effect of vb gradually decreases, so that the algorithm cannot effectively jump out of the local optimum. On the basis of SMA, HSMAAOA integrates the multiplication and division operator mechanism of AOA [29] to update the position. This replacement improves the ability of SMA to search for optimization in the later stage and avoids falling into a local optimal solution. The formula is as follows:
X t + 1 = r a n d × u b l b + l b , r < z X b t + v b W × X A t X B t , r < p X b t ÷ M O P + ε × u b l b × μ + l b , p r < 0.5 X b t × M O P × u b l b × μ + l b , r p   and   r 0.5
where μ is the control parameter to adjust the search process; ε is a minimum value; MOP is the mathematical optimizer probability, calculated as follows:
M O P t = 1 t 1 α T 1 α
where a is a sensitive parameter with a value of 5.

3.2.3. HSMAAOA Algorithm Calculation Steps

In this paper, the HSMAAOA algorithm is used to solve the joint flood control operation of reservoir groups. The steps are as follows:
Step 1—Initialize the population. First set the algorithm parameters, including the population number N and the maximum number of iterations T. The initial water level of the reservoir period is taken as the decision variable, and the population position (water level) is initialized.
Step 2—Calculate the fitness value. Calculate the discharge flow of each reservoir in each time period through reservoir regulation and find the discharge flow that satisfies the constraints. If the constraints are not met, the penalty function is used to punish, and the fitness value is calculated by Formula (18), and the optimal fitness value and the worst fitness value are selected. Formula (18) is as follows:
F = o b + f l a g × K
where ob is the objective function value; flag is the number that does not satisfy the constraints; K is the penalty coefficient.
Step 3—Update individual locations. The weight of the slime mold individual is updated according to Formula (11); if r < z, the individual position is updated by Formula (16) ①; otherwise, update vb, vc, and P; if r < p, the individual position is updated by Formula (16) ②; conversely compare the size of r and 0.5; if r < 0.5, the individual position is updated by Formula (16) ③; if r ≥ 0.5, the individual position is updated by Formula (16) ④.
Step 4—Generate random inverse solutions. The random inverse solution of the current solution is generated by Formula (15), and the fitness values of the current solution and the random inverse solution are compared to select the optimal solution.
Step 5—Determine whether the number of iterations reaches the maximum number of iterations. If not, repeat steps 2 to 4. Otherwise, terminate the calculation. The solution is the optimal solution.

3.3. Function Test

In order to test the performance of the HSMAAOA algorithm, this paper selects six typical test functions to verify it. The functions are as follows.
The sphere function is as follows:
f x = i = 1 n x i 2 , 5.12 x i 5.12
The Schwefel function is as follows:
f x = 418.9829 n i = 1 n x i sin x i , 500 x i 500
The Ackley function is as follows:
f x = 20 exp 0.2 1 n i = 1 n x i 2 exp 1 n i = 1 n cos 2 π x i + 20 + e , 100 x i 100
The Griewank function is as follows:
f x = i = 1 n x i 2 4000 i = 1 n cos x i i + 1 , 600 x i 600
The Rastrigin function is as follows:
f x = 10 n + i = 1 n x i 2 10 cos 2 π x i , 5.12 x i 5.12
The Levy function is as follows:
f x = sin 2 π w 1 + i = 1 n 1 w i 1 2 1 + 10 sin 2 π w i + 1 + w d 1 2 1 + sin 2 2 π w d w i = 1 + x i 1 4 , 100 x i 100
The SMA and PSO algorithms are selected for comparison. In order to ensure the accuracy of the results, the population number is set to 100, the dimension is 30, the maximum number of iterations is 1000, and 3 algorithms are run independently 10 times. The other parameters of the three algorithms are shown in Table 1.

3.3.1. Precision Analysis

The maximum value, minimum value, average value, and standard deviation are selected as verification indicators. The smaller the average value and standard deviation, the better the performance of the algorithm. The test results are shown in Table 2. Among the six test functions, the sphere and Schwefel functions are unimodal functions, and the other four are multimodal functions. For the sphere, Griewank, and Rastrrigin functions, both the HMAAOA and SMA algorithms can obtain the theoretical optimal value, while the PSO algorithm has a low solution accuracy and large error. For the Ackley function, the standard deviation of the results obtained by the HSMAAOA and SMA algorithms is 0, and the four evaluation indexes are all smaller than that of PSO algorithm, indicating that the HSMAAOA and SMA algorithms have high accuracy and strong stability. For the Schwefel and Levy functions, the HSMAAOA algorithm has the smallest mean and standard deviation, followed by the SMA algorithm, and the PSO algorithm has the largest. It can be seen from the comparison results that the HSMAAOA algorithm is superior to the other two in terms of solving functions, with high accuracy and stability, and can effectively avoid falling into the local optimal solution.

3.3.2. Quantitative Evaluation of Comprehensive Performance

In order to quantitatively evaluate the comprehensive performance of the algorithm, the Friedman test is conducted based on the average value of each algorithm. The test results show that the rank mean values of HSMAAOA, SMA, and PSO are 2.16, 2.5, and 9.5, respectively. Among them, the smaller the rank mean is, the better the comprehensive performance of the algorithm is. It can be seen that the comprehensive performance of HSMAAOA algorithm is better than the other two algorithms, and the solution is the most stable.

4. Case Analysis

4.1. Study Area

The Yellow River is the second longest river in China. It originates in the Bayan Har Mountains on the Qinghai–Tibet Plateau and flows into the Bohai Sea in Kenli County, Shandong Province. Its main stream is 5464 km long and its drainage area is 795 thousand km2. This paper selects the area between Sanmenxia and Huayuankou in the middle and lower reaches of the Yellow River as the study area, and then conducts flood control operation research on the Sanmenxia and Xiaolangdi reservoirs on the main stream, and the Luhun, Guxian, and Hekoucun reservoirs on the tributaries. The characteristic parameters of the five reservoirs are shown in Table 3.
As the public flood control point in the study area, Huayuankou controls all floods in the area. The flood in this section is mainly caused by high-intensity and long-term rainfall. The flood in the middle reaches mainly comes from three sources, as follows: one is from Hekou Town to Longmen, the other is from Longmen to Sanmenxia, and the third is from Sanmenxia to Huayuankou. The rainstorm here has the characteristics of high intensity and short duration, so the flood formed here has high peak, short duration, and steep rise and fall. These three floods combined into different major floods and catastrophic floods at Huayuankou Station. According to historical and measured data analysis, the major floods above Huayuankou are mainly divided into two categories; the first type is dominated by floods in the Helongjian and Longsanjian above Sanmenxia, which have high flood peaks and large flood volumes; the other is mainly the flood between Sanmenxia and Huayuankou, and this kind of flood has a sharp rise, a high flood peak, and a short forecast period. This paper takes the second flood that occurred once in a thousand years in 1958 as an example to study the joint operation problem of five reservoirs.

4.2. Flood Process Analysis

Flood routing is based on the principle of water balance and the relationship between storage and discharge, and the flow process of the upstream section of the reach is evolved to the downstream section. The common calculation methods are the hydrodynamic method and the hydrological method. The study area of this paper is wide, and hydrodynamic modeling is difficult and limited by topographic data, so further studies on the modeling of the hydrodynamic model are needed. Therefore, a common hydrological method, the Muskingum method [30], is selected to calculate flood routing. The Muskingum method is greatly affected by parameters, but this paper has parameter values from the Yellow River Yearbook (see Table 4), which can enhance the reliability of the calculation results. The calculation formula for the Muskingum method is as follows:
Q 2 = C 0 I 2 + C 1 I 1 + C 2 Q 1
C 0 + C 1 + C 2 = 1
C 0 = 1 2 Δ t K x 1 2 Δ t + K K x ; C 1 = 1 2 Δ t + K x 1 2 Δ t + K K x ; C 2 = 1 2 Δ t + K K x 1 2 Δ t + K K x
where Q is the discharge flow of the downstream section; I is the inflow of the upstream section; Δ t is the calculation period; x is the specific gravity factor of flow; K is the slot storage coefficient.
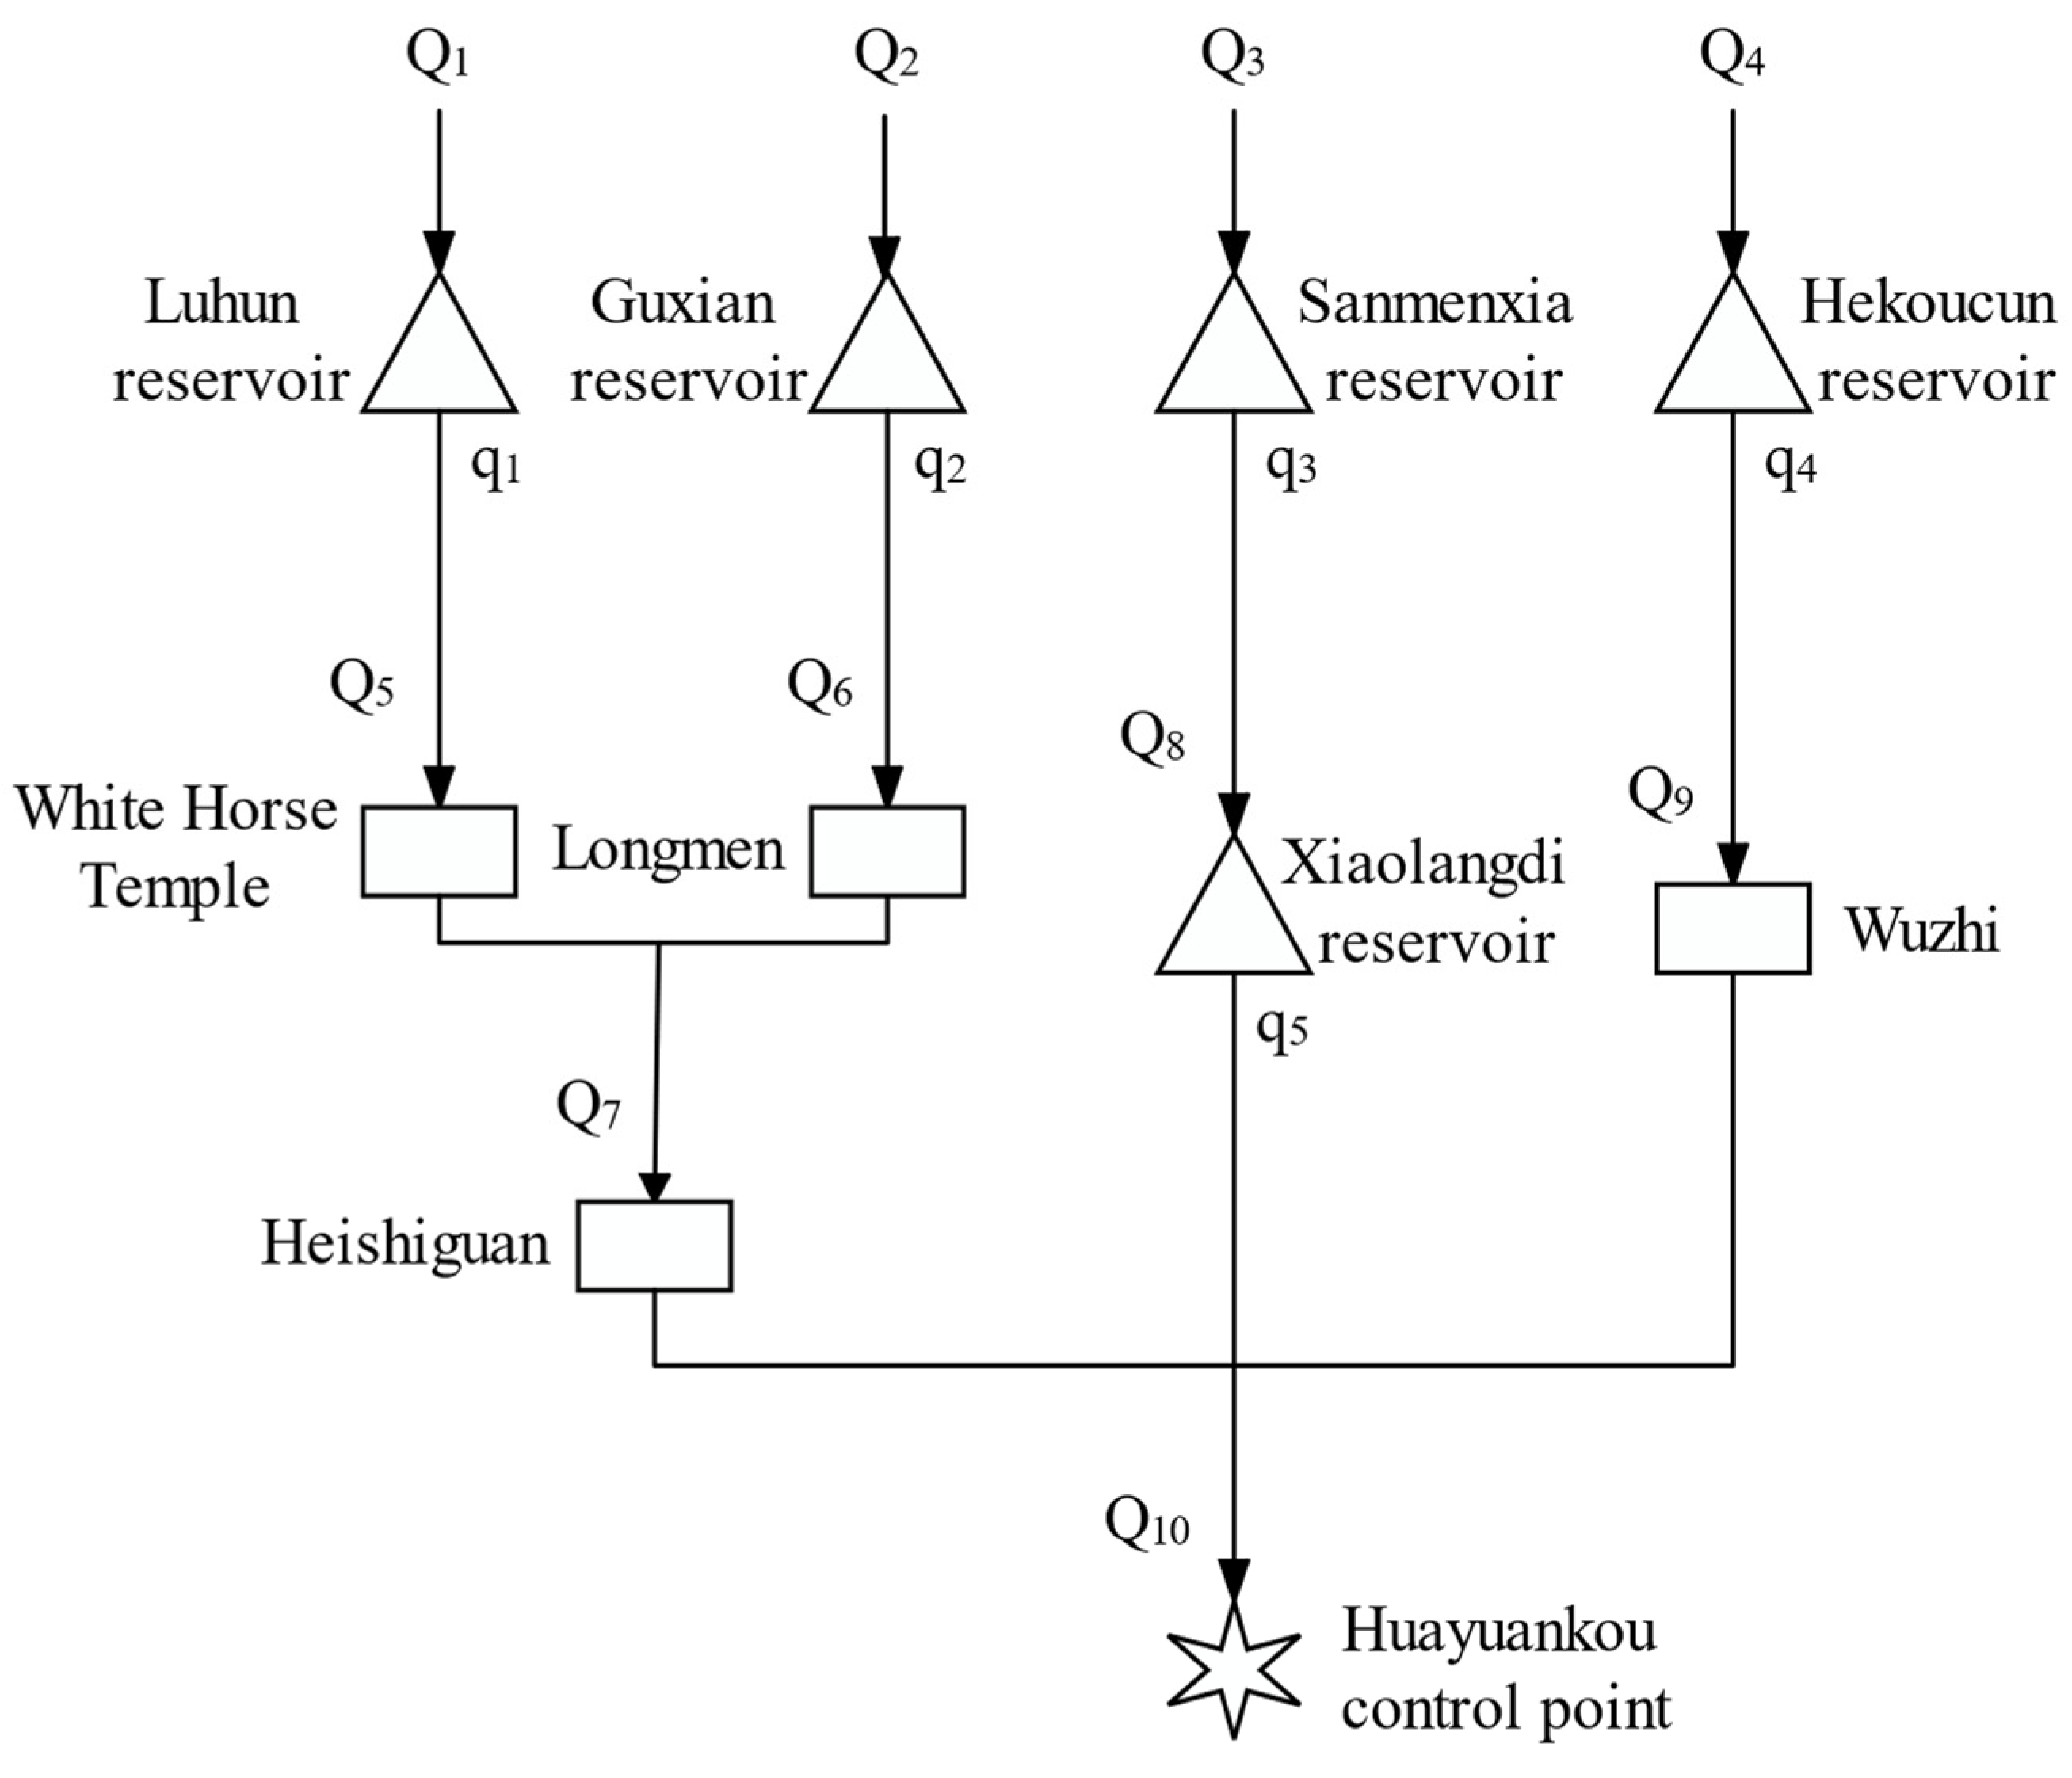
The once-in-a-thousand-year flood in 1958 was the largest in the history of measured hydrological data on the Yellow River, which was mainly caused by continuous torrential rain. This flood mainly came from the flood in the interval from Sanmenxia to Xiaolangdi and the flood in the tributaries Yihe and Luohe, while the flood above Sanmenxia and the tributary Qinhe were smaller. The flood composition of the Huayuankou section is shown in Figure 1.
As shown in Figure 1, the five reservoirs in the middle and lower reaches of the Yellow River and Huayuankou control point together form a flood control operation system for the reservoir group. Here, Q1, Q2, Q3, and Q4 are the upstream floods of Luhun reservoir, Guxian reservoir, Sanmenxia reservoir, and Hekoucun reservoir, respectively; Q5, Q6, Q7, Q8, and Q9 are the interval flood from Luhun reservoir to the White Horse Temple section, the interval flood from Guxian reservoir to the Longmen section, the interval flood from White Horse Temple and Longmen to the HeiShiGuan section, the interval flood between Sanmenxia reservoir and Xiaolangdi reservoir, and the interval flood from Hekoucun reservoir to Wuzhi section, respectively; q1, q2, q3, q4, and q5 are the discharge flows of Luhun reservoir, Guxian reservoir, Sanmenxia reservoir, Hekoucun reservoir, and Xiaolangdi reservoir, respectively. The discharge flood of each reservoir and all interval floods progressed to the Huayuankou section, which constituted the flood process of Huayuankou Station.

4.3. Results and Discussion

The parameters of the HSMAAOA algorithm have a great influence on the solution results, such as the population size and the maximum number of iterations. In this paper, the maximum number of iterations is set as 1000. In order to compare the impact of different population sizes on the solution results, the model runs independently 10 times under different population sizes to calculate the optimal value, the worst value, the average value, and the standard deviation under different population sizes. See Table 5 for the results. It can be seen that when the population size is 100, the best target value can be obtained.
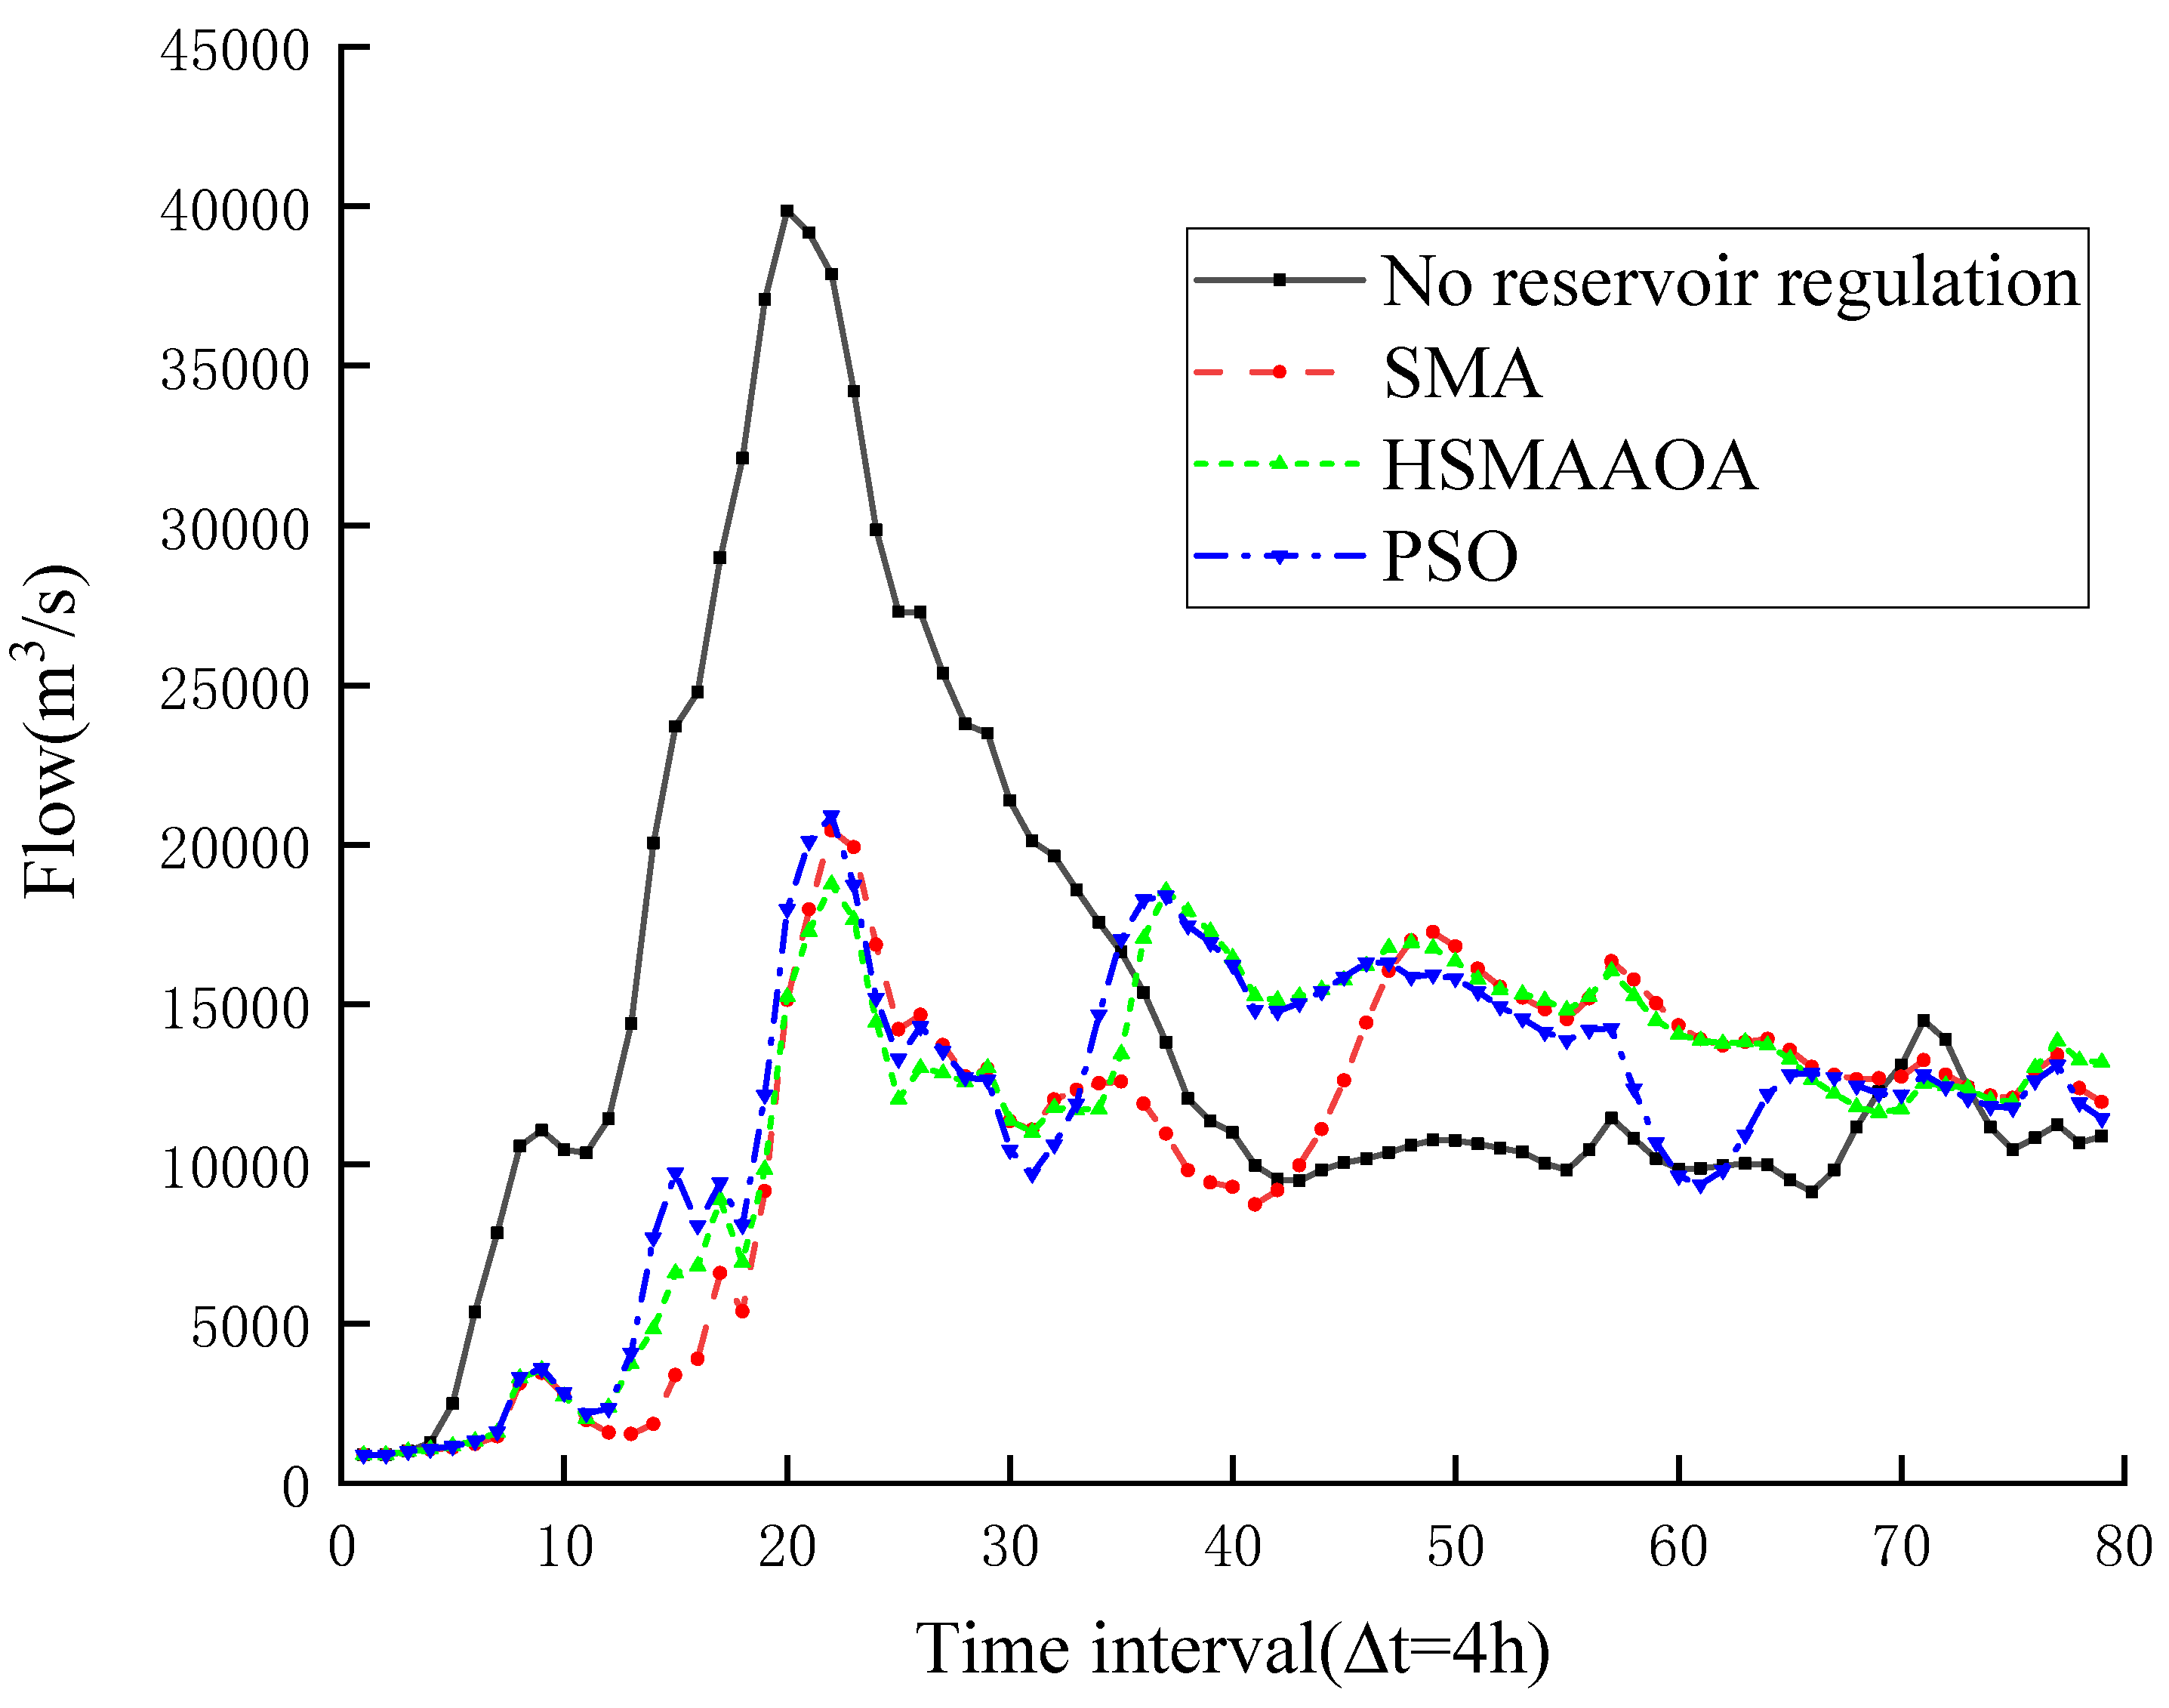
This paper takes the minimum peak flow at the Huayuankou section as the goal, and uses three algorithms, namely PSO, SMA, and HSMAAOA, to solve the problem. In this paper, the flood duration and the reservoir operation period are both 13 days. According to the measured hydrological data, the calculation period of the main stream is 4 h, and the tributary is 2 h. The flood process of the Huayuankou section obtained by the three algorithms is shown in Figure 2:
As can be seen from Figure 2, for the once-in-a-thousand-year flood, the scheduling results of the three algorithms can reduce the peak flow of Huayuankou to a certain extent, and none of them exceed the safe discharge of 22,000 m3/s downstream of Huayuankou. Among them, the black line in the figure refers to the flood process that the flood in each section evolves to the Huayuankou section without reservoir regulation. In addition, there are two peaks in the flood process of the Huayuankou section solved by the three algorithms, which is related to the objective of the model. In order to achieve the maximum peak clipping rate, the effect of peak shifting is achieved through reservoir regulation at the time of the maximum flood peak. After the two flood peaks, the flooding process of the Huayuankou section tends to be stable, which is beneficial to the safety of flood discharge in the downstream river.
The peak clipping rate of each algorithm is shown in Table 6. The peak clipping rate of the HSMAAOA algorithm is the largest, reaching 53.46%, followed by the SMA algorithm, which is not much different from the PSO algorithm, at 47.79% and 46.63%, respectively. Compared with the other two algorithms, the HSMAAOA algorithm is superior to the other two algorithms, and it is more feasible and effective to apply to flood control operation in reservoir groups.
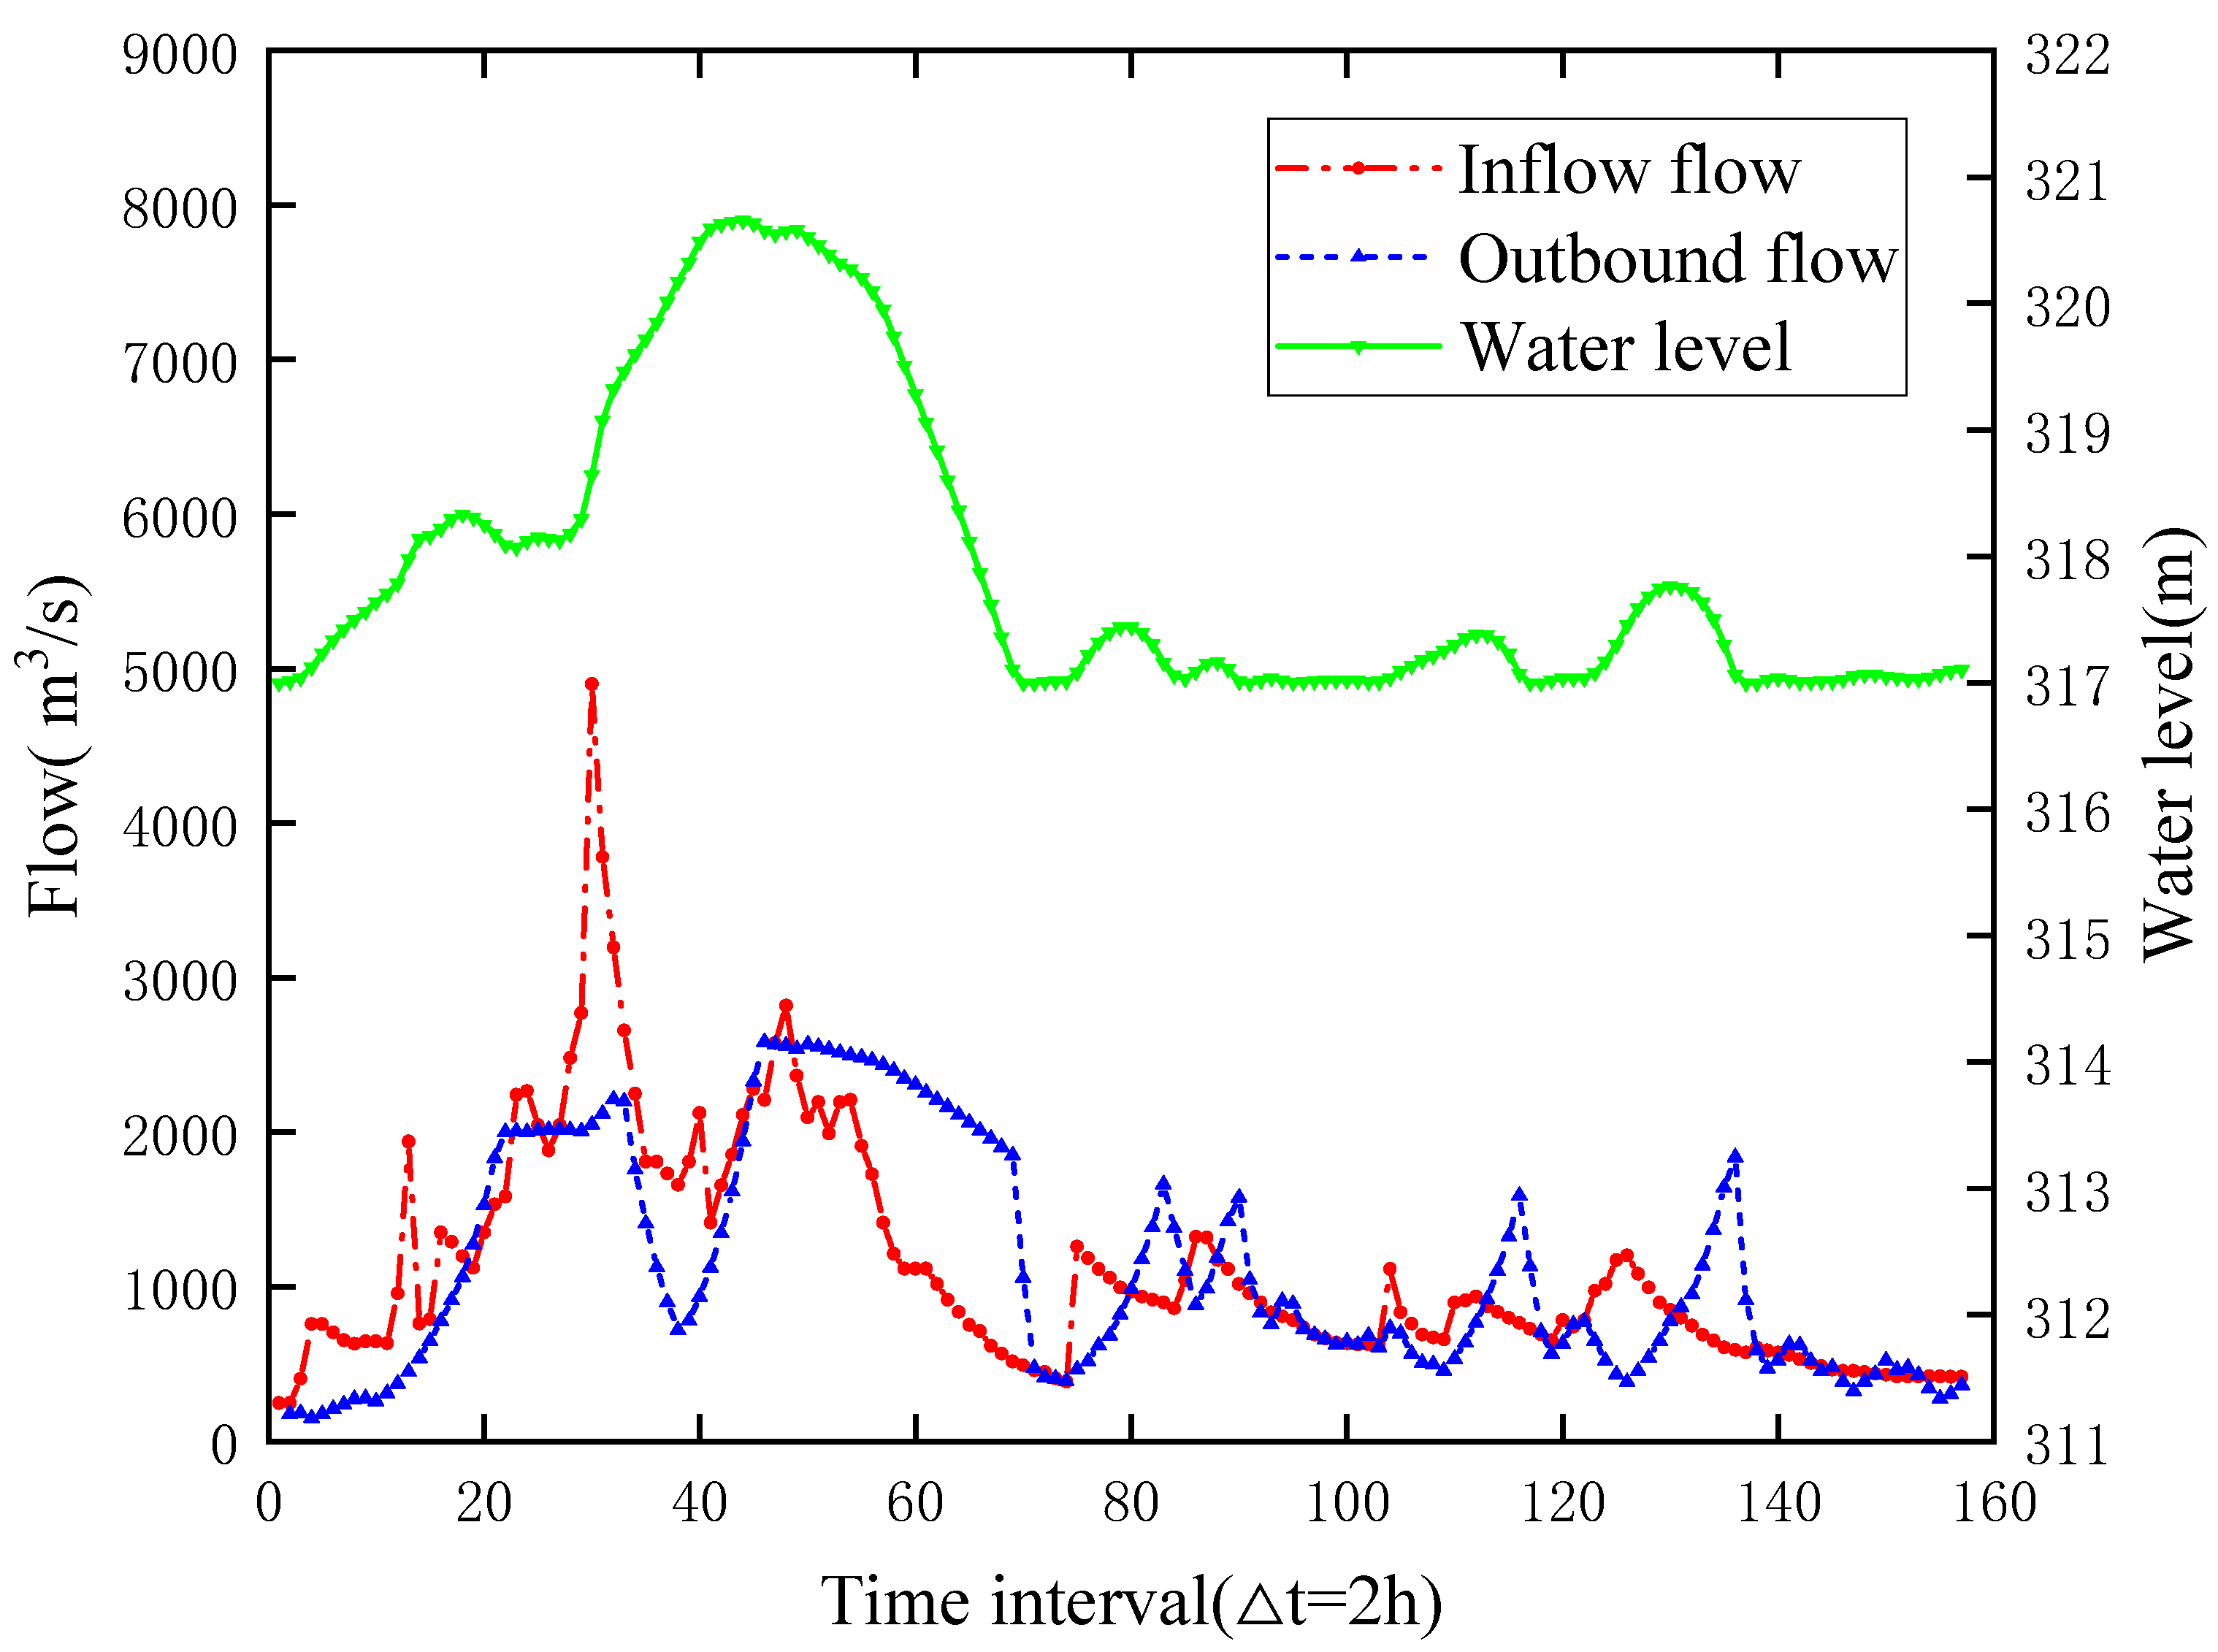
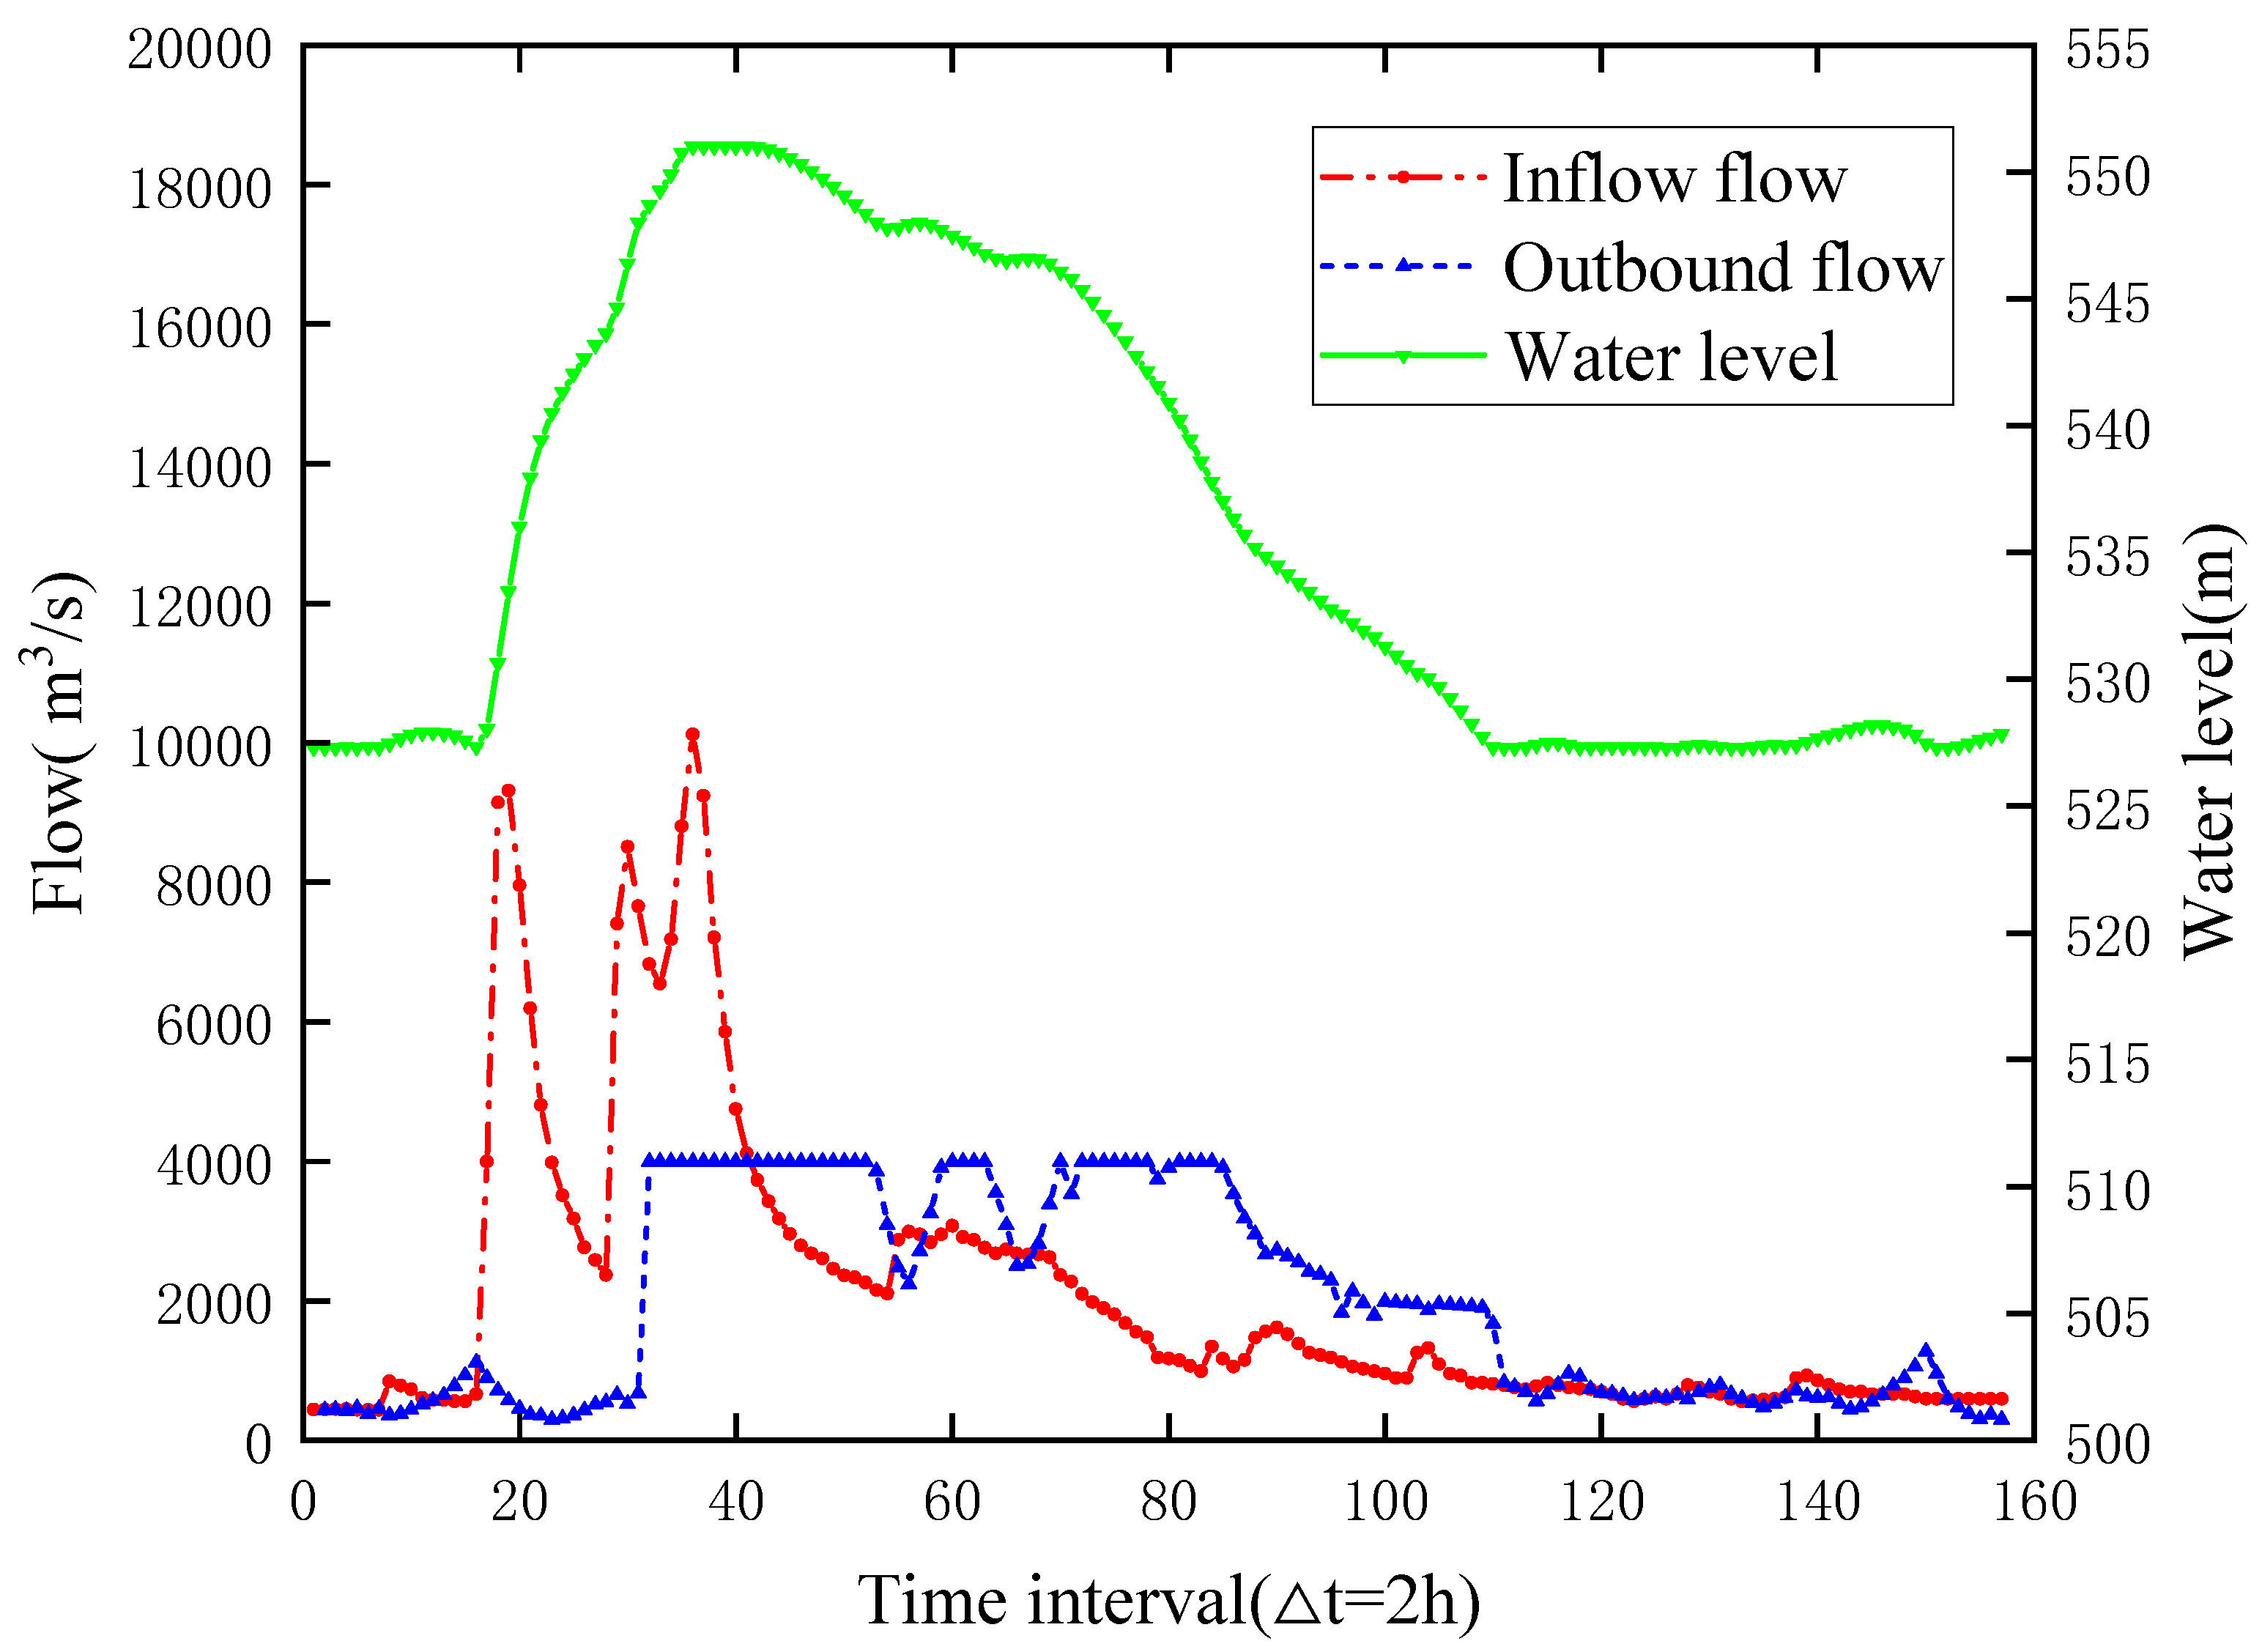
Figure 3, Figure 4, Figure 5, Figure 6 and Figure 7 show the operation process of each reservoir under the HSMAAOA algorithm. The operation results are shown in 
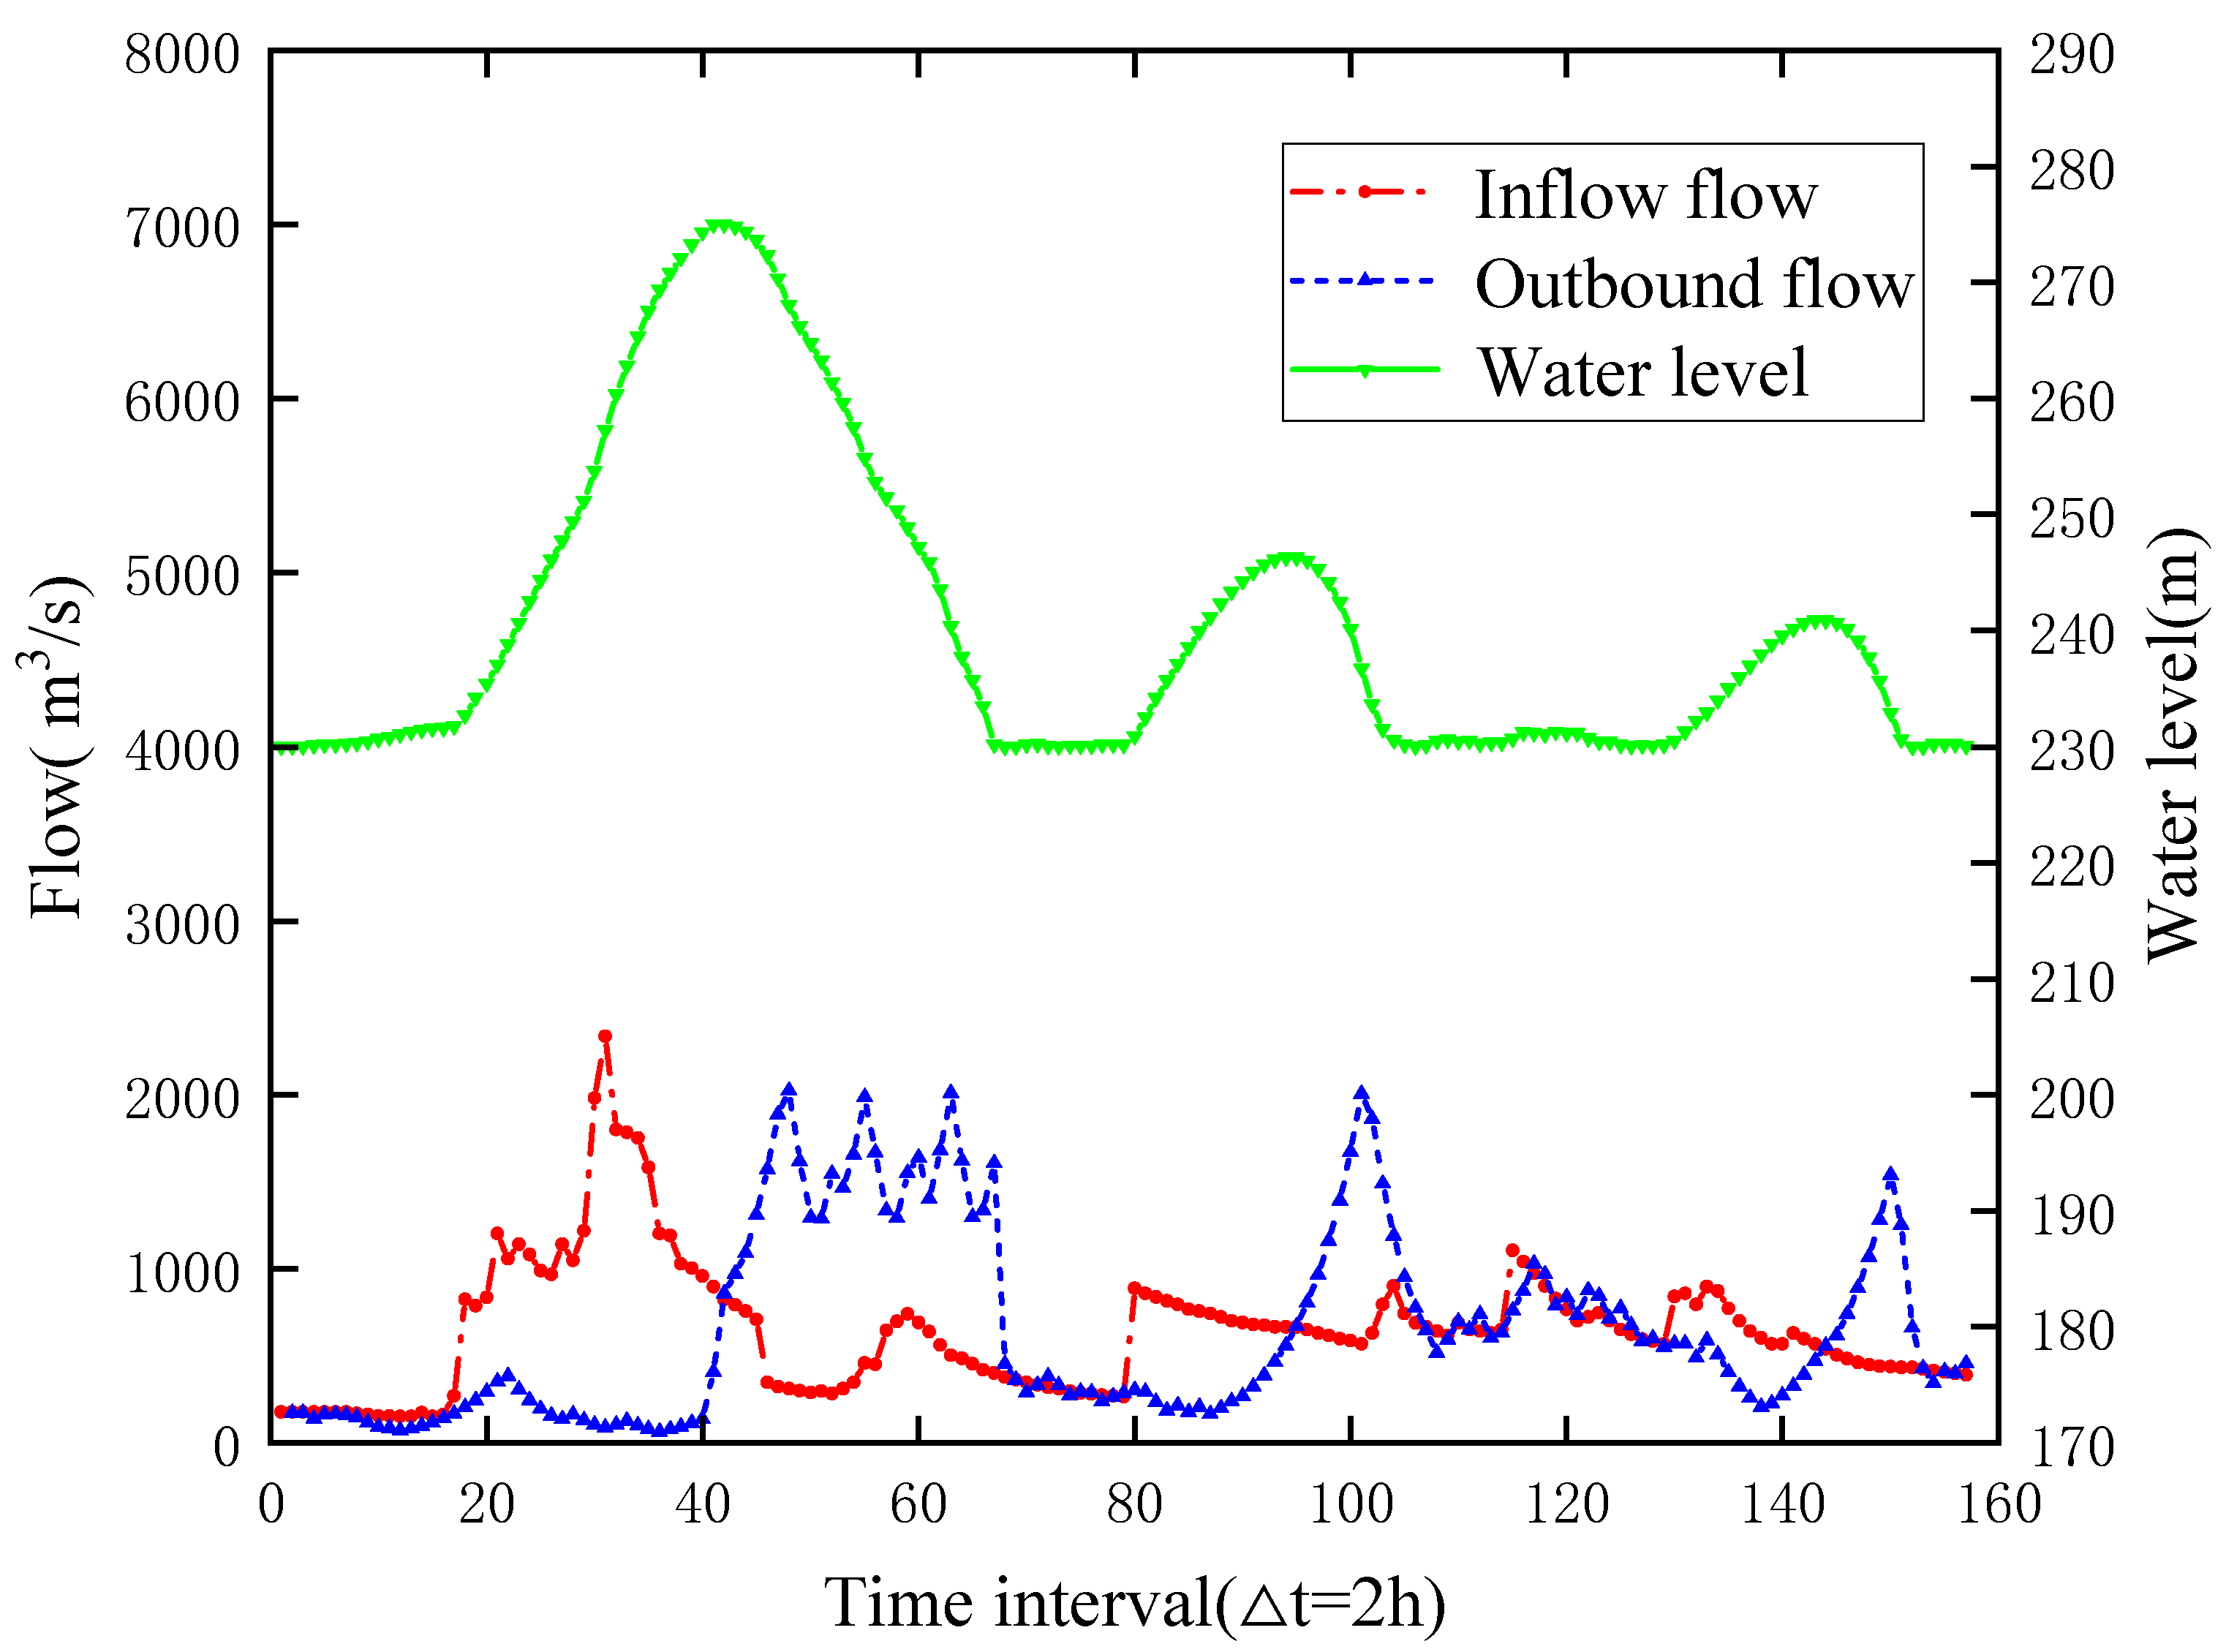
Table 7. The flood peaks have also been reduced to a certain extent through the adjustment of each reservoir. Among them, the peak clipping rates of Xiaolangdi reservoir and Guxian reservoir are relatively high, at 64.92% and 60.47%, respectively, and the peak clipping rates of Hekoucun reservoir and Sanmenxia reservoir are relatively low, at 13.31% and 13.32%, respectively, while the peak clipping rate of Luhun Reservoir is 47.24%.
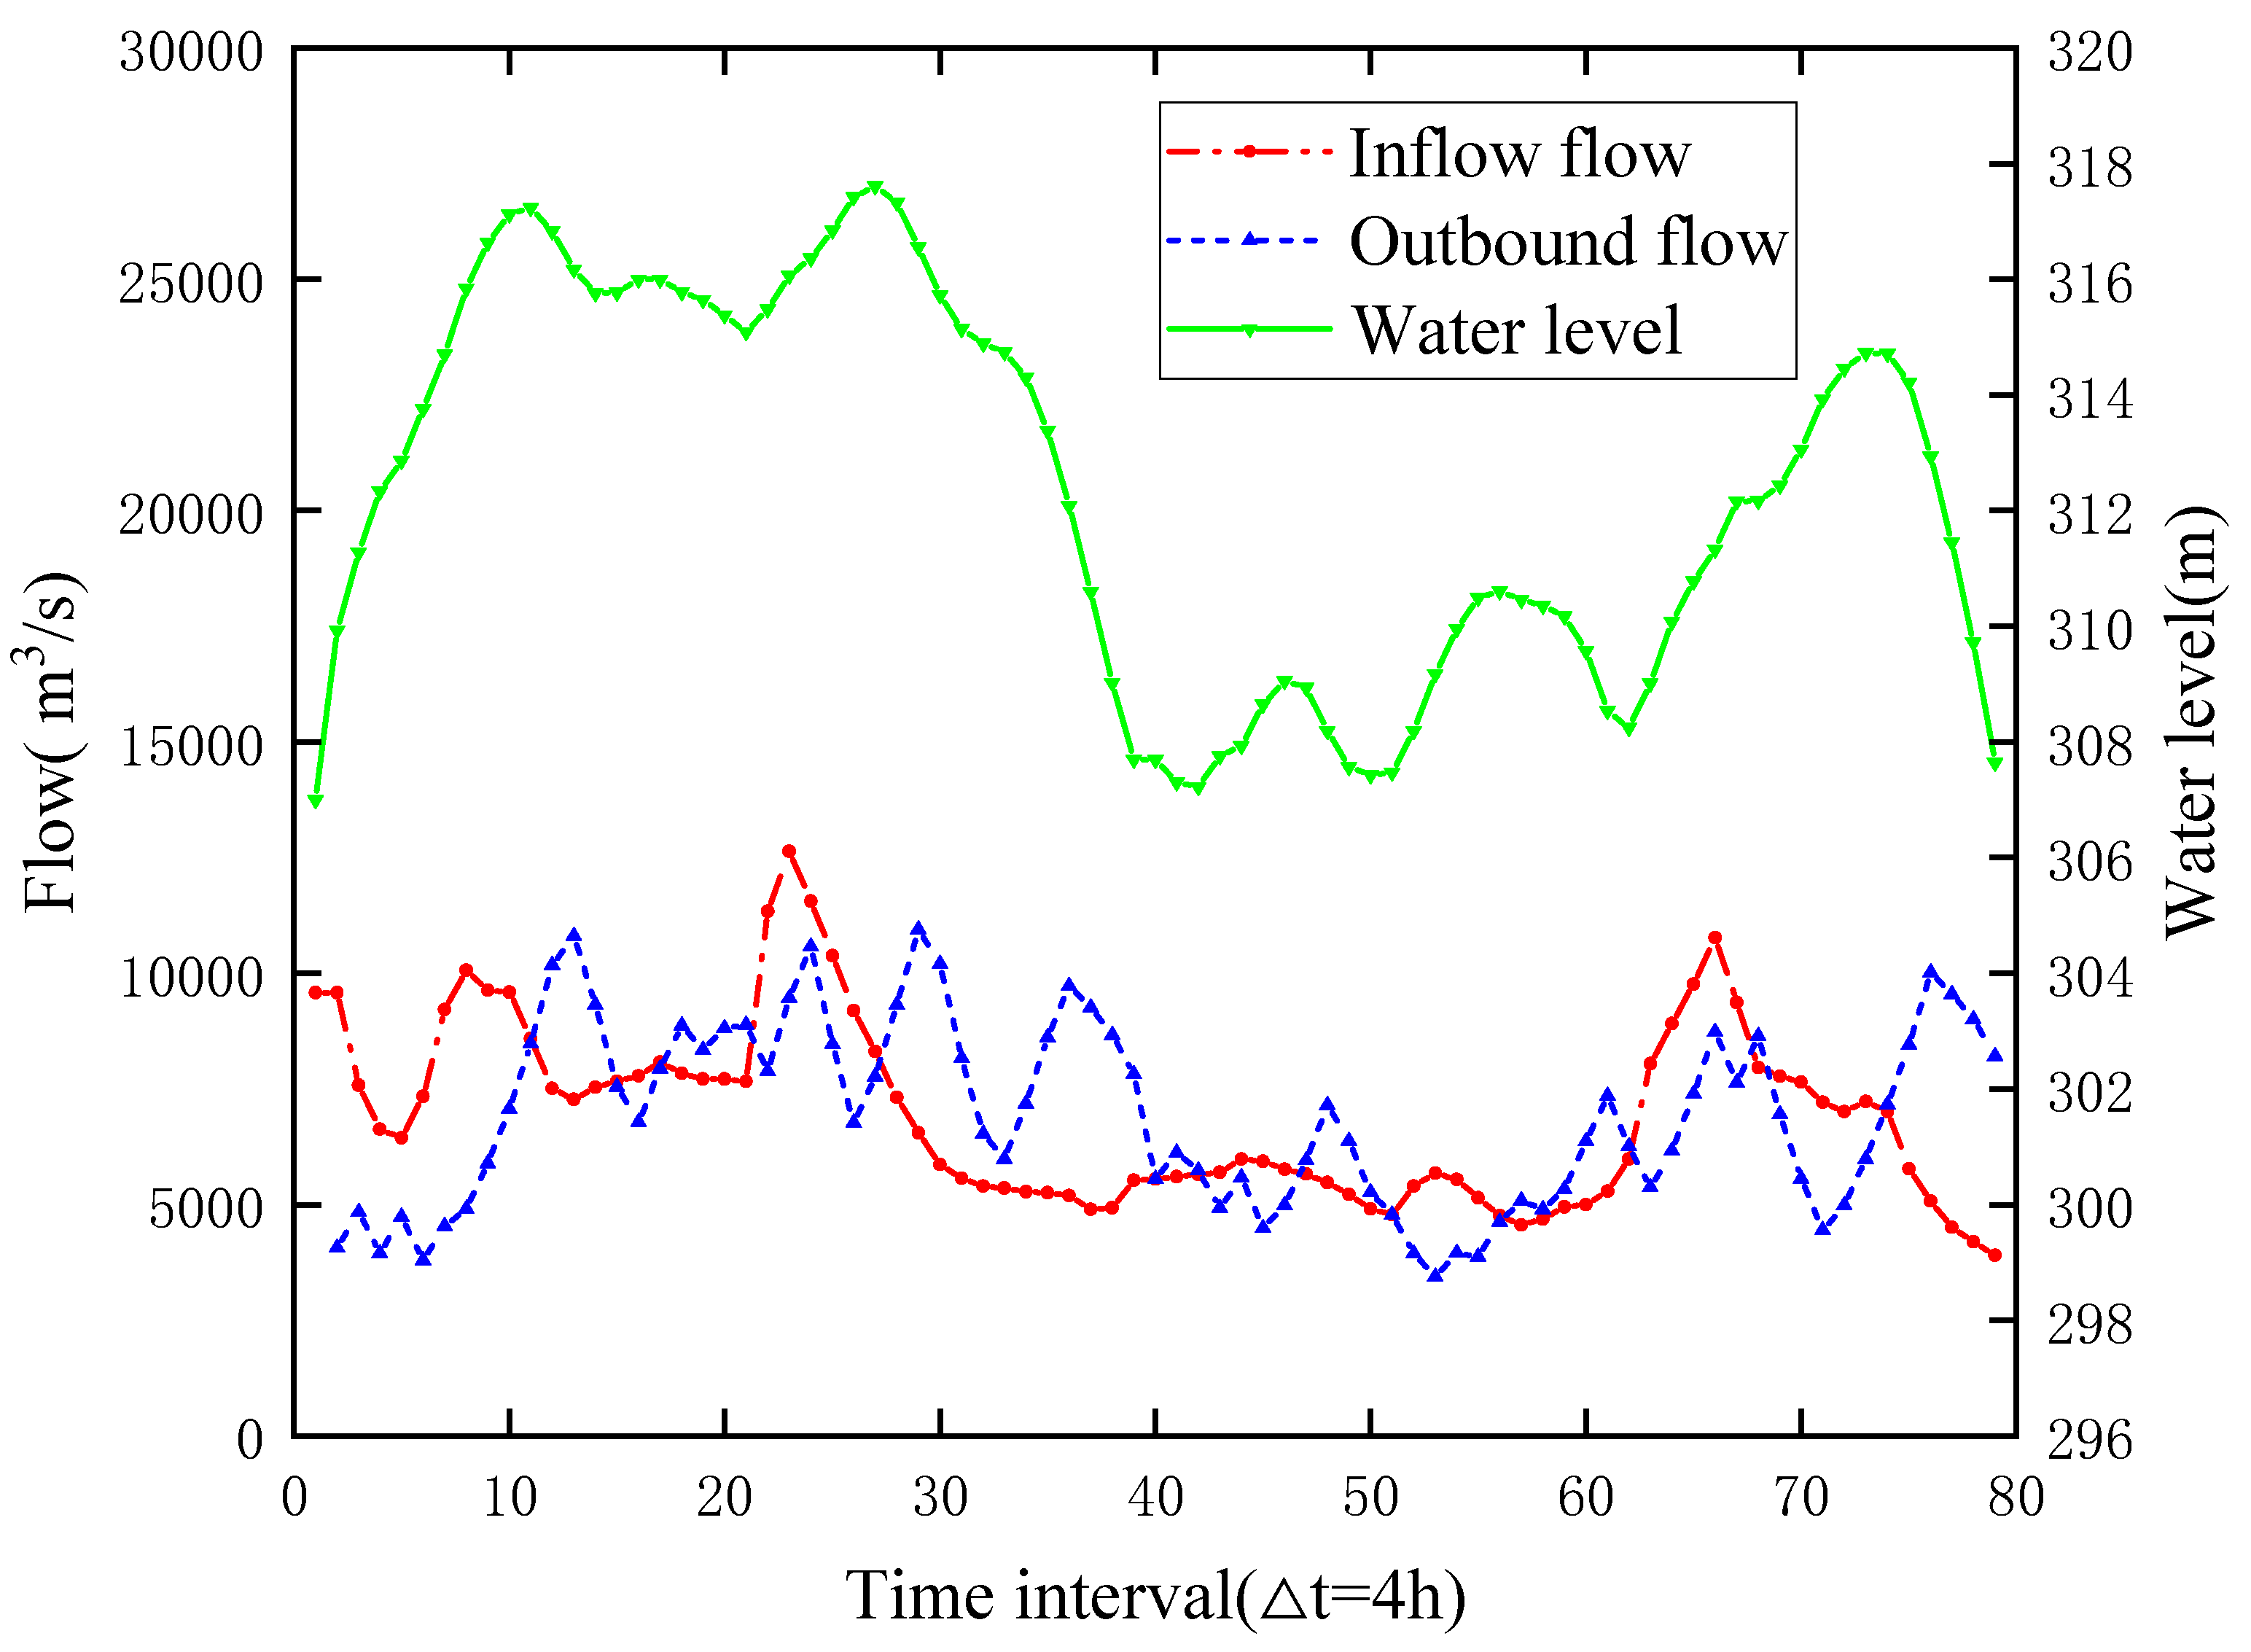
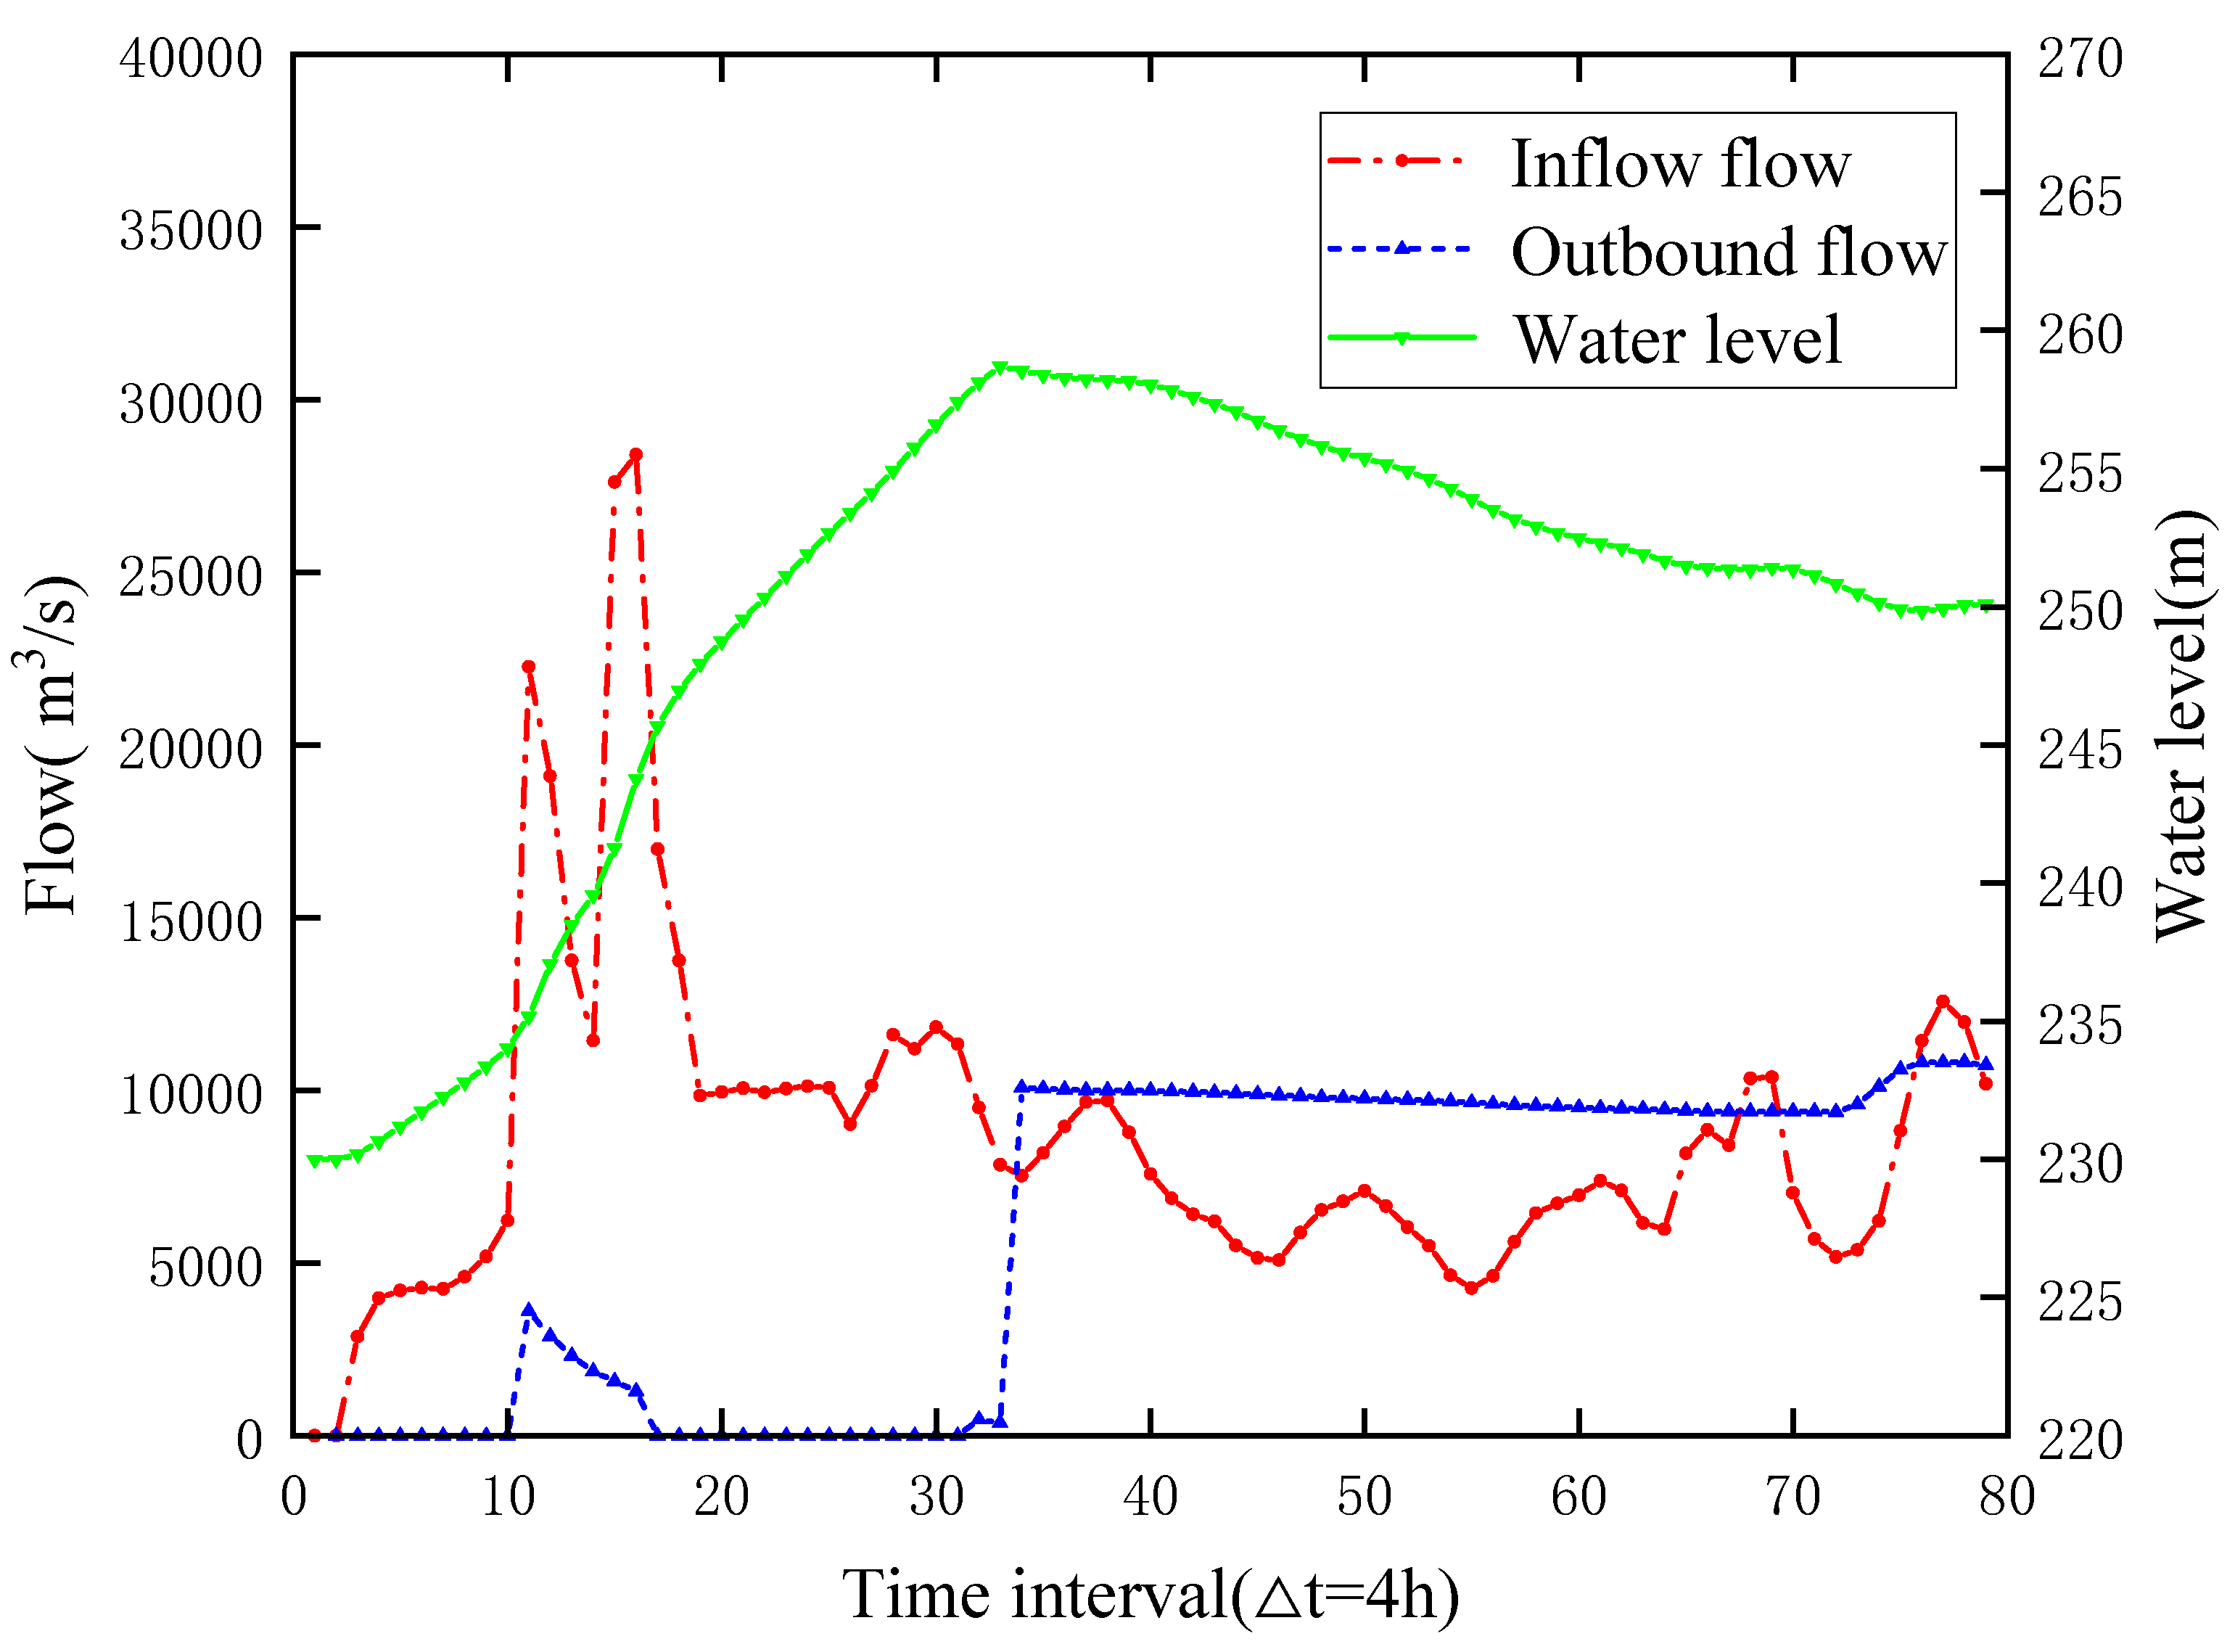
Sanmenxia reservoir and Xiaolangdi reservoir are series reservoirs. During the flood control operation, the outflow process of Sanmenxia and flood between Sanmenxia and Xiaolangdi constitute the inflow process of Xiaolangdi reservoir. The inflow flood of Xiaolangdi reservoir has a large flow, high peak, and double peak flood, which is very unfavorable for the safety of flood discharge in the downstream river. It can be seen from the figure that this operation scheme not only reduces the flood peak flow, but also achieves the peak staggering effect in the Luhun, Guxian, Hekoucun, and Xiaolangdi reservoirs. When the flood comes, the reservoirs makes full use of their flood control capacity, by first storing part of the flood to ensure the safety of Huayuankou, and then by discharging the flood according to the operation plan to meet the flood control requirements.
At the beginning of the operation period, the discharge flow of the Guxian, Hekoucun, and Xiaolangdi reservoirs is very small, in order to avoid the peak of the discharge flow process and the flood peak of the interval flood, so as to achieve the purpose of peak reduction of the Huayuankou section and protect the safety of the downstream river. Theoretically, without considering water storage, the reservoir should immediately reduce to the flood limit water level after regulating a flood to cope with the arrival of the next flood. However, the dispatching result shows that the end water level has not returned to the initial regulation water level, because the objective established in this paper is to maximize the peak clipping rate of the Huayuankou section, which will correspondingly reduce the discharge flow of the reservoir. In addition, it is also related to the need to consider the inundation of the beach area in the actual dispatching process.

5. Conclusions

Based on the criterion of maximum peak clipping rate, this paper establishes an optimization model for the joint operation of reservoir groups, which gives full play to the flood control capacity of each reservoir and effectively ensures the safety of dams and downstream flood control points. This paper selects five reservoirs in the middle and lower reaches of the Yellow River and the Huayuankou flood control point as the research objects, and then uses the Muskingum method to deal with the evolution of floods in the river. The HSMAAOA algorithm is proposed to solve the optimal operation of reservoir groups, and a penalty function is used to deal with the constraints of the model. The main conclusions are as follows:
(1) This paper proposes to use the HSMAAOA algorithm to solve the flood control optimization operation problem of reservoir groups. The algorithm has few parameters, fast convergence speed, high solution accuracy, and effectively avoids the “dimension disaster” problem. This algorithm can also be applied to other engineering problems;
(2) The operation schemes solved in this paper do not exceed the control flow of the Huayuankou section. The peak clipping rates of the three dispatching schemes are 52.9% (HSMAAOA), 48.69% (SMA), and 47.55% (PSO), respectively. The results show that HSMAAOA algorithm has the highest peak clipping rate and is superior to other algorithms. The solution proposed in this paper effectively guarantees the safety of the Huayuankou section;
(3) When calculating the flood routing in this paper, due to the difficulty of modeling the hydrodynamic model and the lack of actual topographic data, it is impossible to build the hydrodynamic model. Next, we will continue to collect topographic data of the study area and further study the coupling model of hydrodynamics and the optimal operation model of reservoirs.

Author Contributions

Conceptualization, J.H. and X.G.; Methodology, H.C. and F.C.; Software, F.C., S.L., H.Z. and W.Z.; Data curation, H.C.; Writing–original draft, J.H. and X.G.; Writing–review & editing, S.W. All authors have read and agreed to the published version of the manuscript.

Funding

The authors are grateful to the project of key science and technology of the Henan province (No: 222102320333).

Institutional Review Board Statement

Not applicable.

Informed Consent Statement

Not applicable.

Data Availability Statement

Data is unavailable.

Conflicts of Interest

The authors declare no conflict of interest.

References

  1. Hao, T.; Hua-li, S.; Wei-bin, C.; Ya-ji, Z. Flood Control Strategies and Measures in the Lower Yellow River. Yellow River 2013, 35, 3. [Google Scholar]
  2. Zhu, F.; Zhong, P.-A.; Xu, B.; Wu, Y.-N.; Zhang, Y. A multi-criteria decision-making model dealing with correlation among criteria for reservoir flood control operation. J. Hydroinformatics 2016, 18, 531–543. [Google Scholar] [CrossRef]
  3. Su, C.; Wang, P.; Yuan, W.; Cheng, C.; Zhang, T.; Yan, D.; Wu, Z. An MILP based optimization model for reservoir flood control operation considering spillway gate scheduling. J. Hydrol. 2022, 613, 128483. [Google Scholar] [CrossRef]
  4. Pan, Z.; Chen, L.; Teng, X. Research on joint flood control operation rule of parallel reservoir group based on aggregation-decomposition method. J. Hydrol. 2020, 590, 125479. [Google Scholar] [CrossRef]
  5. Meng, X.; Chang, J.; Wang, X.; Wang, Y.; Wang, Z. Flood control operation coupled with risk assessment for cascade reservoirs. J. Hydrol. 2019, 572, 543–555. [Google Scholar] [CrossRef]
  6. Gang, Z.; Jianzhong, Z.; Xin, Y.; Wei, F.; Ling, D.; Quansen, W.; Xiaoling, D. Modeling and Solving of Joint Flood Control Operation of Large-Scale Reservoirs: A Case Study in the Middle and Upper Yangtze River in China. Water 2020, 13, 41. [Google Scholar]
  7. Hao, W.; Xu, W.; Xiaohui, L.; Weihong, L.; Chao, W.; Jia, W. The development and prospect of key techniques in the cascade reservoir operation. J. Hydraul. Eng. 2019, 13, 41. [Google Scholar]
  8. Zhu, D.; Mei, Y.; Xu, X.; Liu, Z. Triple parallel progressive optimality algorithm for optimal operation of the complicated flood control system. J. Hydraul. Eng. 2020, 51, 13. [Google Scholar]
  9. Shuzhen, Y.; Dongguo, S.; Bingjun, L. Research on optimal flood dispatching model for multi-reservoir. J. Wuhan Univ. Eng. Ed. 2002, 35, 5. [Google Scholar]
  10. Cervellera, C.; Chen, V.C.P.; Wen, A. Optimization of a large-scale water reservoir network by stochastic dynamic programming with efficient state space discretization. Eur. J. Oper. Res. 2006, 171, 1139–1151. [Google Scholar] [CrossRef]
  11. Zhao, T.; Zhao, J.; Lei, X.; Wang, X.; Wu, B. Improved Dynamic Programming for Reservoir Flood Control Operation. Water Resour. Manag. 2017, 31, 2047–2063. [Google Scholar] [CrossRef]
  12. Senlin, C.; Dan, L.; Xiangming, T.; Yuhao, H. Development and application of a compensative regulation linear programming model for reservoir flood-control. Adv. Water Sci. 2017, 28, 8. [Google Scholar] [CrossRef]
  13. Yang, Z.; Zheng, H.; Feng, S.; Chen, C.; Wang, J. Optimal multireservoir operation for flood control under constrained operational rules. J. Flood Risk Manag. 2022, 15, e12825. [Google Scholar] [CrossRef]
  14. Yanfang, D.; Chengmin, W.; Hao, W.; Yanli, L. Construction and Application of Reservoir Flood Control Operation Rules Using the Decision Tree Algorithm. Water 2021, 13, 3654. [Google Scholar]
  15. Xu Lingjie, D.Z.; Xiao, J.; Li, Y.; Shi, R.; Liu, W. Optimal Operation of Flood Control for Reservoir Group Based on Improved Genetic Algorithm. Water Resour. Power 2018, 36, 5. [Google Scholar]
  16. Momtahen, S.; Dariane, A.B. Direct Search Approaches Using Genetic Algorithms for Optimization of Water Reservoir Operating Policies. J. Water Resour. Plan. Manag. 2007, 133, 202–209. [Google Scholar] [CrossRef]
  17. Kosasaeng, S.; Yamoat, N.; Ashrafi, S.M.; Kangrang, A. Extracting Optimal Operation Rule Curves of Multi-Reservoir System Using Atom Search Optimization, Genetic Programming and Wind Driven Optimization. Sustainability 2022, 14, 16205. [Google Scholar] [CrossRef]
  18. Xue, B.; Xie, Y.; Liu, Y.; Li, A.; Zhao, D.; Li, H. Optimization of Reservoir Flood Control Operation Based on Multialgorithm Deep Learning. Comput. Intell. Neurosci. 2022, 2022, 4123421. [Google Scholar] [CrossRef]
  19. Ren, M.; Zhang, Q.; Yang, Y.; Wang, G.; Xu, W.; Zhao, L. Research and Application of Reservoir Flood Control Optimal Operation Based on Improved Genetic Algorithm. Water 2022, 14, 1272. [Google Scholar] [CrossRef]
  20. He, Y.; Xu, Q.; Yang, S.; Li, L. Reservoir flood control operation based on chaotic particle swarm optimization algorithm. Appl. Math. Model. 2014, 38, 4480–4492. [Google Scholar] [CrossRef]
  21. Chen, H.T.; Wang, W.C.; Chen, X.N.; Qiu, L. Multi-objective reservoir operation using particle swarm optimization with adaptive random inertia weights. Water Sci. Eng. 2020, 13, 136–144. [Google Scholar] [CrossRef]
  22. Ahmadianfar, I.; Khajeh, Z.; Asghari-Pari, S.-A.; Chu, X. Developing optimal policies for reservoir systems using a multi-strategy optimization algorithm. Appl. Soft Comput. 2019, 80, 888–903. [Google Scholar] [CrossRef]
  23. Wan, F.; Yuan, W.; Huang, Q. Application of particle swarm optimization and immune evolutionary algorithm to optimal operation of cascade reservoirs. J. Hydroelectr. Eng. 2010, 6, 202–206. [Google Scholar]
  24. Tao, C.H.; Chuan, W.W.; Wing, C.K.; Lei, X.; Ji, H. Flood Control Operation of Reservoir Group Using Yin-Yang Firefly Algorithm. Water Resour. Manag. 2021, 35, 5325–5345. [Google Scholar]
  25. Li, S.; Chen, H.; Wang, M.; Heidari, A.A.; Mirjalili, S. Slime mould algorithm: A new method for stochastic optimization. Future Gener. Comput. Syst. 2020, 111, 300–323. [Google Scholar] [CrossRef]
  26. Heming, J.I.A.; Yuxiang, L.I.U.; Qingxin, L.I.U.; Shuang, W.A.N.G.; Rong, Z.H.E.N.G. Hybrid Algorithm of Slime Mould Algorithm and Arithmetic Optimization Algorithm Based on Random Opposition-Based Learning. J. Front. Comput. Sci. Technol. 2022, 16, 1182–1192. [Google Scholar]
  27. Tizhoosh, H.R. Opposition-Based Learning: A New Scheme for Machine Intelligence. In Proceedings of the International Conference on International Conference on Computational Intelligence for Modelling, Control & Automation, Vienna, Austria, 28–30 November 2005; pp. 695–701. [Google Scholar]
  28. Long, W.; Jiao, J.; Liang, X.; Cai, S.; Xu, M. A Random Opposition-Based Learning Grey Wolf Optimizer. IEEE Access 2019, 7, 113810–113825. [Google Scholar] [CrossRef]
  29. Abualigah, L.; Diabat, A.; Mirjalili, S.; Elaziz, M.A.; Gandomi, A.H. The Arithmetic Optimization Algorithm. Comput. Methods Appl. Mech. Eng. 2021, 376, 113609. [Google Scholar] [CrossRef]
  30. Gill, M.A. Flood routing by the Muskingum method. J. Hydrol. 1978, 36, 353–363. [Google Scholar] [CrossRef]
Figure 1. Schematic diagram of flood composition of the Huayuankou section.
Sustainability 15 00933 g001
Figure 2. Flood process of the Huayuankou section.
Sustainability 15 00933 g002
Figure 3. Operation process of Luhun reservoir.
Sustainability 15 00933 g003
Figure 4. Operation process of Guxian reservoir.
Sustainability 15 00933 g004
Figure 5. Operation process of Hekoucun reservoir.
Sustainability 15 00933 g005
Figure 6. Operation process of Sanmenxia reservoir.
Sustainability 15 00933 g006
Figure 7. Operation process of Xiaolangdi reservoir.
Sustainability 15 00933 g007
Table 1. Algorithm parameters.
AlgorithmParameters
HSMAAOAz = 0.03; µ = 0.499; α = 5
SMAz = 0.03
PSOc1 = 2; c2 = 2; vmax = 6; wmax = 0.9; wmin = 0.2
Table 2. Test results.
FunctionEvaluation IndicatorsHSMAAOASMAPSO
SphereMaximum value005.300 × 10−2
Minimum value004.000 × 10−3
Average value001.600 × 10−2
Standard deviation001.400 × 10−2
AckleyMaximum value8.882 × 10−168.882 × 10−163.534 × 100
Minimum value8.882 × 10−168.882 × 10−161.693 × 100
Average value8.882 × 10−168.882 × 10−162.635 × 100
Standard deviation005.500 × 10−1
GriewankMaximum value006.000 × 10−2
Minimum value001.000 × 10−3
Average value001.500 × 10−2
Standard deviation001.900 × 10−2
RastriginMaximum value003.768 × 101
Minimum value001.136 × 101
Average value002.642 × 101
Standard deviation007.012 × 100
SchwefelMaximum value1.772 × 10−23.207 × 10−23.200 × 10−2
Minimum value2.121 × 10−31.510 × 10−32.000 × 10−3
Average value9.001 × 10−31.400 × 10−21.400 × 10−2
Standard deviation5.038 × 10−31.151 × 10−21.200 × 10−2
LevyMaximum value5.680 × 10−53.028 × 10−42.646 × 100
Minimum value1.057 × 10−75.477 × 10−62.740 × 10−1
Average value1.322 × 10−59.540 × 10−51.158 × 100
Standard deviation1.971 × 10−58.853 × 10−56.340 × 10−1
Table 3. Reservoir characteristic parameters.
ParametersLuhunGuxianHekoucunSanmenxiaXiaolangdi
Flood limit water level (m)317527.3230307230
Flood control high water level (m)323548285.43335275
Flood control storage capacity (108 m3)2.134.822.359.7940.5
Table 4. Muskingum parameters.
ReachFlood Propagation TimeNumber of SegmentsKtX
Sanmenxia~Xiaolangdi823.87540.2
Xiaolangdi~Huayuankou1234.56740.3
Luhun~Longmen631.82320.4
Longmen~Huangzhuang212.2520.3
Huangzhuang~Antan212.18220.3
Guxian~Changshui21220.5
Changshui~Yiyang63220.35
Yiyang~White Horse Temple631.5420.3
White Horse Temple~Xinzhai212.6120.35
Xinzhai~Heishiguan213.2220.3
Heishiguan~Huayuankou824.6140.4
Wulongkou~Liuzhuang632.54520.3
Liuzhuang~Wuzhi212.520.3
Wuzhi~Huayuankou414.5340.3
Table 5. Comparison of calculation results under different population sizes.
PopulationOptimal ValueWorst ValueAverage ValueStandard Deviation
5019,089.69 21,551.35 19,694.59 823.39
10018,772.00 20,394.21 19,452.60 517.02
15018,813.08 20,930.39 19,727.91 728.16
20019,197.58 20,818.06 19,830.21 531.26
Table 6. Comparison of peak clipping rates of different algorithms.
AlgorithmPeak Flow(m3/s)Peak Clipping Rate
No reservoir regulation39,854/
PSO20,90547.55%
SMA20,45148.69%
HSMAAOA18,77252.90%
Table 7. Joint operation results of reservoirs.
ReservoirStarting Water Level (m)End Water Level (m)Maximum Inflow (m3/s)Maximum Discharge Flow (m3/s)Peak Clipping Rate
Luhun317317.10 4900258547.24%
Guxian527.3527.85 10,120400060.47%
Hekoucun230230.05 2336202513.31%
Sanmenxia307307.64 12,63810,95413.32%
Xiaolangdi230250.09 28,41210,82061.92%
Disclaimer/Publisher’s Note: The statements, opinions and data contained in all publications are solely those of the individual author(s) and contributor(s) and not of MDPI and/or the editor(s). MDPI and/or the editor(s) disclaim responsibility for any injury to people or property resulting from any ideas, methods, instructions or products referred to in the content.

