1. Introduction
During the last decades, rapid urbanization [
1] has led to a significant increase in electricity and heating demand, resulting in the deterioration of air quality [
2]. In the past, many researchers have tried to study the impact of rapid urbanization and urban expansion on air quality and to identify and assess reliable methodological approaches for mitigating high air pollution levels [
2,
3,
4,
5]. The current study focuses on particulate matter (PM) pollution, which is a predominant environmental problem in most urban centers [
6], and its mitigation through an application of a comprehensive methodological approach.
PM pollution is a major threat to the natural and human environment since it causes adverse effects on human health and ecosystems [
6,
7,
8,
9]. It has been shown that PM has negative impacts on the cardiovascular and respiratory systems [
10,
11] and they have been associated with premature mortality [
12].
For this reason, the European Union (EU) focuses on measures and policies for reducing particle pollution. For instance, according to the European Green Deal’s Zero Pollution Action Plan [
13], a reduction of the number of premature deaths caused by fine particulate matter (PM
2.5) by at least 55% is targeted by 2030 compared to 2005 levels. Moreover, EU Air Quality Directives aim to protect health, vegetation, and natural ecosystems by setting limits and target values for particulate matter levels [
14].
In 2020, according to the European Environment Agency, 11% of the citizens of the 27 EU countries were exposed to PM
10 levels above the EU standards [
15]. Other previous studies have revealed the problem of PM
10 exceedances in the Mediterranean area [
16,
17]. In addition, it should be noted that road traffic has been reported as the major contributor to exceedances of air quality standards in western and northern Europe while in southern and eastern Europe, residential heating is identified as the most important emissions source contributing to PM
10 exceedances [
18].
It has been shown that road traffic and residential heating are significant emission sources of aerosols in urban areas of Greece [
19] while an increase in biomass burning (e.g., wood, pellets) for heating purposes has been shown since the onset of the financial crisis in Greece [
20,
21,
22,
23]. Moreover, it has been found that more than 95% of PM
10 are attributed to biomass burning [
12] in urban areas during the wintertime. The current study focuses on Thessaloniki, Greece, which is located on the Thermaic Gulf at the northwest part of the Aegean Sea. Thessaloniki is the second largest city of Greece with 1,091,424 inhabitants in the greater metropolitan area (about 850 residents/km
2), according to the 2021 census, representing a 7.6% share of the national population. The metropolitan area of Thessaloniki is considered as the most important economic, industrial, administrative, and cultural center of Northern Greece [
24].
In the previous years, the use of biomass for heating purposes was banned in the metropolitan areas of Athens and Thessaloniki. However, the decision to lift the ban on the use of biomass in the prefectures of Attica and Thessaloniki in 2011, prompted citizens to extensively use fireplaces, heaters, and biomass-wood boilers, wrongly cultivating the impression that these fuels are environmentally friendly. As a result of this misinformation and the long and deep financial crisis, there has been a significant increase in exceedances during the winter season.
Many studies in the past have investigated the air pollution problem of the city [
6,
20,
25,
26,
27,
28,
29]. According to the air quality measurements of the National Air Pollution Monitoring Network, the number of days in 2019 with an average daily value of PM
10 exceeding the EU limit value (50 μg/m
3) in the city center (Agia Sofia urban/residential station) was higher than the maximum allowed (35 days), reaching up to 88 days in total, of which 21 days were attributed to dust transport from desert areas. For this reason, the European Commission, in December of 2020, decided to refer Greece to the Court of Justice of the European Union regarding poor air quality due to high levels of PM
10 [
30].
The current study has been conducted in the framework of the project “Implementation Study to address PM10 Levels Exceedances in the city of Thessaloniki” of the Natural Environment and Climate Change Agency (NECCA) under the Hellenic Ministry of Environment and Energy. The main aim of the project was the identification of the most appropriate measures and policies to combat particulate air pollution in the city of Thessaloniki, where PM10 levels continuously exhibit exceedances of the mean 24 h EU limit value in order to address the problem and put an end to the infringement in question. Moreover, the contribution of various emissions sources to the measured PM10 concentrations was reviewed and complementary measures were considered. For all the proposed measures, their contribution to the reduction of particulate matter PM10 emissions and the respective concentrations over a specific time horizon was quantified, namely by 2025.
The main goal of the study is to propose cost-efficient policies and measures in order to eliminate the number of exceedances of PM
10 levels in an urban area through a methodology including the calculation of emissions by sector and the application of an air quality modeling system. Moreover, the study aims to provide to the scientific community, a comprehensive methodological approach for identifying the most cost-effective policies that can be implemented in any other urban area facing similar air quality issues. The main outcomes of the study shall raise the awareness of environmental stakeholders and local authorities, and they could be used as a role model for other big cities. Furthermore, the quantification of the mitigation effect of the proposed measures will promote decision making by assisting the selection of informed policy choices and the justification of budget allocation. It will also facilitate public awareness and broader acceptance and support by all stakeholders; and it could be used as feedback mechanism of the policy appraisal and evaluation cycle that allows the periodic performance tracking and assessment of the effectiveness of these policies and actions [
31].
In the current paper, the methodological approach for the current situation of particle pollution (including input data, emissions calculations, air quality modeling application) as well as the description of the proposed mitigation measures and policies, in addition to the description of the emissions mitigation scenarios implemented in the air quality modeling, are presented in
Section 2. In
Section 3, the results of the study for the base case scenario (i.e., current situation of particle pollution, evaluation of existing measures) and the results of the application of the modeling system for the proposed mitigation scenarios are presented and discussed in detail. The main outcomes of the study are summarized in
Section 4.
2. Materials and Methods
In the context of the elaboration of this work, the following methodological approach was adopted: (i) recognition of the current situation; (ii) identification of pollution source emissions contributions and correlation with particulate levels; (iii) application of atmospheric models to describe the current situation; (iv) evaluation of the existing measures related to the reduction of PM10 as provided for in the National Air Pollution Control Programme (NAPCP) and the Operational Plan for the Management of Air Pollution in the Region of Central Macedonia, the definition and assessment of additional measures to reduce particulate levels, and the development and evaluation of alternative scenarios; (v) application of atmospheric models for the prevailing alternative scenarios and assessment of the expected reductions in PM10 concentrations; and (vi) finalization and preparation of the action plan.
2.1. Current Situation
This study is firstly based on the identification of the current situation, in terms of PM10 emissions and the corresponding air quality levels occurring, the investigation and analysis of the potential relations between local sources and PM10 levels, and the application of an atmospheric modeling system to describe the current situation as well as the expected conditions if local emissions are eliminated.
Finally, emission calculations and the monitoring data used covered the period 2018–2020, whereas 2019 was selected as the base year for the modeling work, to avoid discrepancies and inconsistencies related to effects of the pandemic [
32,
33,
34] and to ensure the depiction of the typical situation.
2.1.1. Collection of Input Data
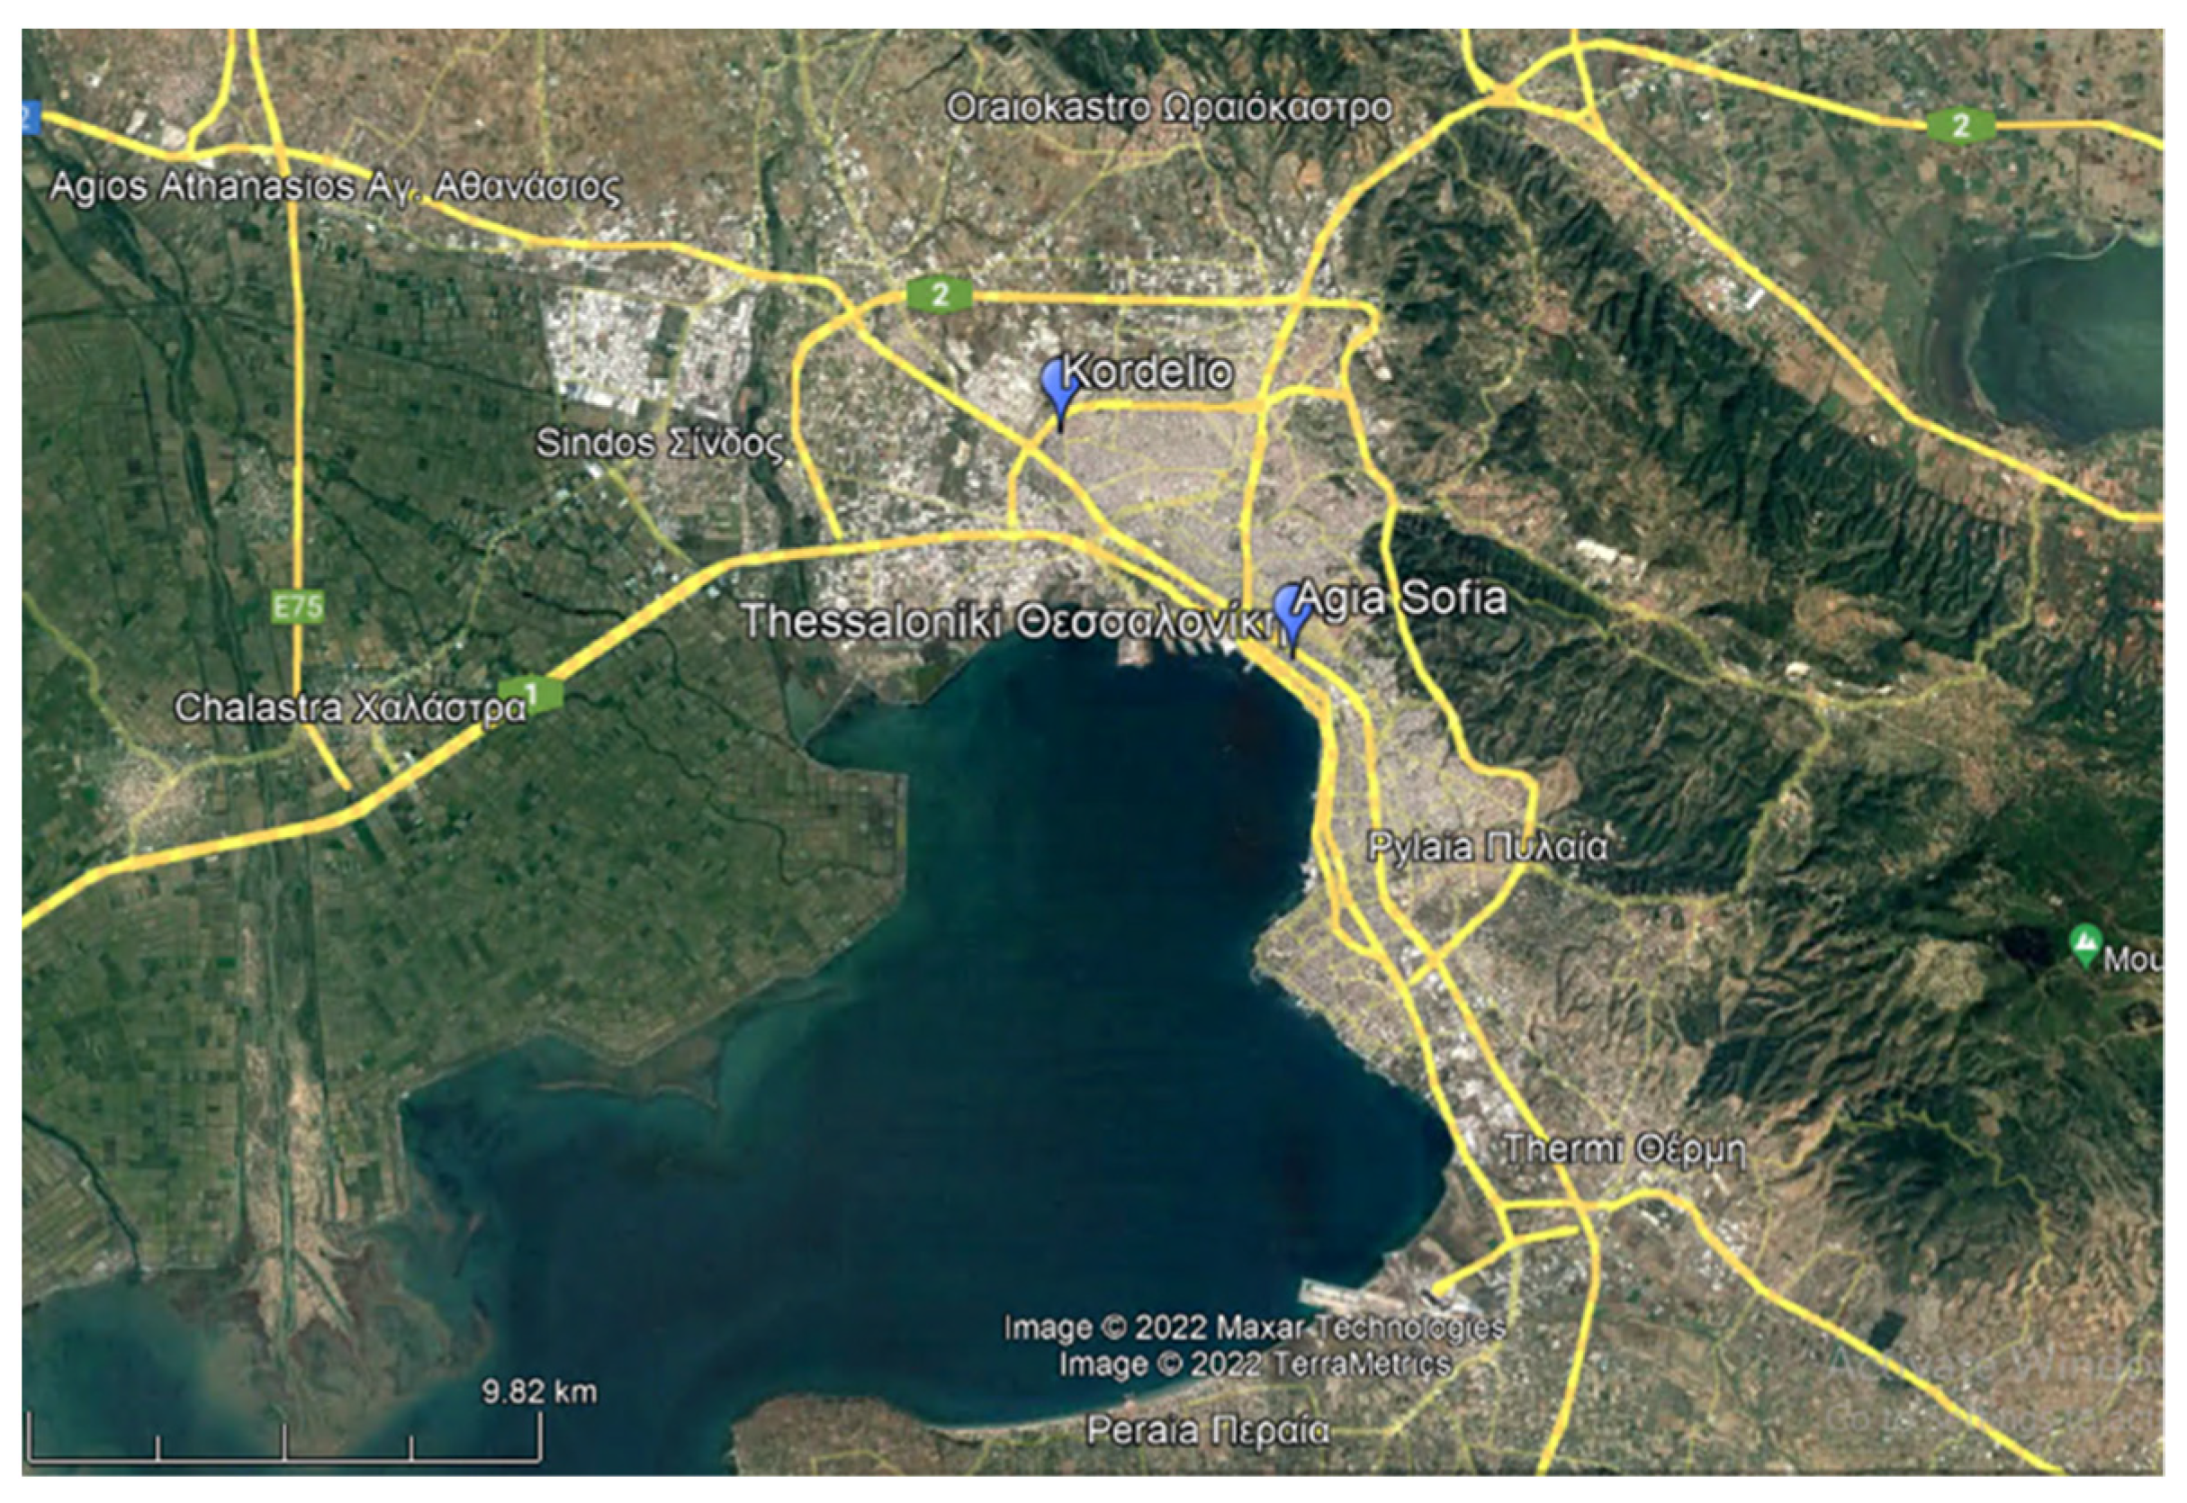
In the present work, mean hourly PM
10 concentration measurements at two monitoring stations of (a) Agia Sofia in the Centre of Thessaloniki, and (b) Kordelio in the western suburbs (
Figure 1), were acquired, as they reveal persistent exceedances. Both monitoring stations belong to the National Air Pollution Monitoring Network (NAPMN) and they are operated by the Region of Central Macedonia, under the inspection of the Ministry of Environment and Energy.
To calculate emissions, the data required include statistical fuel consumption for all fuel types per sector and usage (e.g., road traffic, navigation, heating, industry), provided by the Hellenic Ministry of the Environment and Energy (Directorate of Energy Policy and Energy Efficiency). Moreover, data to calculate road and marine traffic emissions were obtained from the Region of Central Macedonia and the National Inventory of Greece under the National Emissions Ceiling (NEC) Directive, whereas air traffic data were obtained from the Hellenic Civil Aviation Authority (HCAA) [
35].
2.1.2. Emission Calculations and Sources Contribution
PM
10 emissions from residential, commercial, industrial, and agricultural sectors, as well as from road traffic, navigation, and construction sites, are calculated by using methodologies [
22] applied in the Greek National Inventory under the NEC Directive [
36] for 2019.
Road traffic emissions were assessed by applying Tier 3 methodology through the use of the last version of COPERT V [
37]. The vehicle fleet composition and stock, as well as the driving characteristics for the area of study were also used. In particular, the total number of private passenger vehicles is around 600,000, whereas light-duty vehicles (LDVs) account for 109.000, and the number of heavy-duty vehicles (HDVs) and buses is much lower, around 25,000. The number of total road motor vehicles per 1000 inhabitants is 706 and the vehicle kilometers (vkm) driven in the area are 6 × 10
9 kms yearly.
Emissions from heating were estimated by adopting Tier 2 methodology [
38] while considering the mean monthly fuel consumption per fuel type (i.e., gas oil, natural gas, and biomass) and technology of combustion. Fuel consumption data per Greek prefecture for gas, oil, and natural gas for the residential and commercial sector were derived from the Hellenic Statistical Authority, the Greek Ministry of Environment and Energy, and the Gas Distribution Company Thessaloniki—Thessalia SA. Biomass consumption data (fuelwood and pellets) on a national level were provided by the Center for Renewable Energy Sources and Saving (
www.cres.gr, accessed on 1 December 2022). The biomass consumption in Thessaloniki was estimated based on the percentage contribution of consumption of conventional fuels (for Thessaloniki prefecture) to the total national conventional fuel consumption.
Emissions from aviation were calculated by applying the Tier 3 approach, based on the use of energy consumption and air traffic data. The data on energy consumption derive from the national energy balance and EUROCONTROL, while data on LTOs (landing and take-off cycles) are provided by the Hellenic Civil Aviation Organization and EUROCONTROL database for the year 2019 [
39]. For 2019, the number of flights was 20,665 and the number of passengers 2,164,242.
Maritime transport emissions were calculated with the detailed (Tier 3) methodology [
38] and activity data (e.g., marine fuel consumption data) provided by the Thessaloniki Port Authority.
Finally, the determination of agriculture, industrial, and construction emissions was conducted by applying the methodology foreseen for each sector in the National Emission Inventory under the NEC Directive [
38].
2.1.3. Data Analysis and Modeling Procedure
Emission results were analyzed in comparison to the corresponding PM10 concentration levels. Since exceedances arise during wintertime, the analysis of PM10 concentrations focused on this period and a comparison was carried out to the corresponding biomass consumption, the main contributor of PM10 emissions. To this end, a linear regression model was developed to investigate and evaluate the potential relationship between PM10 concentrations and biomass consumption. If a statistically significant relationship is established between the parameters examined, then it can be applied to estimate the reductions expected as a result of the corresponding emissions reduction due to biomass burning.
To ensure that no other parameters, such as wind speed and ambient temperature, are involved in the variation of PM10 levels, the mean monthly values of both of these meteorological parameters were examined for the whole period of study, namely the cold period of 2018–2020, and no significant variability was identified.
Moreover, the use of mean monthly emissions and concentration values in the analyses conducted guarantees that no other non-linear factors interfere with concentration levels. Such factors include non-systemic phenomena, such as long-range transport, incidental events etc.
2.1.4. Air Quality Modeling Application: Base Case Scenario
An air quality modeling system is used for the estimation of PM levels over the greater area of Thessaloniki, which consists of the meteorological model Weather Research and Forecasting Model (WRF v4.1.2; [
24]), the Comprehensive Air Quality Model with extensions (CAMx v.6.4; [
40]), and the Natural Emissions Model (NEMO; [
41]). The modeling system of WRF-NEMO-CAMx has been presented and evaluated in detail in Liora et al. [
20] and has already been implemented and evaluated in other previous studies of air quality [
29,
42].
The air quality modeling system was applied over three two-way nesting domains with a horizontal resolution of 18, 6, and 2 km
2 covering Europe–North Africa–Middle East, the Mediterranean Region, and the greater area of Thessaloniki, Greece, respectively, as described in detail in Liora et al. [
8]. The modeling system was implemented for one week of the winter period of 2019 (22–28 January) and one week of the summer period of 2019 (15–21 August). These two weeks were selected as they have been characterized as representative in terms of typical meteorological conditions (temperature, wind speed, wind direction) since their corresponding values of the meteorological parameters were almost the same with the mean typical values of winter and summer, respectively.
For the application of the air quality modeling system, anthropogenic emissions of CO, NO
x, SO
2, NMVOCs, PM
10, and PM
2.5 from energy, industry, heating, fugitive sources, fuel transformation, road and non-road transport, waste treatment, and agriculture were used as input. Emissions have been estimated over the three domains. For European areas (except for Greece) and non-European countries, emissions have been estimated using the anthropogenic emissions databases Regional European Emissions version 2 of Copernicus Atmosphere Monitoring Service Information (CAMS-REGv2) [
43] and the Emissions Database for Global Atmospheric Research (EDGAR v.4.3.2) [
44], respectively. The aforementioned databases have been chemically, temporally, and spatially distributed into the study domains [
20]. Anthropogenic emissions over Greece and the greater area of Thessaloniki have been estimated based on the methodology described in
Section 2.1.2. It should be highlighted that heating emissions data are introduced in the modeling system in order to be temporally analyzed based on the WRF meteorology (i.e., air temperature) as described in Liora et al. [
20]. Moreover, the temporal analysis of most emissions sources was based on the temporal profiles derived from the CAMS-REGv5 database. In particular, the hourly distribution of road transport emissions was based on the HIT-CERTH traffic load hourly measurements along a main road axis of Thessaloniki as described in Liora et al., 2021 [
25]. Natural PM emissions from windblown dust and sea salt as well as biogenic volatile organic compounds (BVOCs) from vegetation have been estimated using the model NEMO, which is driven by the WRF meteorology.
2.2. Mitigation Measures and Policies
Based on the results of PM10 emissions and their relationship to corresponding concentrations, the emission reduction required to eliminate infringements was specified. In addition, mitigation measures and policies were appointed, considering, among others, the measures included in the national and regional air quality plans and the requirements arising from European conventions and Directives, among others. All potential measures and policies were evaluated in relation to their impact on PM10 emissions and the most cost-effective scenarios were determined.
Additionally, to confirm the effectiveness of the emission scenarios selected, the dispersion model was applied again to assess the anticipated reduction of PM10 levels after the application of the mitigation measures. Finally, based on the model results, the most efficient scenario was selected, in terms of PM10 reductions, to ensure that the exceedances will be eliminated.
3. Results and Discussion
3.1. Current Situation
3.1.1. PM exceedances in Thessaloniki
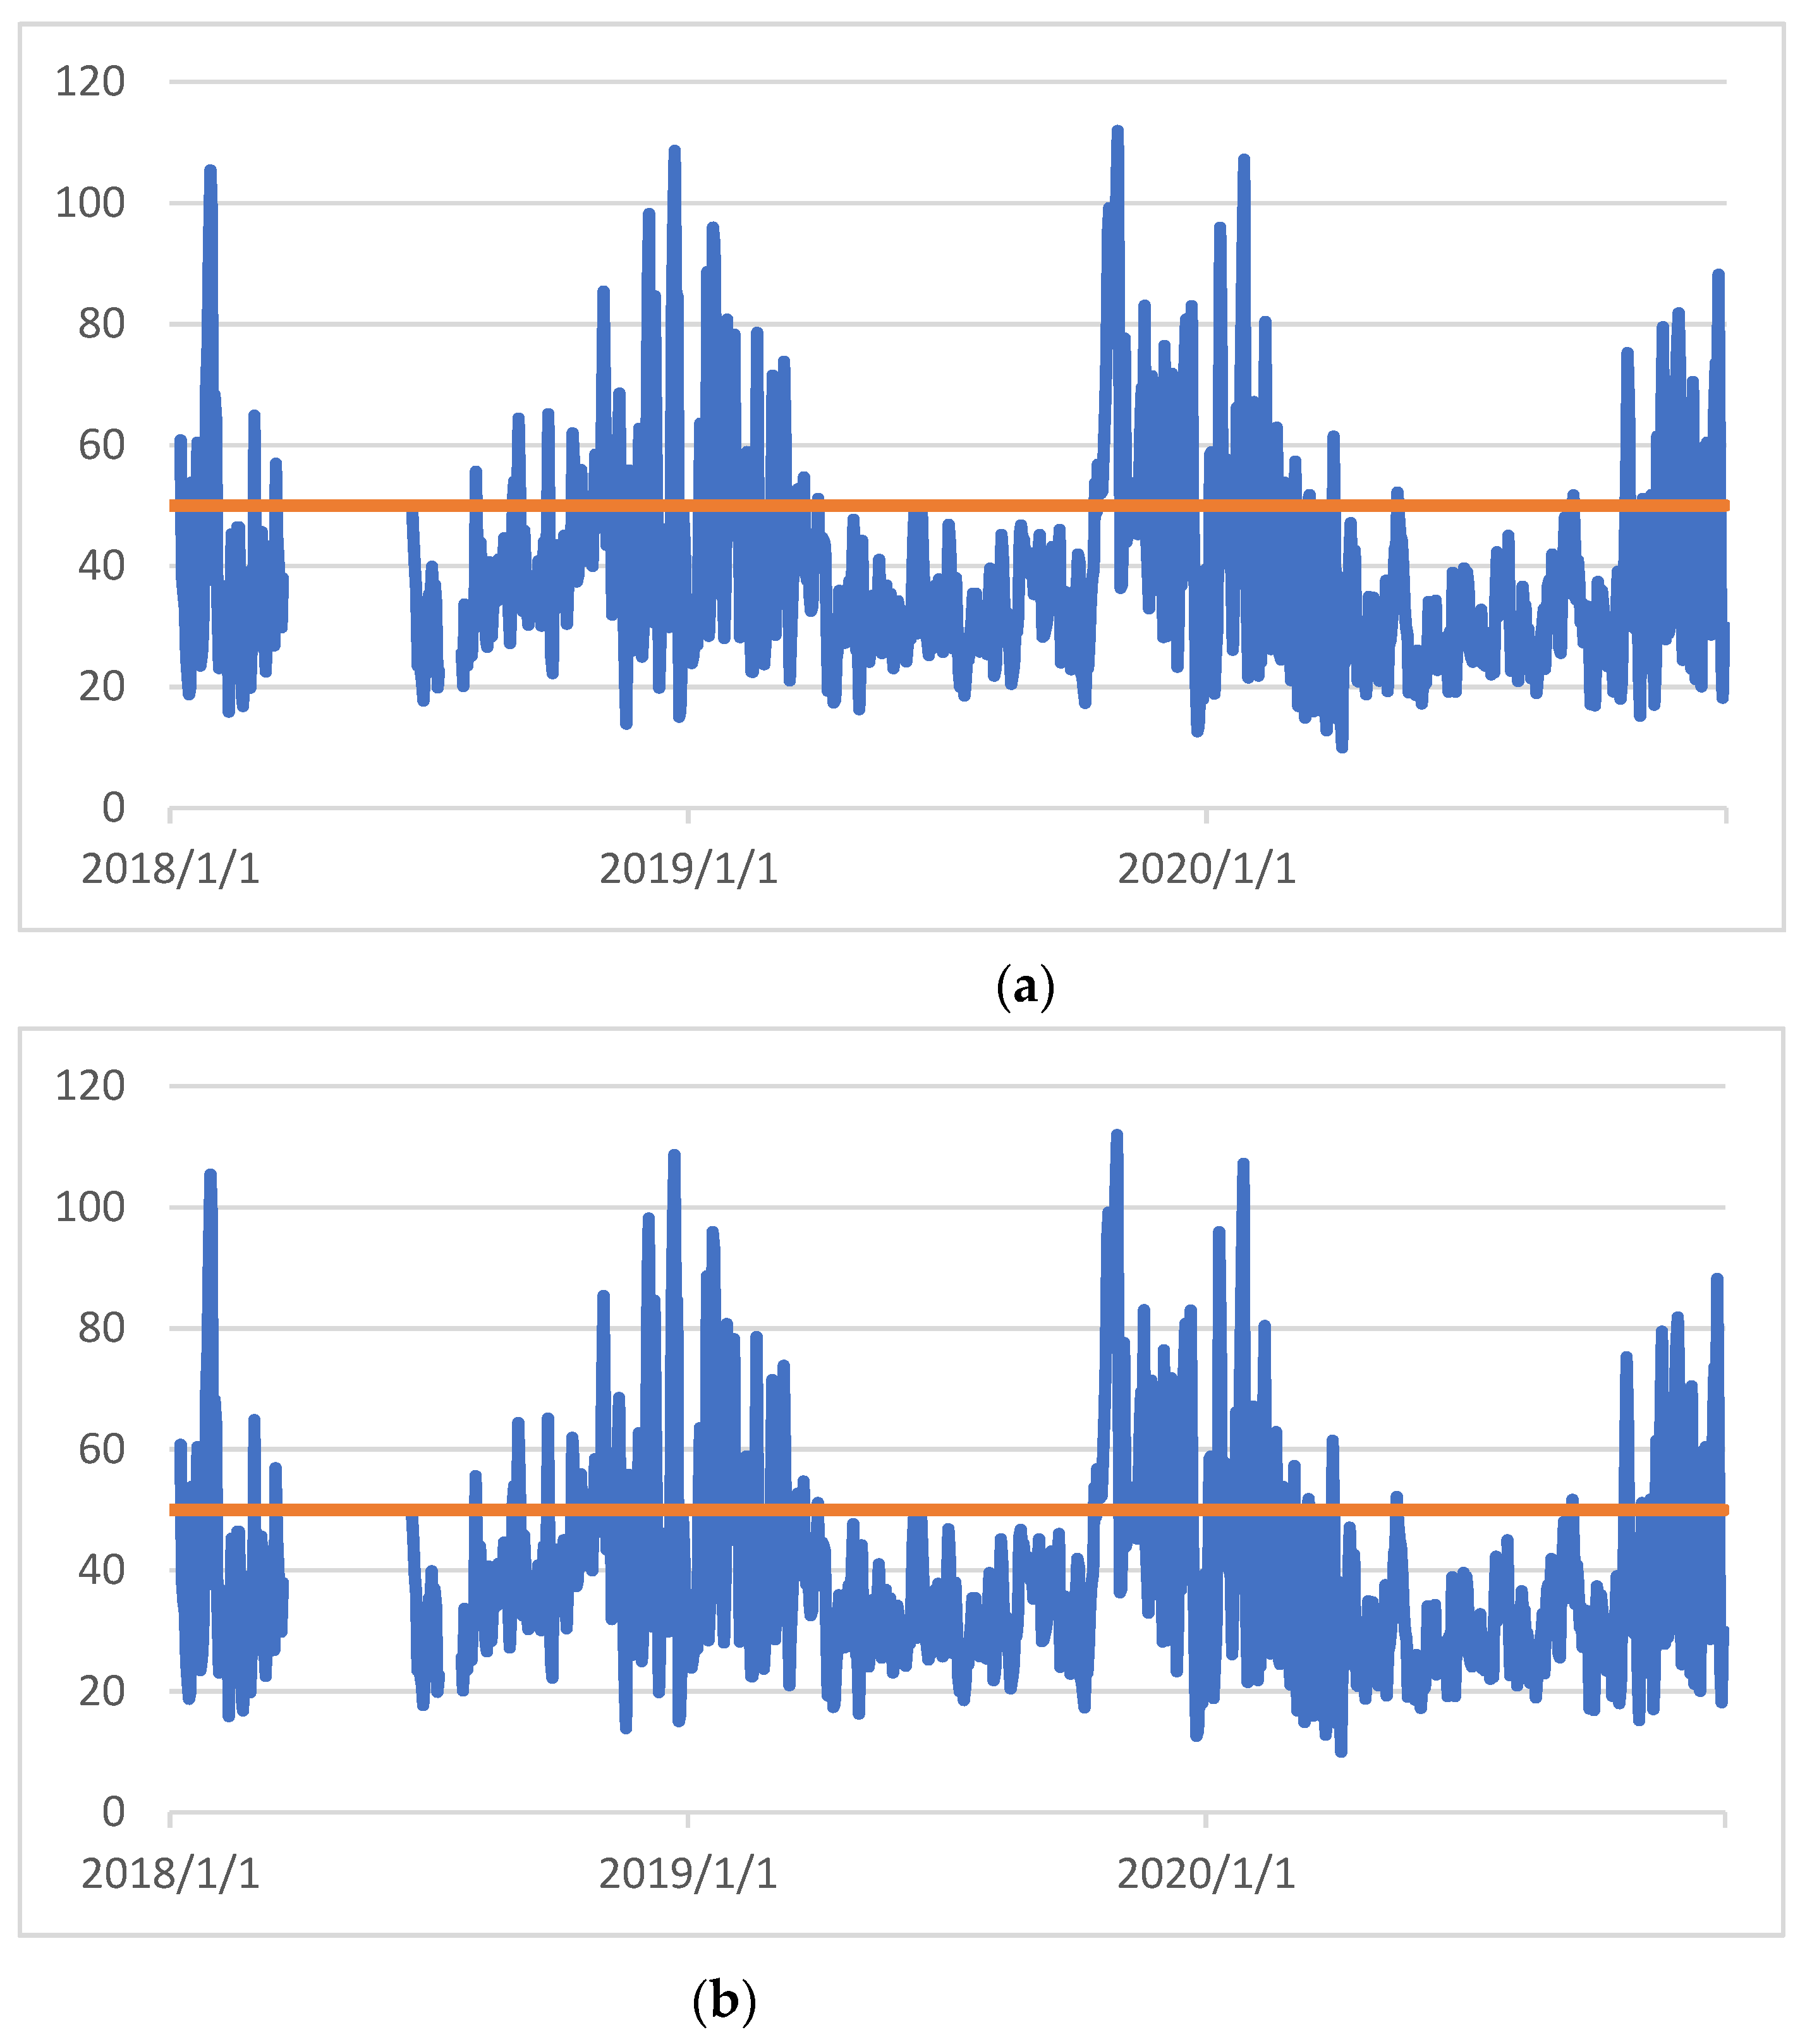
In general, concentrations of PM
10 are elevated, especially during the winter months. In
Figure 2a,b, the mean hourly concentrations of PM
10 for the years 2018–2020 are presented for both stations. Higher concentrations occur during the cold period, with mean monthly winter levels exceeding the corresponding mean monthly summer concentrations by 10–18 μg/m
3. Moreover, the exceedances occur almost exclusively during the winter months, particularly the coldest ones. It is worth noting that this emerging seasonal trend with higher concentrations in the cold season is not found at the Panorama station, a residential suburban station southeast of Thessaloniki, where the concentrations are either similar or higher during the warm season. This finding seems to indicate that local sources play the most important role in PM
10 levels in the agglomeration of Thessaloniki.
Table 1 and
Table 2 show the number of exceedances by month and year for the two stations.
3.1.2. Emissions of the Greater Thessaloniki Area—Source Contribution
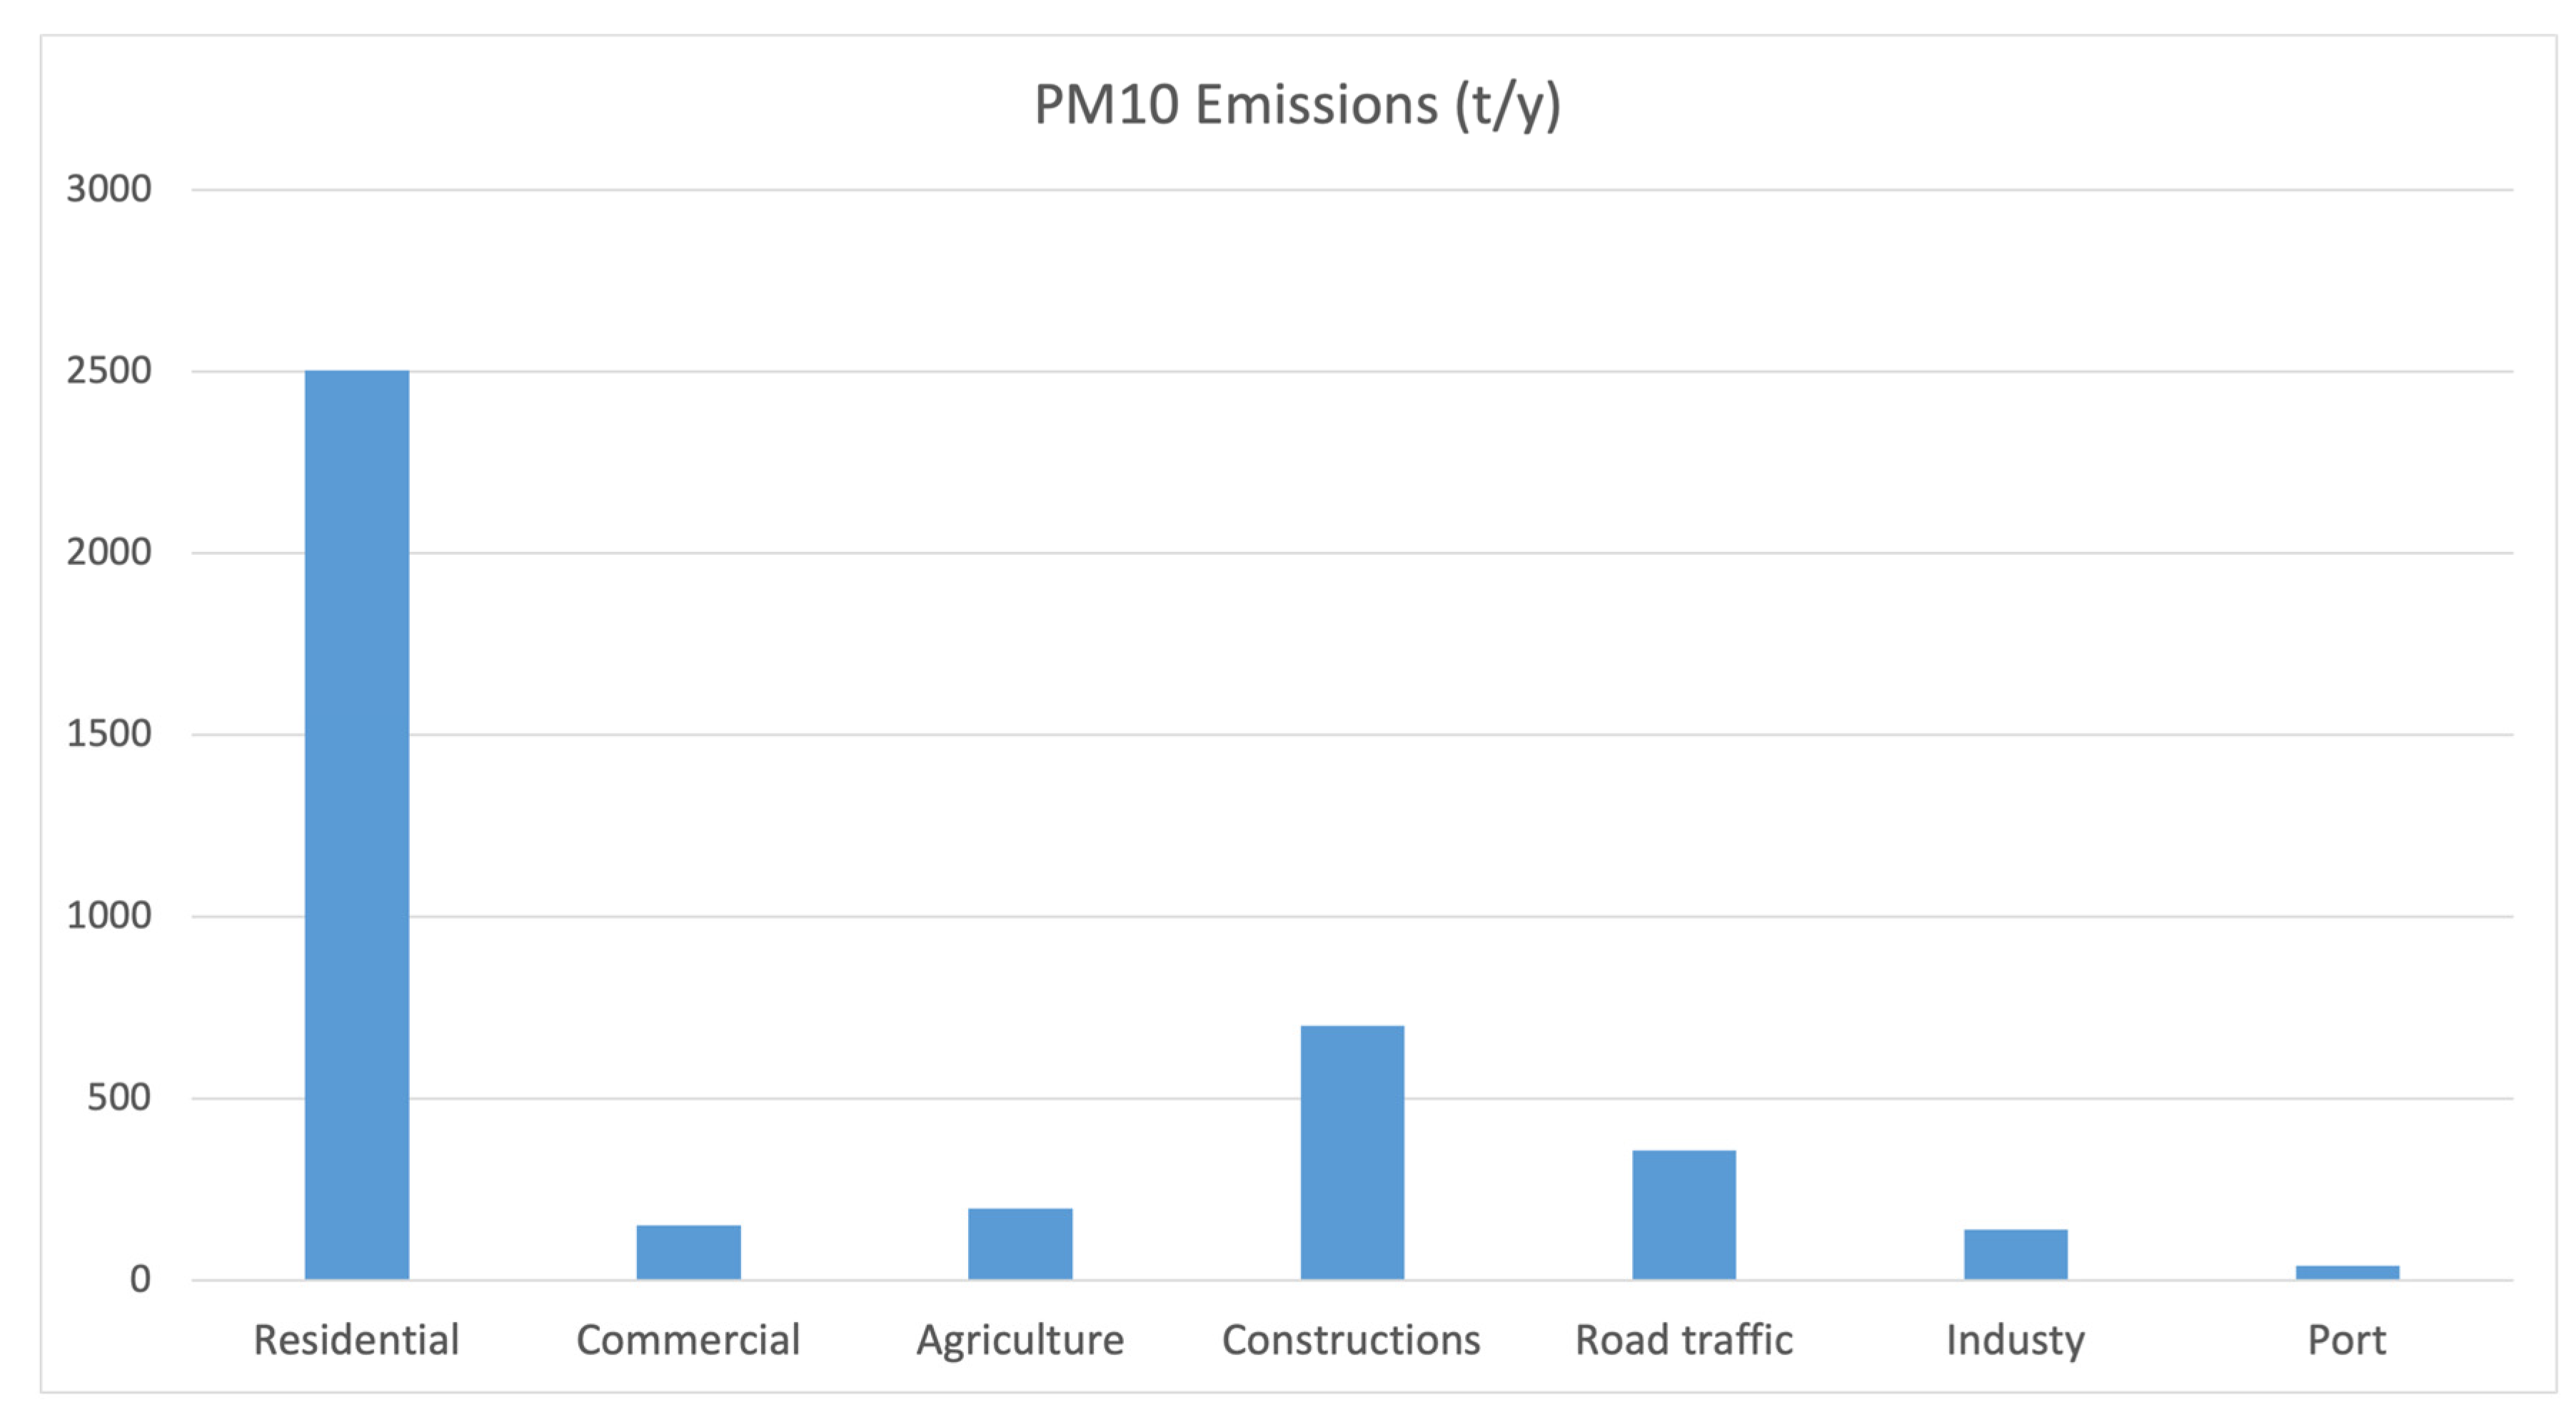
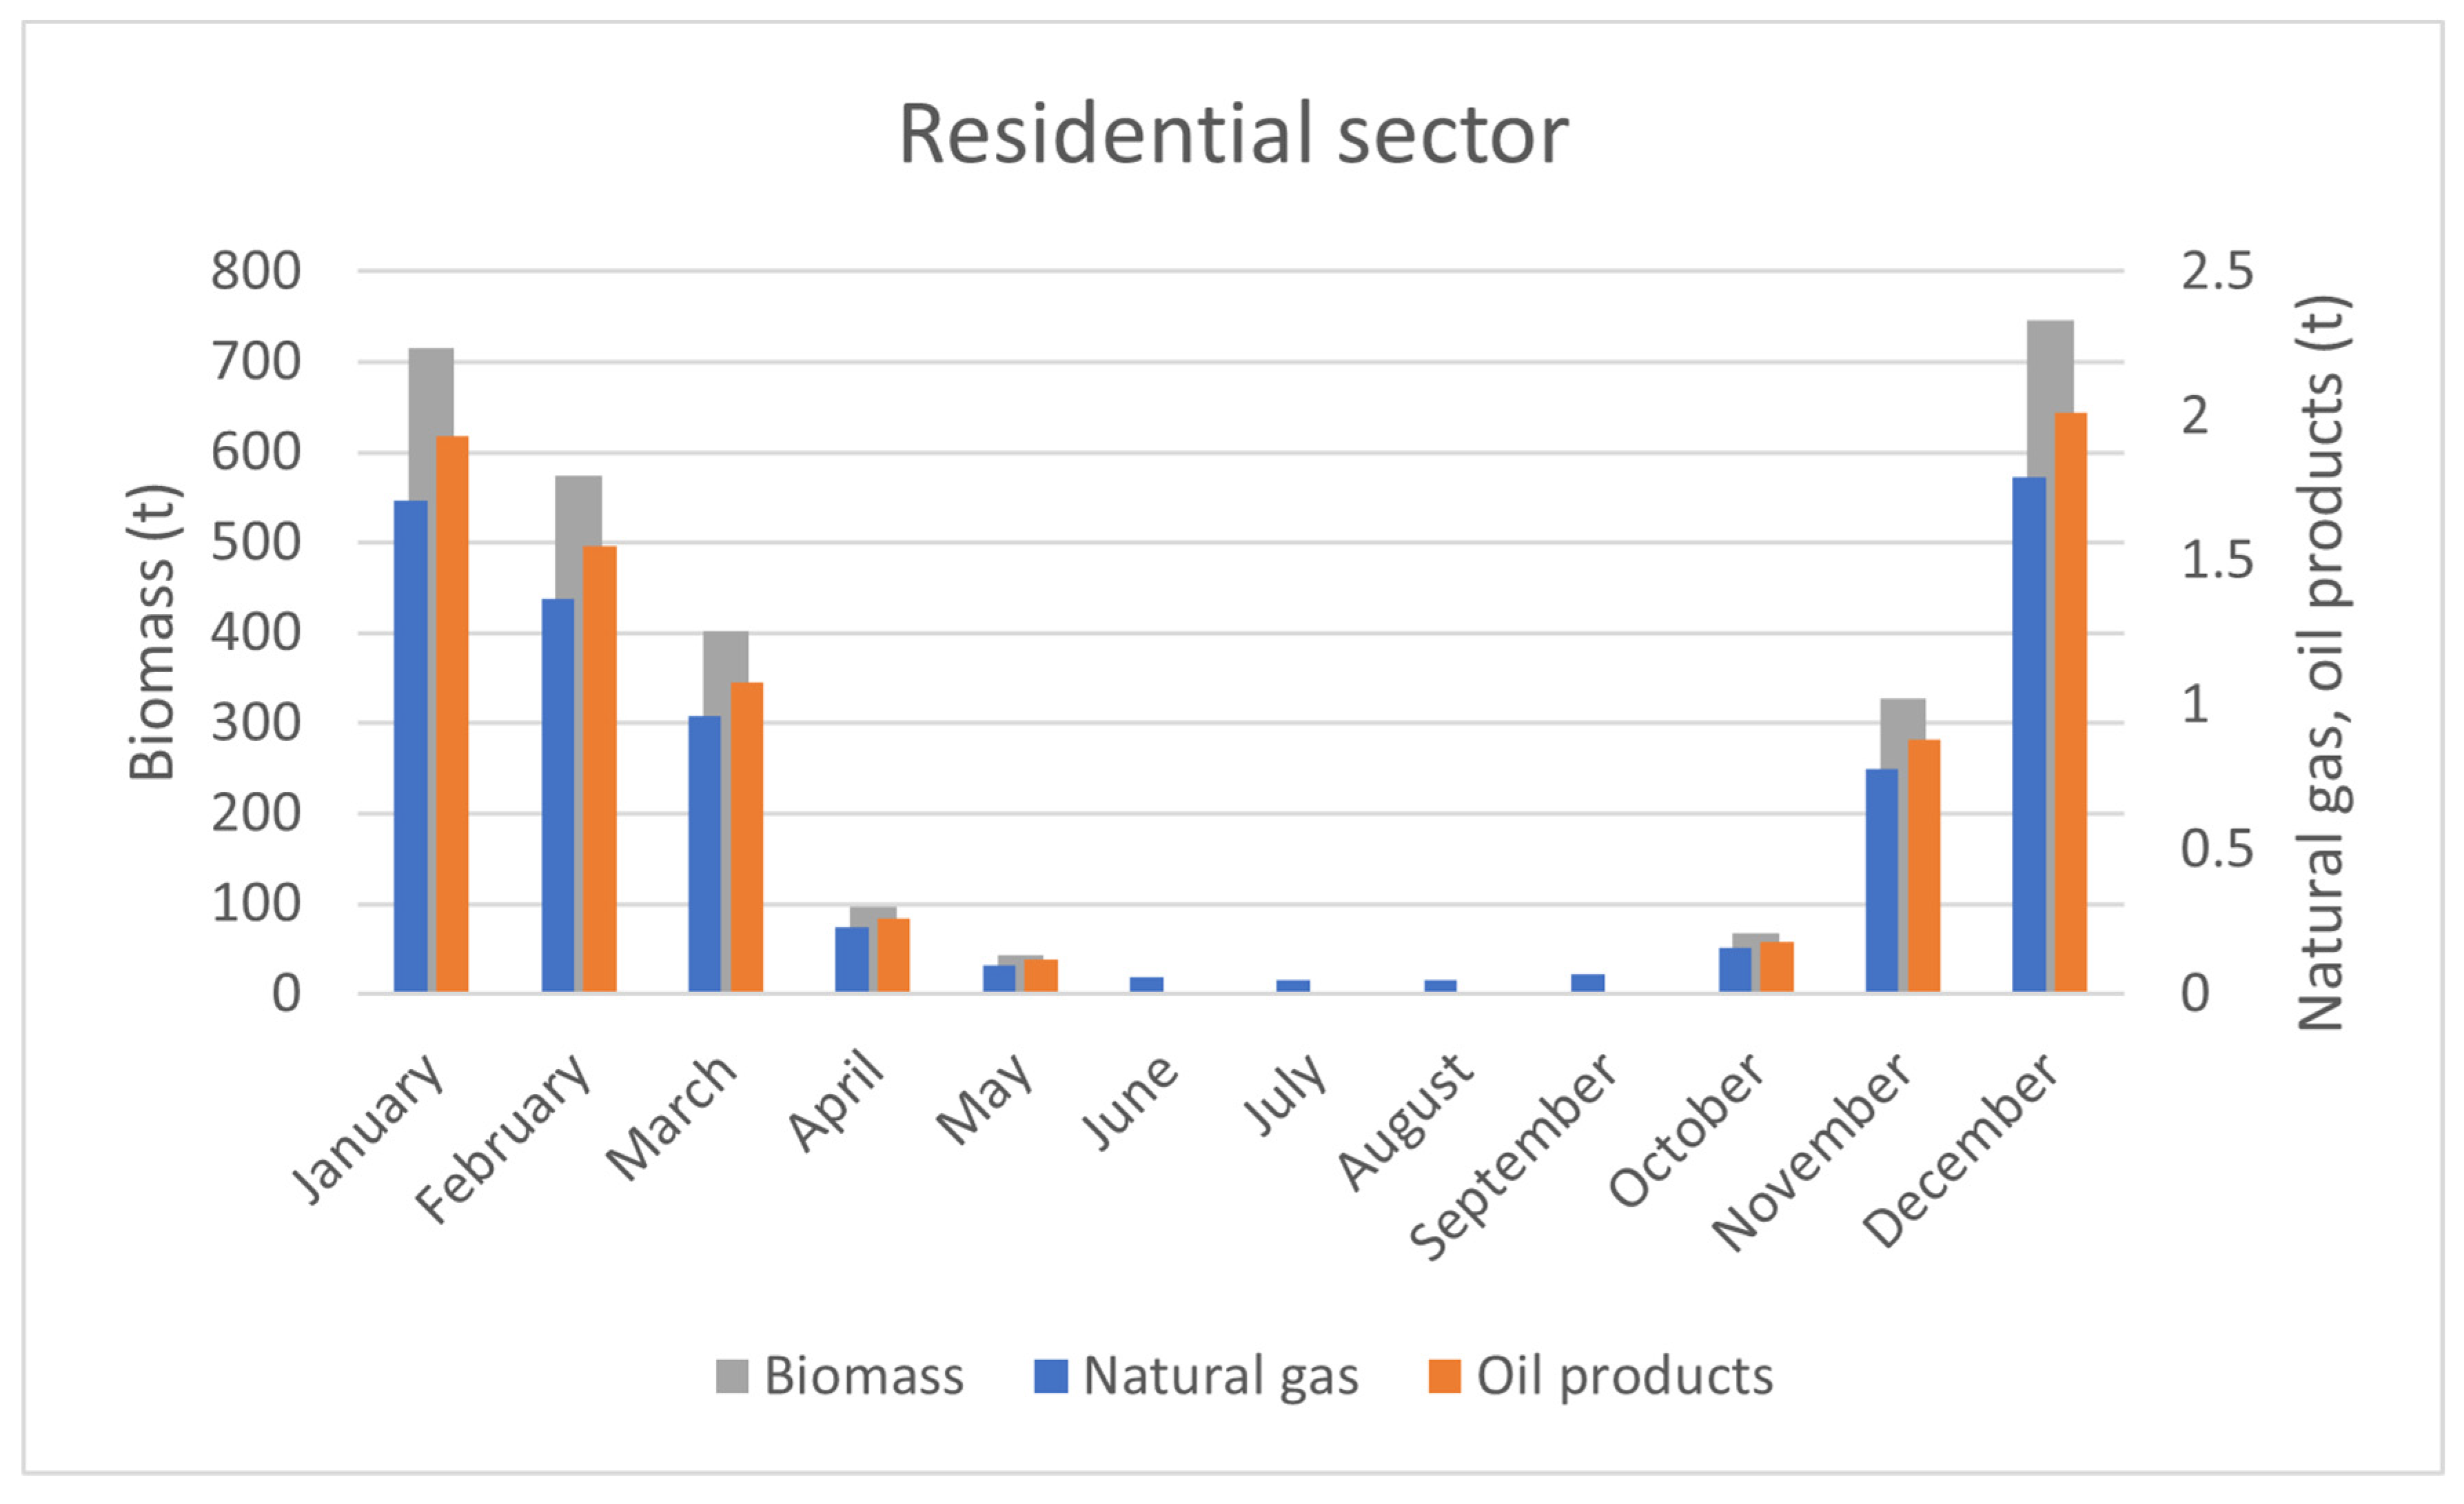
The most significant particulates emissions originate from residential heating. In winter, residential emissions contribute 73% of total PM
10 emissions (
Figure 3 and
Figure S1, in the supplement). Construction sites are the second most important PM
10 source, yet much lower than heating with an 11% contribution, due, among other things, to the ongoing Thessaloniki Metro construction works, which are foreseen to be completed in 2023. Road traffic is the third largest contributor (6%); however, it should be noted that in the city center, where traffic loads are intense, its contribution is much more important. Interestingly, 99.5% of the total emissions of the residential sector are attributed to biomass burning, showing that heating with biomass burning is responsible for the very high emissions in Thessaloniki (
Figure 4). The monthly variation of PM
10 emissions from the other sources is presented in
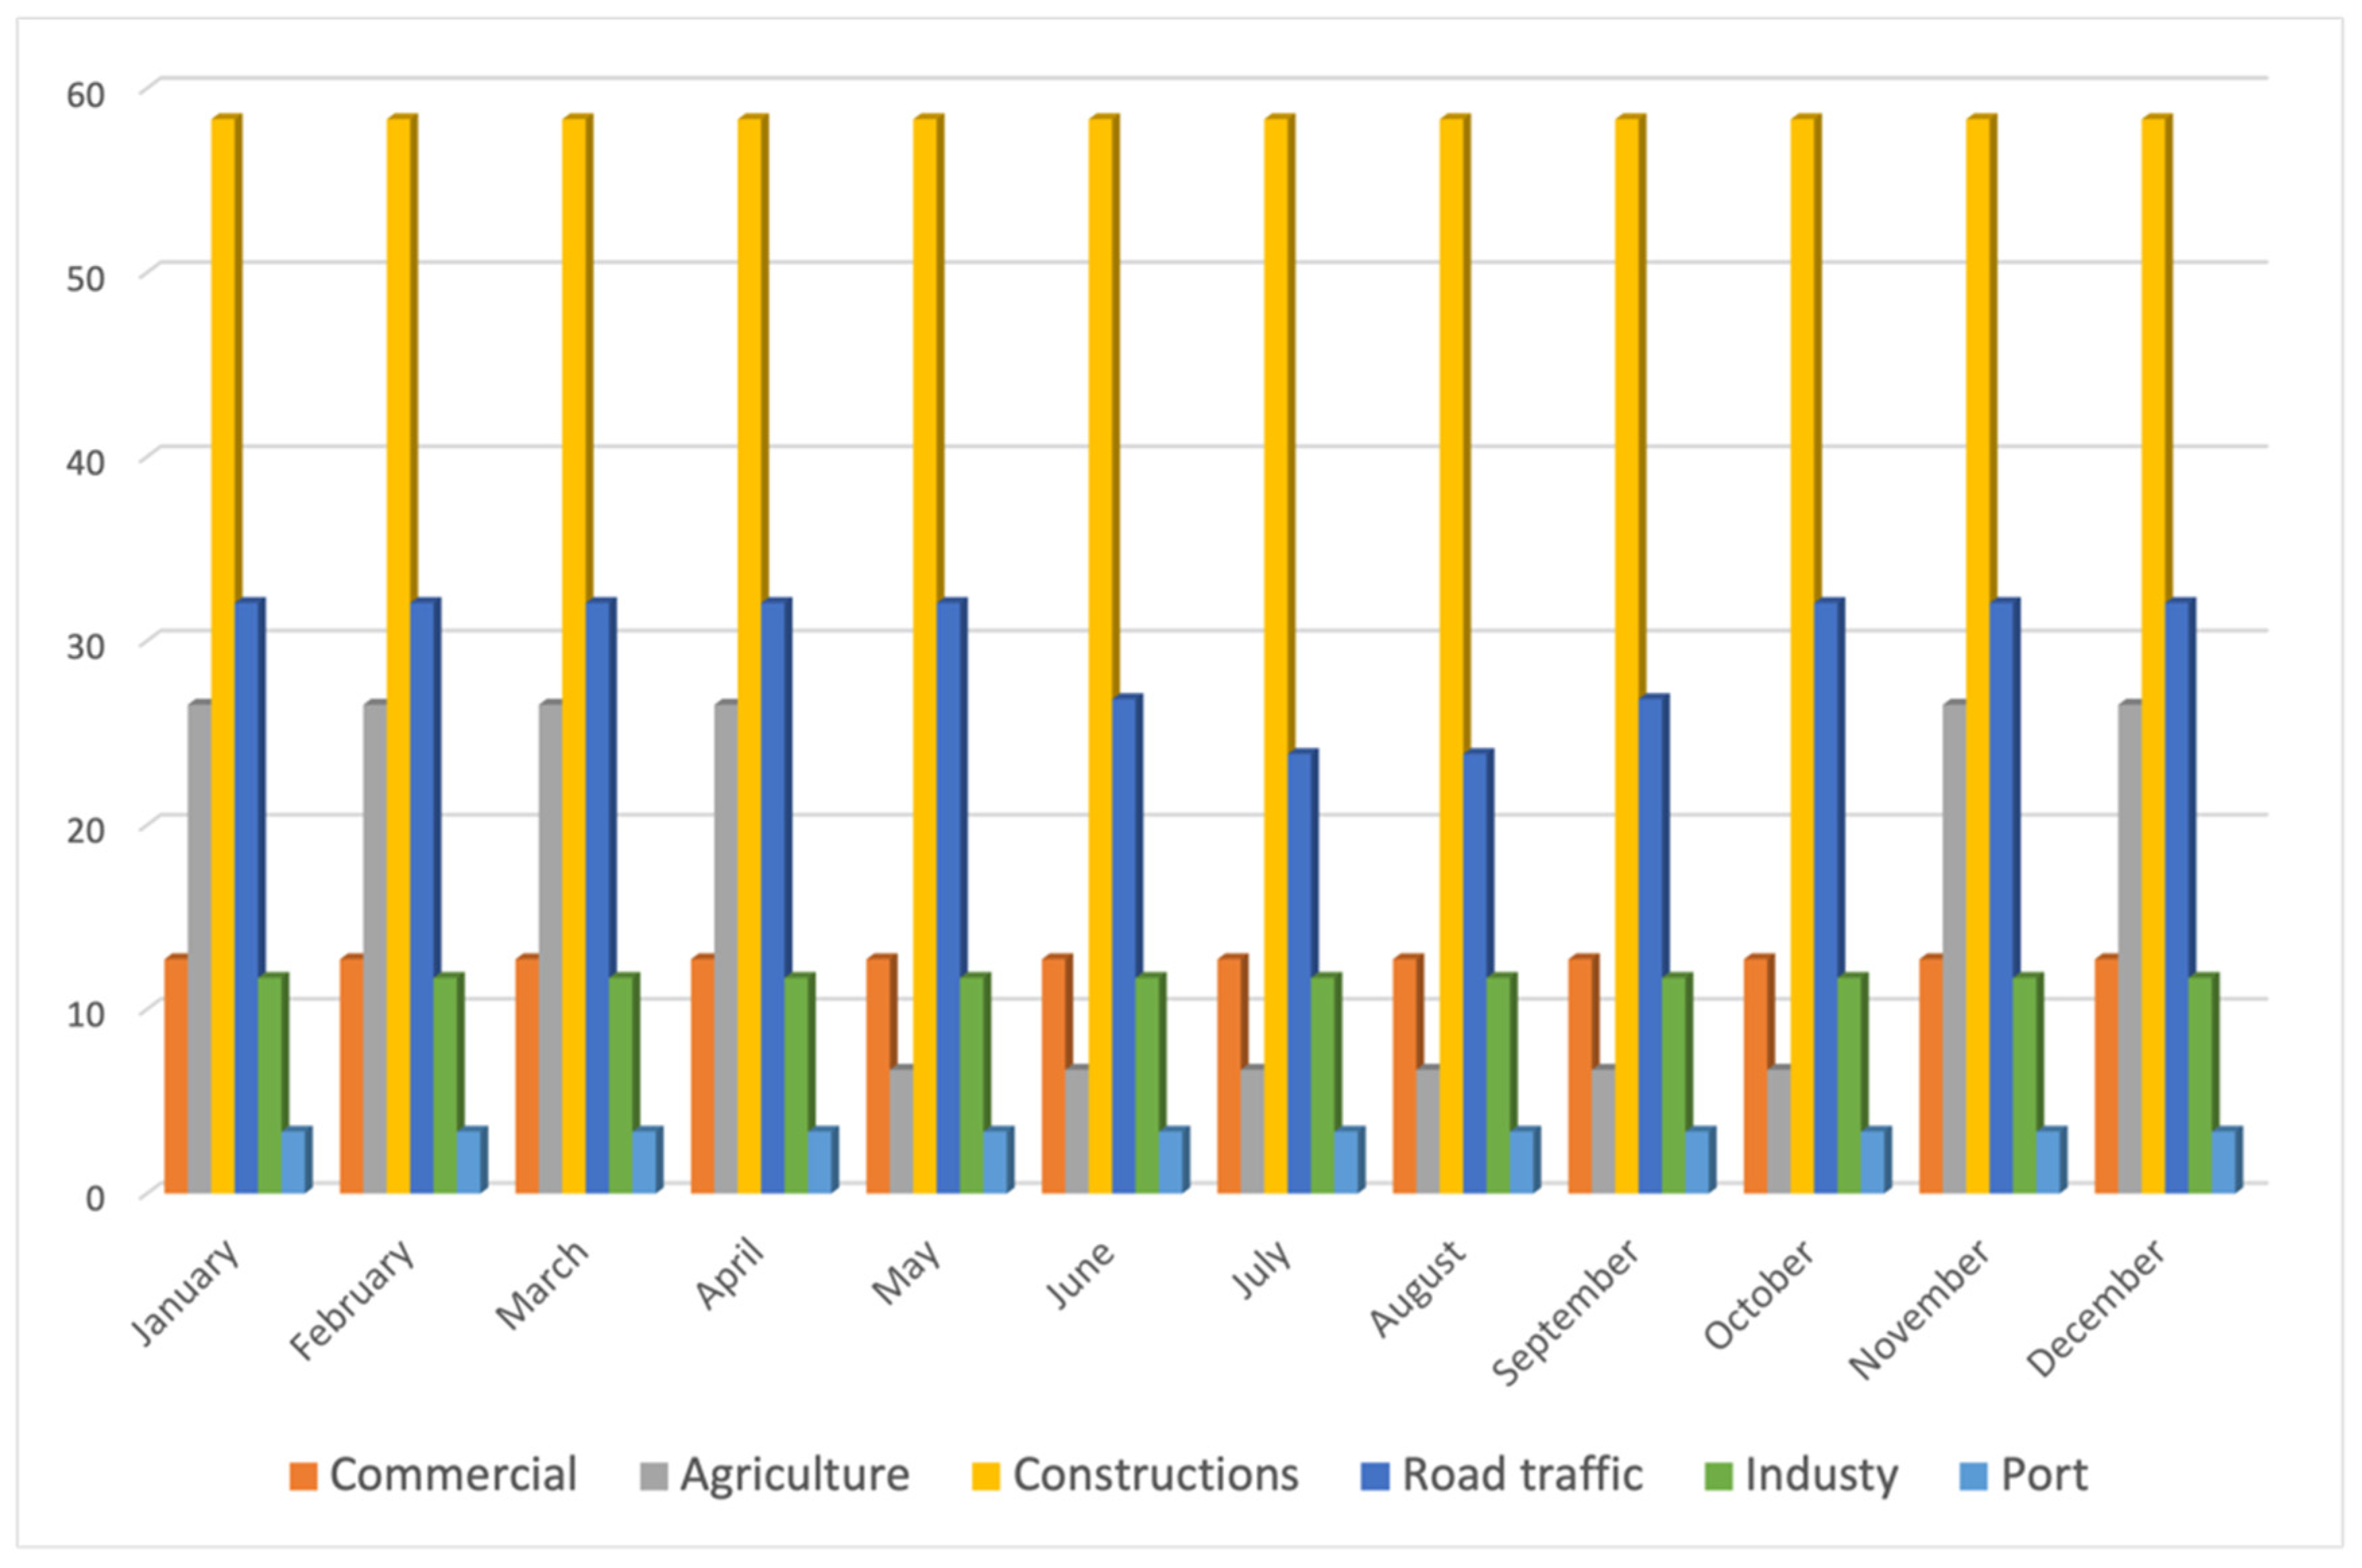
Figure 5. Only emissions from residential and agricultural sectors and road traffic present a variation during the year, whereas industrial, commercial, construction, and port emissions remain constant.
The emissions from agriculture are mainly associated with field burning of agriculture residues. Just like in other EU Member States, the burning of agricultural fields and pastures in Greece is forbidden by national law. However, farmers used to practice the traditional burning of stubbles and pastures. Despite the relatively important emissions released (5% of total PM10 emissions) from field burning, as these emissions take place far from the Metropolitan Area of Thessaloniki, more than 5 kms away, and they could not systematically contribute to high urban PM10 levels. On the other hand, the enforcement of the ban of agricultural fields is already being enhanced and, in 2022, emissions were drastically reduced. For this reason, we did not examine relevant mitigation measures in our analysis.
Concerning port emissions, they occur closer to the greater Thessaloniki area and they represent 6% of total PM10 emissions. In general, annual PM10 emissions from the activities of the Thessaloniki Port Authority are not high. However, from the investigation of the concentrations measured within the Port (Region of Central Macedonia, personal communication, 2021), it seems that the process of storing bulk materials leads to significant exceedances of particulate concentrations when meteorological conditions favor their dispersion. These exceedances, although not systematic, are frequent and seem to affect the surrounding area; however, they are not reflected on the respective PM10 level measurements in the area of the two stations of interest.
Air traffic emissions are not considered susceptible to affect the areas of interest, as the airport is located eastwards, at a distance of about 15 km from the city center. Moreover, as the amount of emitted PM10 from aircraft movements is low, they are not taken into account in the mitigation measures.
Finally, regarding fugitive emissions, construction sites in the area of interest, contribute to total PM10 emissions by 11% and they are mainly associated with the construction of the Thessaloniki Metro. However, these emissions do not occur during the night when maximum PM10 concentrations are depicted. Conversely, maximum PM10 emissions from constructions occur during the warm and dry period of the year, due to favorable meteorological conditions; however, during this period no exceedances are recorded. It is to be mentioned that the Thessaloniki Metro is expected to be finished in 2023; thus, no mitigation measures are proposed.
3.1.3. Regression Model
A simple linear regression model of the form Y = a + bX + e is used, in order to determine whether biomass consumption affects PM
10 concentrations, where the independent variable (X) of the model is defined as the biomass consumption, while the particles concentration is the dependent variable of the model (Y). The winter monthly biomass concentrations for 2018–2020 were used, as well as the corresponding monthly average PM
10 concentrations in Agia Sofia station. The selection of the Agia Sofia monitoring station was made due to the higher PM levels and number of exceedances presented there, compared to Kordelio station. Thus, if these exceedances are eliminated, then they will also be eliminated in Kordelio station. In
Table 3, the estimations of model coefficients are presented. The observed value of the point estimator of the model constant term is 25.3052 with a standard error of 2.4226, while, with 95% certainty, the actual value of the constant term ranges from 19.3771 to 31.2333. Regarding the biomass consumption factor, it is estimated to be 0.03712 with a standard deviation of 0.003811, where the actual value of the estimator ranges, with 95% certainty, from 0.02780 to 0.04645.
The null hypothesis, Ho: biomass consumption does not affect particulate concentration, is tested against the hypothesis H1: biomass consumption does affect particulate concentration. According to
Table 4, the F statistic of the above hypothesis testing is equal to 94.89 and follows a Snedecor–Fisher distribution with 1 and 6 degrees of freedom. The
p-value of the above hypothesis testing is 6.72 × 10
−5 < 0.05, and therefore, at a significance level of 0.05 (α = 0.05), the consumption of biomass affects PM
10 concentration with a 95% confidence level. The existence of a strong linear correlation between biomass consumption and particulates concentration is also indicated by the coefficient of determination, the value of which was calculated to be 0.9405, very close to 1.
The linear regression model describing the relationship between biomass consumption and PM
10 concentration is presented in Equation (1) and
Table 5:
According to the linear regression model, it is estimated that, without the effect of biomass consumption, the average PM10 concentration will be 25.3 μg/m3, while an increase of 1 t of biomass consumption will increase the particle concentration by 0.037 μg/m3.
The value of the adjusted R-squared shows a good fit of the model Y = 25.305203 + 0.037123X + e with the data, since 93.06 of the values of PM10 concentration is explained with the specific linear regression model. The regression error value is 1.165, quite small compared to the PM10 concentration range, which indicates the validity of the predictions if the specific linear regression model is used for them.
Finally, the Pearson correlation coefficient, which is 0.9698094 ≈ 1, is another statistical measure indicating the existence of a strong linear correlation between biomass consumption and concentrations, and this linear correlation is statistically significant at a significance level of 5%, because the p-value of the corresponding hypothesis testing (HO: biomass consumptions and PM10 concentrations are linearly independent) is p-value = 6.725 × 10⁻⁵ < 0.05.
Therefore, this relationship can be used to calculate the projected concentrations for the corresponding emission reductions due to biomass combustion, as this parameter was found to govern PM
10 concentrations in the area. Taking into consideration that most exceedances occur in the concentration range 51–60 μg/m
3 (
Table 6), if the concentrations are reduced by at least 20%, the number of exceedances will drop significantly, and no infringement is expected to arise. If the regression equation is applied for the above PM
10 levels reduction, then the emission reductions required are roughly of the order of 45%. Hence, this will be the purpose of the measures to be proposed and their impact will be further validated through the application of the atmospheric modeling system.
The regression analysis is often used to estimate the potential association between the study variables, such as emissions, meteorological factors, and air quality levels, when an explicit relation between these variables is expected. Similar works were conducted for Athens [
32] and elsewhere [
45,
46]. However, in cases where more factors are involved and there is no clear predominant factor for the formation of high air pollutant levels, the use of such simple models is not adequate and more advanced modeling is proposed [
47]. In the case of Thessaloniki, for the reasons described in Introduction, the contribution of biomass burning for heating purposes was proved to be the dominant factor connected to high PM
10 levels. Thus, the linear regression model was used to quantify the contribution of biomass use and to assess the impact of mitigation measures.
3.1.4. Air Quality Modeling Results: Base Case Scenario
This section analyzes the results of the application of the air quality modeling system WRF-NEMO-CAMx for the current situation.
For the base case scenario, according to
Table 7, the average daily concentration of PM
10 at the area of the Agia Sofia station (i.e., on an average value over the 2 × 2 km
2 grid cell where the corresponding station is located), for the winter period of the year 2019 (22–28 January 2019) is 43 μg/m
3, while the corresponding average measured concentration for the period 2017–2020 is 47.3 μg/m
3, showing a slight underestimation. The maximum average daily simulated PM
10 concentrations are estimated to be 67 μg/m
3 and 17 μg/m
3 for the winter and summer period, respectively. At the area of the Kordelio station, the concentrations calculated were similar with slightly higher concentration levels in winter and slightly lower levels in summer compared to the Agia Sofia area (
Table 8).
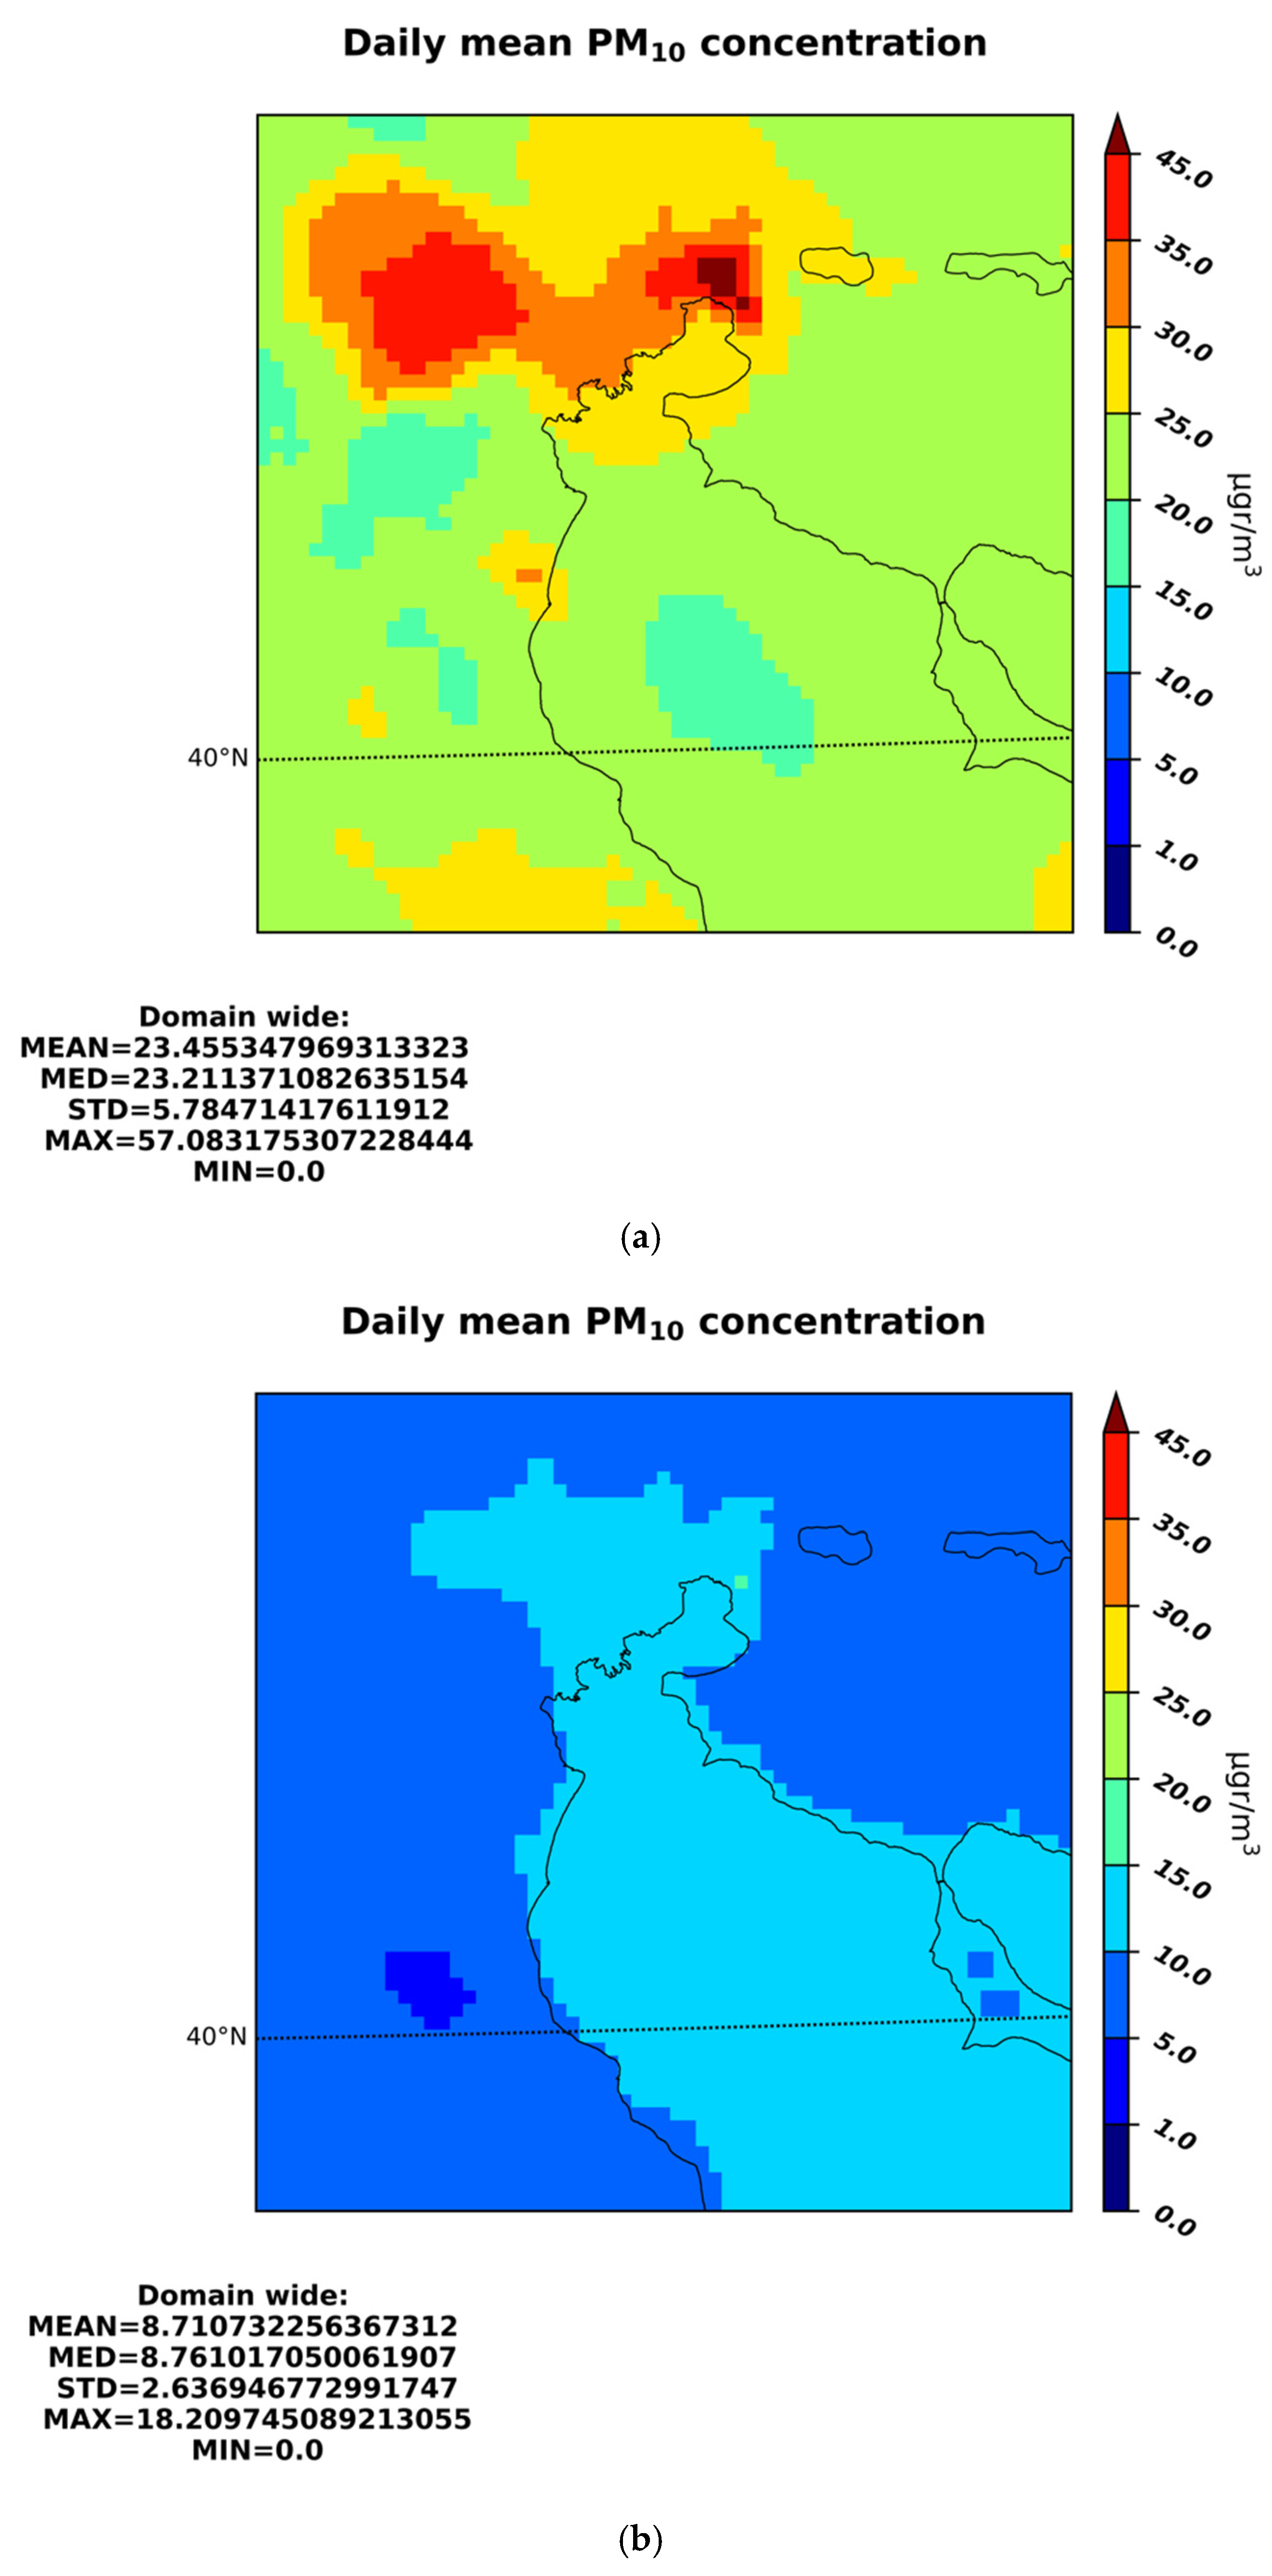
In
Figure 6, the spatial distribution of the mean daily PM
10 and PM
2.5 concentration levels over the study area of Thessaloniki is depicted for the whole study periods of winter (
Figure 6a) and summer (
Figure 6b). Mean daily PM
10 levels over the winter period exceed the value of 45 μg/m
3 in the city center of Thessaloniki while it is shown that sources outside the city center contribute to the deterioration of particle pollution in the city. For this reason, the modeling system was also implemented for the same winter season and for zero emissions in the greater area of Thessaloniki, in order to estimate the contribution of pollution sources outside the study area due to transport and/or secondary production. The results showed that, for January 2019, the average contribution of sources outside the study area was 19 μg/m
3.
3.2. Proposed Mitigation Measures and Policies
As already mentioned, according to emissions calculations and air quality model results, it was found that PM10 concentrations in winter are associated with emissions from heating. This finding is consistent with the strong correlation identified between emissions from biomass combustion and the corresponding concentrations during the cold months of 2018–2020. Therefore, these findings reinforce the conclusion that emphasis should be placed on measures to reduce the use of biomass, while emissions from other sources, due to intensity and location, do not significantly affect the points of interest.
As Greece, like most European Union Member States, relies heavily on burning biomass to achieve its renewable energy targets, the above findings about the effect of biomass burning on air pollution should be considered in the revision of the National Energy and Climate Plan (NECP), which is planned for 2023.
In the context of this study, all measures already institutionalized were examined, including those proposed in the Air Quality Plan of the Region of Central Macedonia (RCM) and the NAPCP as well as in the new Climate Law. However, although most of them have been taken into account in the emission projections, the data collected have shown that they cannot lead to a worthwhile reduction in emissions. For this reason, and on the basis of the conclusions on the contribution of PM10 sources, measures were proposed which were assessed in terms of environmental benefit, cost, and ease of implementation. Based on the assessment of the measures, alternative scenarios were proposed for which the modeling system will be applied. From these scenarios, those with the best cost–benefit ratio, and including the subsidy for the installation of low-emission heating systems (e.g., heat pumps), were selected. The subsidy is considered necessary because the decision to lift the ban on the use of biomass in the prefectures of Attica and Thessaloniki in 2011 prompted citizens to extensively use fireplaces, heaters, and biomass-wood boilers, wrongly cultivating the impression that these fuels are environmentally friendly. As a result of this misinformation, there has been a significant increase in exceedances during the winter period. The lifting of the ban, in combination with the economic recession, high oil prices, and energy poverty in general, resulted in a literal jump in particulate emissions, and in the establishment of domestic heating with biomass consumption as the dominant source of particulate emissions. The final proposed scenarios of measures, which lead to the removal of exceedances of particulate concentrations over a period of three years, are presented below.
3.2.1. Proposed Mitigation Measures
Scenario I
M1. Replacement of biomass heating systems with natural gas systems in residences in the Regional Unit of Thessaloniki
A subsidy program for the replacement of biomass heating systems with natural gas systems in residences in the Regional Unit of Thessaloniki, in the framework of the National Strategic Reference Framework (NSRF) 2021–2027, by the Region of Thessaloniki and the Ministry of Environment and Energy. The grant concerns the financing of internal natural gas installations in eligible residences in the Regional Unit of Thessaloniki in which there is a biomass heating system in operation, and specifically: open fireplaces, energy fireplaces, conventional wood stoves, energy wood stoves, conventional biomass burners, energy efficient pellet stoves, and burners.
A grant rate of 50% is foreseen for all beneficiaries except beneficiaries of social solidarity income for whom the grant rate will be 75%. The total budget for the three years (2023–2025) will be EUR 52.5 M. It is estimated that the use of biomass will be replaced in some 13,000 dwellings. From the current biomass consumptions and the relevant data of the Hellenic Statistical Authority (ELSTAT), it appears that, by 2025, about 12% of biomass emissions will be eliminated. However, it should be noted that the cost-effectiveness of this measure is called into question by the increase in the price of natural gas and the general international conditions.
M2. Replacement of biomass heating systems with heat pumps in residences in the Regional Unit of Thessaloniki
A subsidy program for the replacement of biomass heating systems with heat pumps similar to the M1 measure.
The maximum eligible budget is EUR 10,000 with a grant rate of 80% for all beneficiaries. The total budget for the three years (2023–2025) will be EUR 120 M. It is estimated that the use of biomass will be replaced in some 15,000 dwellings. From the current biomass consumptions and the relevant data of ELSTAT, it appears that, by 2025, about 13% of biomass emissions will be eliminated. However, again, the cost-effectiveness of this measure is called into question due to the high energy price.
M3. Environmental charge on biomass
This measure, which will lead to a significant reduction in the use of biomass, is proposed as an alternative to measure M3(a). However, it is not proposed as an independent measure but as a strengthening measure, which, in combination with measures M1 and M2, will promote the transition from the combustion of biomass to another fuel.
By 2025, the anticipated emissions reduction is more than −25%, whereas, combined with measures M1 and M2 it will reach −45–−55%.
Scenario II
This includes measures M1 and M2 from Scenario I, whereas, in Scenario II, measure M3 is included with a reduced efficiency of about −15%; thus, in total, a −38% reduction. Additionally, a measure for the replacement of old vehicles is included as follows:
M4. Incentivizing the renewal of the private and commercial vehicle fleet
This is a positive measure, which, however, must have a nationwide scope. The implementation of the measure from 2022 to 2025, aims to replace older private and commercial vehicles of at least 10 years of age (Euro 5a and older), which mainly contribute to particulate emissions. In particular, emissions from these vehicles, i.e., more than ten years old, account for passenger cars for 88% of all passenger car emissions, for 94% of light-duty vehicles emissions, and for 97% of heavy-duty vehicles emissions.
Under the conservative assumption that 20,000 passenger cars, 8000 light-, and 3000 heavy-duty vehicles will be withdrawn annually nationwide, a reduction in PM10 emissions of −17% is achieved in 2025, while the expected reduction of NOx is more important, about −27%. These emissions reductions concern the whole country and the region of interest.
3.2.2. Air Quality Modeling Results: Mitigation Scenarios
The air quality modeling system WRF-CAMx was implemented for two emissions mitigation scenarios in order to estimate the impacts of the proposed measures on PM levels in the area of Thessaloniki. The modeling system was applied for one week of the winter period of 2019 (22–28 January 2019) similarly to the base case scenario.
The proposed measures, and therefore the implemented emissions mitigation scenarios, focus on the replacement of biomass heating systems mainly with natural gas systems and with heat pumps in residences in the Regional Unit of Thessaloniki. Additionally, the renovation of the fleet of private and commercial vehicles is also studied as an alternative scenario. In the following, the percentage reductions in the corresponding emissions implemented in the application of the modeling system are presented.
Scenario I: (a) Reduction of biomass heating emissions by −45% and (b) increase of natural gas use for heating by +10% in the Regional Unit of Thessaloniki
Scenario II: (a) Reduction of biomass heating emissions by −38% and (b) increase natural gas use for heating by +8% in the Regional Unit of Thessaloniki and (c) reduction in the road transport emissions in the greater area of Thessaloniki by −17% for PM and −26.72% for NOx.
It should be highlighted that the combustion of natural gas for heating purposes has a negligible impact on PM emissions, and therefore the corresponding increase is related mostly to other pollutants (i.e., NO
x, CO, NMVOCs, SO
2). Similarly, the reduction in PM emissions from road transport by −17% in Scenario II has a small impact on the total amount of PM emissions in the area since road transport contributes about 6% of the total PM emissions when the corresponding contribution of biomass burning is 7% (
Figure S1, in Supplementary Materials).
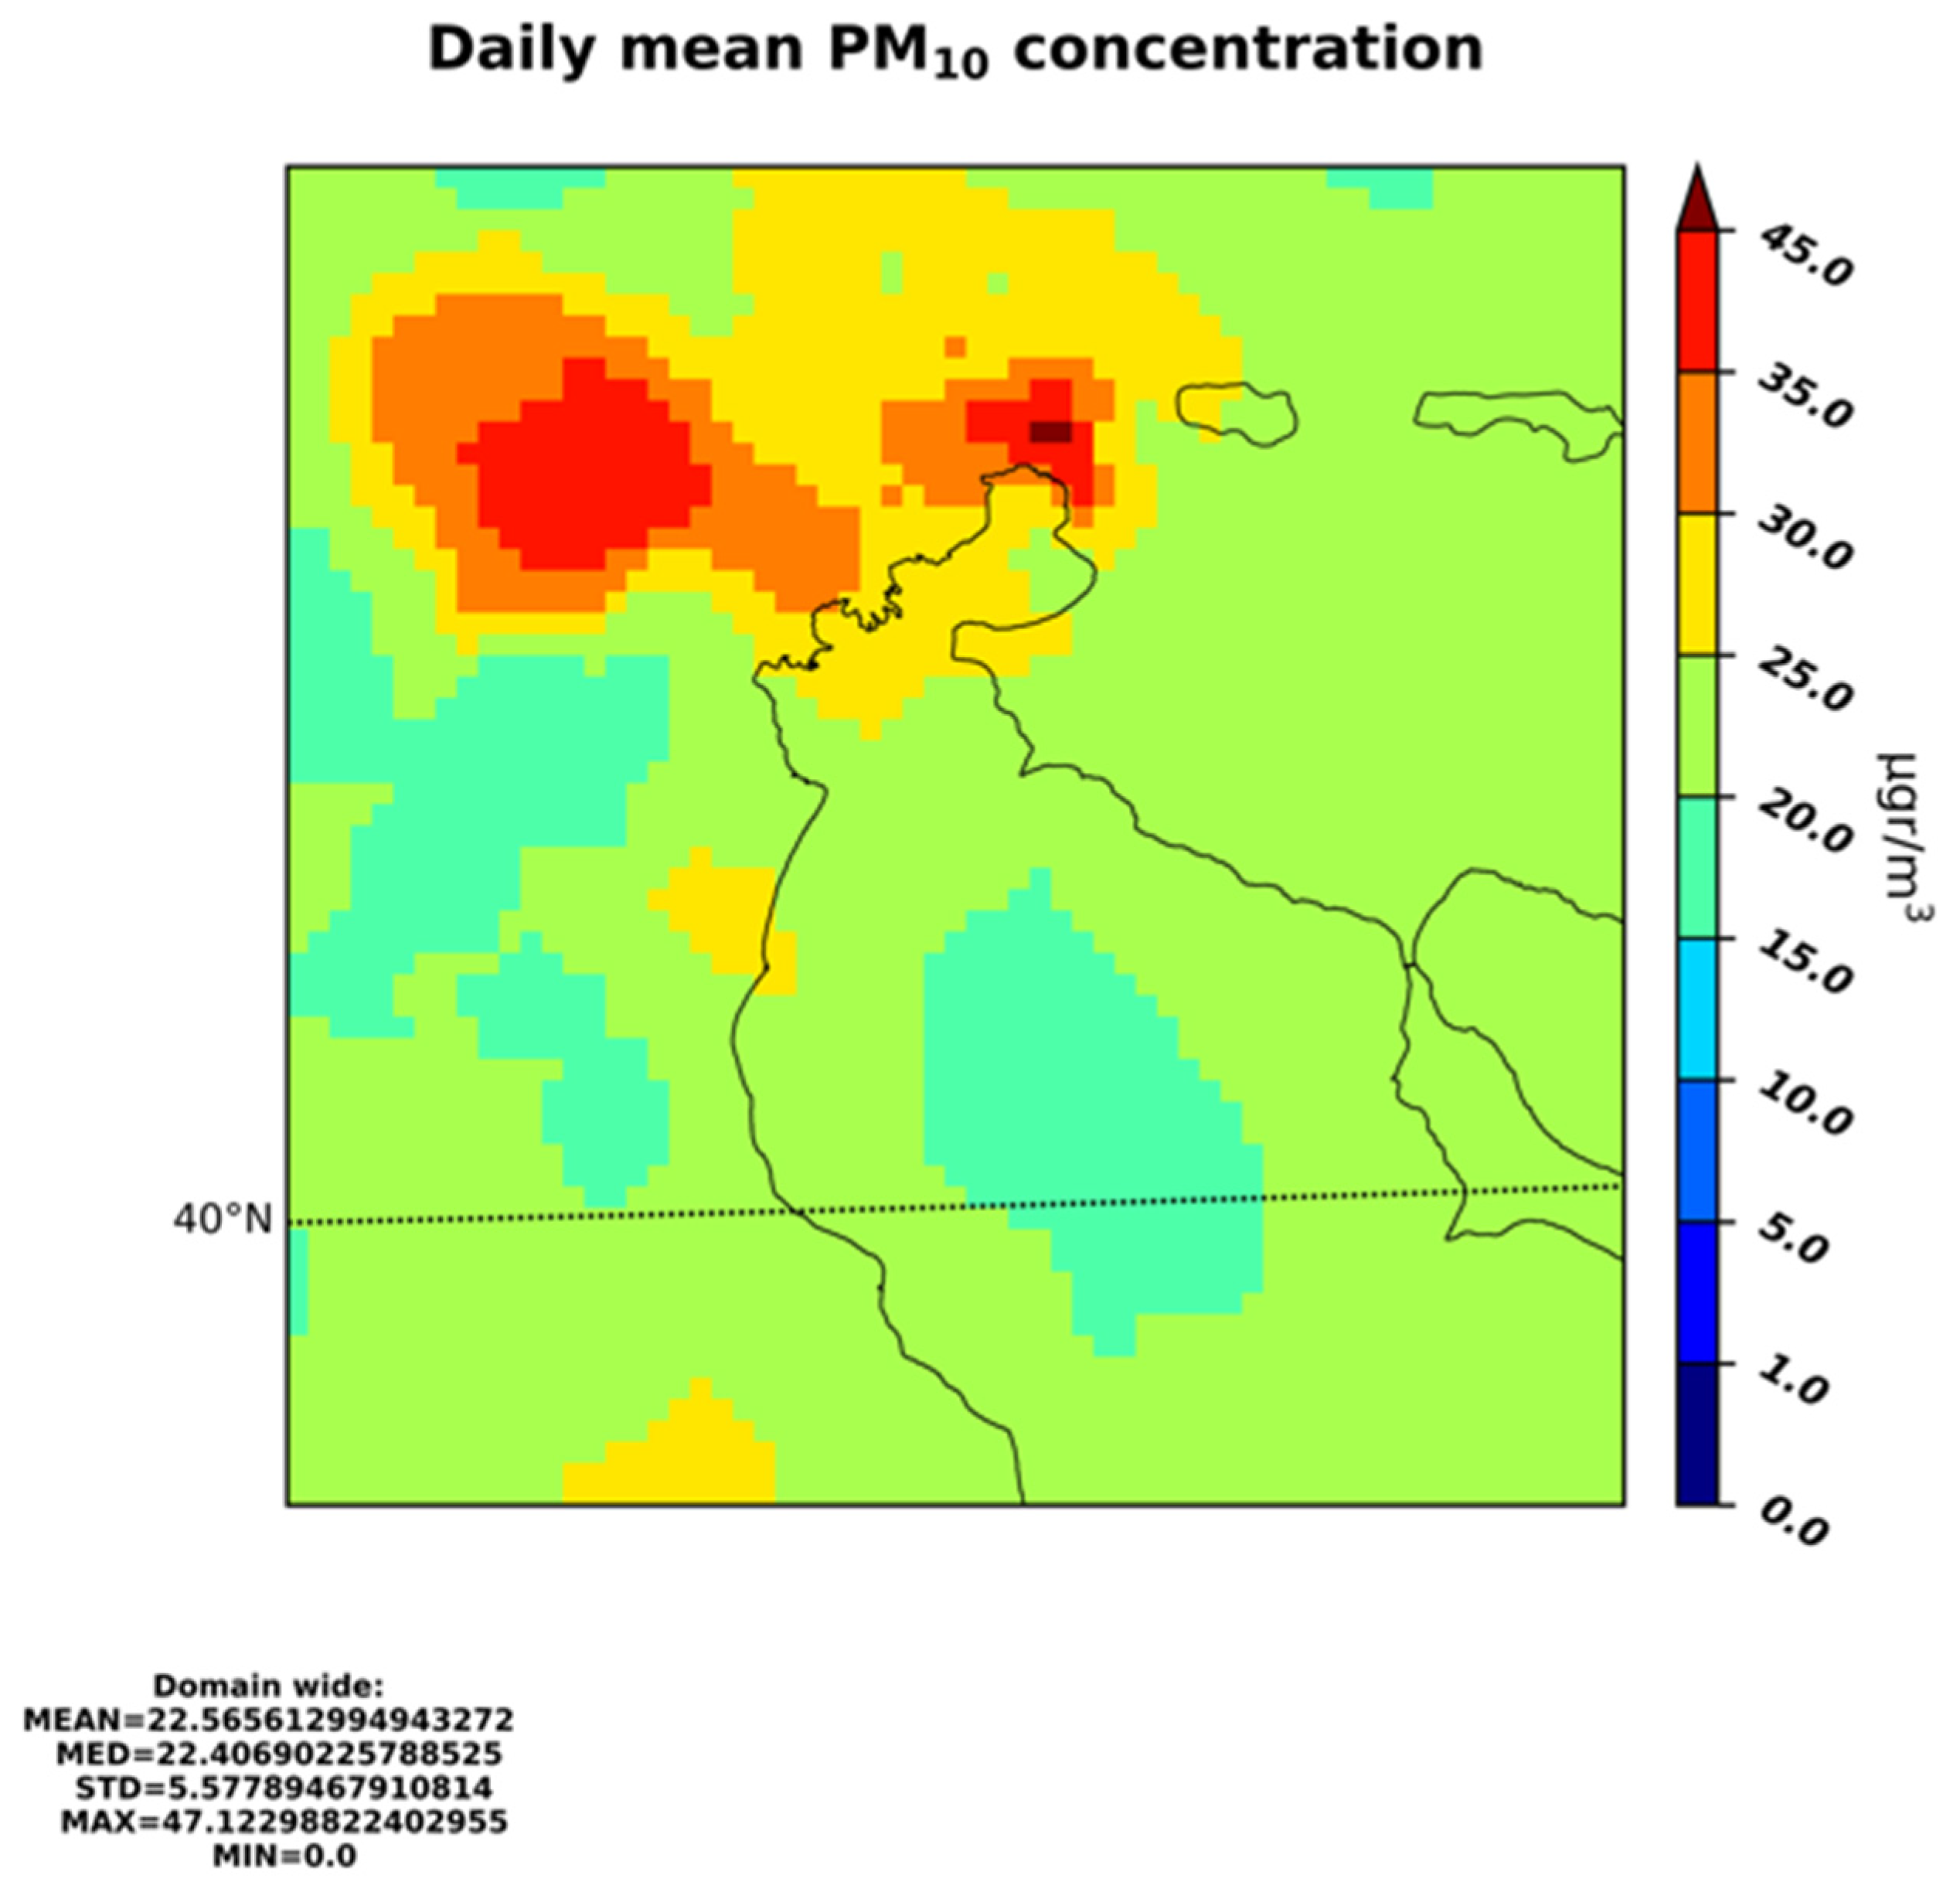
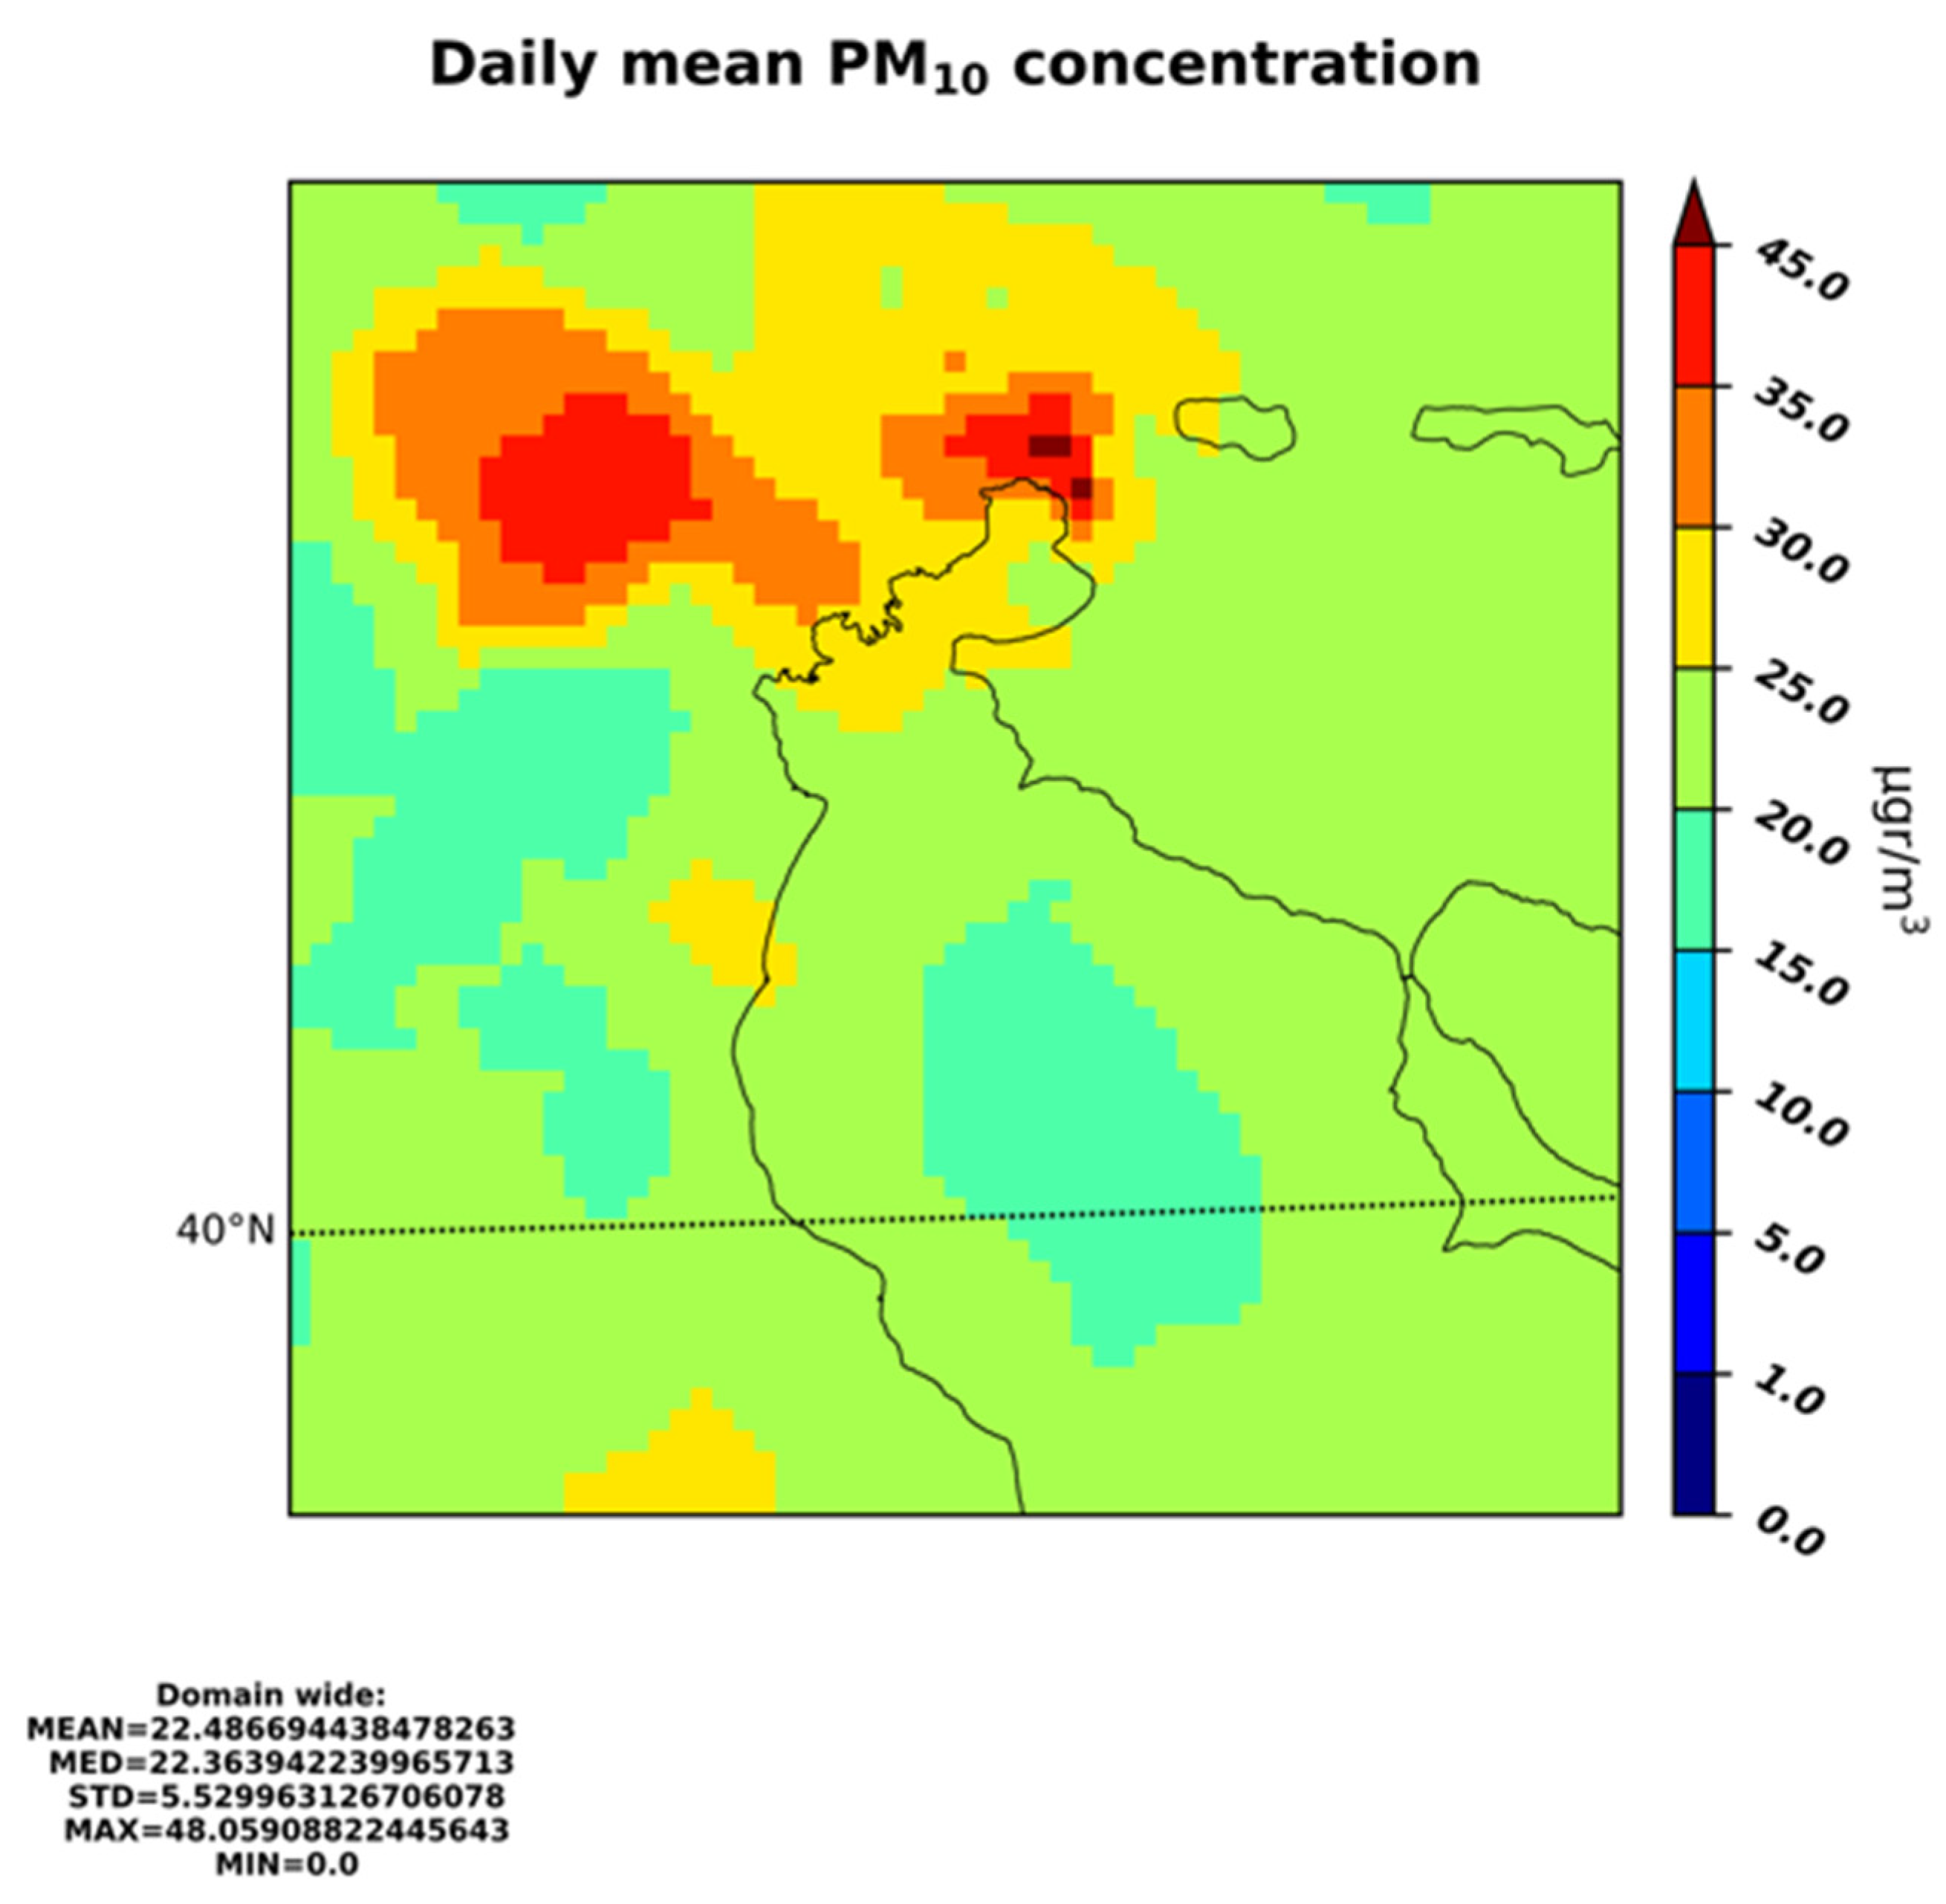
Figure 7 illustrates the spatial distribution of the simulated mean daily PM
10 levels for Scenario I and II over the study area of Thessaloniki during the winter period of 2019. The results indicated that the PM
10 simulated levels are reduced by 17.5% and 15.8% for Scenario I and II, respectively, in comparison with the base case scenario results (
Figure 7).
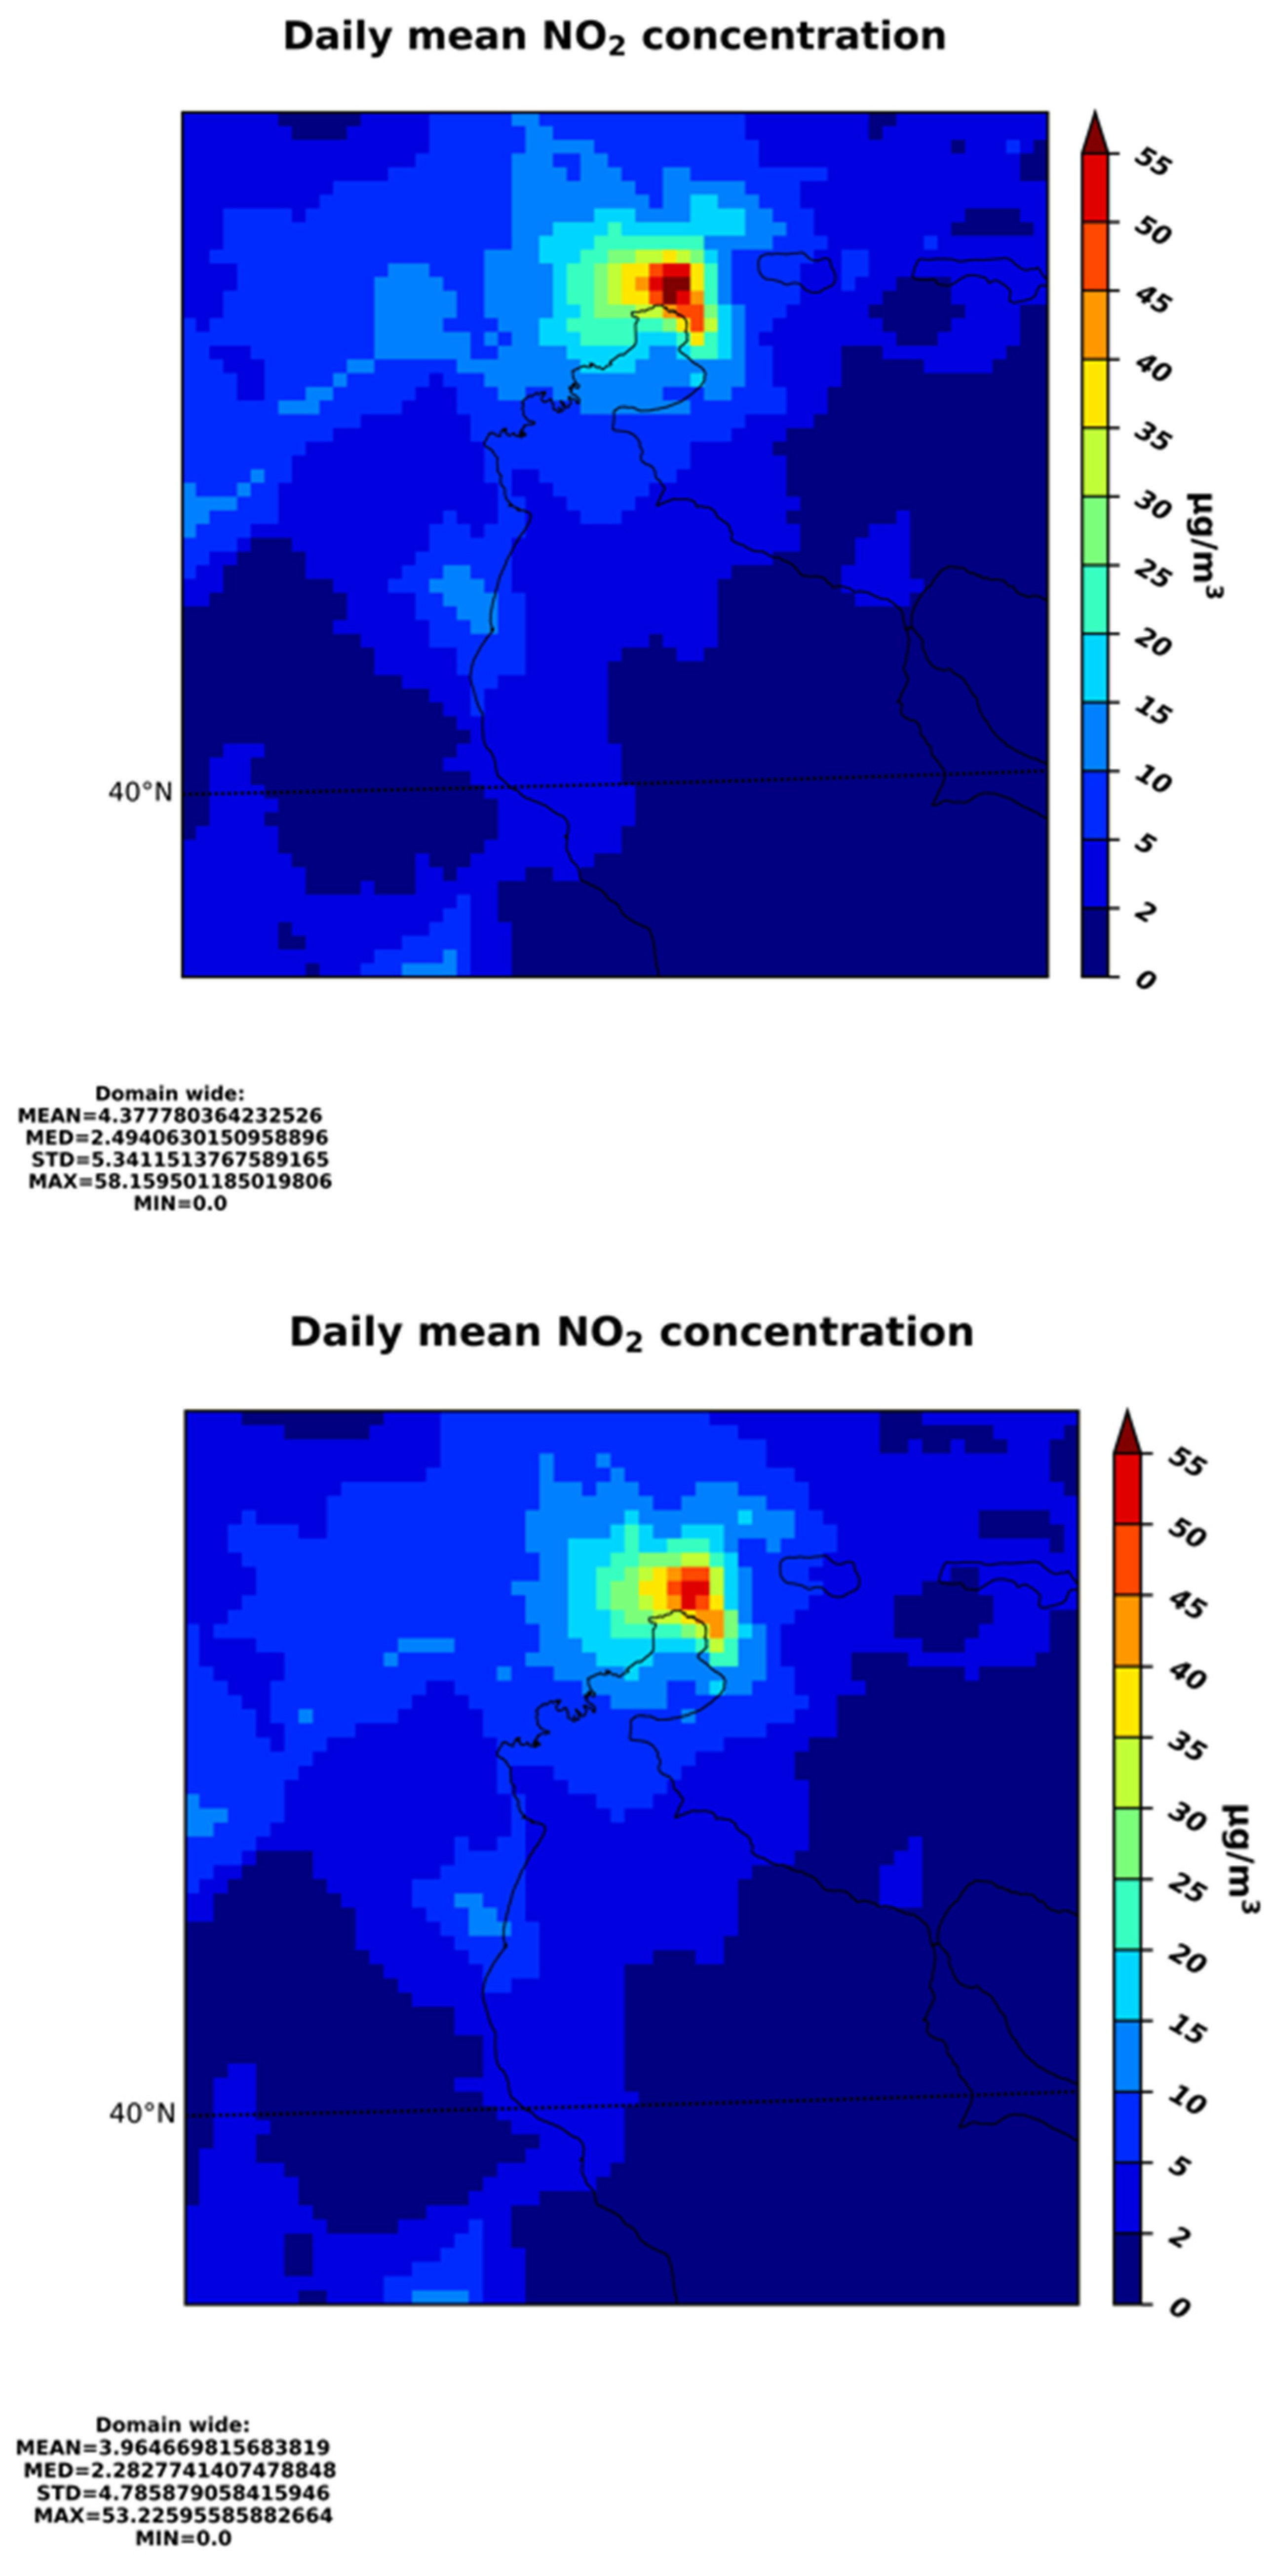
Moreover, according to
Figure 8, the mean daily simulated values of NO
2 in Scenario II, are reduced by 10% compared to the base case scenario due to the reduction of road transport emissions.
Table 9 presents the estimated percentage differences in the maximum simulated PM
10 levels for Scenarios I and II in comparison with the base case scenario. It is found that the maximum daily PM
10 levels over the study winter period are reduced by approximately 22.5% and 20.5% in Scenario I and II, respectively, compared with the base case scenario.
Additionally,
Table 9 shows the estimated number of exceedances in PM
10 levels in the areas of Agia Sofia and Kordelio stations for all the implementing scenarios. It is concluded that for the whole typical week of the study winter period, three exceedances have been estimated in PM
10 daily values over the Agia Sofia and Kordelio areas for the base case scenario, while one and two exceedances were identified in Scenarios I and II, respectively, for both areas.
Thus, the implementation of the air quality modeling system confirmed the removal of exceedances at the stations of Agia Sofia and Kordelio, where the number of exceedances of the limit values of the average daily PM10 concentrations are reduced by about −67% in Scenario I. Therefore, based on the results of the model, a significant reduction in exceedances and compliance with the limit of 35 exceedances of the daily value limit per year is achieved in Scenario I, which can be considered the most efficient one.
4. Conclusions
In urban areas, poor air quality is often a hard problem to resolve, with policy makers facing difficulties in adopting the necessary measures to overcome this situation. The current study, focused on Thessaloniki, Greece, was conducted for the Hellenic Ministry of Environment and Energy because, in December of 2020, the European Commission decided to refer Greece to the Court of Justice of the European Union regarding poor air quality due to high levels of PM10. Thus, the main aim of the study was the identification of the most appropriate measures and policies to combat particulate air pollution in the city of Thessaloniki, where PM10 levels continuously exhibit exceedances of the mean 24 h EU limit value in order to address the problem and put an end to the infringement in question. Furthermore, the study aimed to provide to the scientific community a comprehensive methodological approach for identifying the most cost-effective policies that can be implemented in any other urban area facing similar air quality issues and raise the awareness of environmental stakeholders and local authorities, and the research outcome could be used as a role model for other big cities.
The methodological approach adopted was found successful in identifying the appropriate measures and policies and included the following steps: (i) recognition of the current situation; (ii) identification of pollution source emission contributions and correlation with particulate levels; (iii) application of atmospheric models to describe the current situation; (iv) evaluation of measures to reduce particulate levels and the creation and evaluation of alternative scenarios; (v) application of atmospheric models for the prevailing alternative scenarios and assessment of the expected reductions in PM10 concentrations; and (vi) finalization and preparation of the action plan. The main findings are demonstrated below:
- −
Concentrations of PM10 are elevated during the winter months, with mean monthly winter levels exceeding the corresponding mean monthly summer concentrations by 10–18 μg/m3. Interestingly, the daily exceedances occur almost exclusively during the winter months, especially the colder ones.
- −
The most important particulate emissions originate from residential heating, with a contribution of 73% to the total PM10 emissions.
- −
According to emissions calculations and air quality model results for the reference year scenario and for zero emissions in the area of study, it was found that PM10 concentrations in winter are mainly associated with emissions from heating.
- −
A simple linear regression model has been developed further, verifying and quantifying the biomass consumption effect on PM10 concentrations. It was found that, to eliminate exceedances of the mean daily values, the emission reductions required are roughly of the order of 45%.
- −
The mitigation measures to eliminate exceedances were examined and their impact on PM10 levels was quantified through the application of the atmospheric modeling system. The proposed measures include the following: (i) replacement of biomass heating systems with natural gas systems in residences in the Regional Unit of Thessaloniki; (ii) replacement of biomass heating systems with heat pumps in residences in the Regional Unit of Thessaloniki; (iii) environmental charge on biomass; and (iv) the renewal of the vehicle fleet.
- −
Based on the results of the modeling system, a significant reduction in exceedances occurs and compliance with the limit of 35 exceedances of the daily value limit per year is achieved.
An important implication of this study is that it proposes a well-founded methodology to verify and quantify the effect of the biomass consumption for heating purposes on increased PM10 concentrations. Due to the absence of detailed statistics on biomass consumption in Thessaloniki, our analysis was conducted based on national biomass consumption data (fuelwood and pellets). Future research should focus on producing detailed statistics of biomass fuel consumption with a more refined spatial resolution, on a municipality scale or, even better, on municipal sections, for the benefit of reducing the uncertainty of our assessment, improving the design, and facilitating the implementation of mitigation measures.
Finally, the idea in this work is to propose cost-efficient policies and measures to eliminate exceedances of PM10 levels in Thessaloniki up to 2025. Thus, the aim is to conform with the PM10 limits set in the short-term, from 2023 up to 2025. In the long run, it is expected that the penetration of renewable energy sources and decarbonization will play an important role in changing the fuel mix used for heating; thus, it is expected that PM10 levels will further decrease.


 ,
, 


