
Analysis of the Effects of Different Factors on Damage Potential Ranking

Abstract
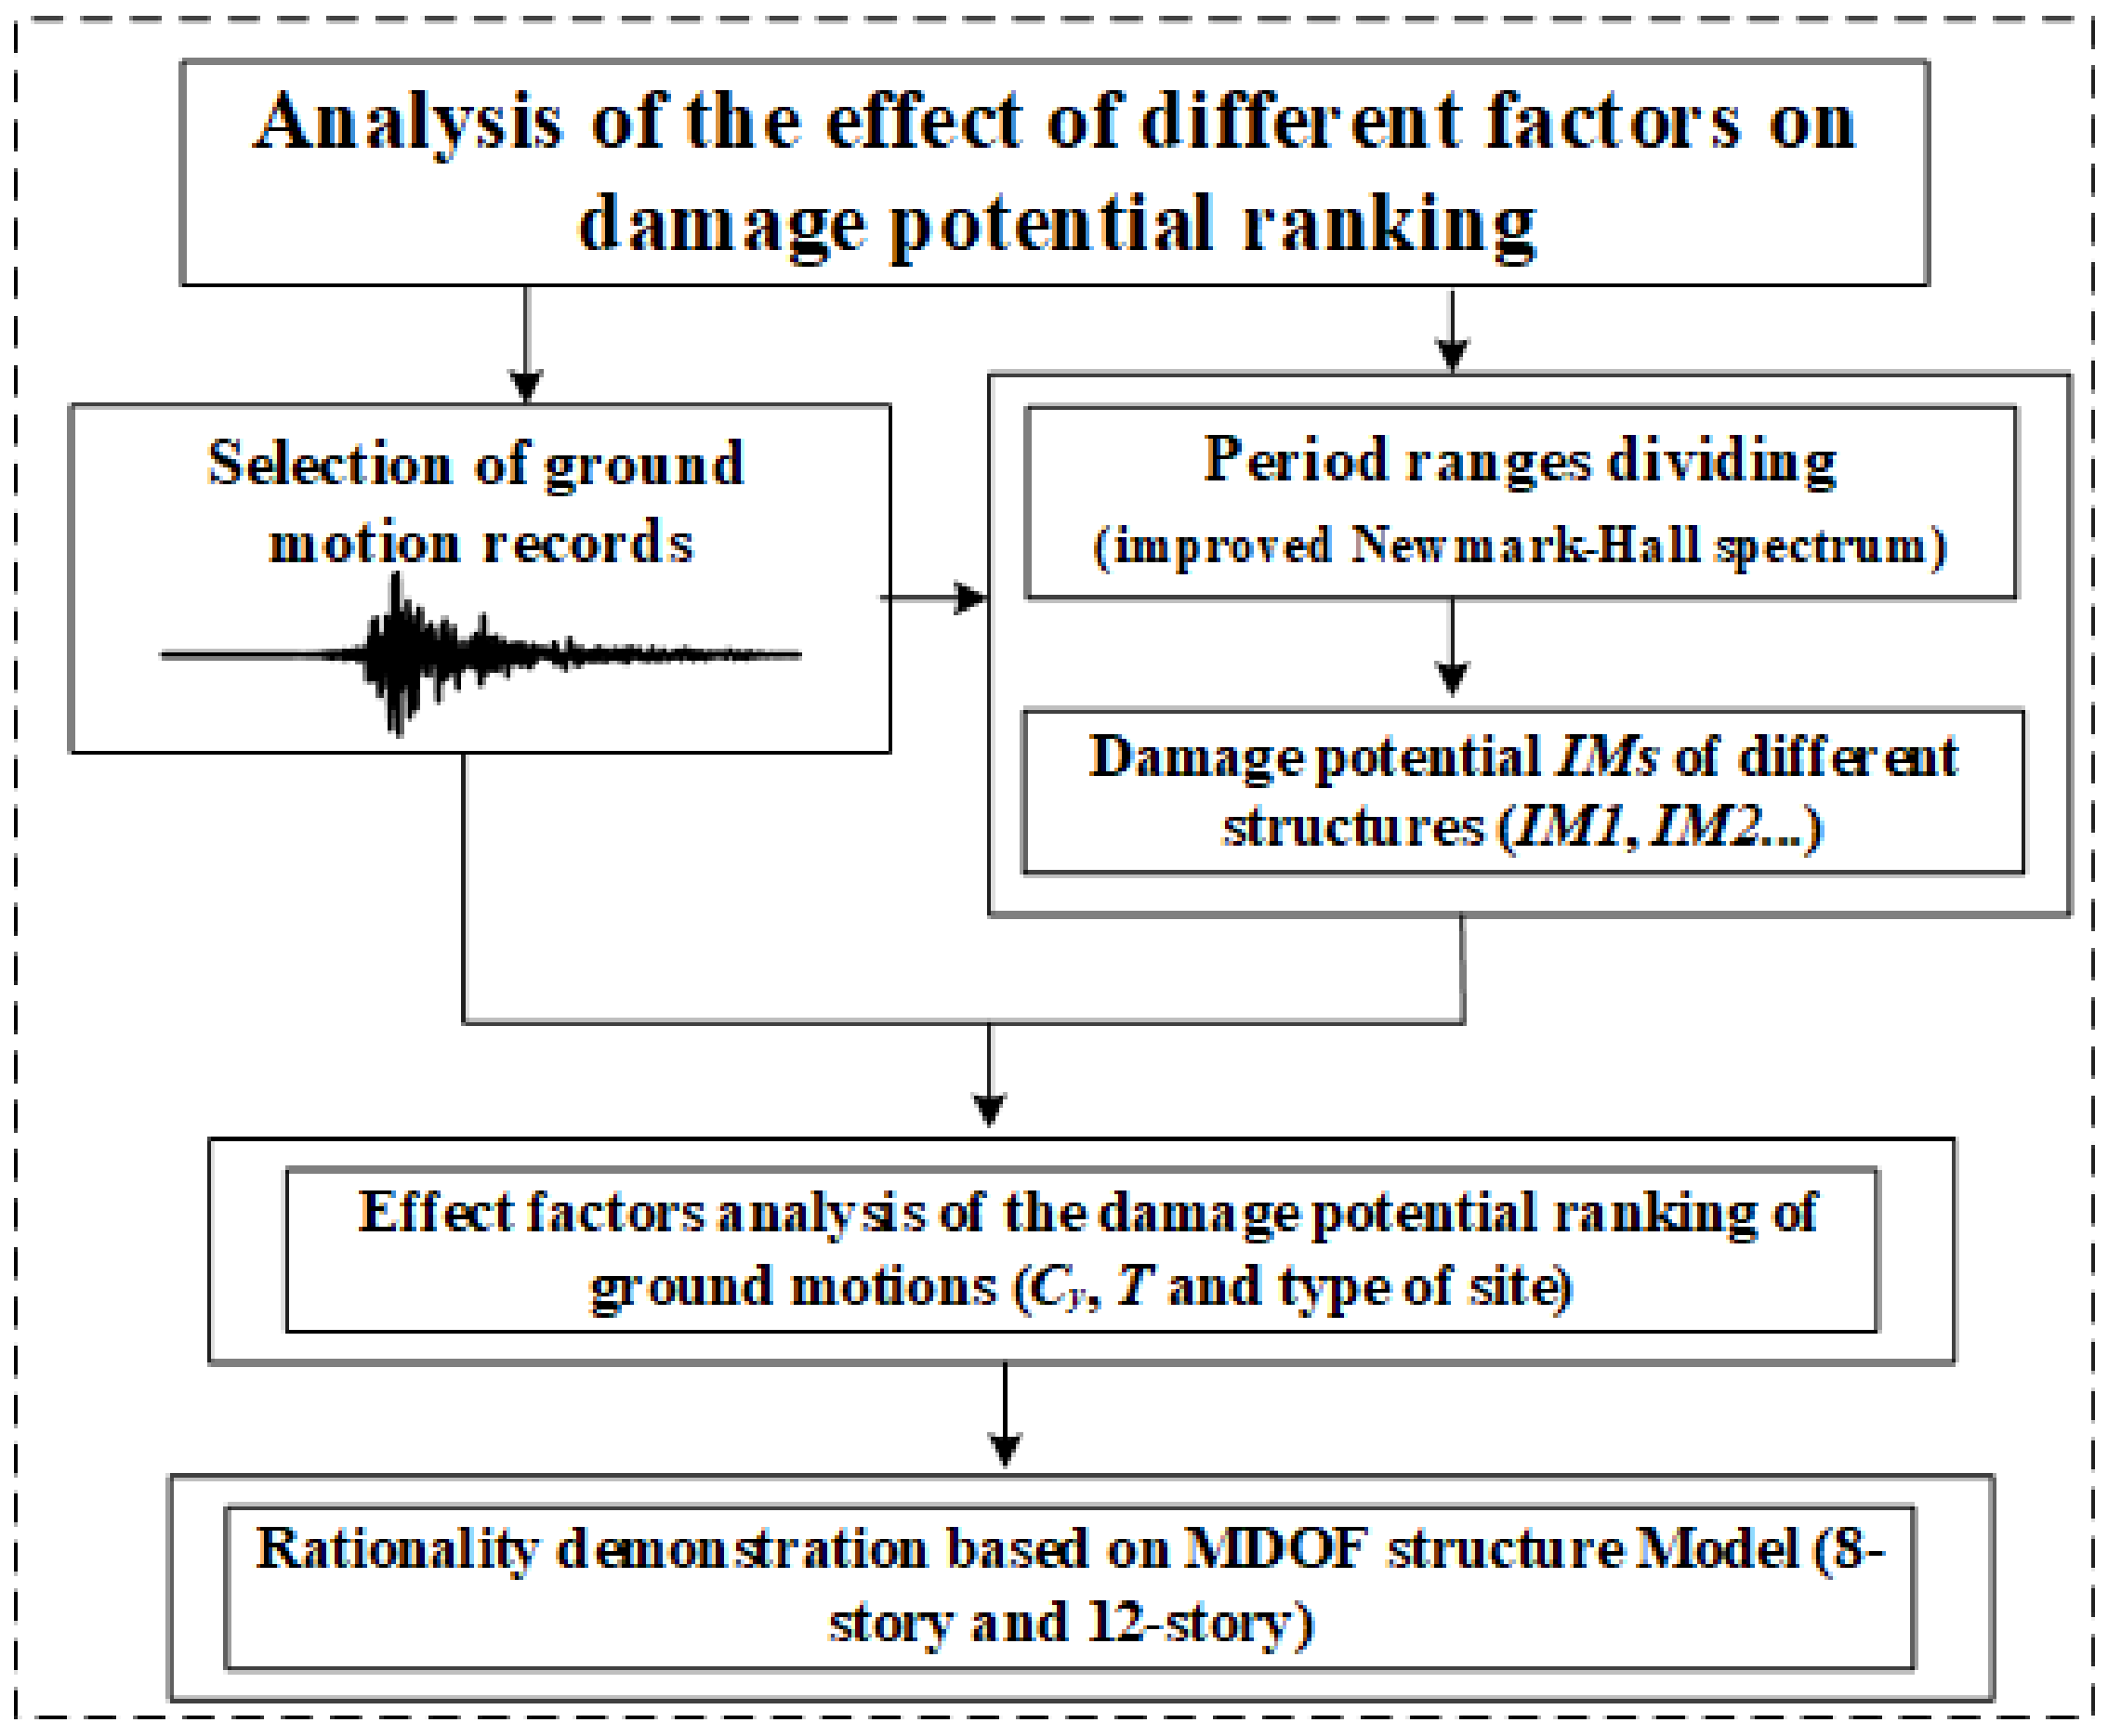
:1. Introduction
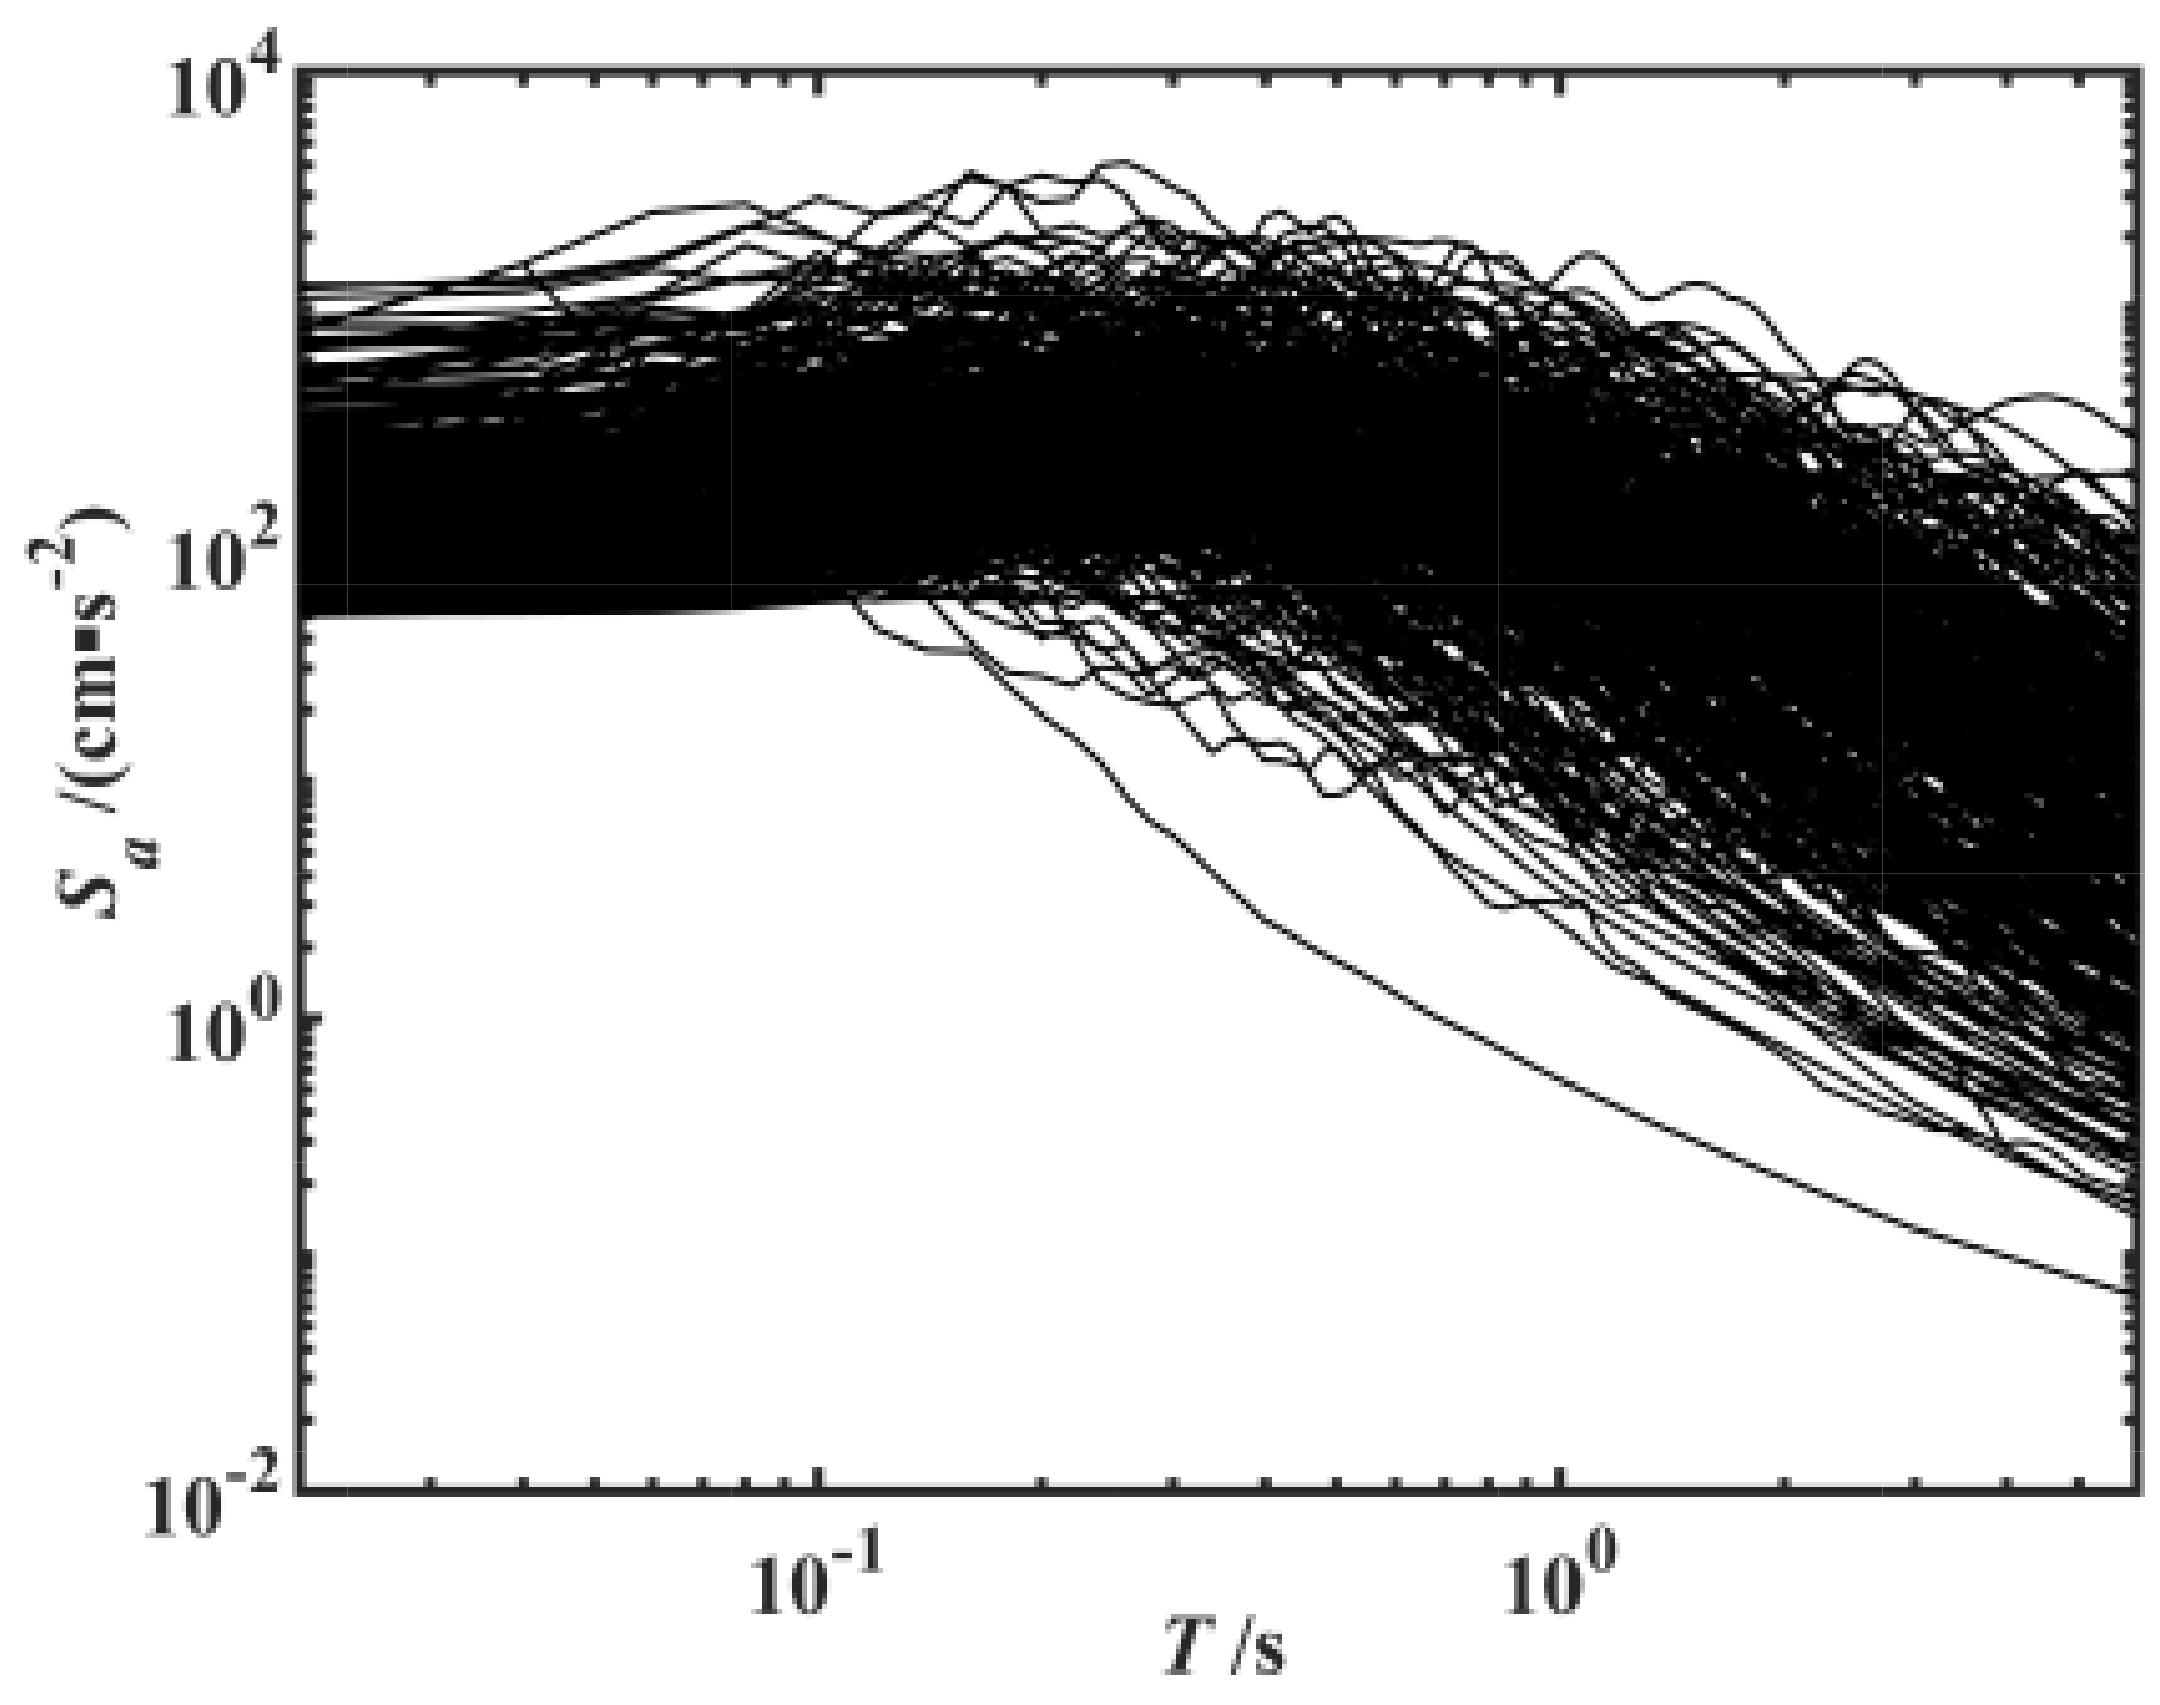
2. Selection of Ground Motions
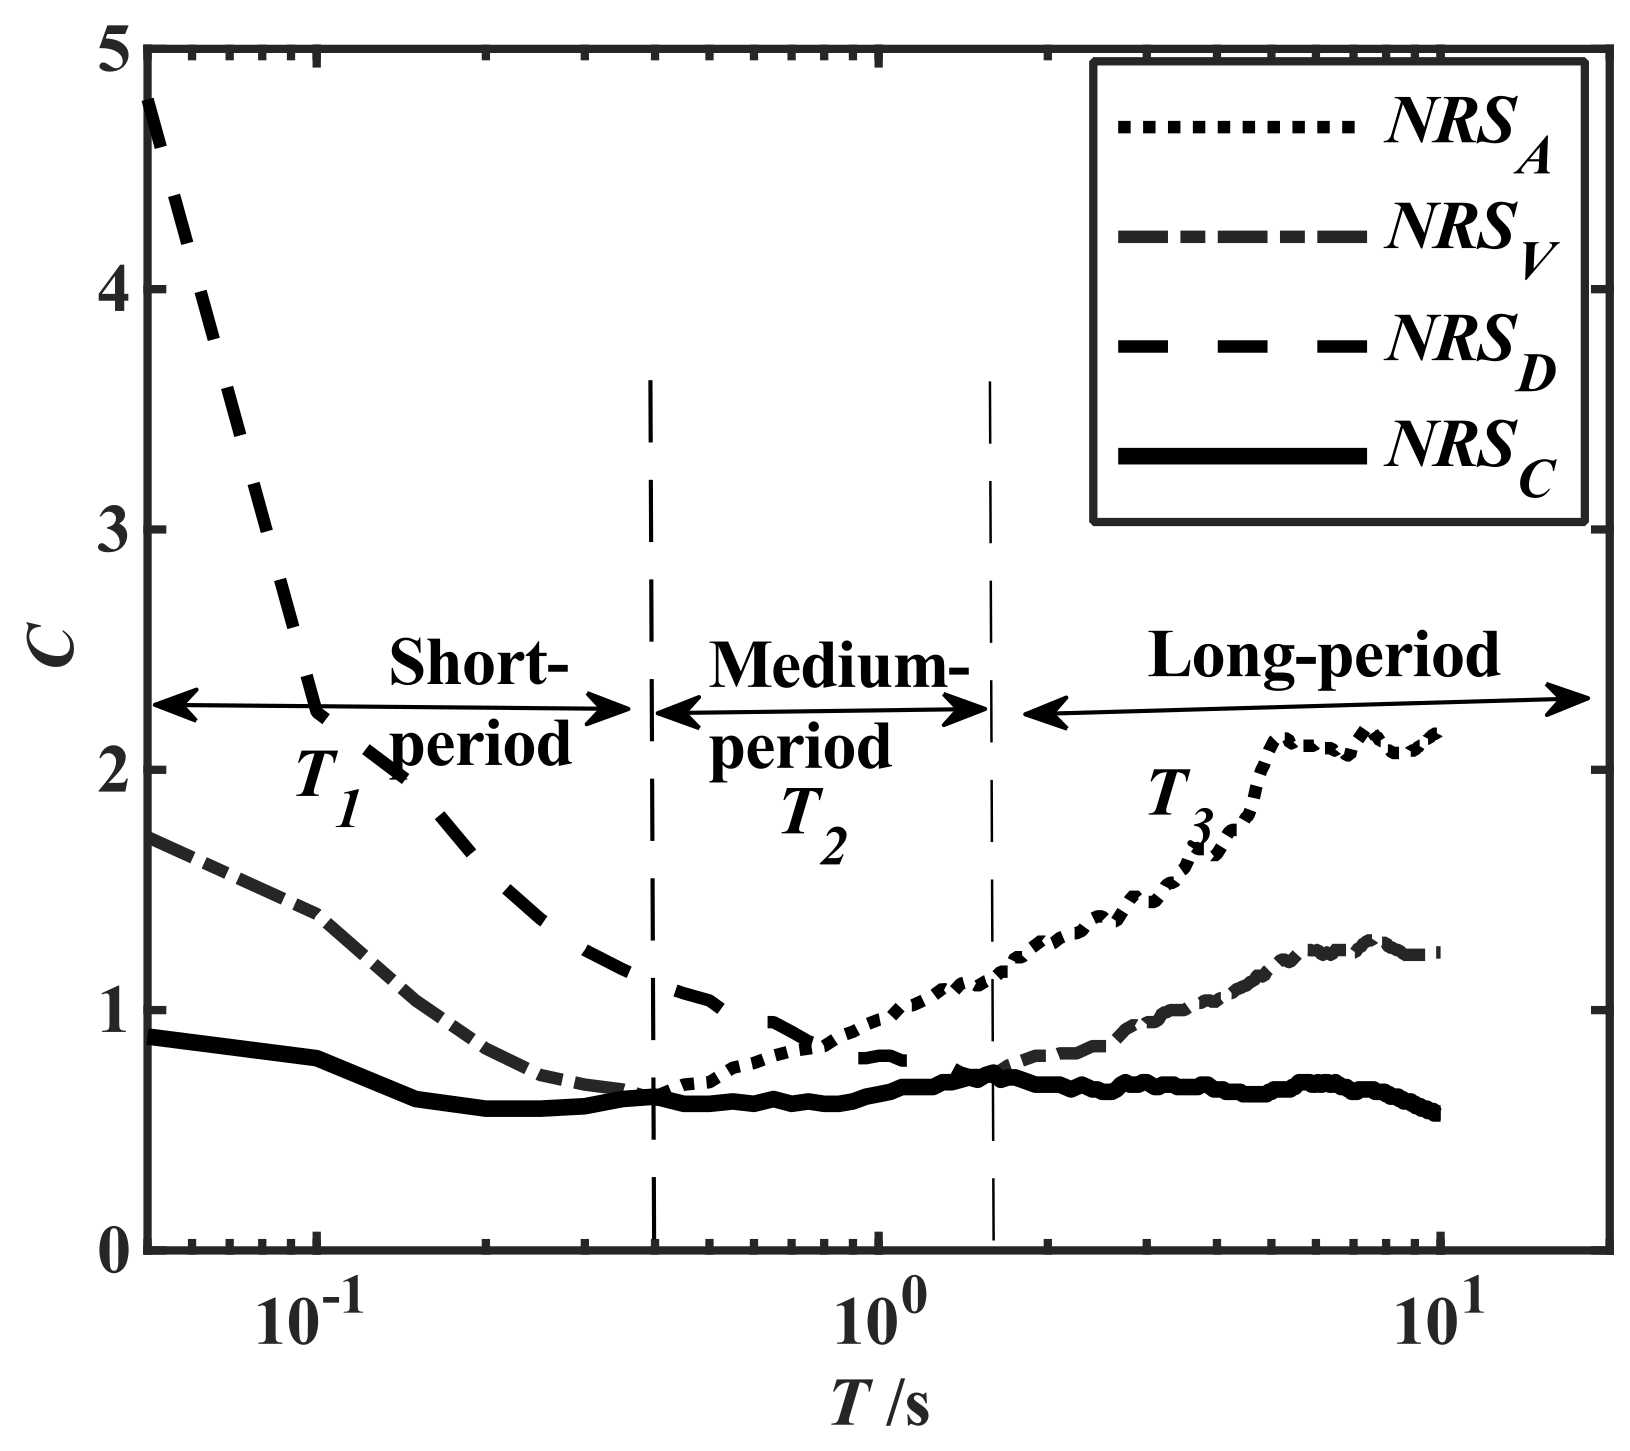
3. Period Range Dividing Based on Improved Newmark–Hall Spectrum
4. Selection of Damage Potential IMs and Statistical Parameters
5. Analysis of the Effects of Different Factors on the Damage Potential Ranking
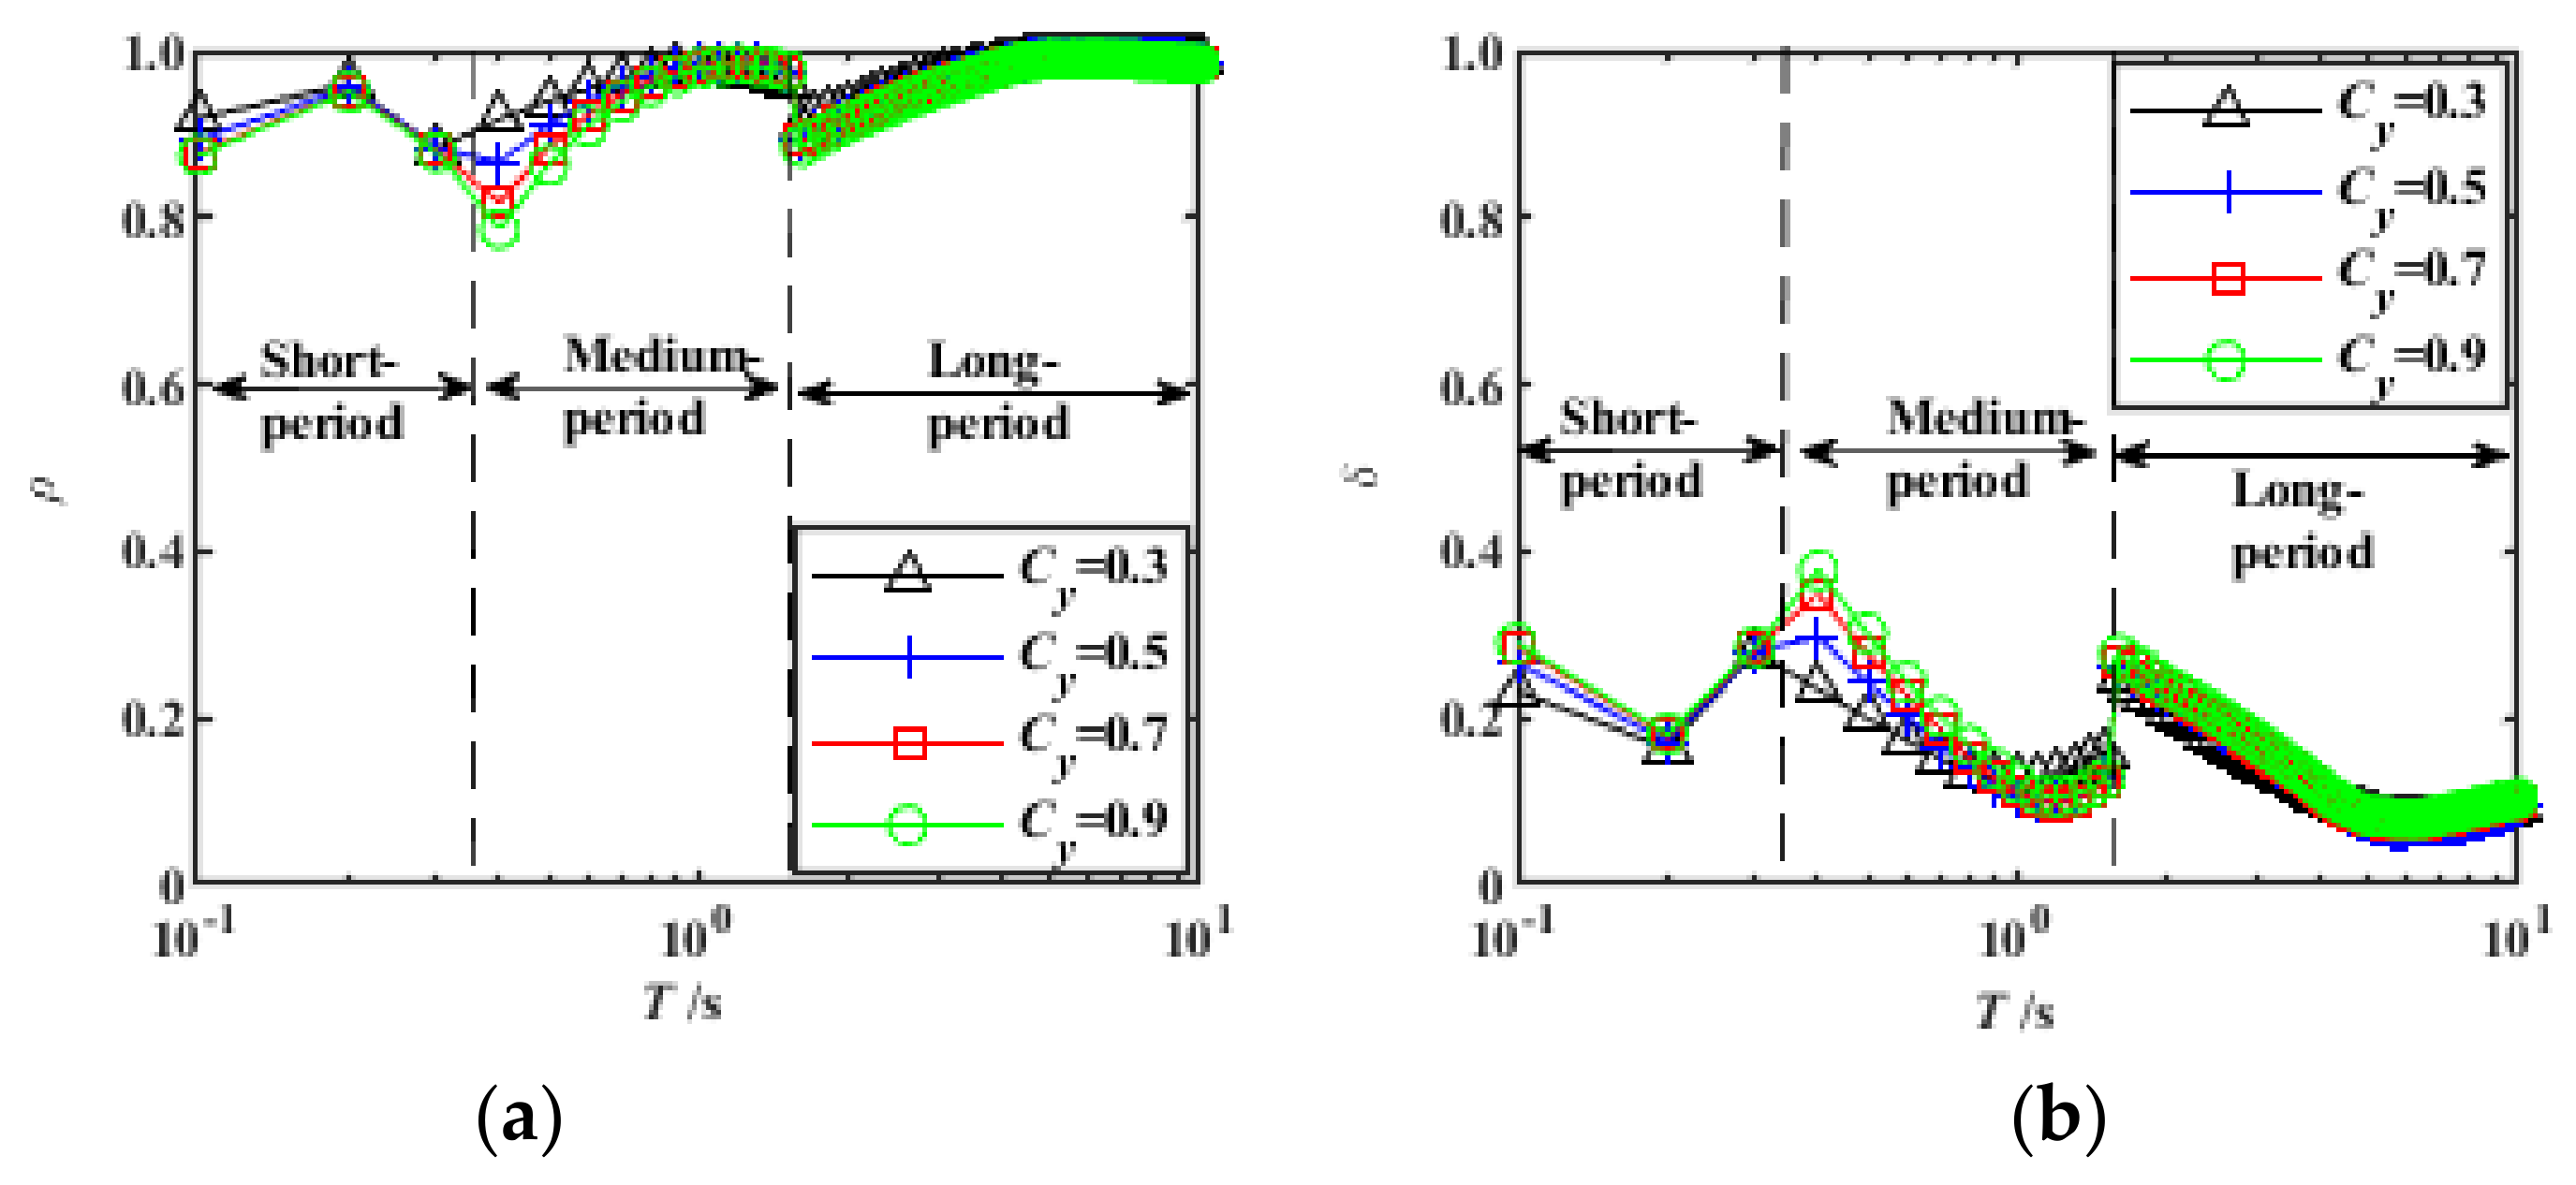
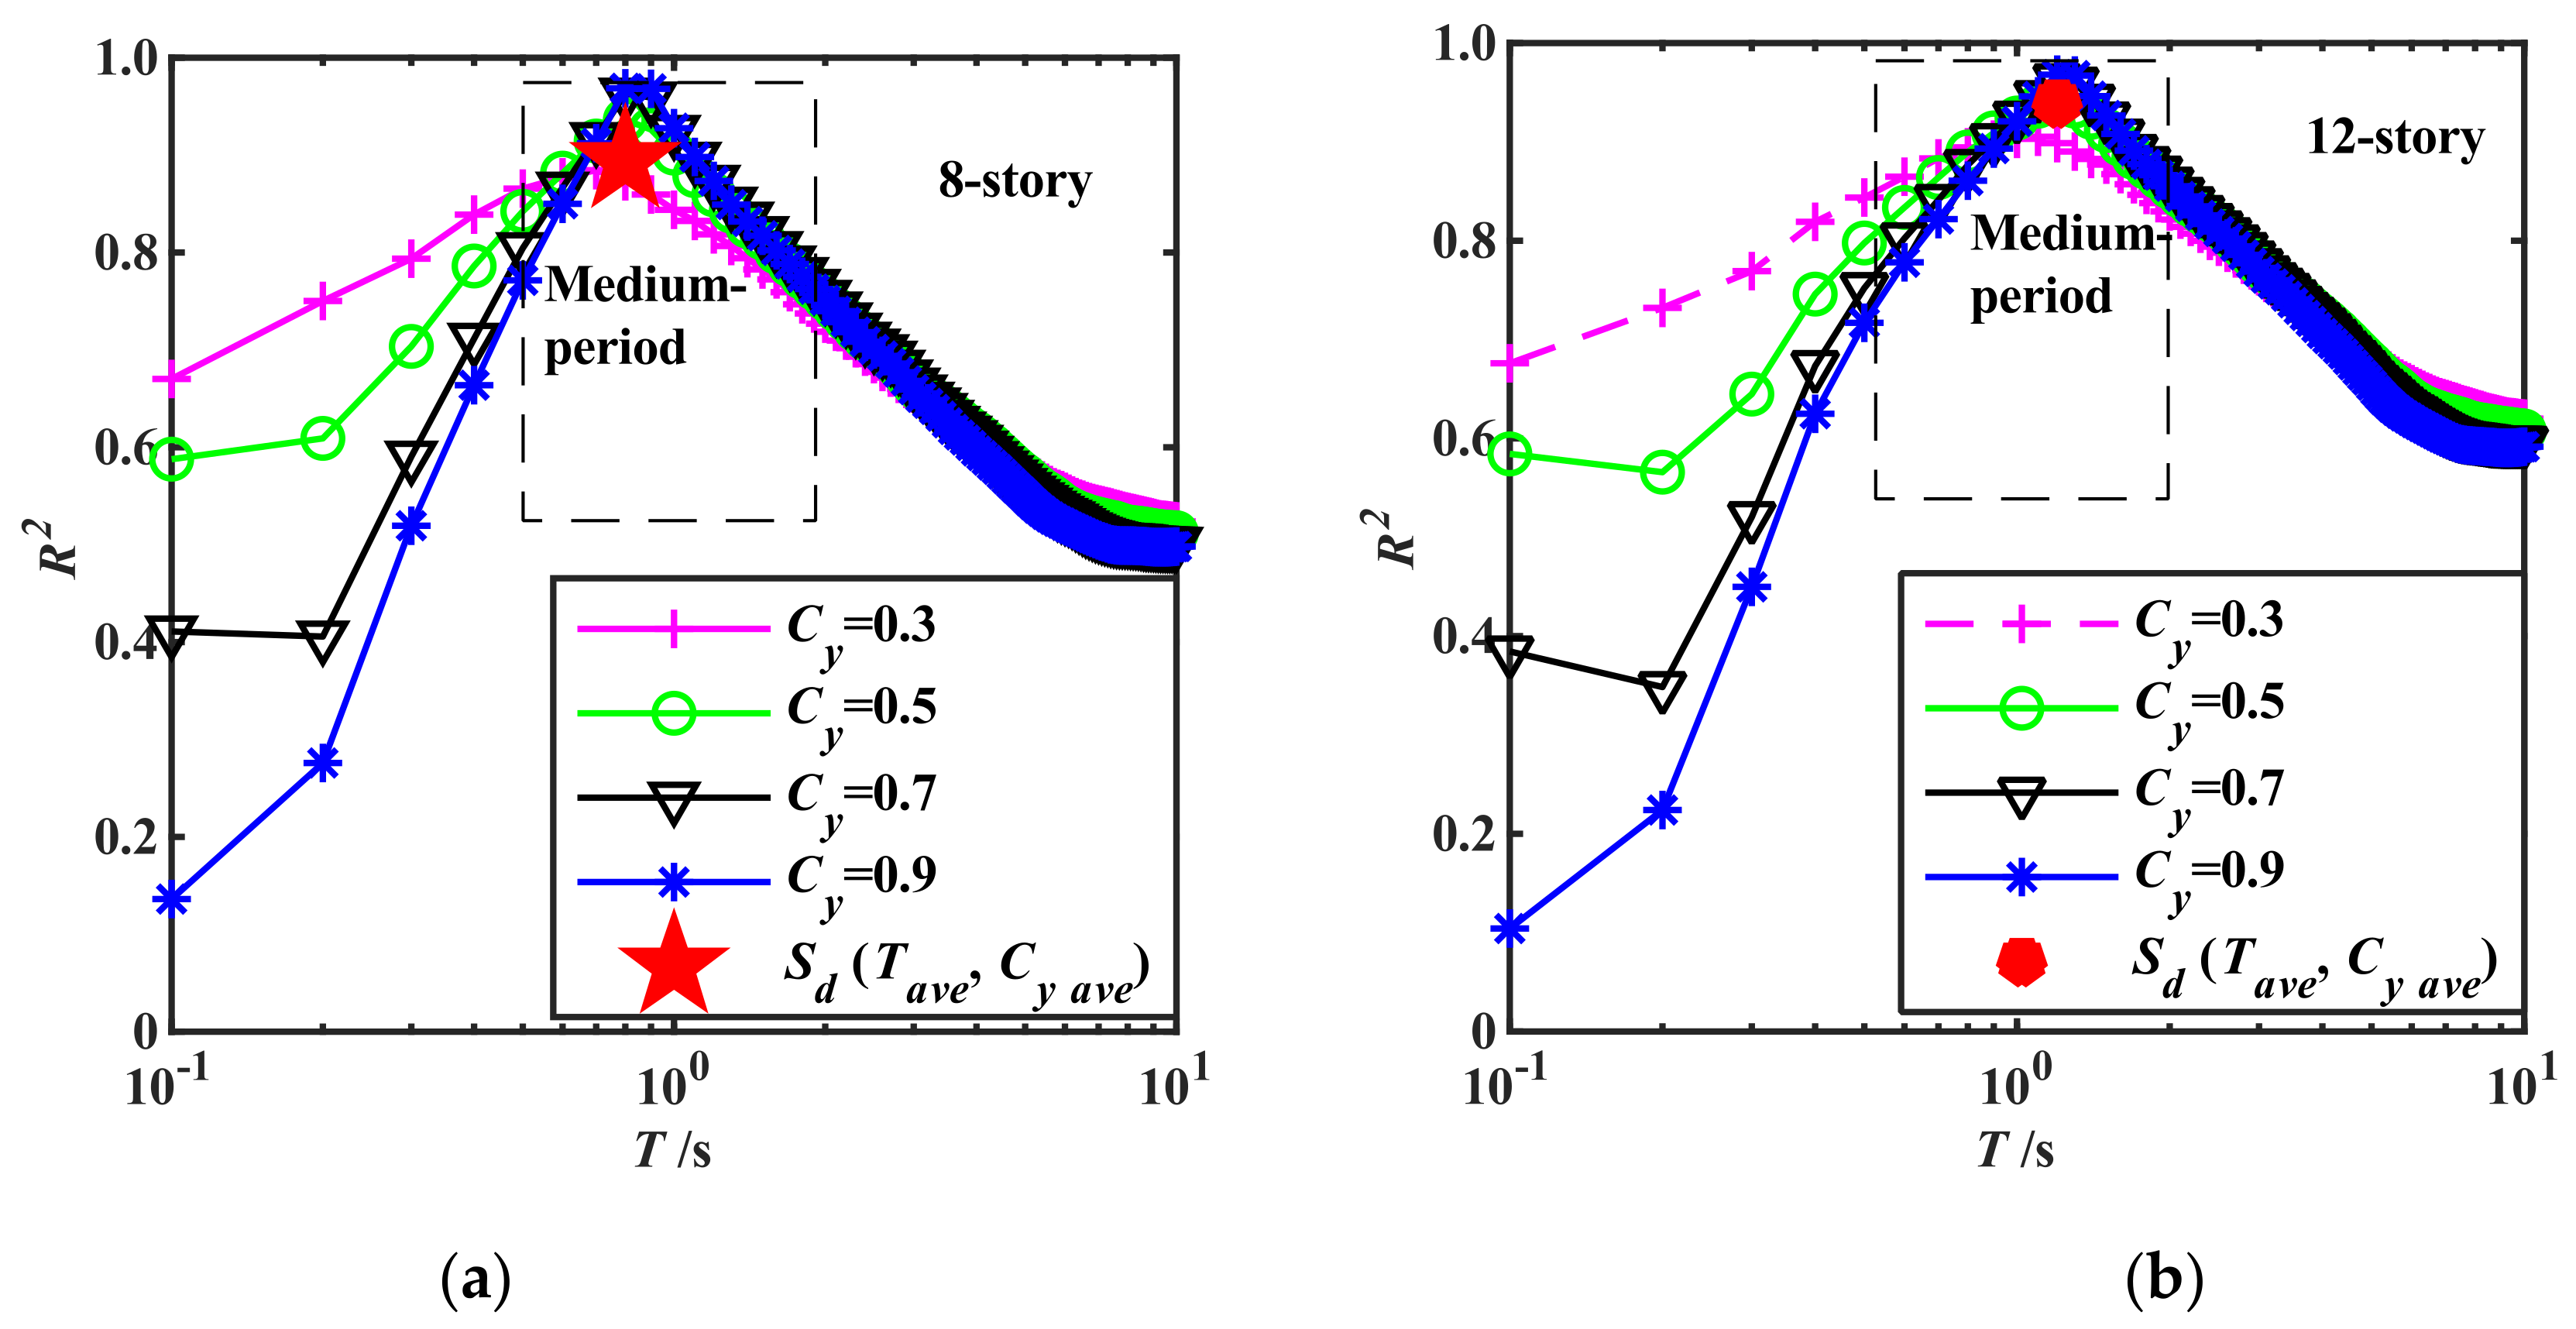
5.1. Effects of Cy and T
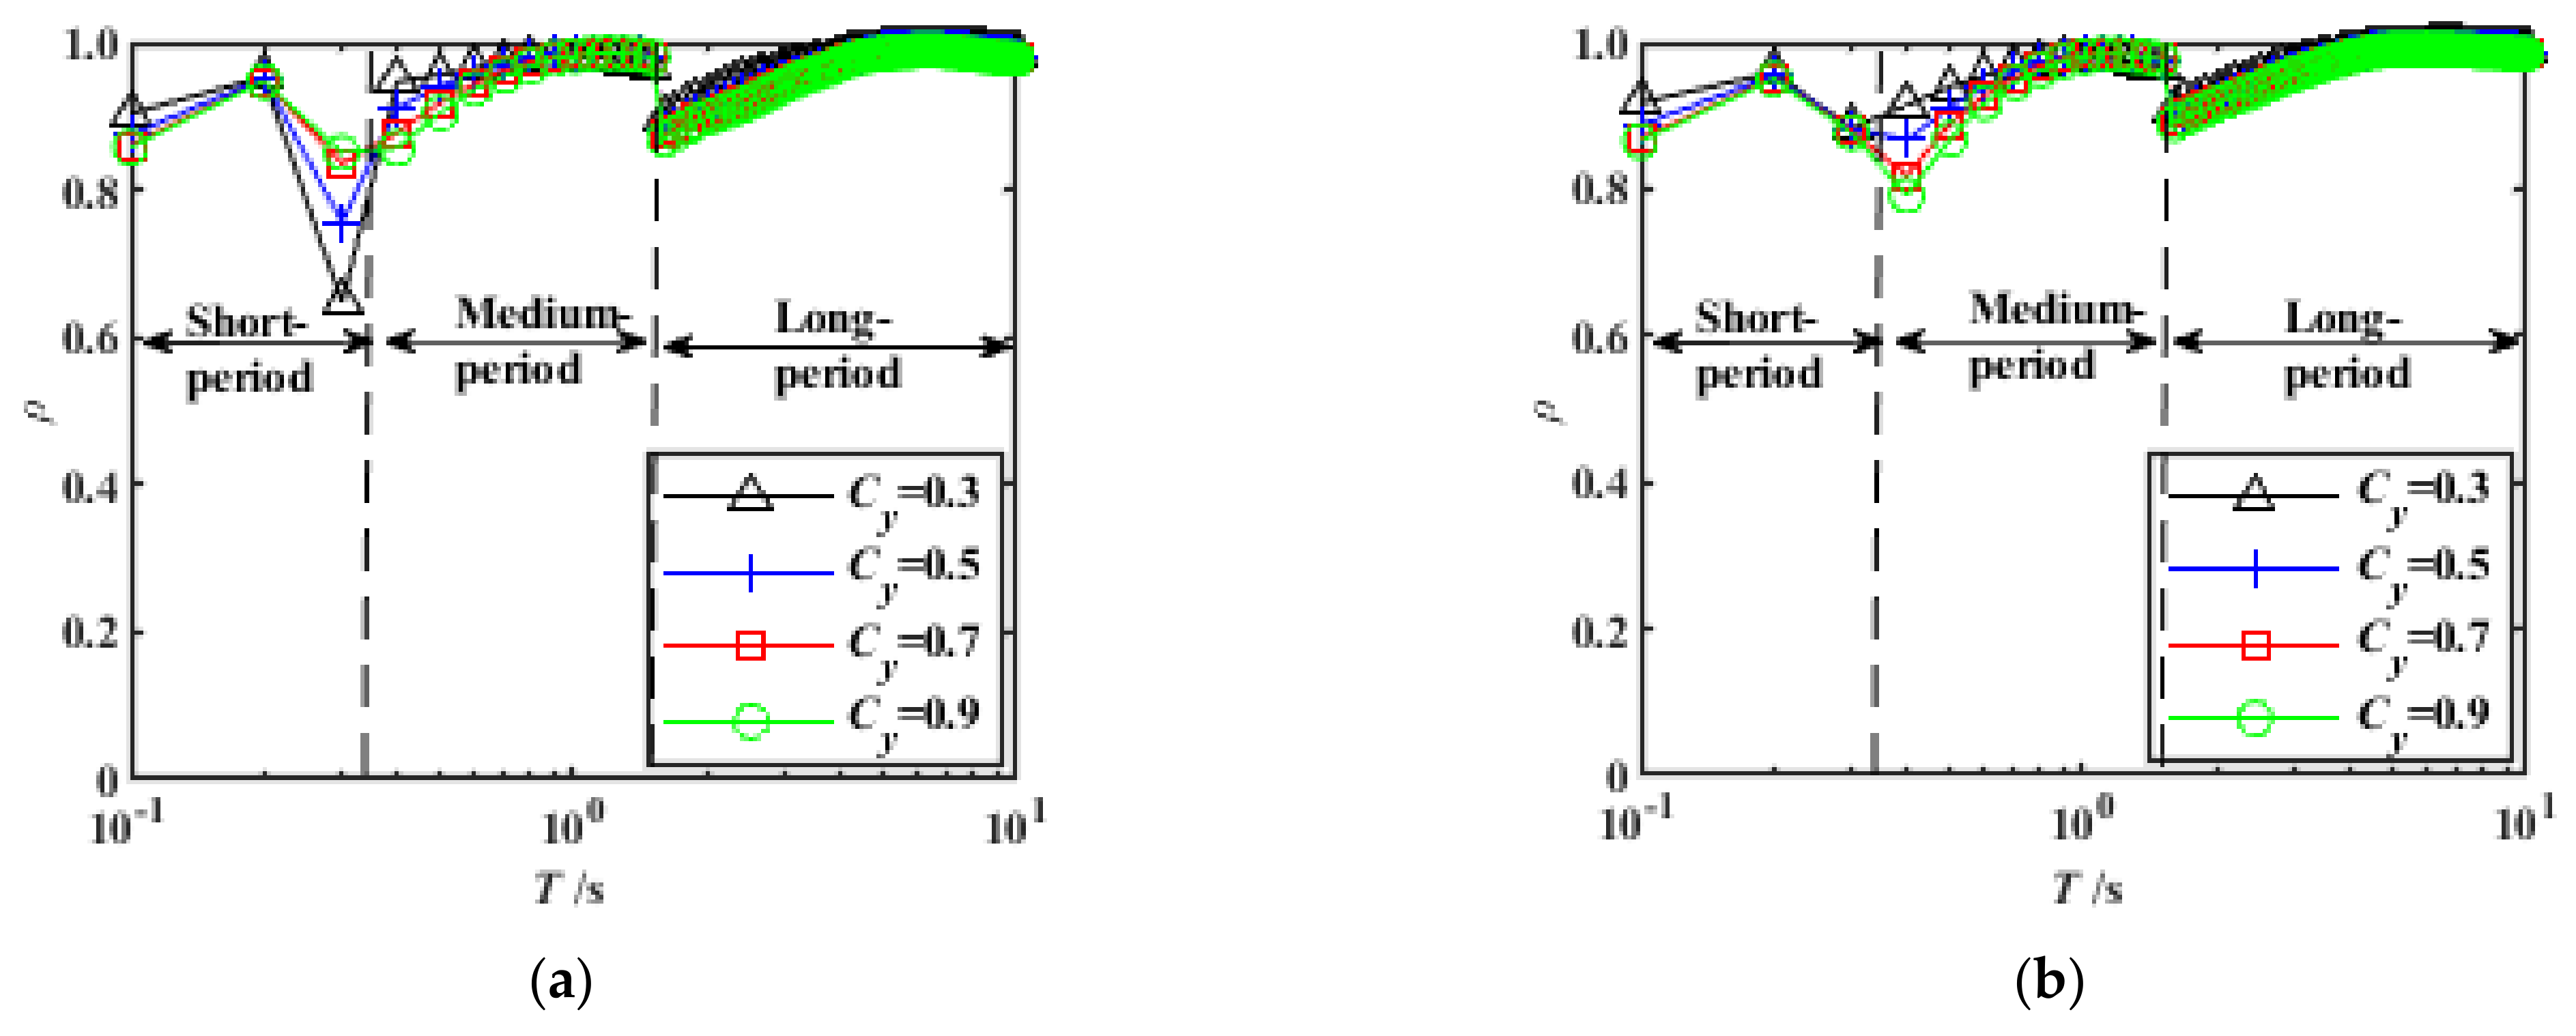
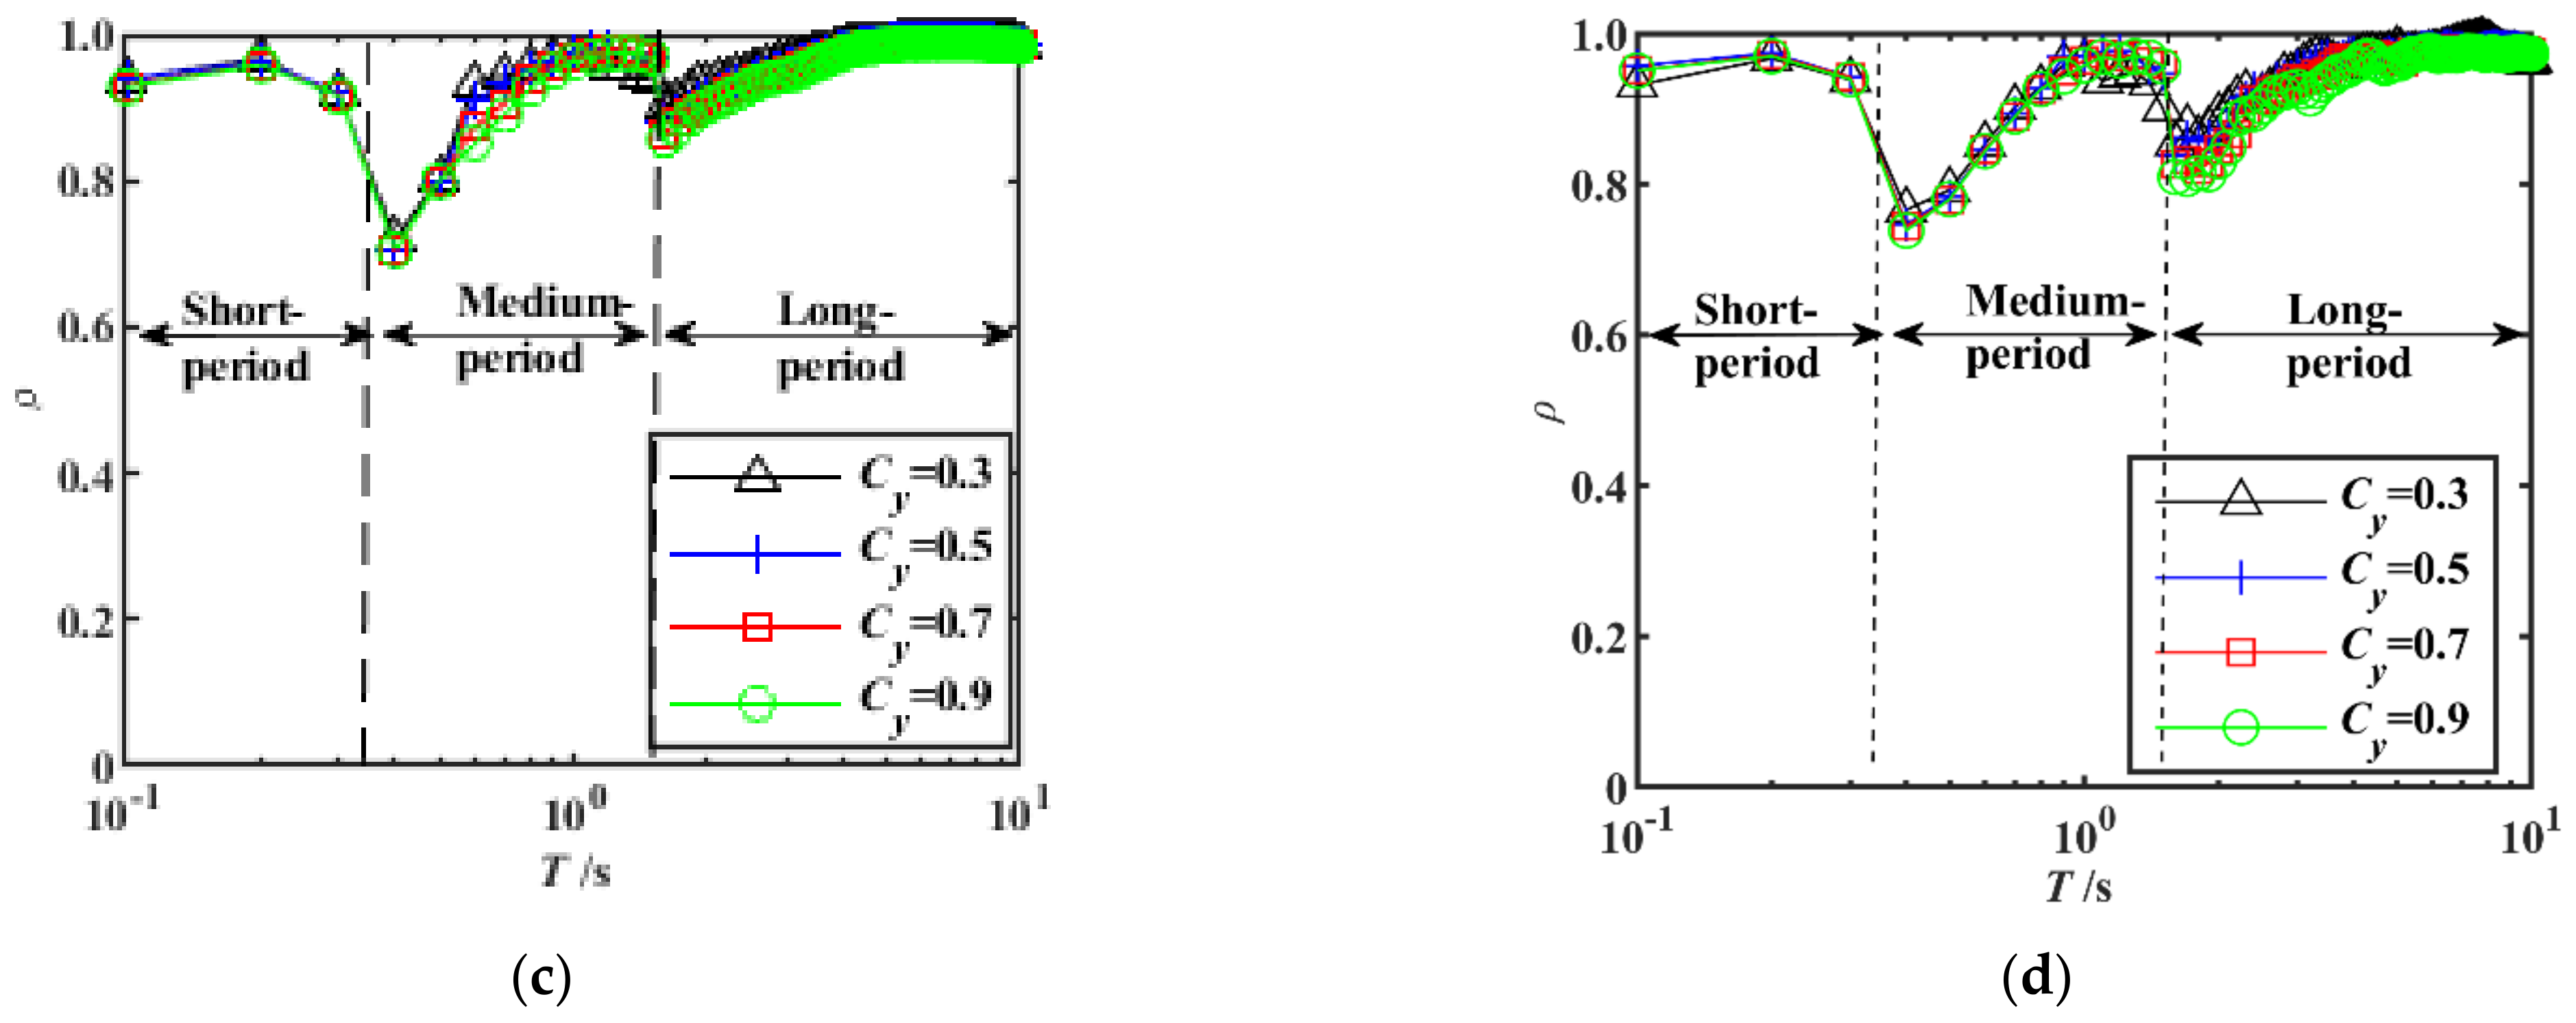
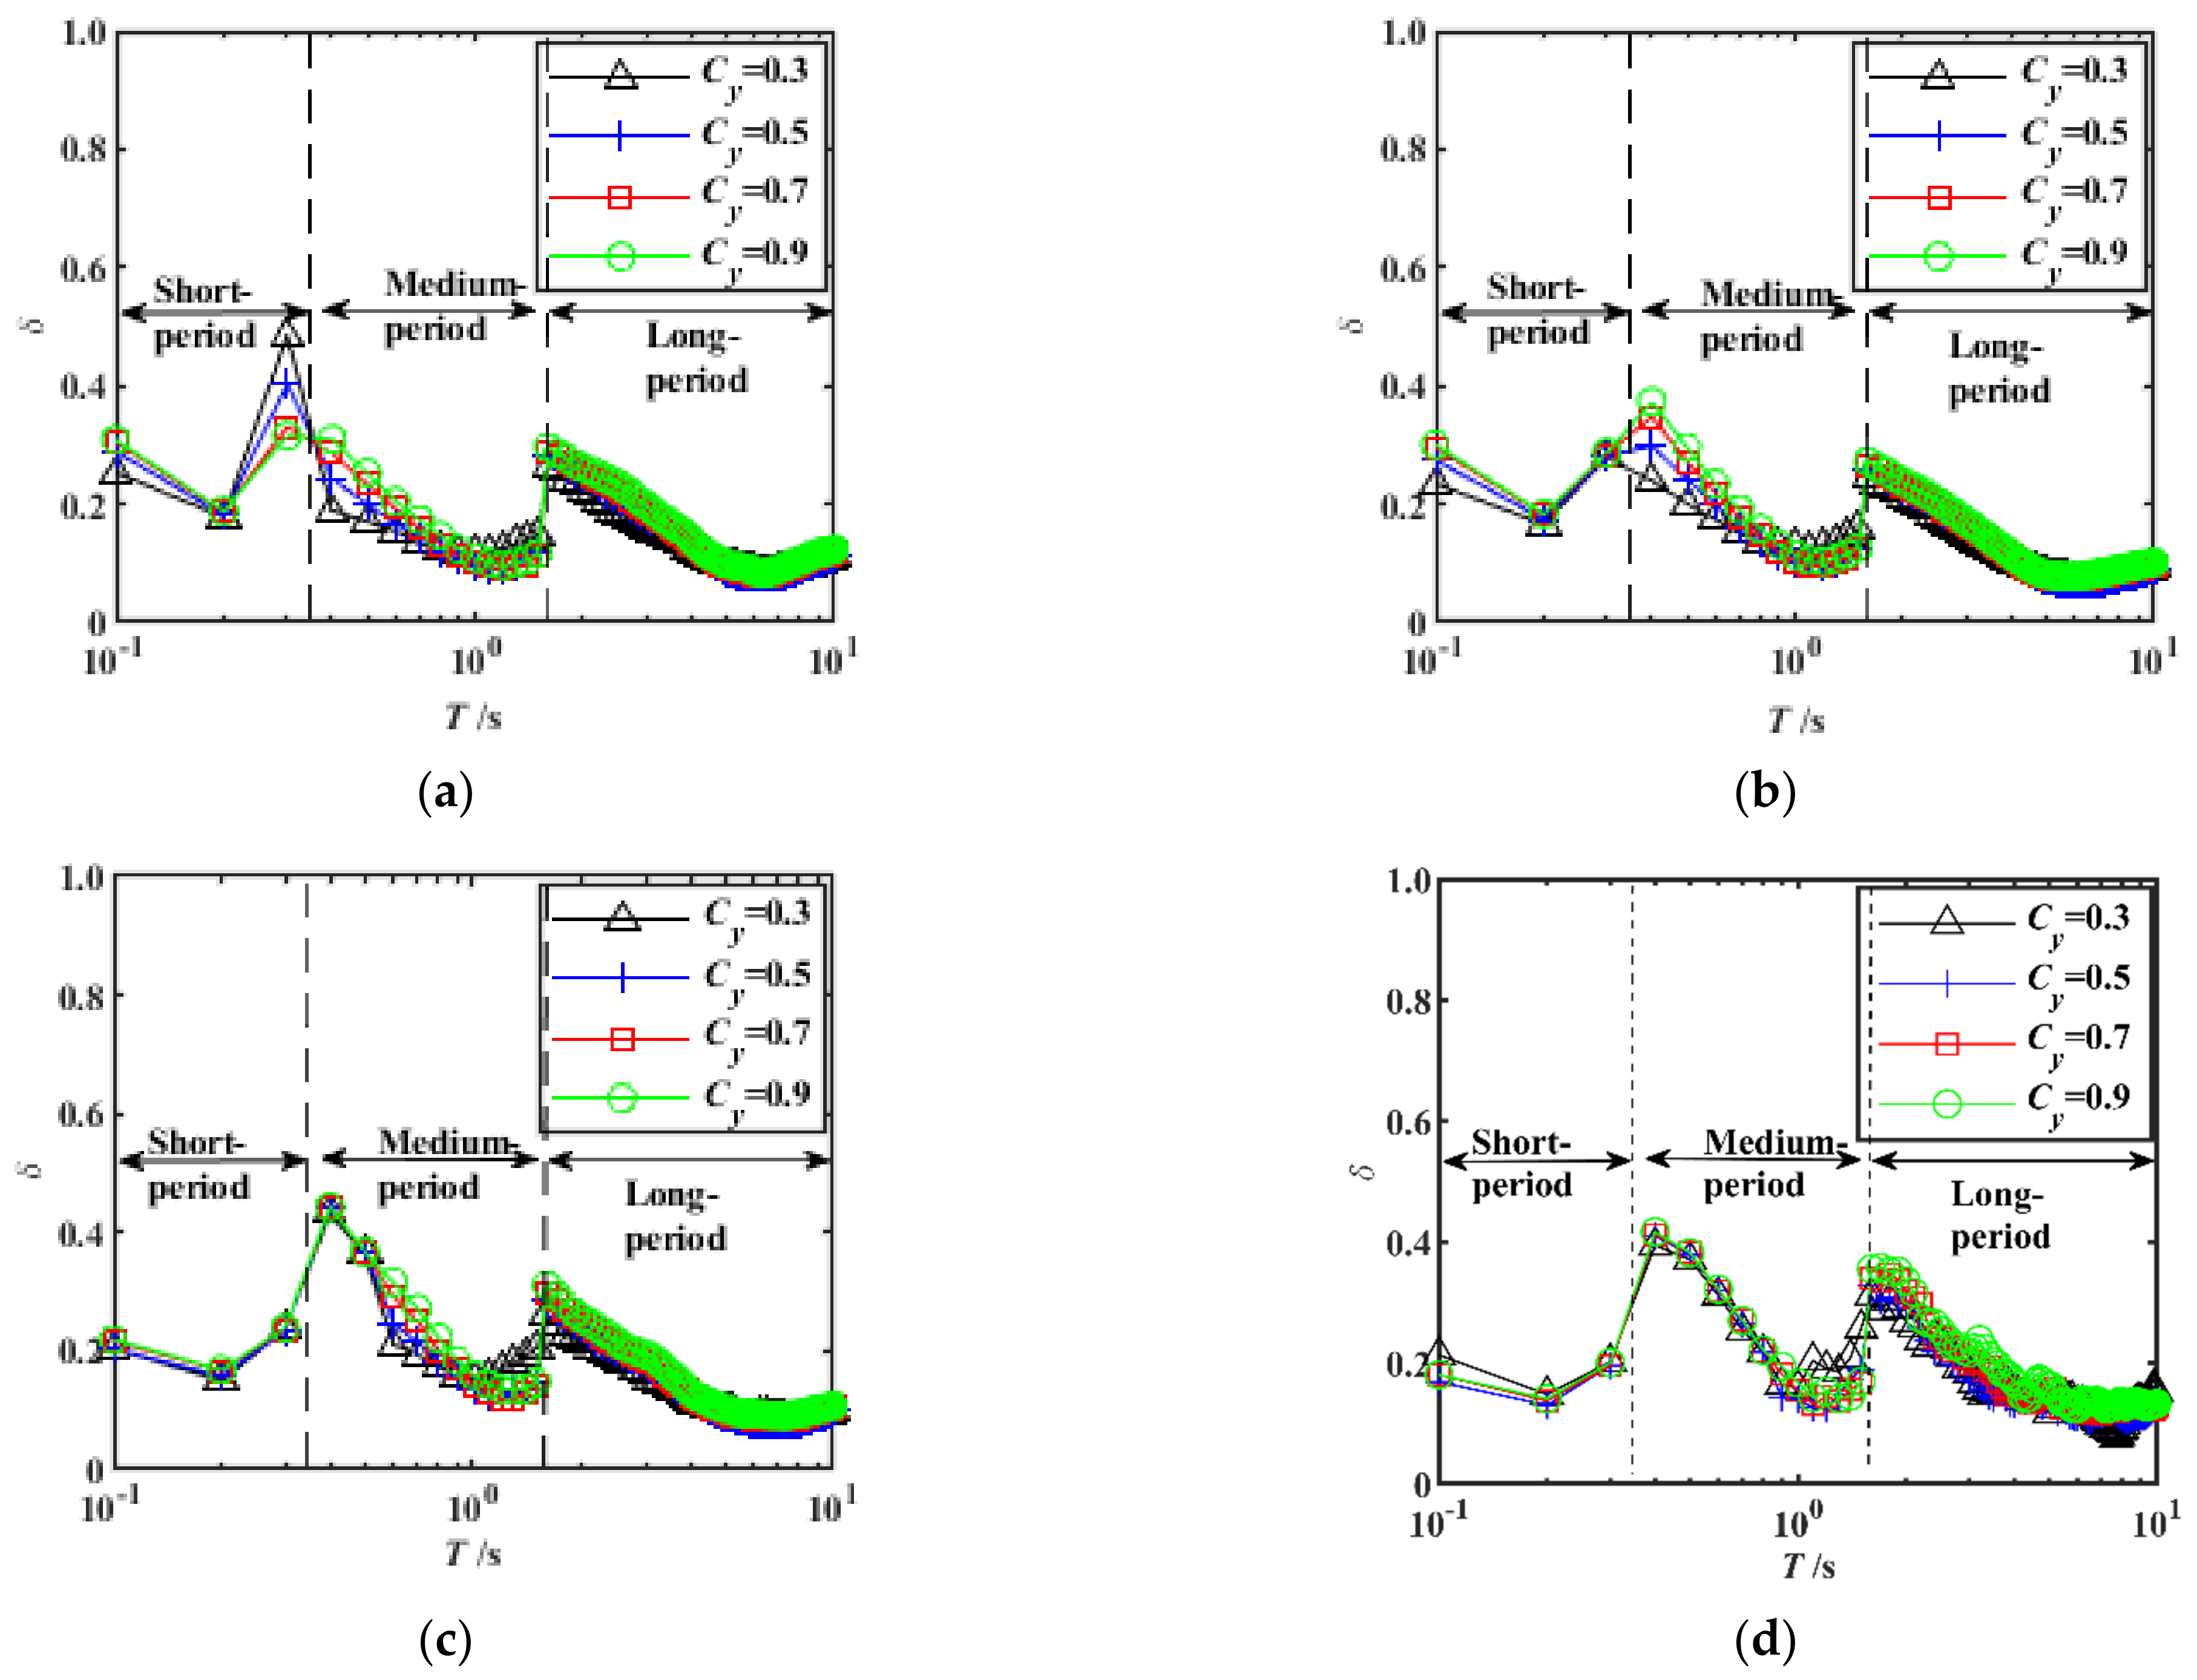
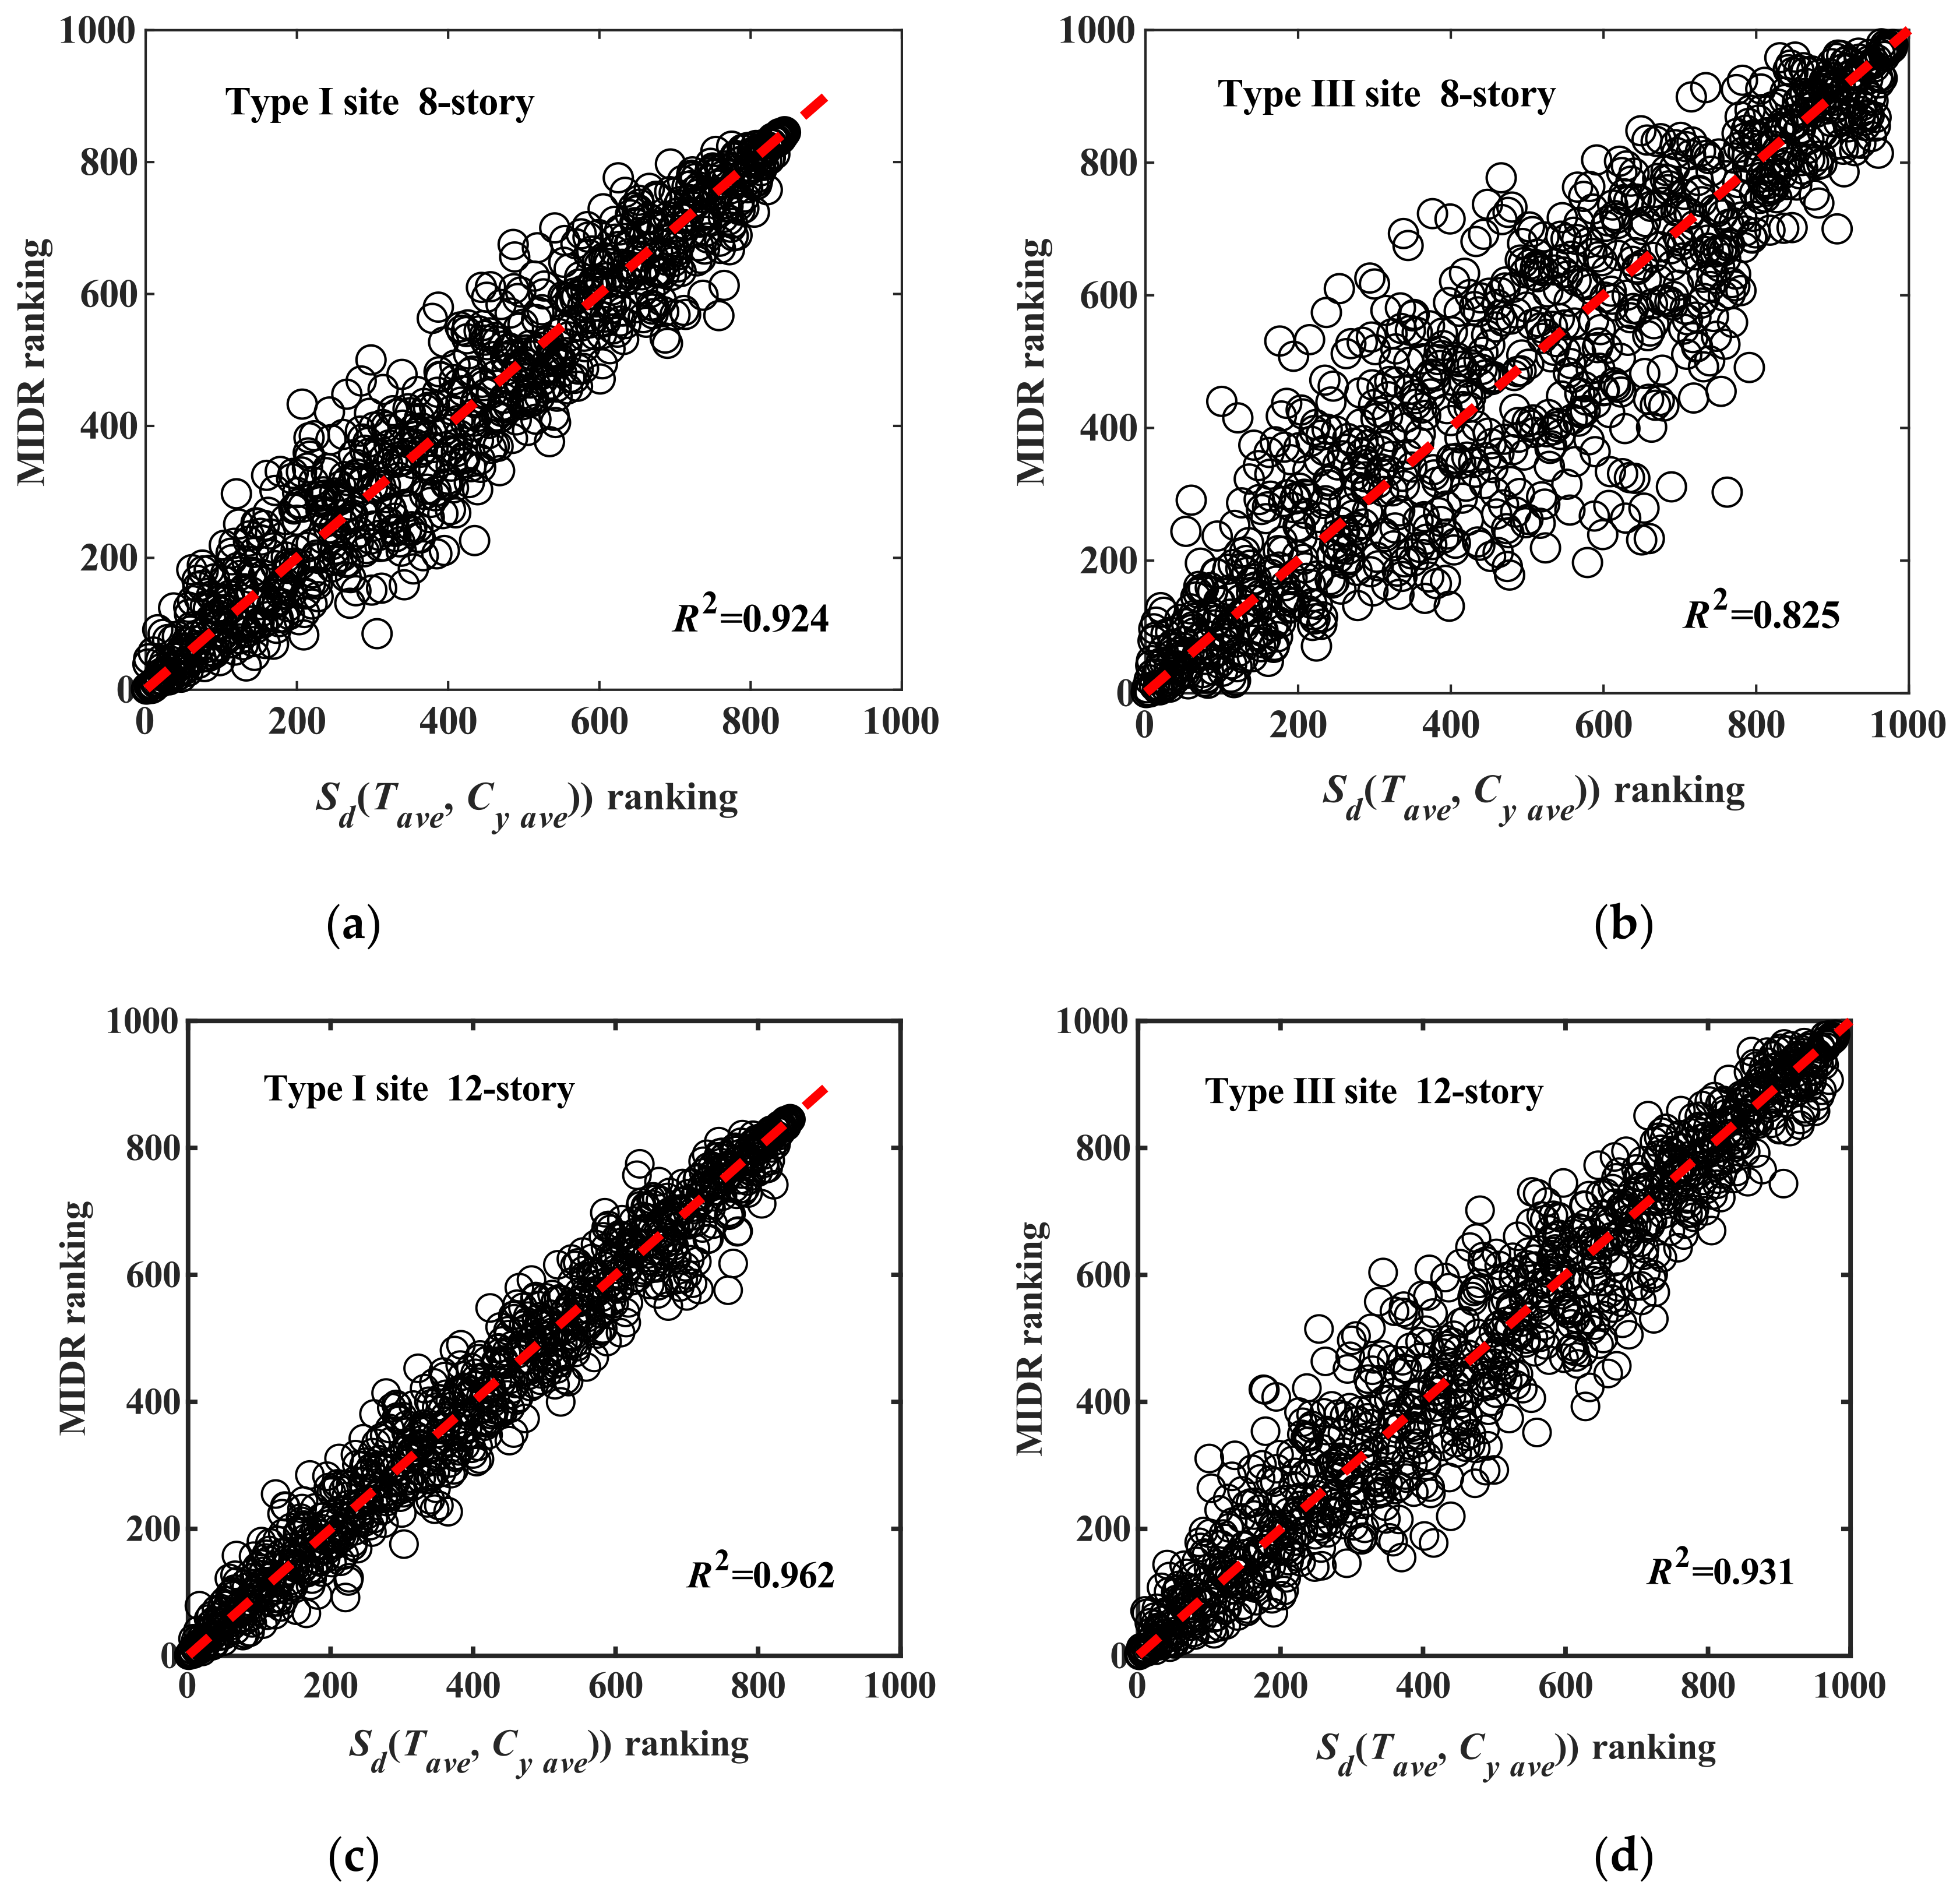
5.2. Effect of Type of Site
6. Rationality Demonstration Based on MDOF Shear Structures
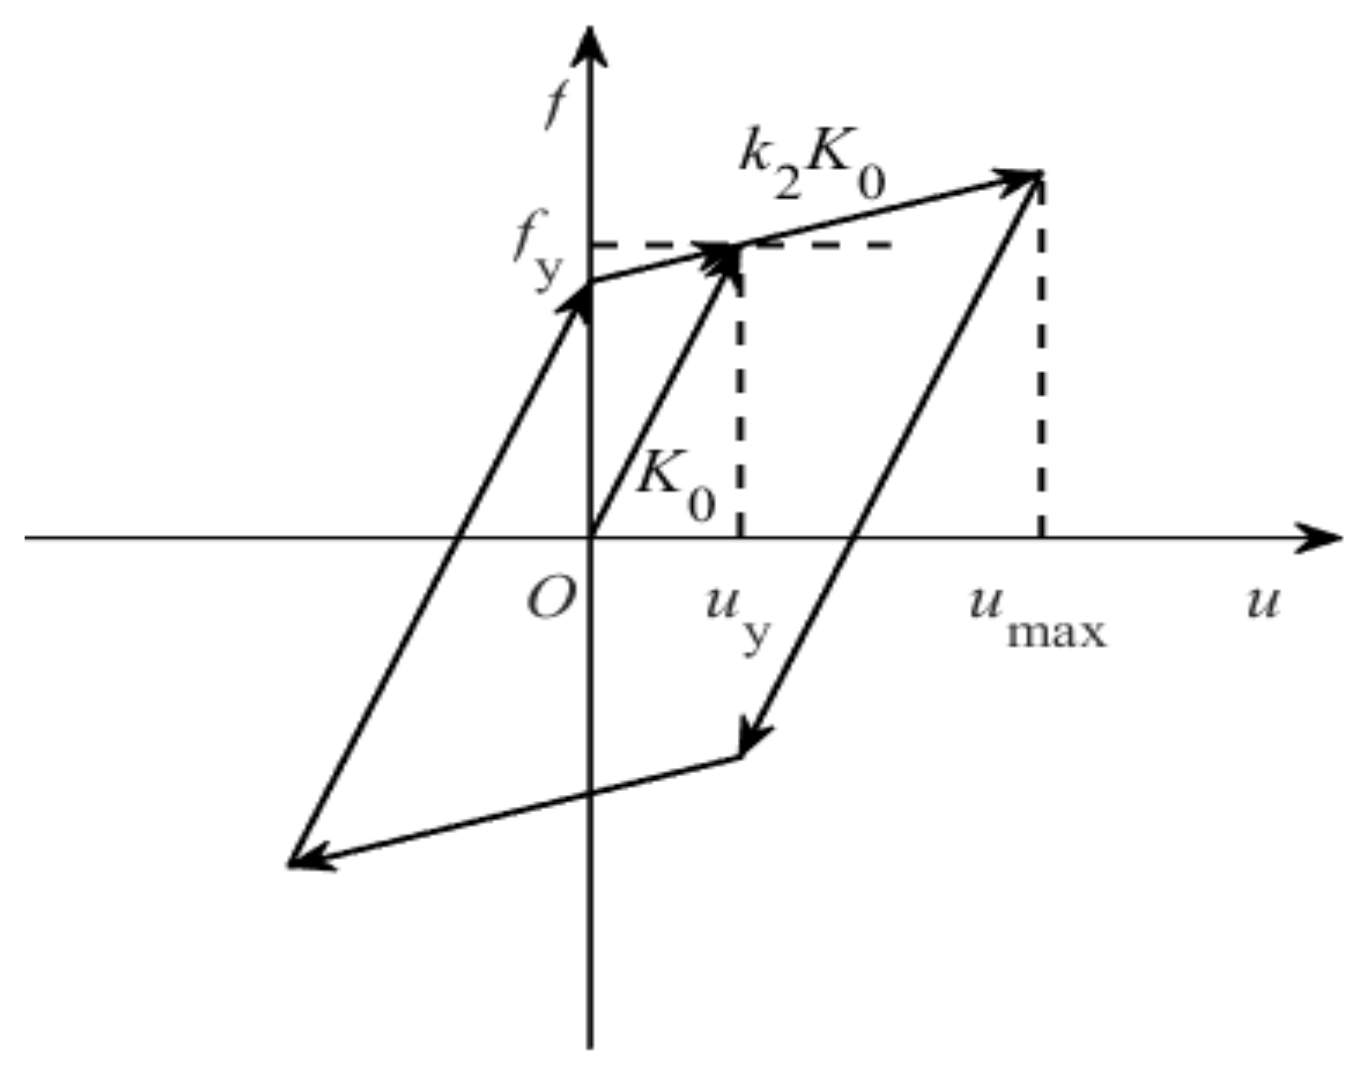
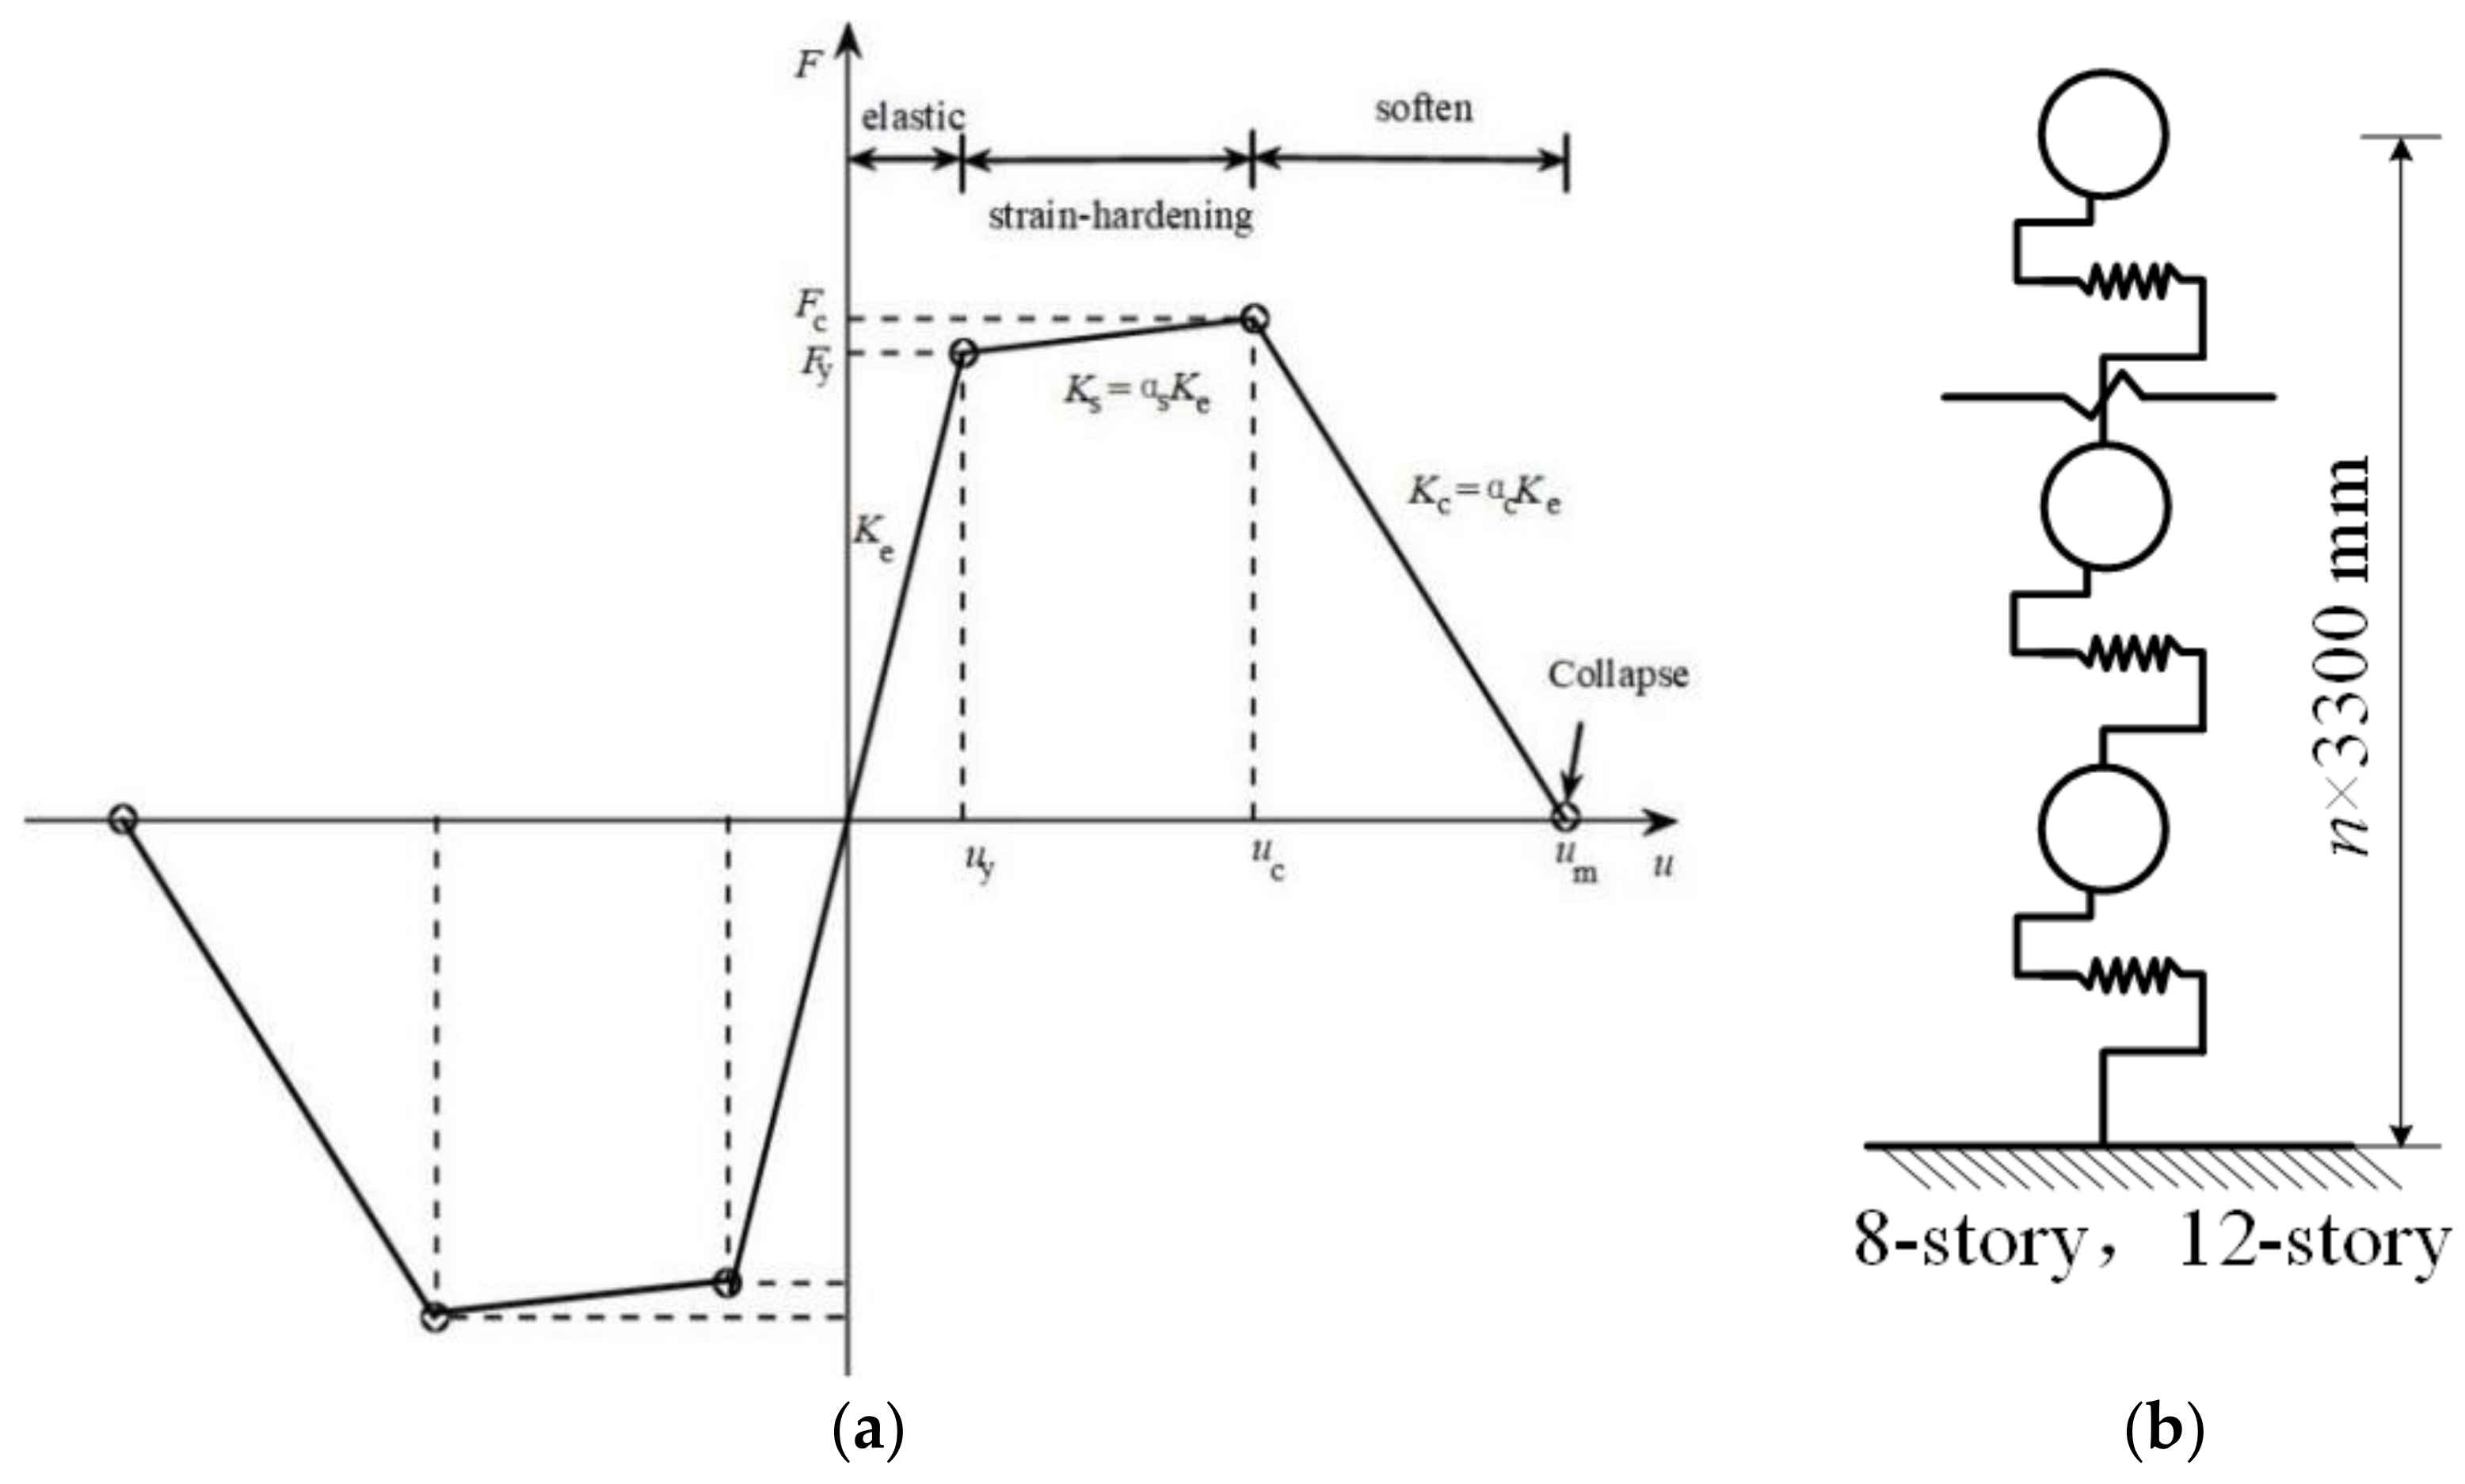
6.1. Structural Models
6.2. Rationality Demonstration
7. Conclusions
- (1)
- Based on the improved Newmark–Hall spectrum, the structure period range from 0 to 10 s is divided into three period ranges: short-period range (T < 0.40 s), medium-period range (0.40 s ≤ T < 1.55 s), and long-period range (T ≥ 1.55 s);
- (2)
- The recommended damage potential ranking and the damage potential ranking under different Cy and T conditions in the same period range has a large correlation, and the dispersion is small. The Cy and T have small effects on the damage potential ranking of ground motions in each period range, and the selected damage potential IMs are reasonable;
- (3)
- For the same types of structures, whether site factors are considered or not, the discreteness and correlation analysis between the recommended damage potential ranking of ground motions and the damage potential ranking under different Cy and T conditions are a little different. Therefore, it is unnecessary to consider the site factor when ranking the damage potential of ground motions;
- (4)
- Through the analysis of two shear structures, the R2 of the damage potential ranking and structure response ranking were found to be 0.89 and 0.94, respectively, which proves that the solution method of Cy, T, and the type of site in this paper is reasonable when establishing damage potential ranking.
Author Contributions
Funding
Institutional Review Board Statement
Informed Consent Statement
Data Availability Statement
Acknowledgments
Conflicts of Interest
References
- Li, C.; Li, H.N.; Hao, H.; Bi, K.; Chen, B. Seismic fragility analyses of sea-crossing cable-stayed bridges subjected to multi-support ground motions on offshore sites. Eng. Struct. 2018, 165, 441–456. [Google Scholar] [CrossRef]
- Kostinakis, K.; Fontara, I.K.; Athanatopoulou, A.M. Scalar structure-specific ground motion intensity measures for assessing the seismic performance of structures: A review. J. Earthq. Eng. 2018, 22, 630–665. [Google Scholar] [CrossRef]
- Salami, M.R.; Kashani, M.M.; Goda, K. Influence of advanced structural modeling technique, mainshock-aftershock sequences, and ground-motion types on seismic fragility of low-rise RC structures. Soil Dyn. Earthq. Eng. 2019, 117, 263–279. [Google Scholar] [CrossRef] [Green Version]
- Tang, L.; Zhang, Y.; Ling, X.; Tian, S. Fuzzy optimization for ground motion intensity measures to characterize the response of the pile-supported wharf in liquefiable soils. Ocean Eng. 2022, 265, 112645. [Google Scholar] [CrossRef]
- Li, C.; Zhai, C.; Kunnath, S.; Ji, D. Methodology for selection of the most damaging ground motions for nuclear power plant structures. Soil Dyn. Earthq. Eng. 2019, 116, 345–357. [Google Scholar] [CrossRef]
- Marano, G.C.; Quaranta, G. A new possibilistic reliability index definition. Acta Mech. 2010, 210, 291–303. [Google Scholar] [CrossRef]
- Zhai, C.; Li, S.; Xie, L.; Sun, Y. Study on inelastic displacement ratio spectra for near-fault pulse-type ground motions. Earthq. Eng. Eng. Vib. 2007, 6, 351–355. [Google Scholar] [CrossRef]
- Xie, L.L.; Zhai, C.H. Study on the severest real ground motion for seismic design and analysis. Acta Seismol. Sin. 2003, 16, 260. [Google Scholar] [CrossRef]
- Yi, W.J.; Zhang, H.Y.; Kunnath, S.K. Probabilistic constant-strength ductility demand spectra. J. Struct. Eng. 2007, 133, 567–575. [Google Scholar] [CrossRef]
- Rosso, M.M.; Asso, R.; Aloisio, A.; Di Benedetto, M.; Cucuzza, R.; Greco, R. Corrosion effects on the capacity and ductility of concrete half-joint bridges. Constr. Build. Mater. 2022, 360, 129555. [Google Scholar] [CrossRef]
- Ji, D.; Wen, W.; Zhai, C. Constant-ductility energy factors of SDOF systems subjected to mainshock–aftershock sequences. Earthq. Spectra 2021, 37, 1078–1107. [Google Scholar] [CrossRef]
- Hu, J.J.; Lai, Q.H.; Liu, X.; Xie, L. Effects of structural and seismic factors on the constant-strength ductility spectra based on NGA-West2 database. Shock Vib. 2020, 4, 8820582. [Google Scholar] [CrossRef]
- Aloisio, A.; Rosso, M.M.; Iqbal, A.; Fragiacomo, M. Hysteresis modeling of timber-based structural systems using a combined data and model-driven approach. Comput. Struct. 2022, 269, 106830. [Google Scholar] [CrossRef]
- Fiore, A.; Marano, G.C.; Monaco, P. Earthquake-induced lateral-torsional pounding between two equal height multi-storey buildings under multiple bi-directional ground motions. Adv. Struct. Eng. 2013, 16, 845–865. [Google Scholar] [CrossRef]
- Ning, C.L.; Wang, S.; Cheng, Y. An explicit solution for the effect of earthquake incidence angles on seismic ductility demand of structures using Bouc-Wen model. Soil Dyna. Earthq. Eng. 2022, 153, 107085. [Google Scholar] [CrossRef]
- Lu, X.L.; Zhou, D.S. Ductility demand spectra and inelastic displacement spectra considering soil conditions and design characteristic periods. Earthq. Eng. Eng. Vib. 2004, 24, 39–48. (In Chinese) [Google Scholar]
- Rupakhety, R.; Sigbjornsson, R. Ground-motion prediction equations (GMPEs) for inelastic displacement and ductility demands of constant-strength SDOF systems. Bull. Earthq. Eng. 2009, 7, 661–679. [Google Scholar] [CrossRef]
- Miranda, E.; Bertero, V.V. Evaluation of strength reduction factors for earthquake resistant design. Earthq. Spectra 1994, 10, 357–379. [Google Scholar] [CrossRef]
- Miranda, E. Inelastic Displacement ratios for structures on firm sites. J. Struct. Eng. 2000, 126, 1150–1159. [Google Scholar] [CrossRef]
- Baker, J.W.; Cornell, C.A. A vector-valued ground motion intensity measure consisting of spectral acceleration and epsilon. Earthq. Eng. Struct. Dyn. 2005, 34, 1193–1217. [Google Scholar] [CrossRef]
- Baker, J.W.; Cornell, C.A. Spectral shape, epsilon and record selection. Earthq. Eng. Struct. Dyn. 2006, 35, 1077–1095. [Google Scholar] [CrossRef]
- Baker, J.W. Efficient analytical fragility function fitting using dynamic structural analysis. Earthq. Spectra 2015, 31, 579–599. [Google Scholar] [CrossRef]
- Baker, J.W. Conditional mean spectrum: Tool for ground-motion selection. J. Struct. Eng. 2011, 137, 322–331. [Google Scholar] [CrossRef]
- GB 50011-2010; Code for Seismic Design of Buildings. China Architecture & Building Press: Beijing, China, 2010.
- Guo, F.; Wu, D.M.; Xu, G.F.; Ji, Y.L. Site classification corresponding relationship between Chinese and the overseas seismic design codes. J. Civ. Eng. Manag. 2011, 28, 63–66. (In Chinese) [Google Scholar] [CrossRef]
- Hu, J.J.; Lai, Q.H.; Li, S.; Xie, L.L. Procedure for ranking ground motion records based on the destructive capacity parameter. KSCE J. Civ. Eng. 2020, 25, 197–207. [Google Scholar] [CrossRef]
- Newmark, N.M.; Blume, J.A.; Kapur, K.K. Seismic Design Spectra for Nuclear Power Plants. ASCE Power Div. J. 1973, 99, 287–303. [Google Scholar] [CrossRef]
- Seed, H.B.; Ugas, C.; Lysmer, J. Site-dependent spectra for earthquake-resistant design. Bull. Seismol. Soc. Am. 1976, 66, 221–243. [Google Scholar] [CrossRef]
- Xu, L.J.; Zhao, G.C.; Liu, Q. Consecutive combined response spectrum. Earthq. Eng. Eng. Vib. 2014, 13, 623–636. [Google Scholar] [CrossRef]
- Xiong, C.; Lu, X.; Lin, X.; Xu, Z.; Ye, L. Parameter determination and damage assessment for THA-based regional seismic damage prediction of multi-story buildings. J. Earthq. Eng. 2017, 21, 461–485. [Google Scholar] [CrossRef]
- Jalayer, F.; Beck, J.L.; Zareian, F. Analyzing the Sufficiency of Alternative Scalar and Vector Intensity Measures of Ground Shaking Based on Information Theory. J. Eng. Mech. 2012, 138, 307–316. [Google Scholar] [CrossRef]
- Mahaney, J.A.; Paret, T.F.; Kehoe, B.E.; Freeman, S.A. The capacity spectrum method for evaluating structural response during the Loma Prieta earthquake. In Mitigation and Damage to the Built Environment; U.S. Central United States Earthquake Consortium (CUSEC): Memphis, TN, USA, 1993. [Google Scholar]
- Zhang, R.; Wang, D.S.; Chen, X.Y.; Li, H.N. Weighted scaling and selecting method of ground motions in time-history analysis considering influence of higher modes. China Civ. Eng. J. 2019, 52, 53–68. (In Chinese) [Google Scholar] [CrossRef]
- Yakhchalian, M.; Amiri, G.G. A vector intensity measure to reliably predict maximum drift in low- to mid-rise buildings. Struct. Build. 2018, 172, 42–54. [Google Scholar] [CrossRef]
- Wang, D.H. Multivariate Statistical Analysis and SPSS Application; East China University of Science and Technology Press: Sanghai, China, 2010. (In Chinese) [Google Scholar]
- ASCE/SEI 7-16; Mininum Design Loads for Buildings and Other Structures. American Society of Civil Engineers: Reston, VA, USA, 2016.
- Ibarra, L.F.; Medina, R.A.; Krawinkler, H. Hysteretic models that incorporate strength and stiffness deterioration. Earthq. Eng. Struct. Dyn. 2005, 34, 1489–1511. [Google Scholar] [CrossRef]
- Ibarra, L.F.; Krawinkler, H. Variance of collapse capacity of SDOF systems under earthquake excitations. Earthq. Eng. Struct. Dyn. 2011, 40, 1299–1314. [Google Scholar] [CrossRef]


| Type of Sites | Range of Vs30 (m·s−1) | Number |
|---|---|---|
| Type I site | Vs30 > 550 | 846 |
| Type II site | 265 < Vs30 < 550 | 3646 |
| Type III site | 165 < Vs30 < 265 | 979 |
| Type IV site | Vs30 ≤ 165 | 64 |
| Short-Period Range | Medium-Period Range | Long-Period Range |
|---|---|---|
| T < 0.40 s | 0.40 s ≤ T < 1.55 s | T ≥ 1.55 s |
| Cy | Short-Period Range | Medium-Period Range | Long-Period Range | |||
|---|---|---|---|---|---|---|
| R | δ | R | δ | R | δ | |
| Cy = 0.3 | 0.921 | 0.225 | 0.963 | 0.155 | 0.980 | 0.106 |
| Cy = 0.5 | 0.911 | 0.239 | 0.960 | 0.152 | 0.979 | 0.110 |
| Cy = 0.7 | 0.903 | 0.249 | 0.951 | 0.163 | 0.977 | 0.114 |
| Cy = 0.9 | 0.901 | 0.252 | 0.942 | 0.177 | 0.975 | 0.119 |
| Average | 0.909 | 0.241 | 0.954 | 0.162 | 0.978 | 0.111 |
| Site Factor | Short-Period Range | Medium-Period Range | Long-Period Range | |||
|---|---|---|---|---|---|---|
| R | δ | R | δ | R | δ | |
| Type I site | 0.865 | 0.213 | 0.966 | 0.155 | 0.972 | 0.123 |
| Type II site | 0.906 | 0.243 | 0.955 | 0.160 | 0.978 | 0.115 |
| Type III site | 0.937 | 0.263 | 0.918 | 0.178 | 0.973 | 0.118 |
| Type IV site | 0.953 | 0.233 | 0.909 | 0.190 | 0.958 | 0.148 |
| Not consider site factor | 0.915 | 0.243 | 0.937 | 0.163 | 0.970 | 0.113 |
| Structural Models | Story | T1 (s) | Hi (mm) | Wi (kg) | Kei (kN·mm−1) | Fyi (kN) | as | ac | uc/uy | ξ |
|---|---|---|---|---|---|---|---|---|---|---|
| 8-story | 1–8 | 0.82 | 3300 | 600 | 100 | 3000 | 0.05 | −0.05 | 5 | 0.05 |
| 12-story | 1–12 | 1.24 | 3300 | 600 | 100 | 3000 | 0.05 | −0.05 | 5 | 0.05 |
Disclaimer/Publisher’s Note: The statements, opinions and data contained in all publications are solely those of the individual author(s) and contributor(s) and not of MDPI and/or the editor(s). MDPI and/or the editor(s) disclaim responsibility for any injury to people or property resulting from any ideas, methods, instructions or products referred to in the content. |
© 2023 by the authors. Licensee MDPI, Basel, Switzerland. This article is an open access article distributed under the terms and conditions of the Creative Commons Attribution (CC BY) license (https://creativecommons.org/licenses/by/4.0/).
Share and Cite
Lai, Q.; Hu, J.; Xie, L.; Xu, L. Analysis of the Effects of Different Factors on Damage Potential Ranking. Sustainability 2023, 15, 1583. https://doi.org/10.3390/su15021583
Lai Q, Hu J, Xie L, Xu L. Analysis of the Effects of Different Factors on Damage Potential Ranking. Sustainability. 2023; 15(2):1583. https://doi.org/10.3390/su15021583
Chicago/Turabian StyleLai, Qinghui, Jinjun Hu, Lili Xie, and Longjun Xu. 2023. "Analysis of the Effects of Different Factors on Damage Potential Ranking" Sustainability 15, no. 2: 1583. https://doi.org/10.3390/su15021583