Article

Phototrophic Bioremediation of Municipal Tertiary Wastewater Coupling with Lipid Biosynthesis Using Scenedesmus dimorphus: Effect of Nitrogen to Phosphorous Ratio with/without CO2 Supplementation

by
Mohammed Omar Faruque
1,
Mohammad Mozahar Hossain
1,2,
Wasif Farooq
1,3 and
Shaikh Abdur Razzak
1,3,*
1
Department of Chemical Engineering, King Fahd University of Petroleum and Minerals, Dhahran 31261, Saudi Arabia
2
Interdisciplinary Research Center for Refining and Advanced Chemicals, King Fahd University of Petroleum & Minerals, Dhahran 31261, Saudi Arabia
3
Interdisciplinary Research Center for Membranes and Water Security, King Fahd University of Petroleum & Minerals, Dhahran 31261, Saudi Arabia
*
Author to whom correspondence should be addressed.
Sustainability 2023, 15(2), 1409; https://doi.org/10.3390/su15021409
Submission received: 4 December 2022 / Revised: 29 December 2022 / Accepted: 9 January 2023 / Published: 11 January 2023
(This article belongs to the Special Issue Microalgae-Based Wastewater Treatment Processes and Biorefineries)

Abstract

:
Scenedesmus dimorphus was utilized for the tertiary treatment of municipal wastewater in an effort to remove nutrients from secondary treated wastewater. In addition to the concurrent generation of biomass containing lipids for biofuel production. The effect of nitrogen to phosphorous (N:P) ratios (1:1 to 8:1) in culture media without carbon dioxide (CO2) supplementation (air supply alone, Case 1) and with CO2 supplementation (2% CO2 in air, Case 2) was investigated through a series of systematic parametric batch experiments. Case 2 produces greater biomass at all N:P ratios than Case 1. In Case 1, the highest biomass output for a N:P ratio of 8:1 is 567 mg/L at pH 8.4. In Case 2, however, the maximum biomass yield is 733 mg/L when the N:P ratio is 2:1 and the pH is 7.23. Scenedesmus dimorphus is capable of absorbing nitrogen and phosphorous from wastewater in a CO2 environment and at the optimal N:P ratio. In Case 1, total nitrogen removal ranges from 28% to 100% and in Case 2, total nitrogen removal ranges from 60% to 100%, depending on the N:P ratio. For an initial concentration of 13 mg/L, the total phosphorous removal ranges from 37% to 57%, depending on the N:P ratio in both cases. Case 2 yields a maximum lipid content of 29% of the biomass dry weight when the N:P ratio is 1:1. These results suggest the viability of removing nutrients from secondary treated wastewater utilizing microalgae Scenedesmus dimorphus and lipid biosynthesis in the generated biomass.

1. Introduction

Water pollution, air pollution, and the rising need for energy are the greatest challenges associated with the current rapid urbanization and urban population growth [1]. Thus, the depletion of fossil fuels and freshwater reserves are two of the world’s greatest issues [2]. Based on a per capita water usage of 0.2 ton per day, a city with a population of 500,000 would produce around 85,000 tons per day of wastewater [3]. The majority of wastewater treatment plants perform primary and secondary municipal wastewater treatment, while releasing secondary treated wastewater (tertiary wastewater) for irrigation or to flowing water [4,5]. Tertiary wastewater is a sustainable, reusable resource that contains inorganic nutrients such as nitrogen and phosphorous; yet, if left untreated, it can have negative environmental effects, such as eutrophication [6]. The production of suitable water by treating wastewater is in demand to reduce the pressure on water reserves [7]. Wastewater must be subjected to tertiary treatment to produce potable water [8]. Various biological, chemical, and physical techniques are available for tertiary wastewater treatment [9]. Although there are numerous techniques for tertiary wastewater treatment, the microalgae-driven biological tertiary wastewater treatment process is in high demand since it is eco-friendly, cost-effective, and does not require any additional energy [10,11,12].
Owing to their potential to eliminate nutrients from wastewater, especially tertiary effluent, while simultaneously producing lucrative biofuel and non-fuel products, microalgae have attracted considerable interest [13]. Due to a rise in energy production demand, pressure is mounting on fossil fuel reserves alongside an increase in the emission of the greenhouse gas CO2 [14]. As energy production and consumption continue to rise, it is imperative to identify viable, sustainable, and ecologically friendly energy alternatives [10,15,16]. Therefore, carbon-neutral, sustainable, and renewable energy sources that do not contribute to the overall output of CO2 are required. In this context, the culture of microalgae in tertiary wastewater to create lipid-rich biomass for biofuel generation is an integrated method that has the added benefit of pollution control through the removal of nutrients from wastewater.
Carbon is the most essential nutrient for the development of microalgae, followed by nitrogen and phosphorous [17]. During photosynthesis, algae use CO2 as an inorganic carbon source for cell development. Microalgae such as Scenedesmus dimorphus may collect phosphorous and nitrogen as nutrients from wastewater, as well as CO2 to supply macro nutrient carbon via photosynthesis [7]. In addition, during photosynthesis, microalgae can produce 1 kg of microalgae biomass by consuming 1.8 kg of CO2 [18]. Microalgae cells gather molecules from important types of organic substances, such as proteins, lipids, and carbohydrates, which create their structure and are essential feedstock for biofuel production [19,20]. Microalgae have a number of advantages over conventional energy sources of the past, including faster growth rates, better lipid buildup, enhanced photosynthetic ability, and a lower land area requisite for production [7,15]. In addition, land that is inappropriate for supplemental harvests can be utilized without disrupting the food supply chain [21].
Microalgae cultivation is not cost-effective because it requires a substantial amount of water and other nutrients. For instance, 1 kg of biodiesel requires an estimated 3700 kg of water, 710 kg of phosphorous, and 300 kg of nitrogen if recycled freshwater is not used [22]. Therefore, the growing of microalgae in wastewater at the tertiary stage using atmospheric CO2 provides the following additional benefits: (i) Tertiary wastewater effluents gain economic value in terms of water and nutrient recovery; (ii) Nitrogen and phosphorous are simultaneously removed from wastewater [11]; (iii) Microalgae proliferate 10 to 50 times faster than terrestrial plants, allowing for an effective CO2-to-organic-compound transformation [21]; (iv) It can produce a sizeable amount of water that can be safely discharged to receiving streams or recycled on-site and off-site; and (v) It can transform lipid-rich algal biomass for biofuel generation [23,24]. Despite all these benefits, there are still a lot of obstacles to cross before this technology can be used in its full potential. These difficulties include (i) land requirement, (ii) the impact of wastewater characteristics, (iii) the influence of operational and environmental conditions, and (iv) the need to harvest valuable biomass [25].
Multiple studies have indicated that microalgae are promising options for the treatment of tertiary wastewater [11,26]. The microalgae cultures most often applied for nutrient elimination are Chlorella [27], Scenedesmus [28], and Spirulina [29]. Jiang et al. (2013) examined the cultivation of Scenedesmus dimorphus utilizing BG-11 medium enhanced with simulated flue gas [30]. Xin et al. (2010b) studied the nutrient removal, growth, and lipid biosynthesis of Scenedesmus species on BG-11 medium with varying nitrogen and phosphorous concentrations [31]. Since microalgae remove nutrients predominantly through assimilation during growth, the rate of nutrient elimination is precisely influenced by the rate at which nutrients are removed [32]. Moreover, only if the nitrogen-to-phosphorous (N:P) ratio of wastewater is within an acceptable range can both nitrogen and phosphorous be utilized and removed successfully [33]. The nitrogen concentration has an effect on the buildup of lipids in microalgal cells and, consequently, on CO2 elimination. With fluctuations in nitrogen content, and especially at low nitrogen levels, lipid formation is more prevalent [18]. Lutzu et al. (2015) investigated the potential of brewery wastewater for Scenedesmus dimorphus growth, nutrient removal, and biodiesel production [34]. Nayak et al. (2016) cultivated Scenedesmus sp. using residential wastewater under supplementation with different percentages of CO2 in the air and discovered a more favorable effect on biomass concentration and specific growth rate when supplemented with 2% CO2 in air [15]. However, neither study considered the influence of the N:P ratios on the growth and lipid accumulation. There have been a few studies conducted on the cultivation of Scenedesmus dimorphus microalgae using tertiary municipal wastewater as the culture medium for the removal of nutrients. However, there have been no studies carried out on the N:P ratios or the effect of CO2 and without CO2 coupled to the making of lipid-rich biomass. In addition, the development of microalgae with and without CO2 supplementation and lipid accumulation for biofuel generation has not been explored to determine the optimal combination for Scenedesmus dimorphus-based tertiary treatment of municipal wastewater and production of biofuel. Thus, the present study is innovative in assessing the effect of various N:P ratios on the cultivation of Scenedesmus dimorphus, as well as the effect of feeding it with CO2 and without. This novel way of analyzing the impact of the N:P ratio and the use of CO2 and without CO2 has never been attempted before using Scenedesmus dimorphus.
For this goal, a series of synthetic wastewater medium with varying N:P ratios usu-ally found in municipal tertiary wastewater was employed. Following the bioremediation of synthetic municipal tertiary wastewater, nitrogen and phosphorous concentrations were monitored every other day in order to meet the goal of reducing the concentration of the nutrients to that of appropriate clean water. Moreover, this study investigated the effects of all the key parameters influencing the culture conditions in order to generate a comprehensive picture, and the results reveal the optimal circumstances for achieving maximum nutrient removal, maximum biomass production, and high lipid content. Consequently, the study enabled the evaluation of the suitability of Scenedesmus dimorphus species grown in municipal tertiary wastewater for the coupling of nutrient removal, biomass production, and lipid accumulation.

2. Materials and Methods

2.1. Microalgal Strain and Culture Medium

The Scenedesmus dimorphus (UTEX B 746) microalgae strain was collected from the University of Texas, Austin, TX, USA, and was utilized to conduct the full experiments. To investigate the ability of microalgae to recover nutrients from municipal tertiary wastewater, synthetic wastewater media with varied N:P ratios commonly found in ter-tiary municipal wastewater were used as the growing medium [35]. Phosphate (PO43−) from dipotassium hydrogen phosphate (K2HPO4) and monopotassium dihydrogen phosphate (KH2PO4) have been used as the source of phosphorous. In addition, nitrate nitrogen (NO3-N) from sodium nitrate (NaNO3) has been employed as the source of nitrogen. In addition to phosphorous and nitrogen, the culture medium includes the following ingredients: 25 mg sodium chloride (NaCl), 31 mg potassium hydroxide (KOH), 25 mg calcium chloride dihydrate (CaCl2.2H2O), 75 mg magnesium sulfate heptahydrate (MgSO4.7H2O), 4.98 mg acidified ferrous sulfate heptahydrate (FeSO4.7H2O), 11.45 mg boric acid (H3BO3), 50 mg alkaline ethylenediaminetetraacetic acid (EDTA), and 1 mL/L trace elements solutions. The trace element solution is composed by separately dissolving 0.49 gm cobalt chloride hexahydrate (CoCl2.6H2O), 8.82 gm zinc sulfate heptahydrate (ZnSO4.7H2O), 1.44 gm manganese chloride tetrahydrate (MnCl2. 4H2O), 0.71 gm molybdenum trioxide (MoO3) and 1.57 gm copper sulfate pentahydrate (CuSO4. 5H2O) in 1 L distilled water.

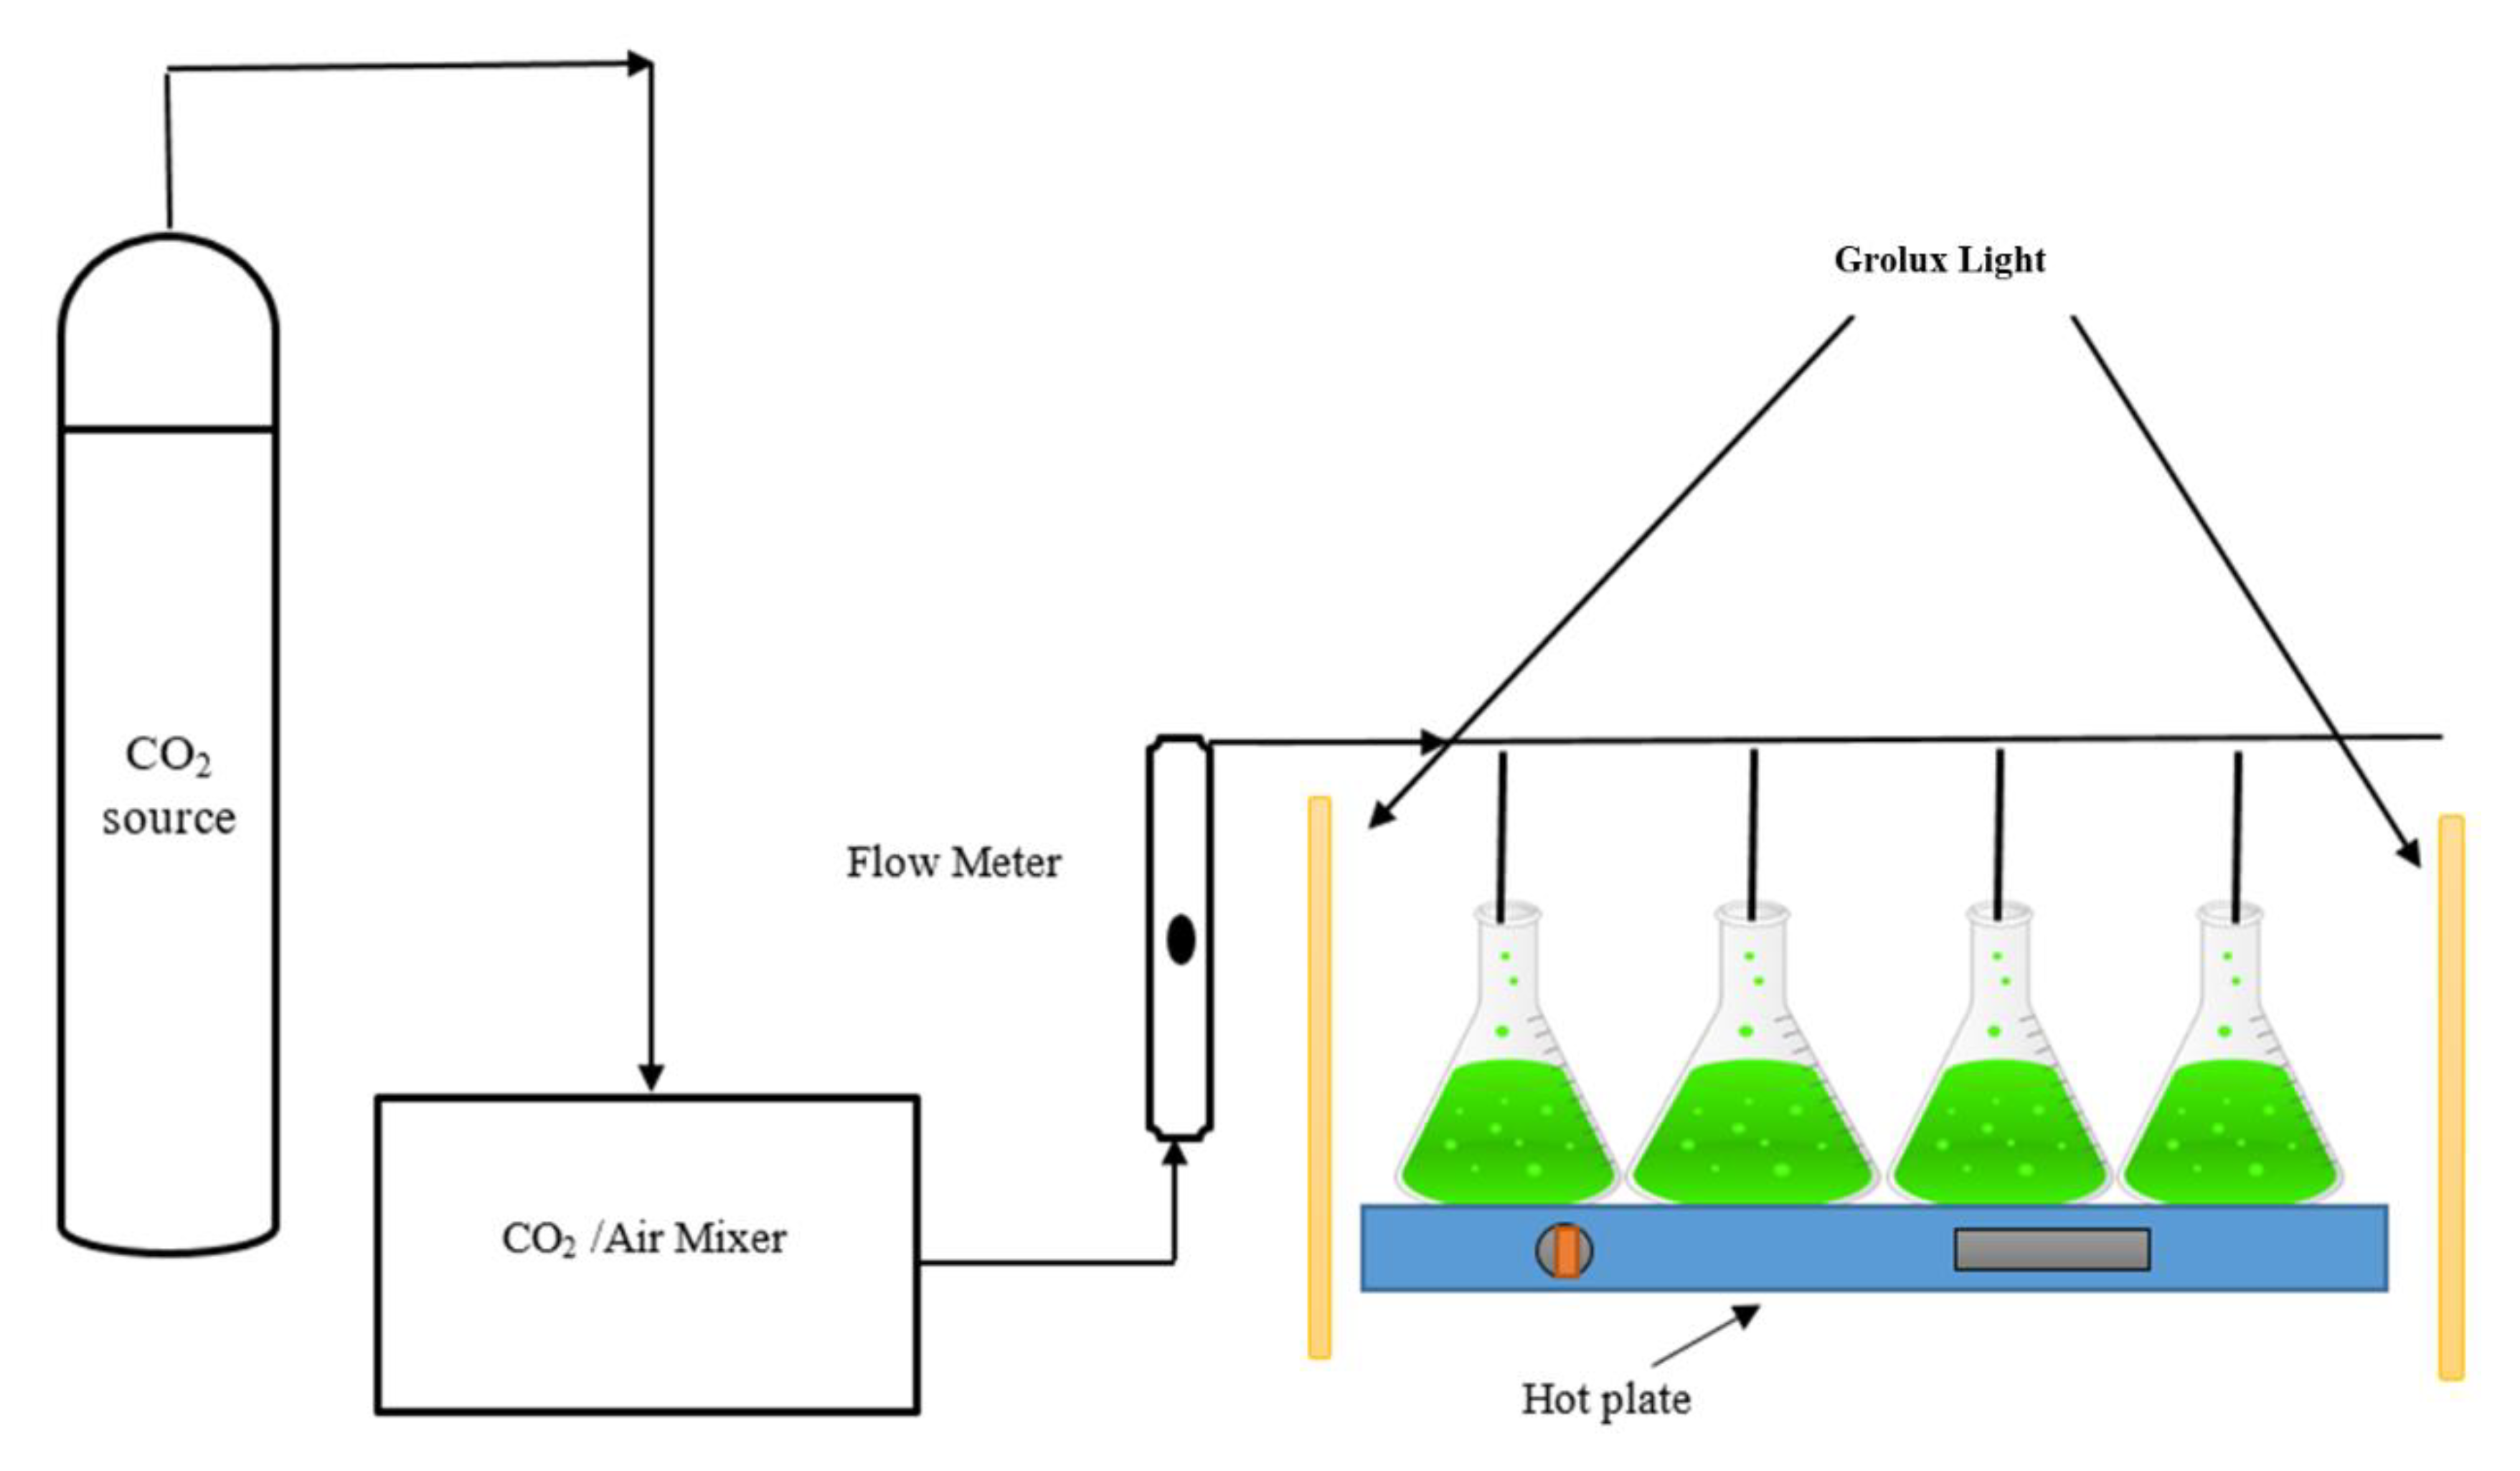
2.2. Experimental Technique for Microalgae Culturing

Figure 1 is a representation of the experimental apparatus employed in this laboratory analysis. Scenedesmus dimorphus was cultured in 2 L Erlenmeyer flasks that were considered batch photobioreactors using an autoclaved medium. The flasks were filled with a maximum of 1700 mL of the working liquid medium, which included the inoculum. To circumvent the lag phase, the inoculum was pre-cultured in a flask and 100 mL of it was inserted in each culture photobioreactor. Foam stoppers were utilized to prevent contamination of the photobioreactors’ contents. Four horizontally adapted Grolux fluorescent (Sylvania F18W/T8/GRO) tube lights were utilized to cover the majority of the photobioreactors’ surface area under a fume hood. The light strength at the surface of the reactor was measured to be between 50–54 mol photons/m2/s using a Fisher ScientificTM TraceableTM dual-display light meter.
With the aid of an air–CO2 mixture system FC-SH (Live Cell Instruments, South Ko-rea), the air–CO2 mixture was precisely supplied to the base side of each photobioreactor. A glass rotameter on the mixing device controlled the flow rate of CO2-mixed air and held at 1500 cc/min as required. Gas bubbles emerged throughout the liquid cultivation medium and exited through the reactor’s upper side, preventing cell sedimentation and also providing inorganic carbon. Furthermore, the photobioreactors were manually stirred three times a day to prevent microalgal settling. The trials were conducted at room temperature (22 ± 2 °C) for 25 days. The preliminary pH of the culture medium was modified from 7 to 7.5 using 1M HCL and 1M NaOH in all trial assays to match the range of pH of tertiary wastewater media [36,37]. Moreover, a pH meter was used to measure the pH of the culture media on a regular basis during the cultivation of microalgae (Fisher Scientific AccumetR Basic AB15 plus meter, Waltham, MA, USA).
Microalgae were cultured in synthetic tertiary wastewater media with varying N:P ratios, with and without CO2 supplementation. The nitrogen and phosphorous concentration ratios employed spanned the range of measured concentrations in municipal wastewater, from low to high. The batch tests were conducted in a series of five photobioreactors with an initial total phosphorous (TP) concentration of 13 mg/L and 1:1, 2:1, 4:1, 6:1, and 8:1 N:P ratios, as depicted in Figure 1. Initially, the culture was aerated with a flow rate of 1500 cc/min of air, and because the concentration of CO2 in air is approximately 0.03%, this set of studies was characterized as non-CO2-enriched (Case 1).
The subsequent series of trials with aeration at the same flow rate and air containing 2% CO2 were characterized as those with CO2-supplementation (Case 2). The other culture variables, including starting pH, temperature, and light intensity, maintain the same value for all tests. Each set of experiments were repeated three times for reproducibility. The experiment conditions utilized in this investigation are summarized in Table 1.

2.3. Analytical Techniques

2.3.1. Microalgal Growth Characteristics

To ascertain the growth factors of the microalgae Scenedesmus dimorphus, 15 mL of the culture medium was removed from the photobioreactors on a daily basis. To account for evaporation loss during microalgae cultivation, sterile water was applied to the photobioreactors as required to refill the cultivation medium.

2.3.2. Microalgal Biomass Growth

Optical density (OD) of the cultivation medium was monitored regularly by deter-mining the absorbance of microalgae samples at a wavelength of 690 nm [38] applying an ultraviolet–visible (UV–VIS) spectrophotometer (Evolution 260 Bio-Thermo Scientific). The dry weight (mg/L) of the microalgae biomass was estimated by vacuum filtering 15 mL aliquots of the culture medium with the help of pre-dried and pre-weighed glass microfiber filter paper (Whatman GF/C with 0.45 µm pore size and 0.47 mm diameter). Before being weighed, the biomass-containing filter paper was dried in an oven at 60 °C for 24 h. This difference in weight was used to calculate the dry cell (biomass) content of microalgae. The dry weight of the microalgae species was used to measure the biomass concentration (mg/L) [7].

2.3.3. Specific Growth Rate

The following equation was used to calculate the specific growth rate, μ g , which is defined as the growth of the dry biomass weight per day [39].
Specific   growth   rate ,   μ g = ln X 1 X 0 t 1 t 0
where X 0 and X 1 are the dry biomass weight (mg/L) at the starting, at time t 0 , and at the end, at time t 1 , of the exponential growth phase, respectively.

2.3.4. Biomass Productivity

The biomass productivity (Pb), also known as the biomass production rate was calculated using the equation below [40].
Biomass   productivity ,   P b = X t X 0 t t t 0
where X 0 and X t are the dry biomass weight at the beginning, at time t 0 , and at the end of the growth phase of cultivation, at time   t t , respectively.

2.3.5. Nutrient Removal Analysis

Nutrient assessment was performed on liquid microalgae samples withdrawn from the photobioreactors every alternate day during the 25-day test cycle. The samples were centrifuged at 4500 rpm for 10 min and then supernatants were stored for analysis. The nitrogen and phosphorous concentrations were calculated using a spectrophotometer (DR 3900-HACH, USA) and a digital reactor (DRB 200-HACH, USA) to determine total nitrogen (TN) in the form of N-NO3 and total phosphorus (TP) in the form of PO43− in the culture medium. The percentage of TN and TP removal rates is calculated in batch kinetics using the equation below.
Percentage   removal = S 0 S t S 0 × 100 %
where S 0 and S t are the concentration of the substrate at the beginning, time t 0 and at the end of the cultivation, time t t respectively.
The following equation was used to measure the initial substrate removal rate (Ri):
R i = S o S t t t t 0
where S 0 is the initial substrate concentration as TN or TP, and S t is the related substrate concentration at t t .

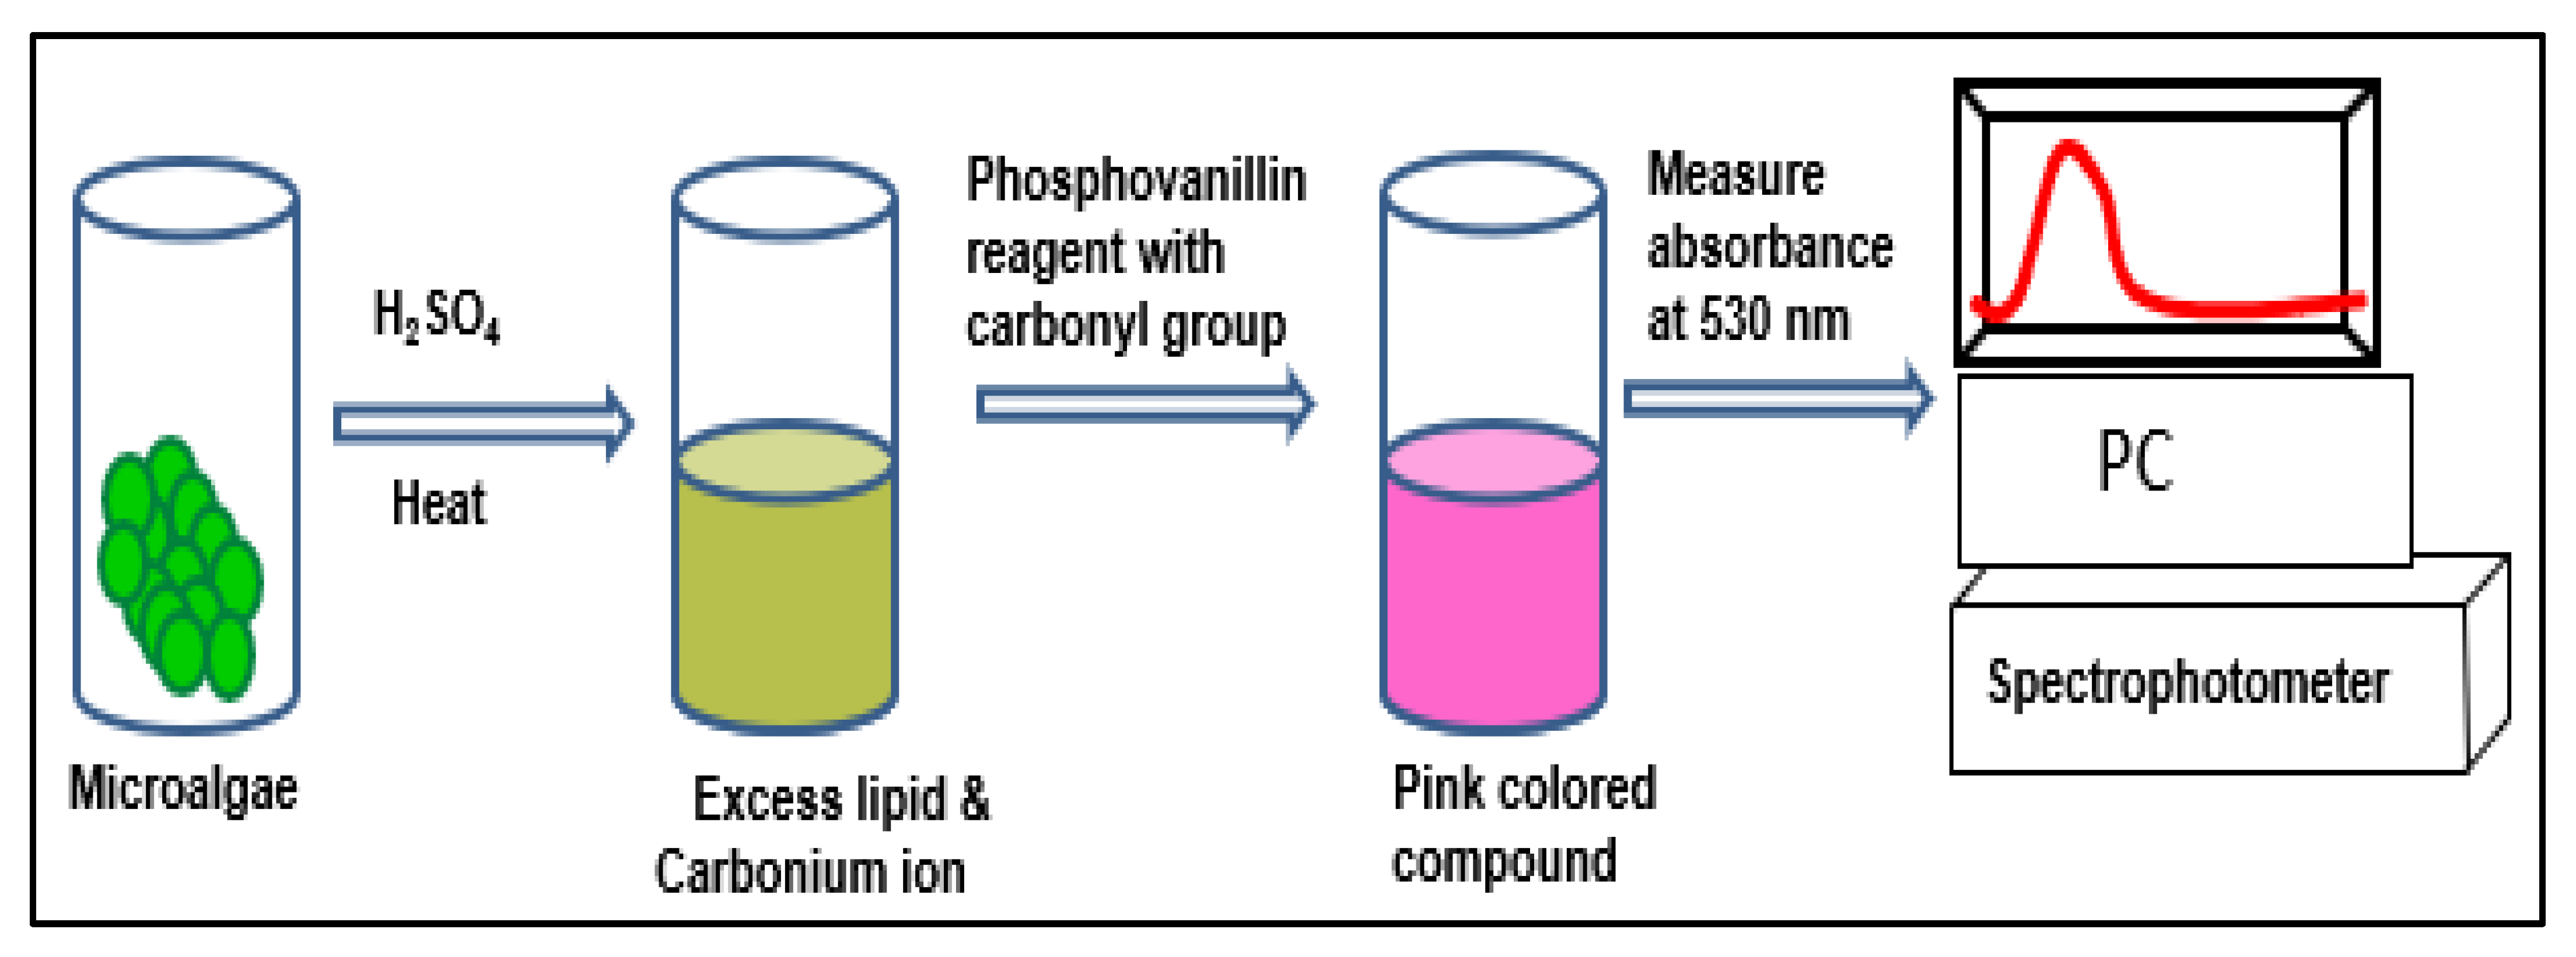
2.3.6. Lipid Quantification in Microalgae Biomass

The lipid substance was determined using the sulfo-phospho-vanillin (SPV) process [41,42]. The mechanism for lipid detection in the SPV-based colorimetric assay was depicted in Figure 2. Using canola oil, a calibration curve was generated according to the SPV method’s instructions. On consecutive days, 15 mL of microalgal samples were obtained from each photobioreactor in order to evaluate the intracellular lipid content. If necessary, samples were further diluted and centrifuged at 4500 rpm for five min before being washed three times with distilled water to remove salts from the cell surface. The biomass was treated with one milliliter of 98% concentrated sulfuric acid and heated at 100 °C for ten min. After chilling the treated biomass for five min in an ice bath, 5 mL of freshly prepared SPV reagent was added to the sample. After that, samples were stored in an incubator for 15 min at 37 °C with 200 rpm of shaking. After incubation, the absorbed content of the samples was determined using the following formula.
Y O D 530 = 0.333 X l i p i d + 0.1316
with an R2 of 0.9878 from the measured absorbance (Figure S1 in Supplementary Materials). Finally, using the equation below, the total lipid content was calculated as a percentage of the dry biomass weight.
L i p i d   C o n t e n t = X L X B × 100 %
where X L represents the quantity of lipid in the dry weight ( X B ) of the sample’s biomass.

2.4. Statistical Analysis

The average of the three repeat sets of experiments’ data was used to conduct the analysis. The standard deviation (SD) across repeated experimental data was calculated with values stated as means ± SD. One-way analysis of variance (ANOVA) was carried out to assess the variation among various treatment groups. A statistically significant difference was taken into account at the level of p < 0.05.

3. Results and Discussion

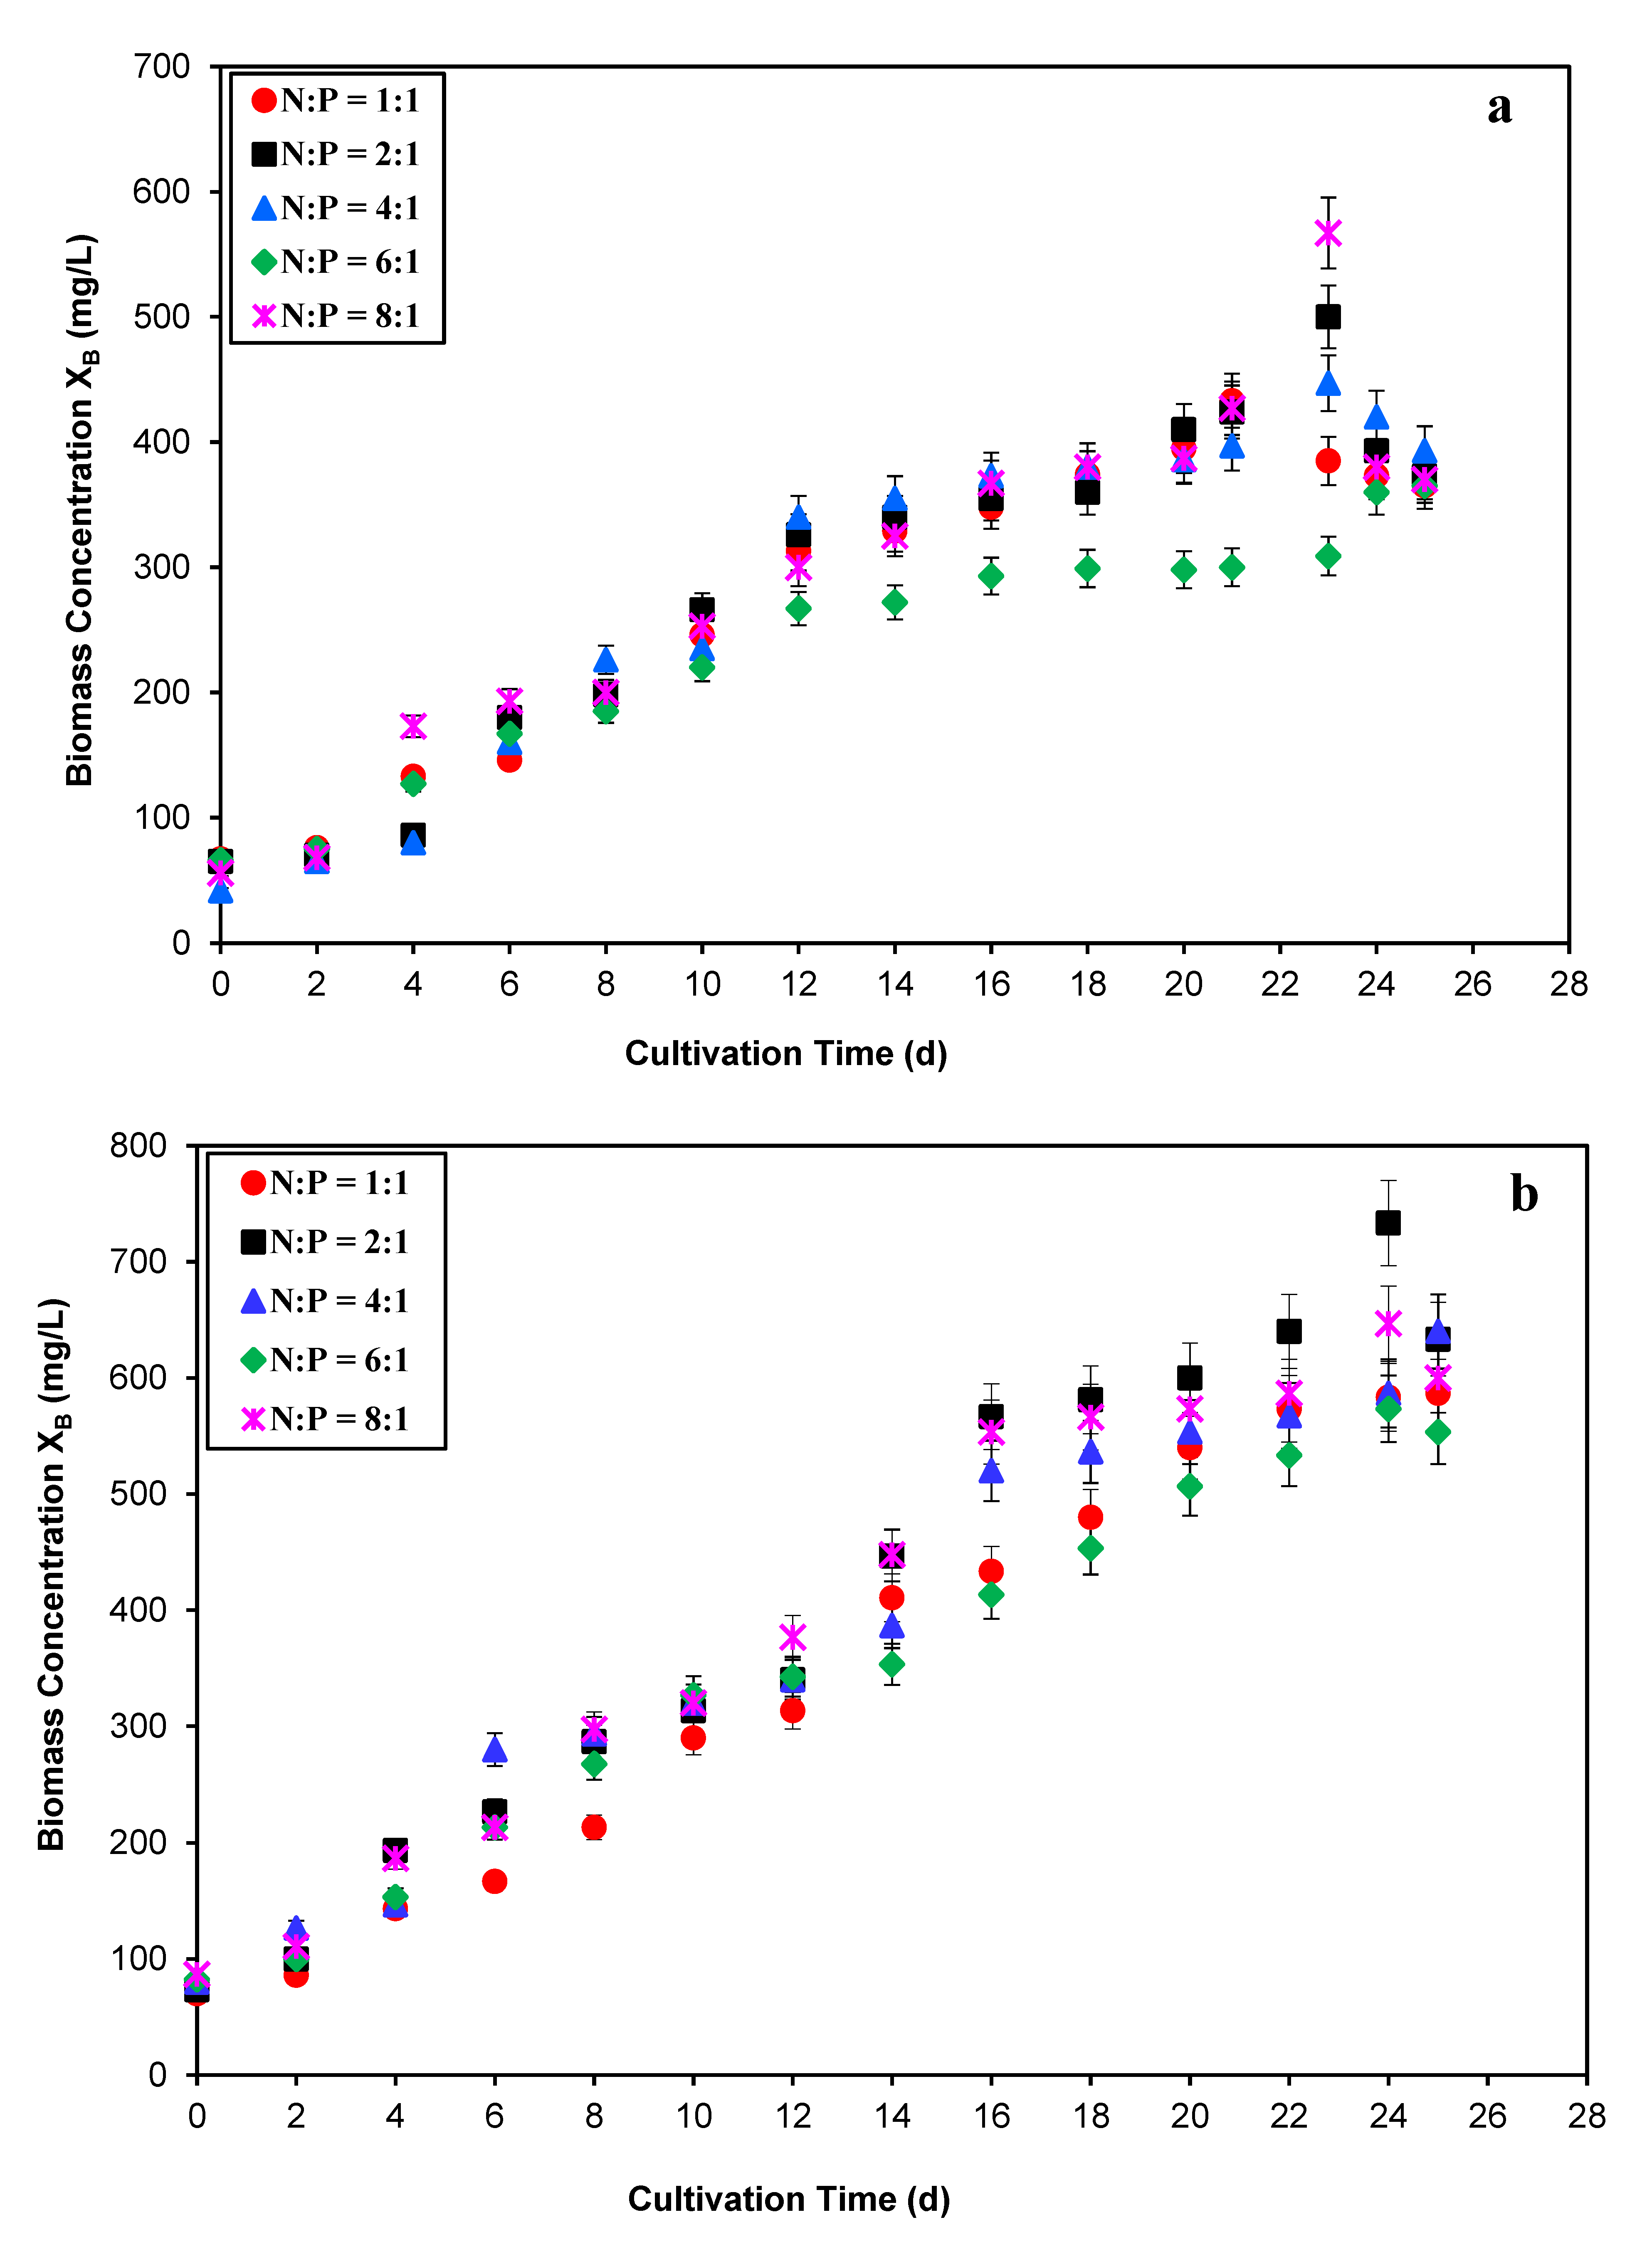
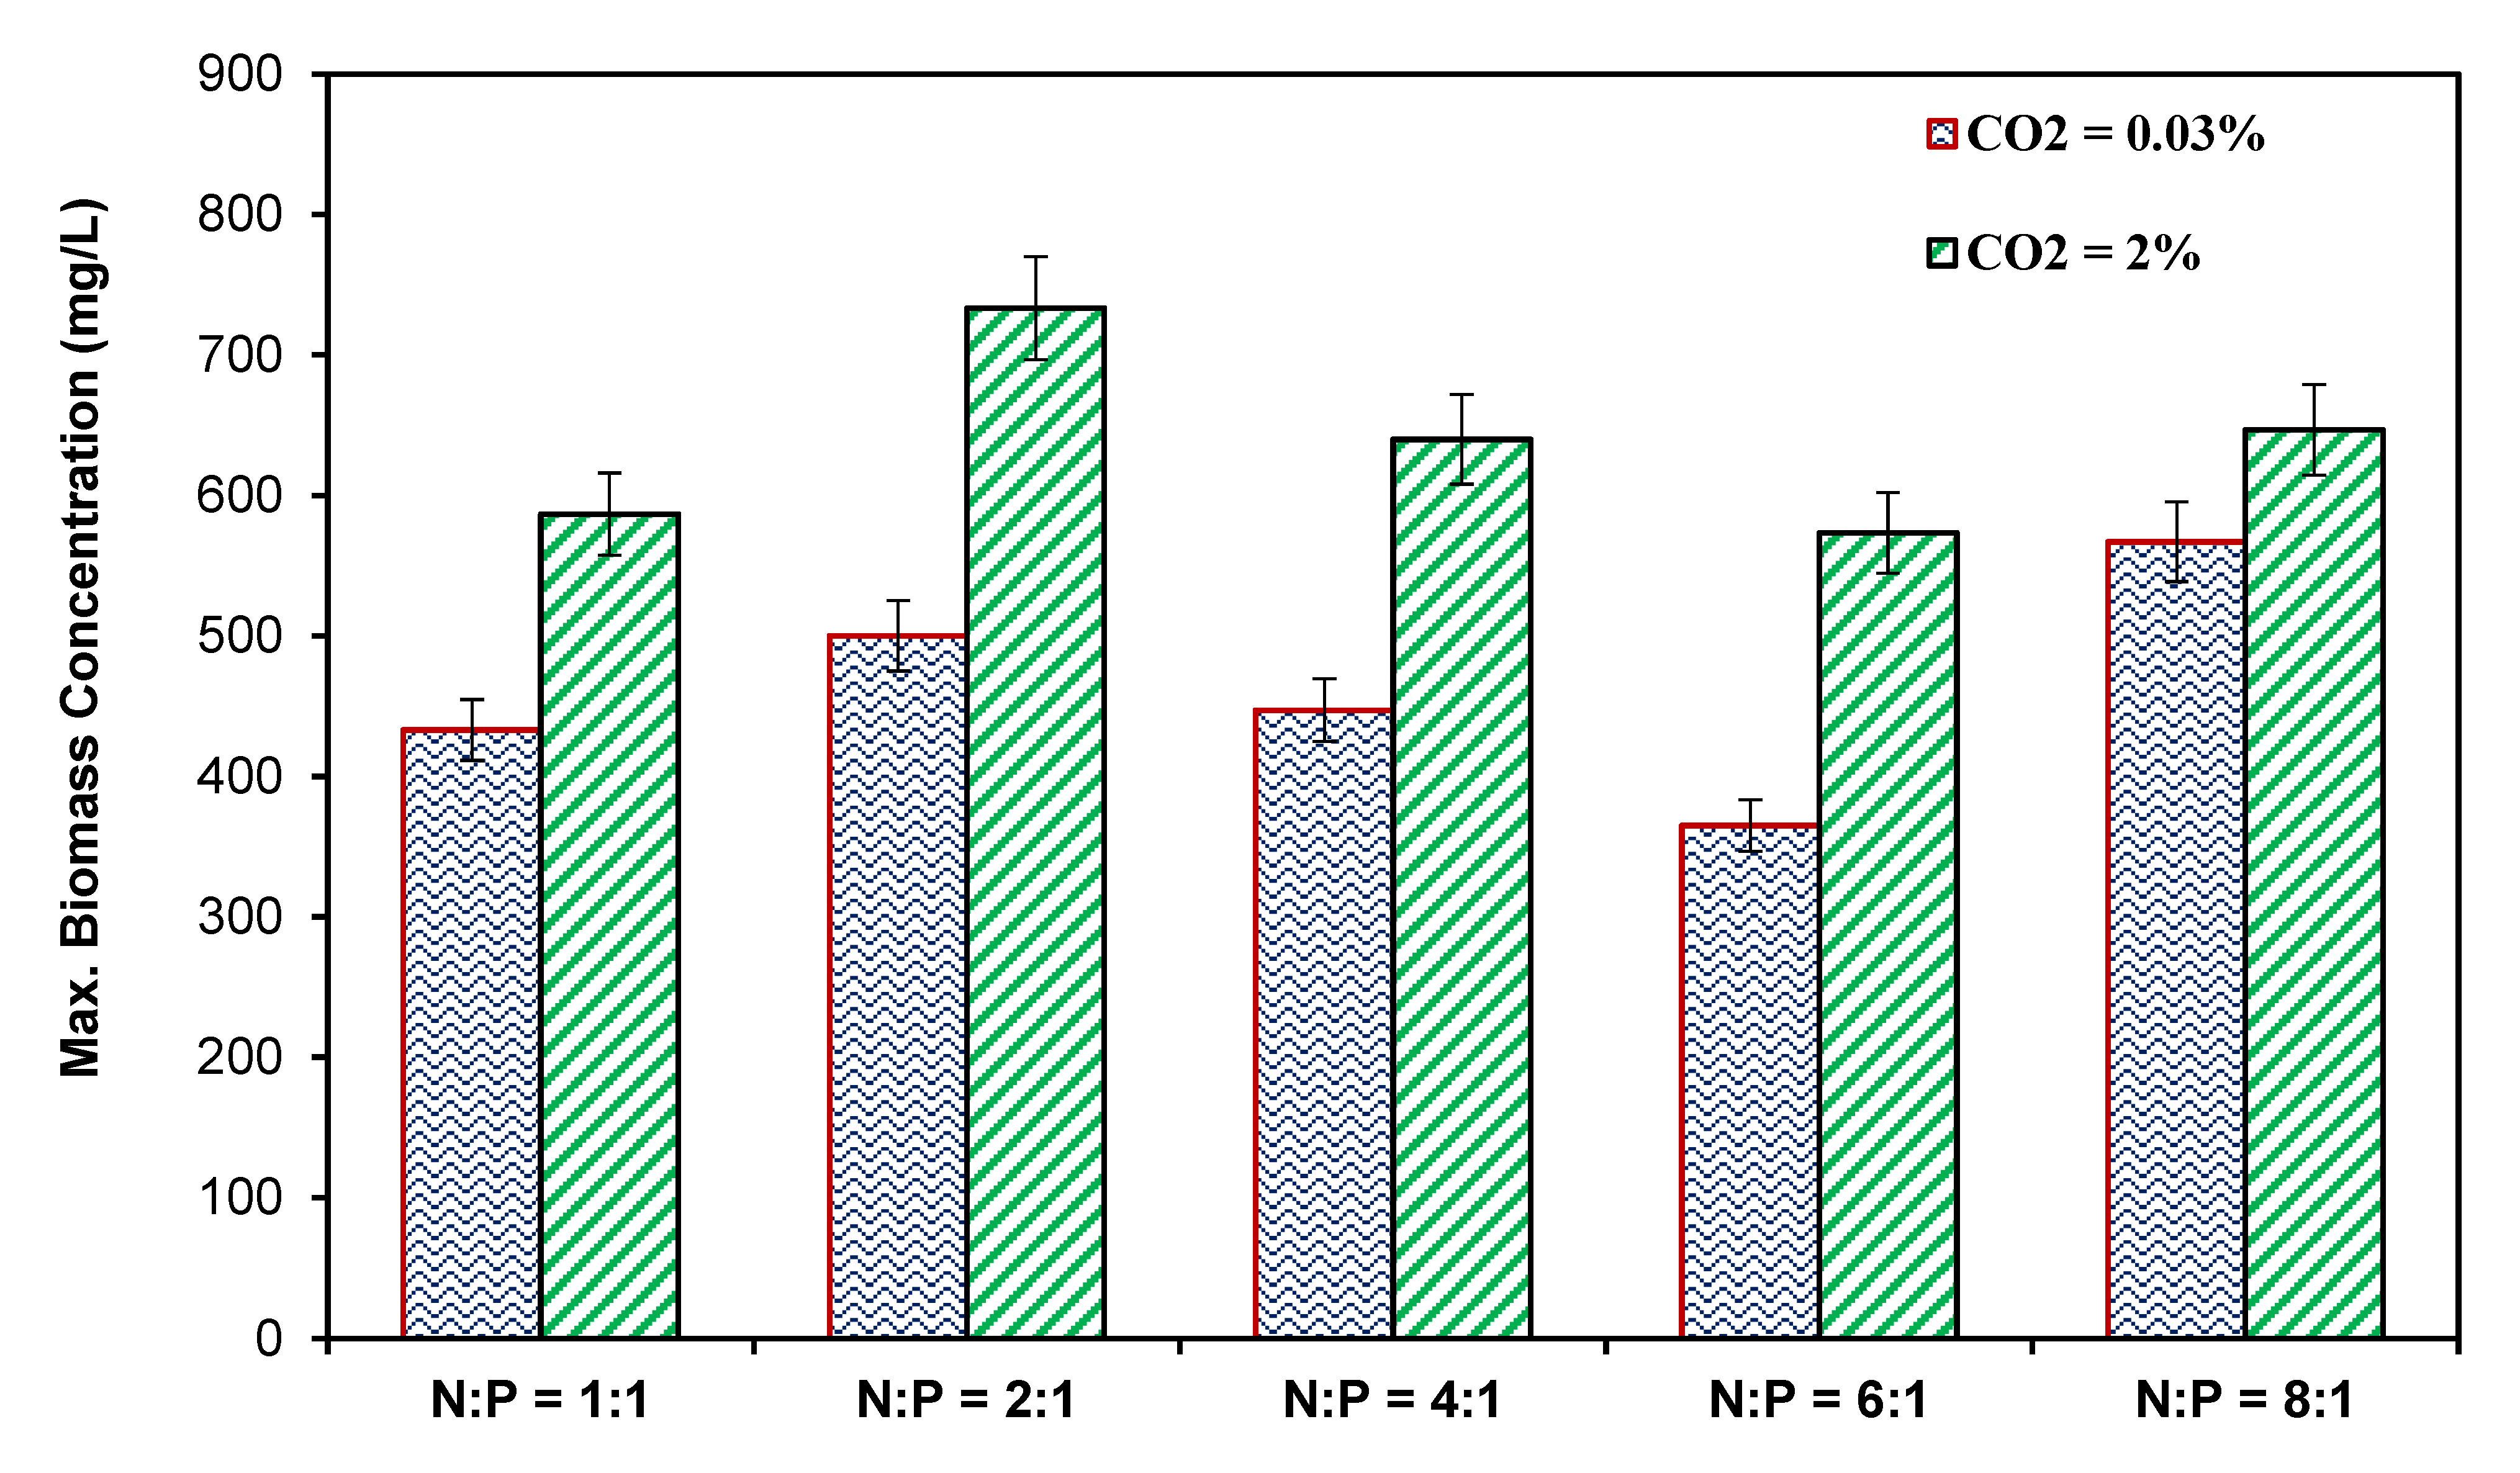
3.1. Growth and Biomass Yield

Nitrogen (N) and phosphorous (P) are two essential macronutrients for the growth and metabolic activity of algal cells [43]. Inorganic carbon, together with phosphorous and nitrogen, is a crucial macronutrient for the photoautotrophic development of microalgae, accounting for roughly 50% of their weight [44]. To retain the growth of microalgae, the culture medium must be replenished with the suitable proportions of carbon, nitrogen, and phosphorous. The time profiles of Scenedesmus dimorphus biomass concentration (mg/L) cultured with variable N:P ratios and without CO2 supplementation (air only) (Case 1) and supplemented with 2% CO2 in air (Case 2) are shown in Figure 3a,b, respectively. As indicated in these figures, microalgae effectively adapted to all growth media with N:P ratios ranging from 1:1 to 8:1 (Case 1 and Case 2). The biomass of microalgae increased steadily during the course of the 25-day growing period. For both Case 1 and Case 2 independently, ANOVA analysis showed that there was no statistically significant difference (p > 0.05) in terms of biomass growth for all N:P ratios. In all instances, the results indicate that the exponential growth phase of microalgae cultivation is within the range from 23 to 25 days for all NP ratios in both cases.
Table 2 describes the maximum biomass productivity (Pmax) and the maximum specific growth rate (µmax) of Scenedesmus dimorphus under the consistent conditions of this study. As shown in Table 2, the culture with CO2 supplementation (Case 2) has a better growth rate during the entire cultivation period than in Case 1 for almost all N:P ratios ranging from 1:1 to 8:1. Particularly, ANOVA analysis showed that there was a significant difference (p < 0.05) in biomass production under the N:P ratios of 2:1, 6:1 and 8:1 when comparing Case 1 and Case 2, which can be due to the accessibility of most of the inorganic carbon species in the appropriate form of bicarbonate (HCO3) and carbon dioxide (CO2 (aq)), as those are suitable for microalgal growth [43]. Hence, CO2 supplementation has a substantial impact on the production of biomass and the specific growth rate during the cultivation of Scenedesmus dimorphus in synthetic wastewater media. These findings are coherent with the outcomes stated by other researcher [15].
Figure 4 illustrates the maximum biomass yields achieved from the cultivation of Scenedesmus dimorphus under different N:P ratios (1:1 to 8:1) for both Case 1 and Case 2.
Case 2 has a greater maximal biomass production during cultivation than Case 1 at all N:P ratios. Case 1’s maximal biomass output ranged from 365 mg/L to 567 mg/L for all N:P ratios evaluated. In Case 2, however, the maximal biomass output for cultures cultivated at various N:P ratios ranged between 574 mg/L and 733 mg/L. This study’s maximal biomass yield is commensurate with the projected average biomass production of 300–600 mg/L for culture of microalgae [45].
A range of 6.8–10 inorganic N:P ratio is determined to be optimal for microalgal development in freshwater [46]. Xin et al. (2010b) cultivated Scenedesmus sp. on modified BG -11 medium with a N:P ratio ranging from 2:1 to 20:1 and discovered that the adjustment of the N:P ratio has a significant impact on microalgae growth [31]. As shown in Figure 4, the maximum biomass output in Case 1 (without CO2 supplementation) is 567 mg/L on day 23 with a N:P ratio of 8:1, followed by 500 mg/L with a N:P ratio of 2:1. In Case 2, however, the highest biomass output of 733 mg/L occurs on day 24 with a N:P ratio of 2:1. These findings indicate that the growth of the microalgae Scenedesmus dimorphus in synthetic wastewater is influenced by CO2 enrichment and the N:P ratio in culture media, and that they should be within an optimal range. Similar results were observed with the freshwater microalgae Chlorella vulgaris in lagoon conditions [47].

3.2. Nutrient Removal

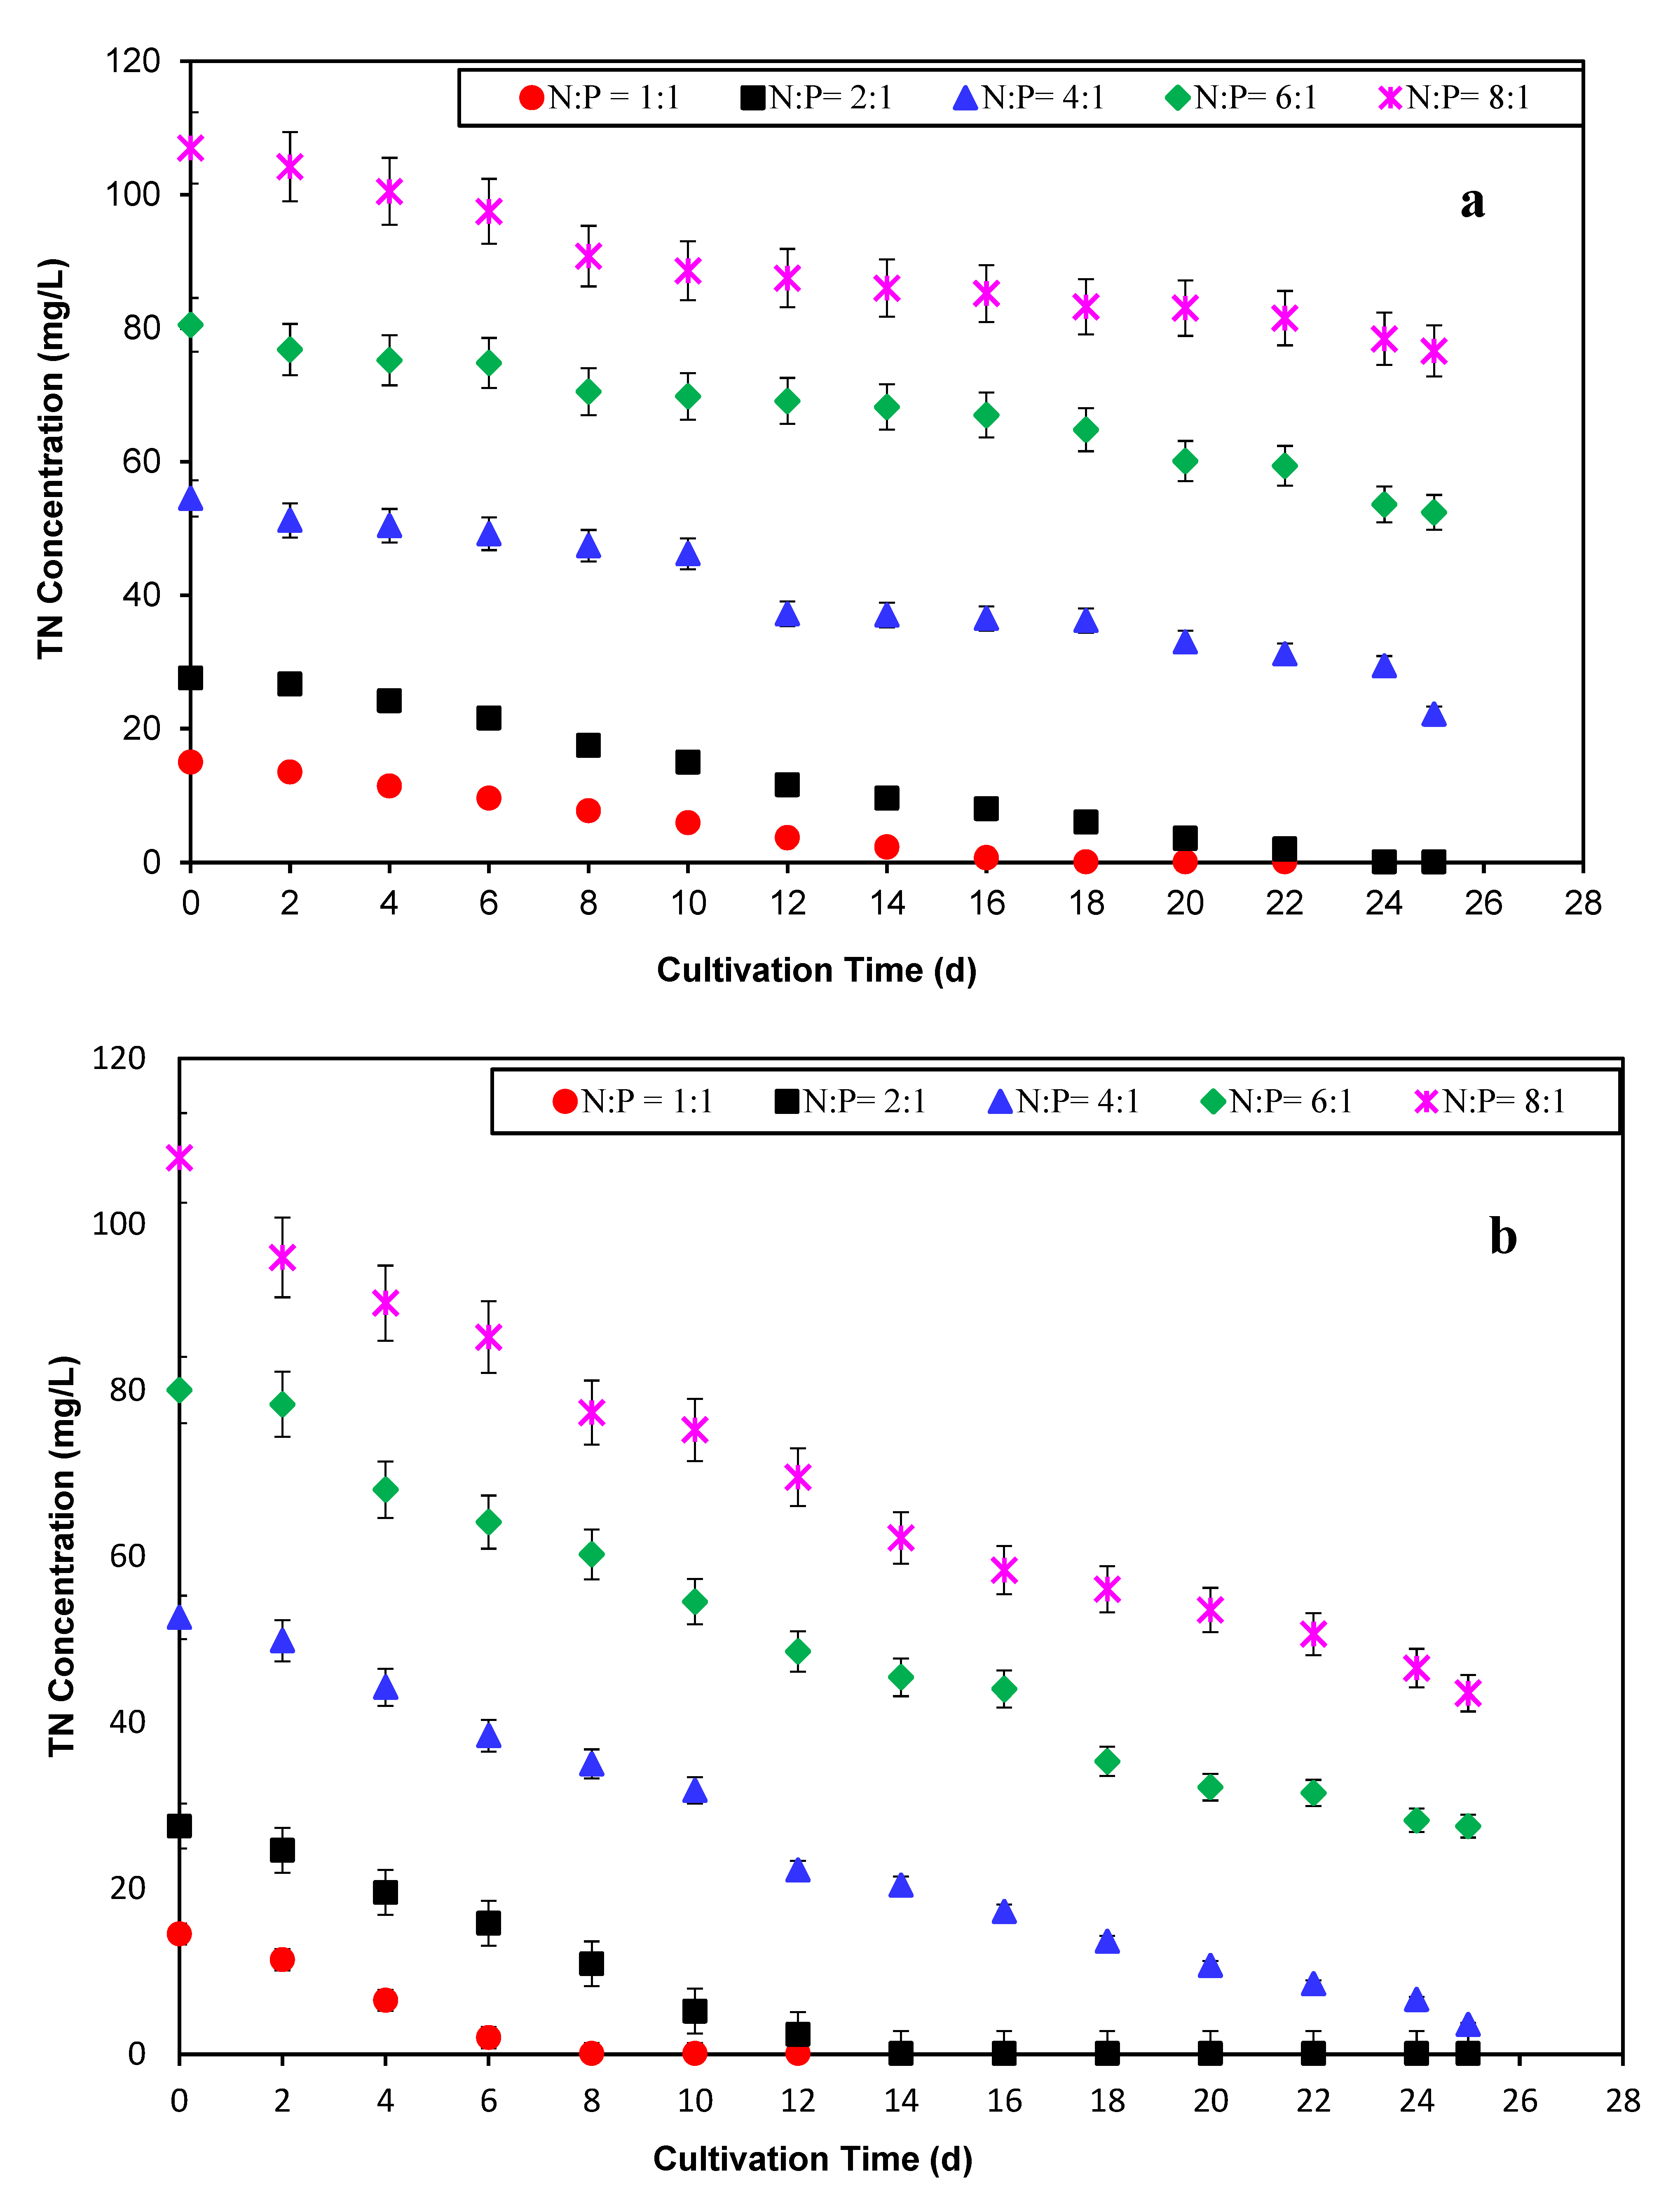
3.2.1. Total Nitrogen Removal

Figure 5a,b depicts the time profiles of the total nitrogen (TN) uptake by Scenedes-mus dimorphus grown under varied levels of N:P ratios for Case 1 and Case 2, respectively. As shown in Figure 5a (Case 1), the maximum removal percentage is 100% on days 18 and 24 of the cultivation periods for N:P ratios of 1:1 and 2:1, while the maximum uptake ranges from 29% to 59% for N:P ratios of 4:1 to 8:1 towards the conclusion of the cultivation period. However, according to Figure 5b (Case 2), on day 8, day 14, and day 25 of the culture period, the TN removal at N:P ratios of 1:1, 2:1, and 4:1 is 100%, 100%, and 93%, respectively. In addition, at the end of 25 days, TN elimination at N:P ratios of 6:1 and 8:1 is 66% and 60%, respectively.
From the ANOVA analysis, it was evident that TN changes occurred significantly (p < 0.05) under all N:P ratios when Case 1 (without CO2, air only) and Case 2 (with 2% CO2 in air) were considered individually. In addition, there was a significant difference (p < 0.05) in terms of nitrogen removal for the N:P ratios 4:1, 6:1 and 8:1 when comparing Case 1 and Case 2. Consequently, the initial nitrogen concentration and CO2 supplementation have a significant effect on the TN removal by Scenedesmus dimorphus from the growth medium. The outcomes of this analysis imply that a greater proportion of TN is eliminated than in prior experiments employing an initial TN concentration of 27 mg/L [15,31]. Various discoveries on the removal of TN from wastewater by various species have also been reported in other scholarly works. In a batch method, Scenedesmus obliquus cultivated in municipal wastewater with a total starting nitrogen concentration of 27 mg/L eliminated between 79% and 100% TN [48]. However, in the study reported here, 29% to 100% of TN was removed at an initial nitrogen concentration of 14.5–108 mg/L in both Case 1 and Case 2.
The TN concentration in effluents from treatment plants must be lower than 10 mg/L for the water to be safe for consumption and irrigation. This concentration is also the European Union legal limit for the safe discharge of treated wastewater into the environment [47]. In all instances, the time required to obtain a nitrogen concentration of 10 mg/L (T10(N)) was determined for all feasible experiments completed throughout this study. In this regard, the nitrogen removal rate, nitrogen removal efficiency, and potential T10(N) values are tabulated and compared for both situations in Table 3. As shown in Table 3, the T10(N) values produced in Case 2 are lower for all N:P ratios than those obtained in Case 1. The results indicate that it is essential to supplement the culture medium’s air supply with carbon dioxide. In both Case 1 and Case 2, the 1:1 N:P ratio results in lower T10(N) values than other N:P ratios. This is typically the case due to the lower starting nitrogen concentration in the culture media. Under these experimental conditions, the minimum T10(N) for 2% CO2 in the air (Case 2) at a N:P ratio of 1:1 was three days. At N:P ratios of 4:1, 6:1, and 8:1 (Case 1), as well as at N:P ratios of 6:1 and 8:1, a T10(N) value was not observed (Case 2). The nitrogen elimination rate in both instances of this investigation is consistent with the findings of other published studies [15].

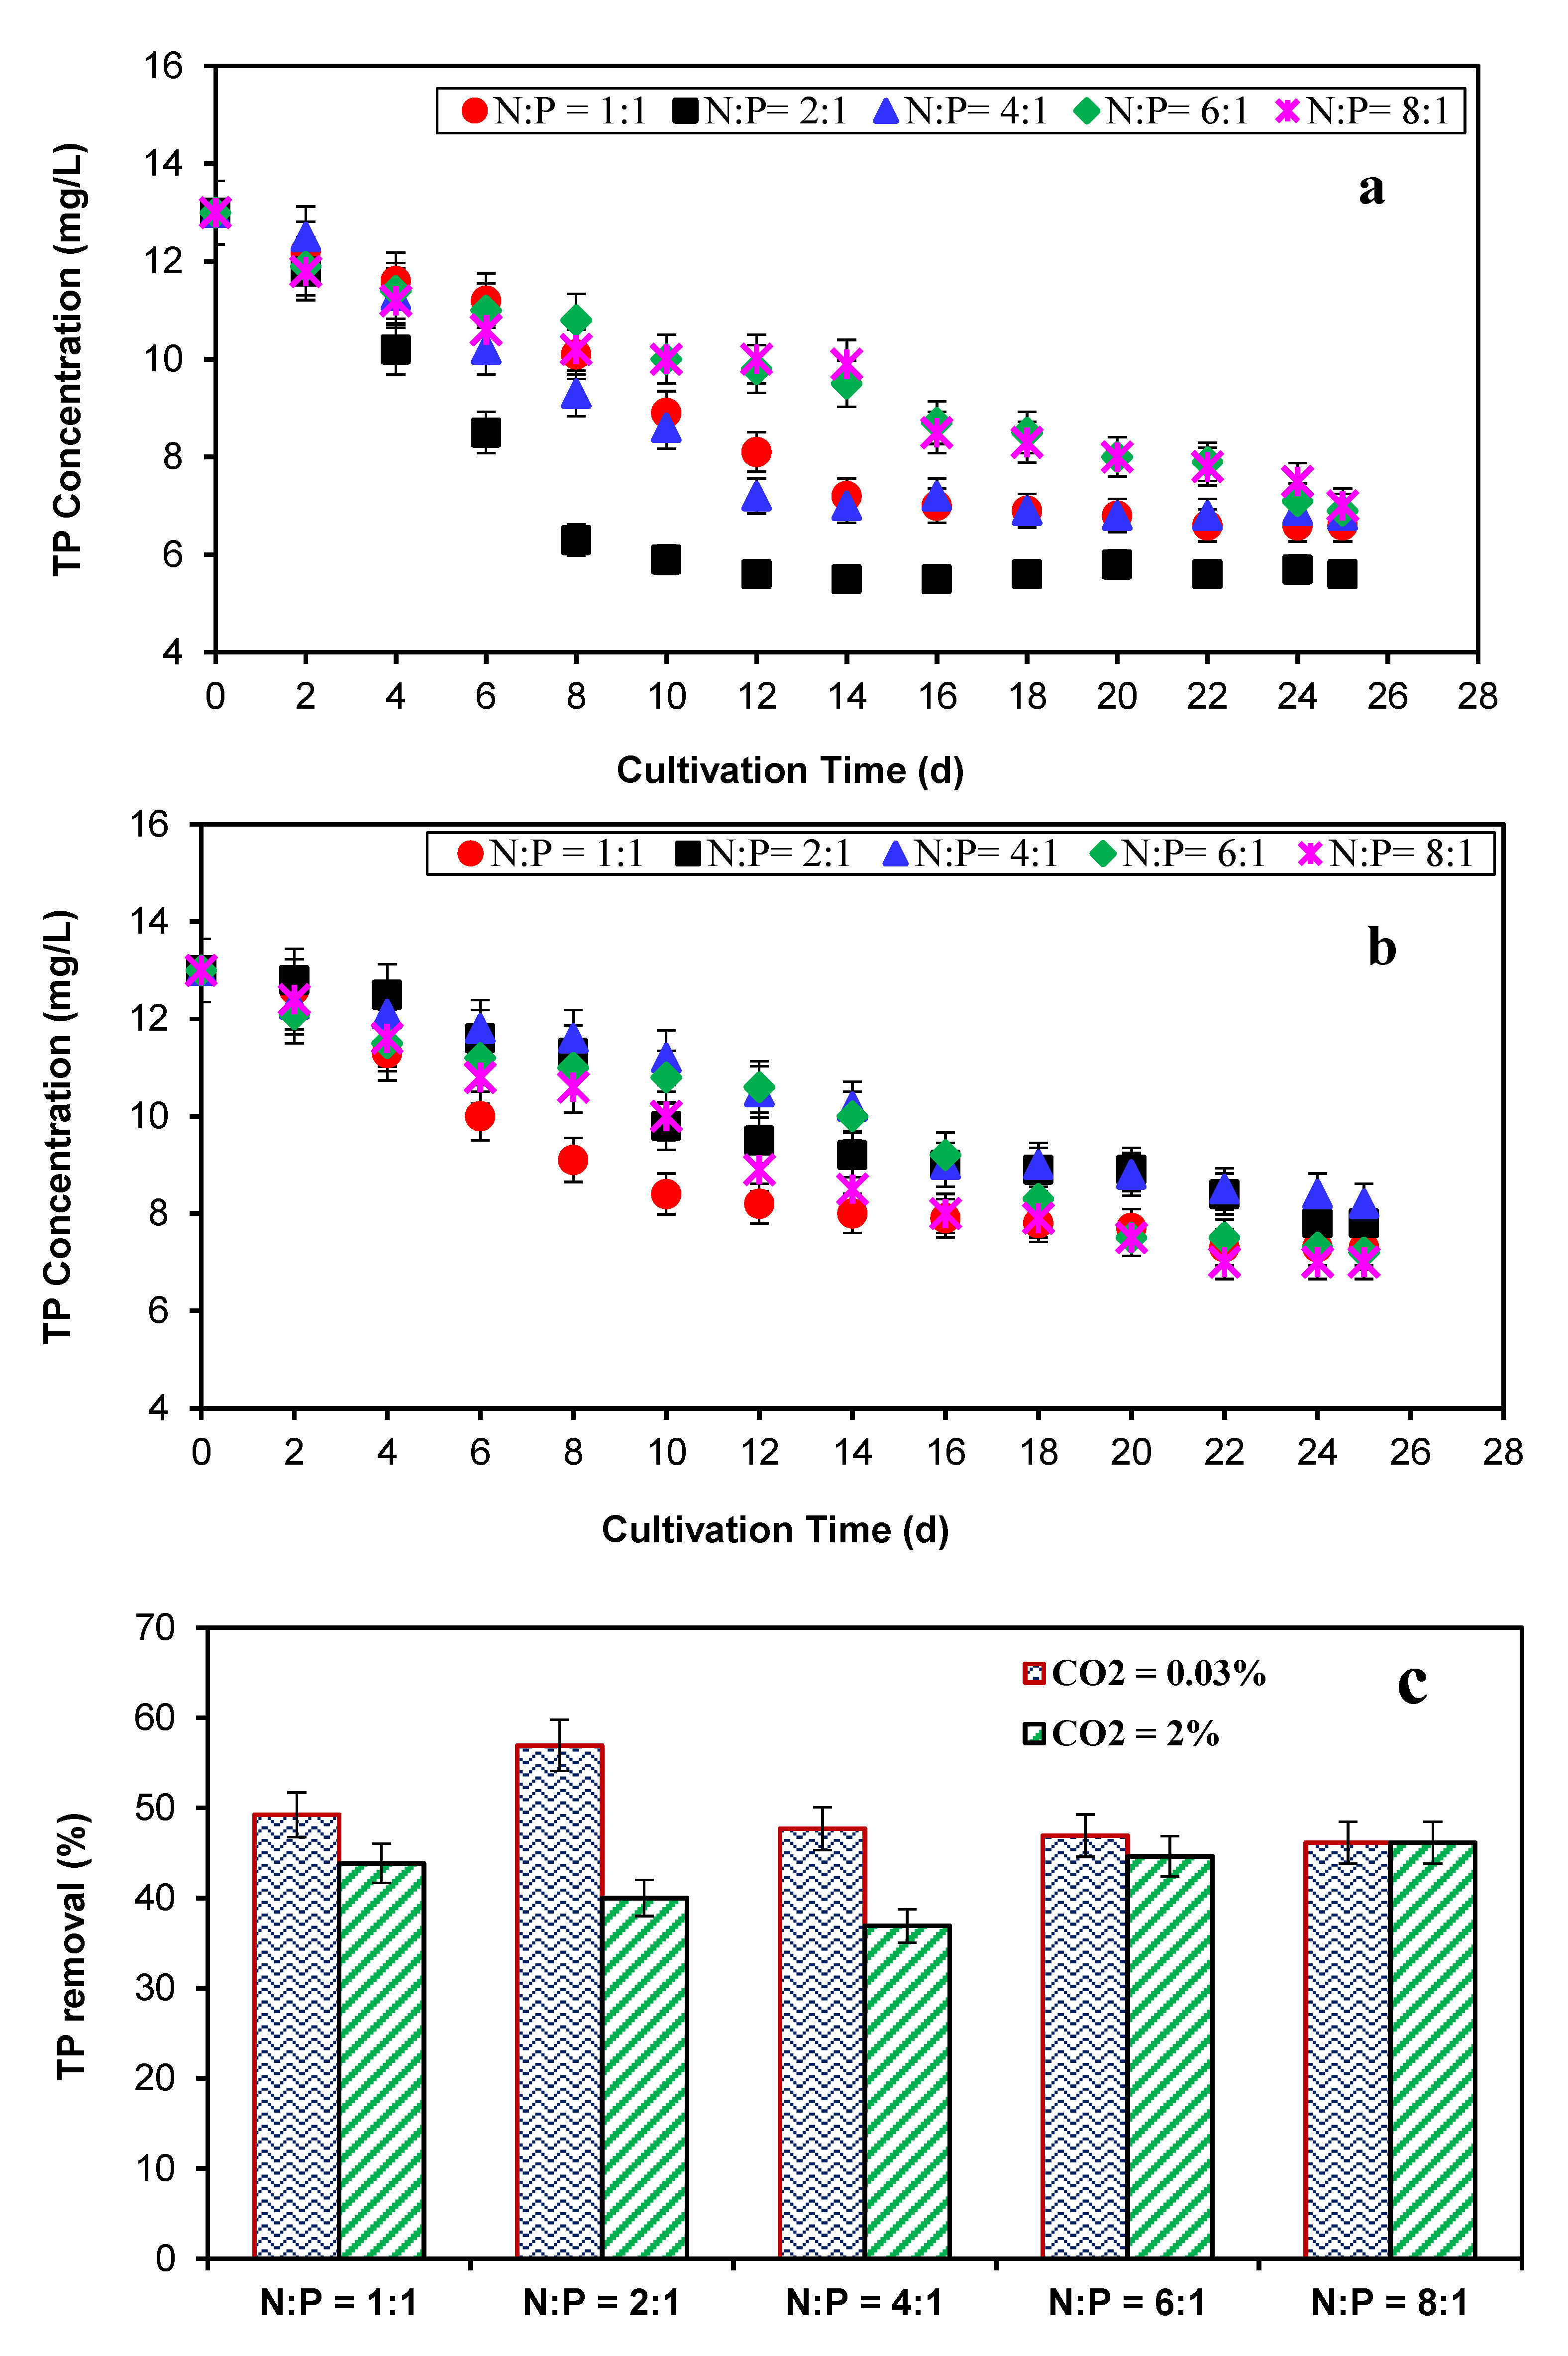
3.2.2. Total Phosphorous Removal
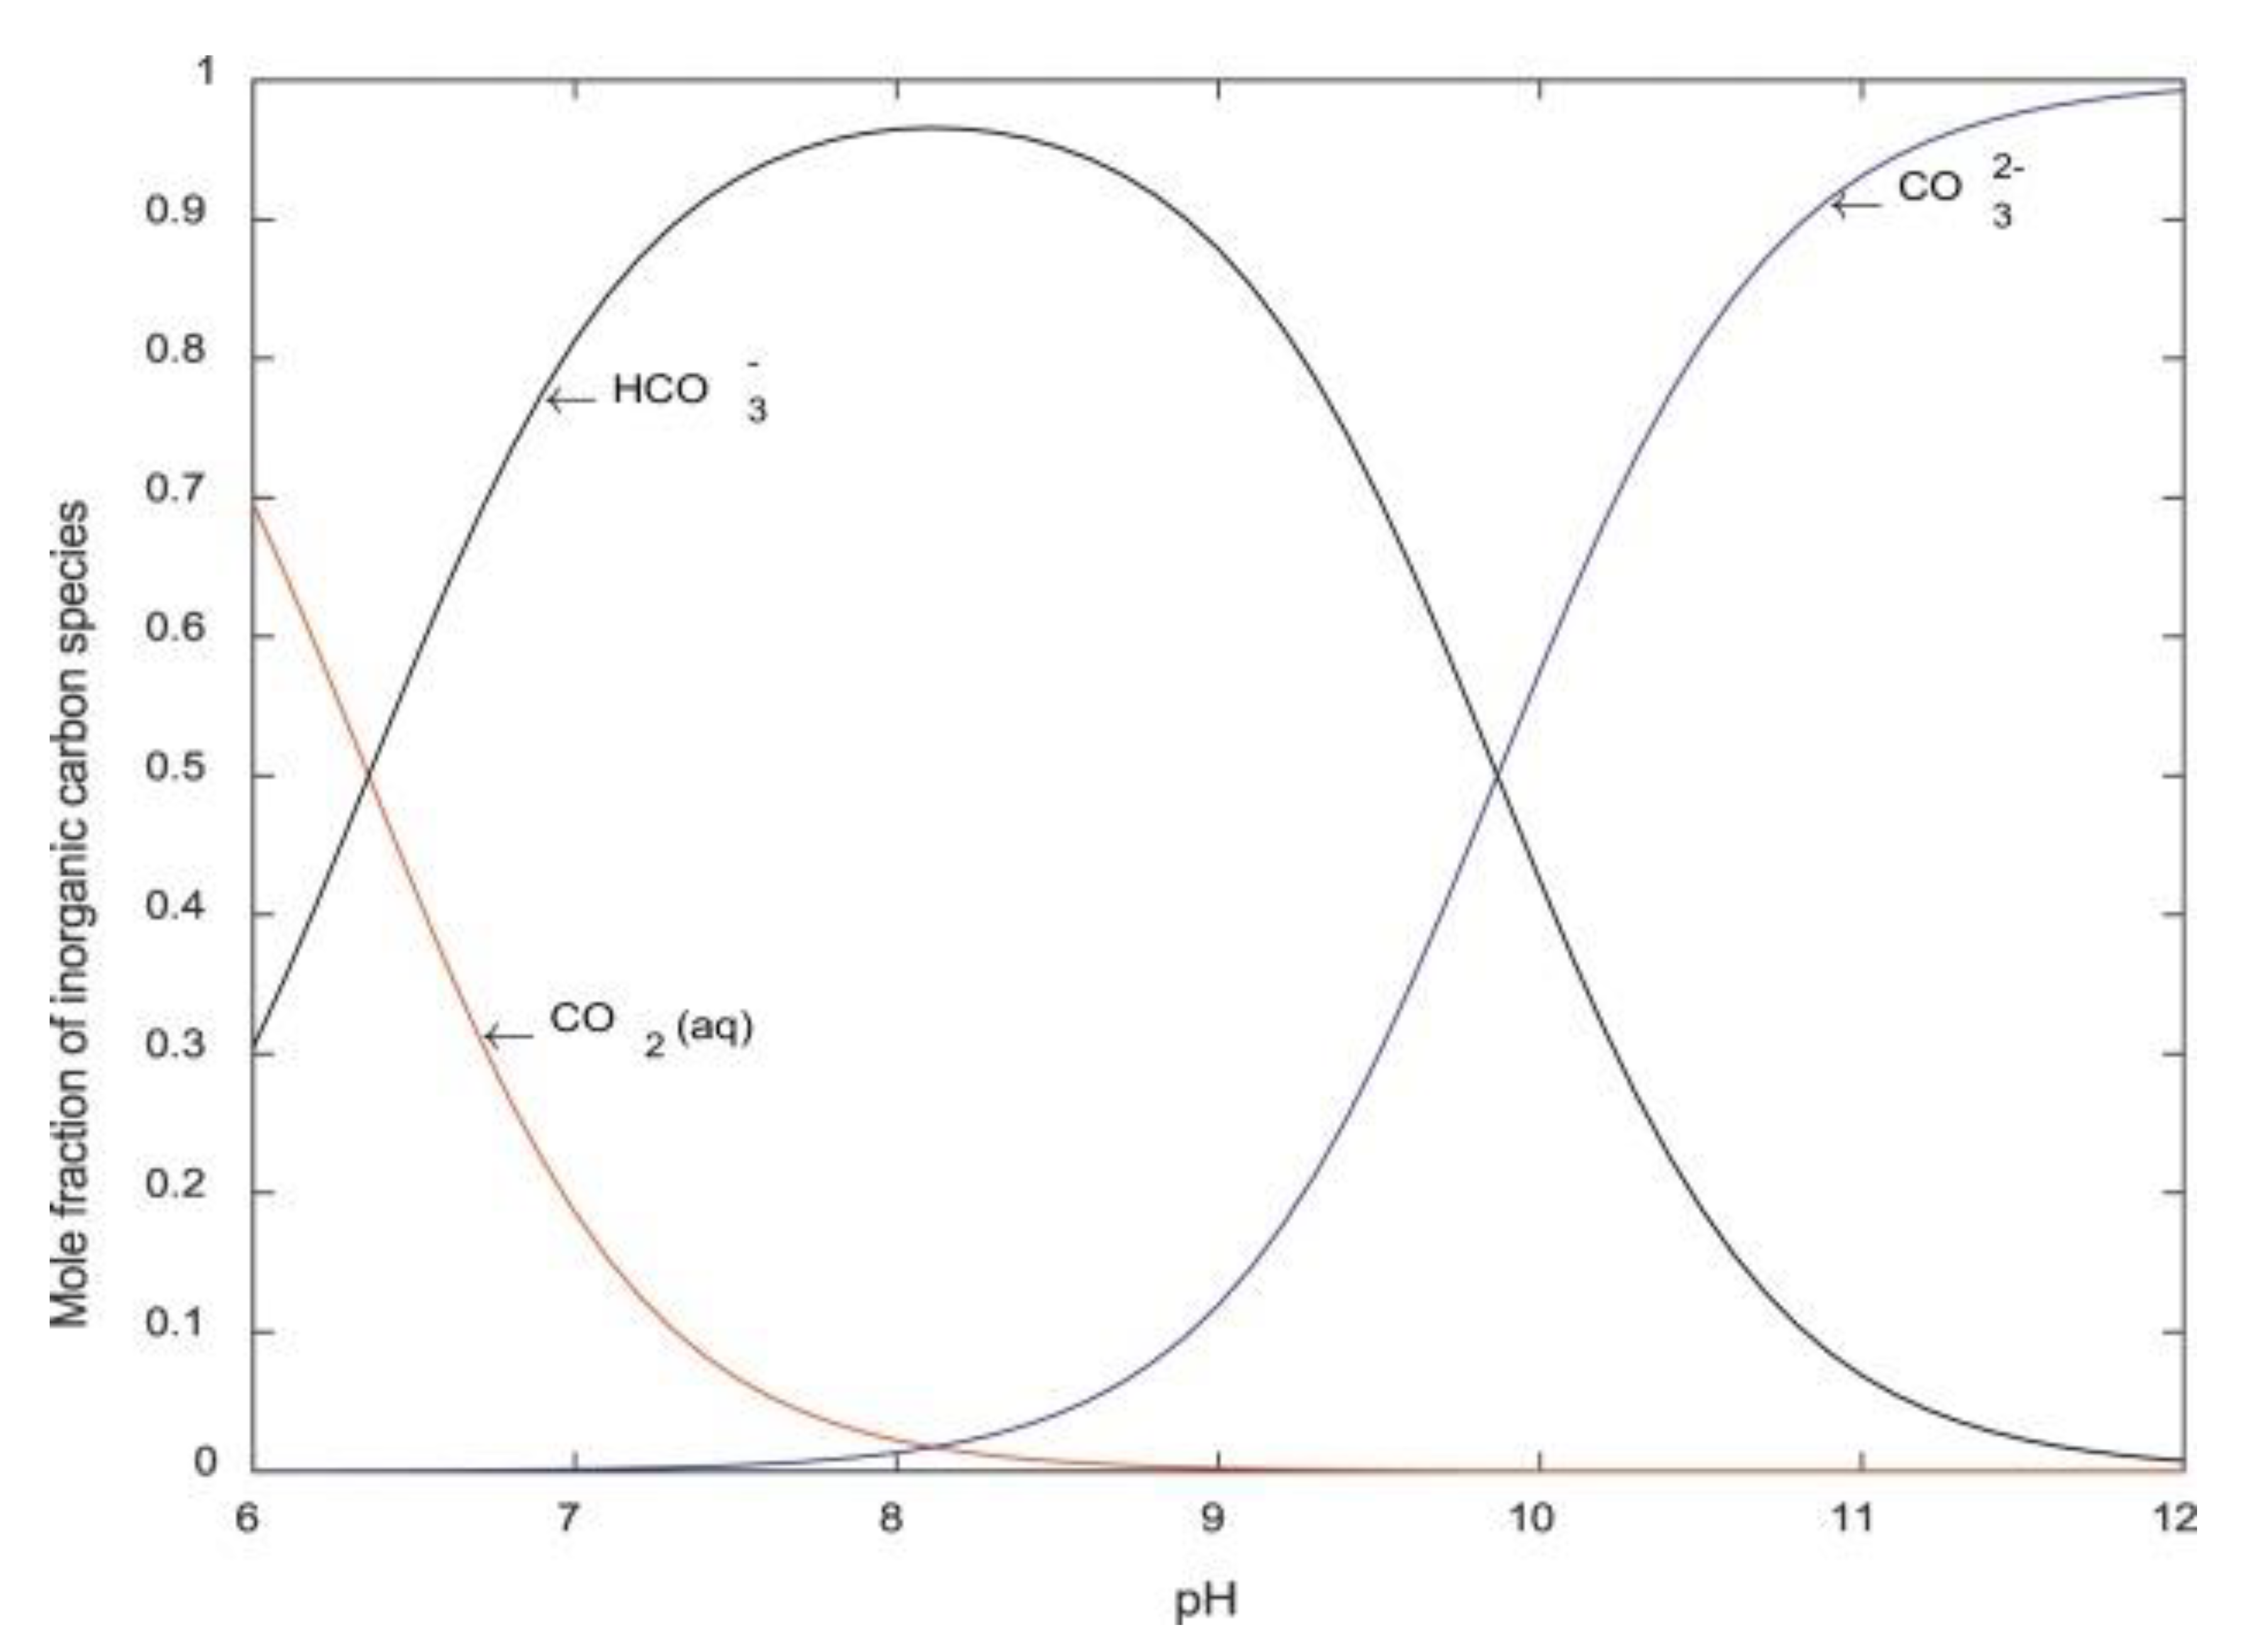
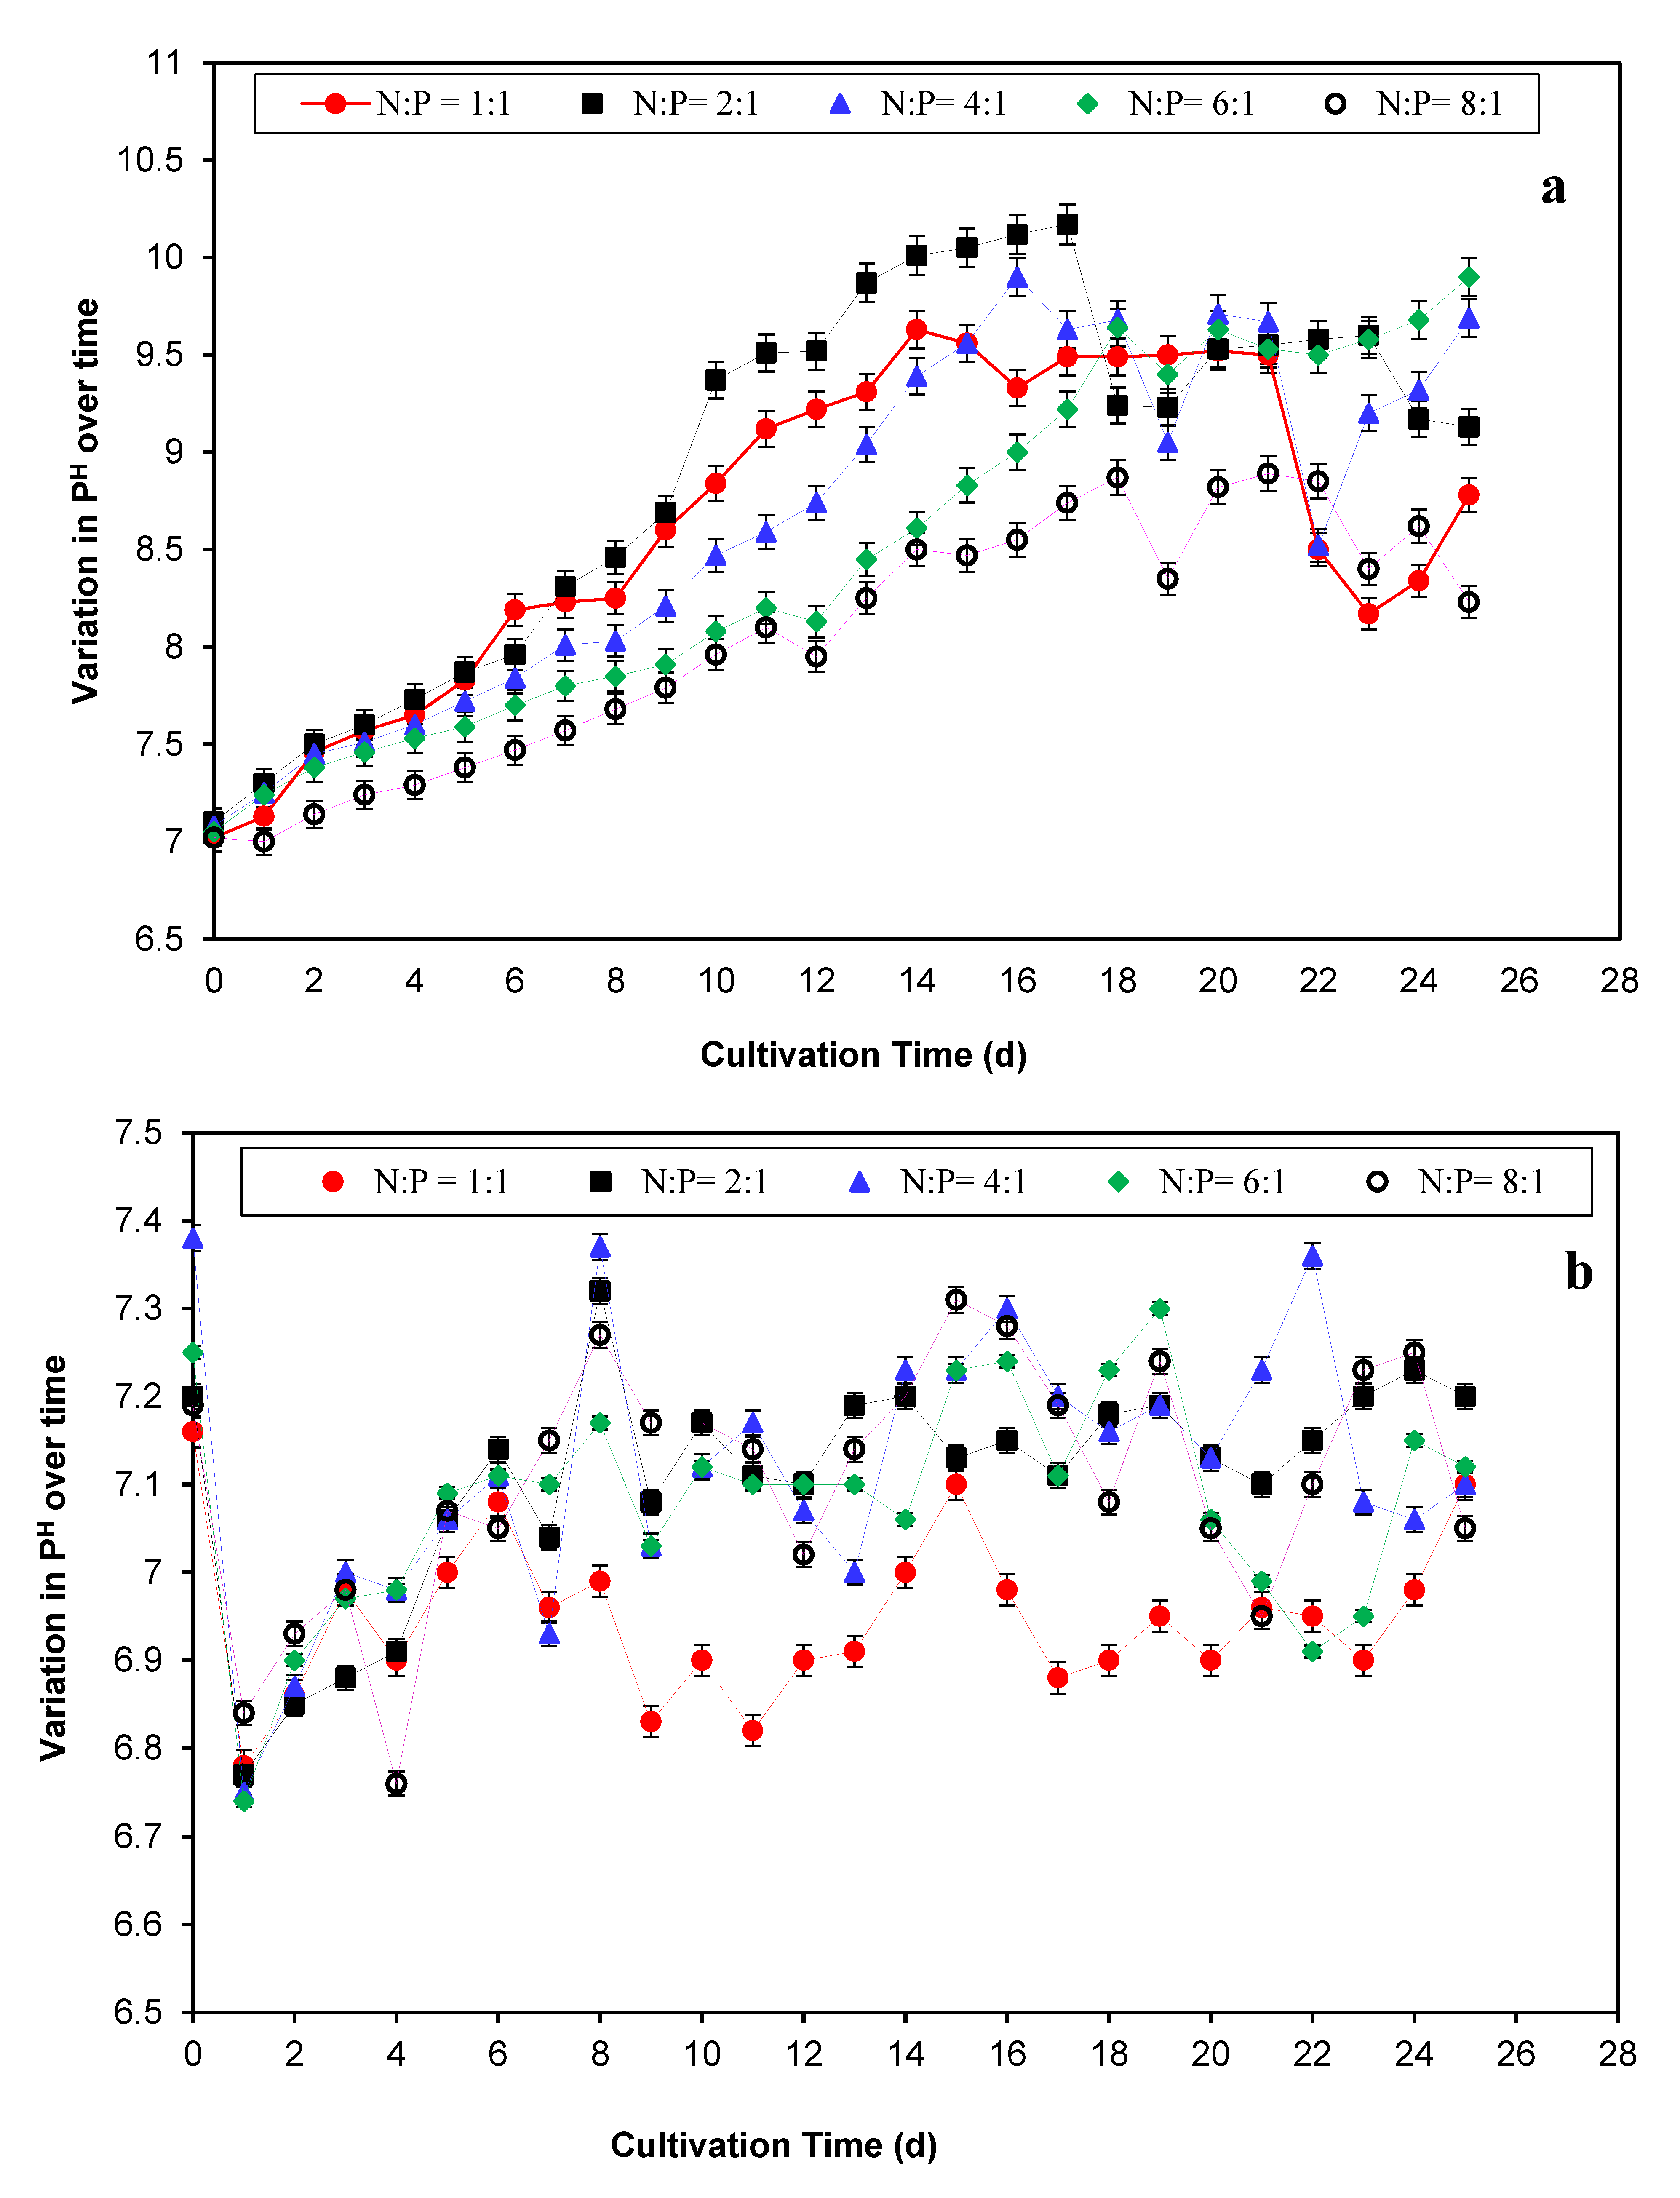
Phosphorous is one of the contaminants that must be removed from tertiary wastewater. Similar to nitrogen, phosphorous is needed for microalgal growth and the maintenance of their energy metabolism [48]. As shown in Figure 6a,c, the percent elimination of phosphorous following culture ranges from 46% to 57% for an initial concentration of 13 mg/L of total phosphorous (TP) for all N:P ratios (Case 1). In contrast, phosphorous elimination at the conclusion of the cultivation period in Case 2 ranges from 37% to 46% for all N:P ratios with the same initial concentration of TP. The elimination of a greater proportion of phosphorous in Case 1 at all N:P ratios is significant compared to Case 2.
In terms of phosphorous removal, significant statistical difference (p < 0.05) was found among all N:P ratios considering Case 1 separately, whereas it was not statistically significant (p > 0.05) for Case 2. Thus, the data imply that CO2 supplementation does not considerably improve phosphorous removal efficiency. The increased percentage of phosphorous removal in Case 1 compared to Case 2 is most likely attributable to the elevated pH values up to 10 (Figure 6a) seen during the cultivation period in Case 1. In addition to the adsorption of phosphorous by the microalgal cell wall and subsequent phosphorylation, phosphate can be precipitated from the culture media at pH values greater than 9. Similar results have been reported in a number of published works [48,49,50]. The greatest phosphorous removal in Case 1 is 57% at a N:P ratio of 2:1. In Case 2, however, the greatest phosphorous removal of 46% occurs at a N:P ratio of 8:1, which is consistent with the cultivation medium’s nitrogen availability [35]. The Stumm empirical molecular formula for algae (C106H263O110N16P) indicates that the rate of uptake of nitrogen would be higher than that of phosphorous owing to the relatively higher percentage of nitrogen in algae. The nitrogen removal rates determined in this study under all experimental conditions are higher than those of phosphorous, as expected due to the chemical composition of algae. As a result, higher N:P ratio requirement could reasonably be associated with causing a high inner PO43− pool [51] and resulting in the lower phosphorous removal of 37% to 57% found in this study for all experimental conditions. In addition, the lower removal of phosphorous from the culture medium of synthetic wastewater may be attributed to the higher initial concentration of phosphorous [52]. However, the phosphorous removal effectiveness revealed in this study is substantially greater than those discovered in other published studies of a similar nature [53,54].

3.3. pH Profiles

Since pH influences CO2 solubility and accessibility, it is one of the most important environmental factors that affects the growth and metabolism of microalgae [55]. pH is the most crucial factor as regards influencing the relative amounts of carbonaceous species in water [43]. Figure 7 depicts the various inorganic carbon species with regard to mole fractions in various pH media [43]. Maximum algal growth occurs in the neutral pH range (6.1–10) when CO2 in water can also exist as CO2 + H2 = H+ + HCO3 [56]. In this investigation, the initial pH of the culture media was altered from 7 to 7.5 for all tests, taking into account the pH range of municipal tertiary wastewater [36,37]. Figure 8a,b demonstrates the pH profiles over time during the cultivation of Scenedesmus dimorphus under the experimental conditions of Case 1 and Case 2, respectively.
As shown in Figure 8a (Case 1), the initial pH of the culture medium is 7.0, and the pH of the medium gradually increases up to nearly 18 days in all tests. Due to the low level of CO2 in the medium, the uptake of nitrogen for algal cell growth and the sub-sequent nitrate adsorption by microalgae, the pH value rises during the cultivation period according to the following equation [43,57]:
16 NO3 + 140 H2O + 106 HCO3 + HPO42−→C106H263O110N16P + 124 OH + 138 O2
The pH changes in Case 1 are statistically significant (p < 0.05) among all N:P ratios according to the ANOVA analysis. After 18 days, the pH of the culture medium lowers significantly, allowing for continued development and the attainment of maximum biomass at all N:P ratios. This may be caused by the existence of 60% to 85% of accessible CO2 as inorganic HCO3 species in the cultivation medium’s pH range [43].
According to the data shown in Figure 8b (Case 2), the initial pH decreases due to the augmentation of the culture medium with CO2, which is then followed by a progressive increase in pH that reaches a plateau with few changes during the cultivation period for all N:P ratios. The observed change of pH in Case 2 among all N:P ratios was also statistically significant (p <0.05). Other studies have reported comparable results [15,47]. The initial fall in pH results from the dissolution of CO2 in the culture media. The pH rises as a result of the microalgae cells absorbing CO2 during their growth, eventually reaching a plateau with slight changes. During photosynthesis, the pH levels linked with the growth of microalgae increase from around 6.85 to 7.23 [58]. Bicarbonate ions are adsorbed by microalgae cells during photosynthesis and converted to CO2, which is then fixed by the RuBisCO enzyme. H+ is absorbed in the cell as per the equilibrium of following Equation (8), resulting in an elevated OH concentration.
H+ + HCO3 = CO2 + H2O
To maintain a neutral intracellular pH, H+ must be taken up from the growth medium, which eventually elevates the pH [59]. At a pH of 7.22, 87% of the inorganic carbon exists as HCO3 and 13% exists as CO2(aq) (Figure 7). Therefore, all additional CO2 is in a form favorable for microalgal development [43]. In this investigation, the greatest biomass production of 733 mg/L is achieved at a pH of 7.23 with a N:P ratio of 2:1. Therefore, it is assumed that the majority of inorganic carbon species were in the form of HCO3 and CO2(aq) at a pH of 7.23 (Figure 7) with a N:P ratio of 2:1, which supports the highest biomass output.

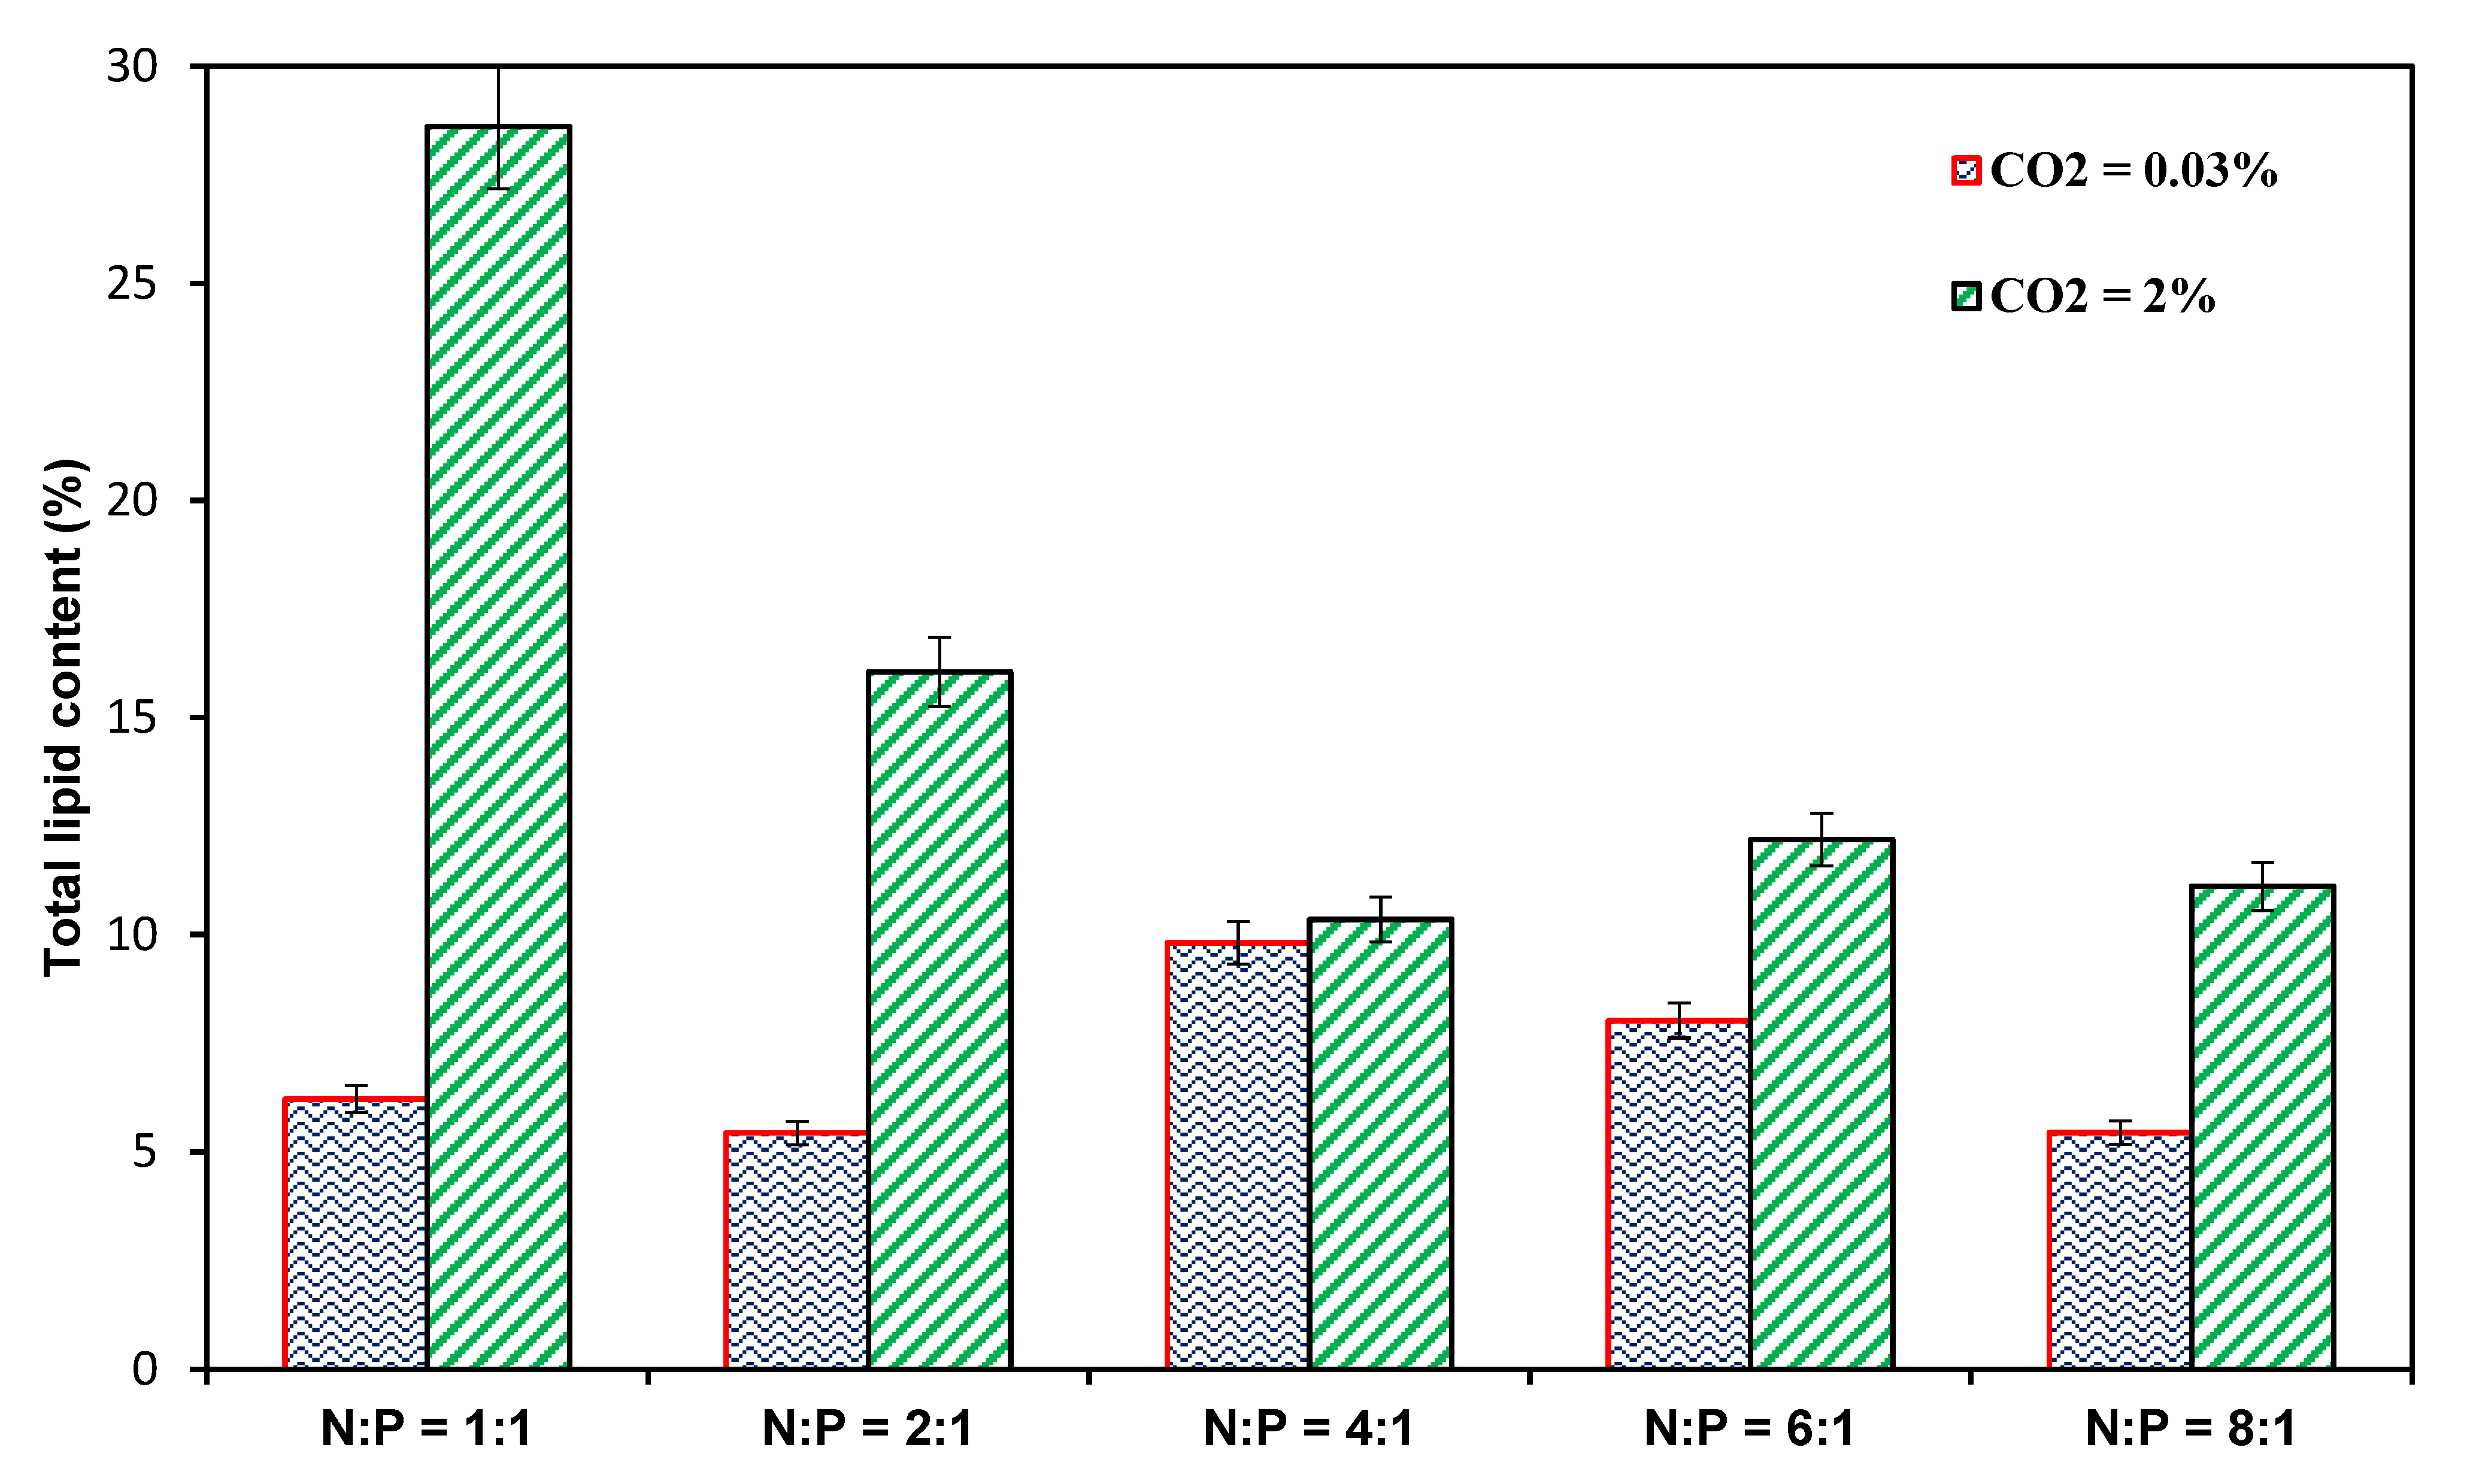
3.4. Total Lipid Content

Microalgae are a potential source of lipids for biofuel generation due to their simple cellular structure and greater growth rates than traditional crops as regards creating biomass for oil synthesis [60]. Lipids are compounds that are biosynthetically or functionally related to fatty acids and their derivatives [61]. In this study, the total lipid content of microalgae was measured utilizing a rapid colorimetric SPV method [41,42]. The total amount of lipids as a percentage of the biomass’s dry weight at the conclusion of culture for all N:P ratios are represented in Figure 9 for both Case 1 and Case 2. In Case 2, the microalgal biomass contains more lipids than Case 1’s biomass at all N:P ratios. This finding indicates that CO2 supplementation in microalgae cultivation has a significant impact on lipid accumulation in the microalgal biomass. The conclusions of this analysis confirm the findings of others [15,62]. In Case 1, the total lipid content ranges between 6% and 10% based on the dry biomass for each of the investigated N:P ratios. In Case 2, the total lipid content of Scenedesmus dimorphus microalgae ranges from 11% to 29% based on their dry biomass. Maximum lipid content was 29% when the N:P ratio was 1:1, and 16% when the N:P ratio was 2:1. Thus, lipid content of microalgae enhances significantly when the growth medium is supplied with CO2-enriched air compared to when supplied with pure air. In addition, this phenomenon can be attributed to nitrogen starvation owing to the depletion of nitrogen in the culture medium for 1:1 N:P ratio after 12 days of the cultivation period at higher supplementation of the supplied air with 2% CO2 [63,64]. In addition, Table 4 provides a summary of the key findings of this study and a comparison with previously published research.

4. Conclusions

Cultivation of microalgae in municipal tertiary wastewater with an optimally adjusted N:P ratio and CO2 supplementation are an intriguing integrated technique for improved biomass production with lipid buildup and pollution reduction via nutrient removal from wastewater. Significantly influencing enhanced microalgal growth and nutrient removal from wastewater is the culture medium’s pH. In this work, a maximum nitrogen removal of 100% and a maximum biomass production of 733 mg/L were obtained at a pH of 7.23 and a N:P ratio of 2:1, when microalgae were cultured with supplementation utilizing 2% CO2 in the air. In the cultivation of the microalgae Scenedesmus dimorphus, a higher pH value, i.e., without CO2 supplementation, has a significant effect on phosphorous removal. This is due to the precipitation of phosphate at pH levels above 9 and the adsorption of phosphorous onto the cell walls of microalgae. CO2 supplementation, the N:P ratio, and nitrate deprivation of the culture media influence the total lipid content. Due to the extended nitrogen shortage phase with a N:P ratio of 1:1, a maximum lipid content of 29% of the dry weight of the biomass was obtained when Scenedesmus dimorphus was cultured with 2% CO2 in the air under the experimental circumstances of this study. For the removal of nutrients from wastewater and the formation of lipid-rich biomass, it is proposed to research the viability of the growing of Scenedesmus dimorphus in municipal tertiary wastewater with supplementation of greater CO2 concentrations in the air.

Supplementary Materials

The following supporting information can be downloaded at: https://www.mdpi.com/article/10.3390/su15021409/s1, Figure S1: Calibration curve for lipid quantification.

Author Contributions

Conceptualization, M.O.F. and S.A.R.; methodology, S.A.R.; formal analysis, M.O.F.; investigation, M.O.F.; writing—original draft preparation, M.O.F.; writing—review and editing, S.A.R., M.O.F., W.F. and M.M.H.; project administration, S.A.R.; funding acquisitions S.A.R. All authors have read and agreed to the published version of the manuscript.

Funding

This research was funded by the Deanship of Scientific Research (DSR) at King Fahd University of Petroleum and Minerals (KFUPM) through project No. DF191050.

Institutional Review Board Statement

Not applicable.

Informed Consent Statement

Not applicable.

Data Availability Statement

All data included in this study are available upon request by contact with the corresponding author.

Acknowledgments

Authors are grateful to the King Fahd University of Petroleum & Minerals (KFUPM) for financial support to conduct this research work through DSR project No. DF191050.

Conflicts of Interest

The authors declare no conflict of interest.

References

  1. Ganesan, R.; Manigandan, S.; Samuel, M.S.; Shanmuganathan, R.; Brindhadevi, K.; Lan Chi, N.T.; Duc, P.A.; Pugazhendhi, A. A review on prospective production of biofuel from microalgae. Biotechnol. Rep. 2020, 27, e00509. [Google Scholar] [CrossRef]
  2. Maity, J.P.; Bundschuh, J.; Chen, C.Y.; Bhattacharya, P. Microalgae for third generation biofuel production, mitigation ofgreenhouse gas emissions and wastewater treatment: Present andfuture perspectives—A mini review. Energy 2014, 78, 104–113. [Google Scholar] [CrossRef]
  3. Becerra-Castro, C.; Lopes, A.R.; Vaz-Moreira, I.; Silva, E.F.; Manaia, C.M.; Nunes, O.C. Wastewater reuse in irrigation: A microbiological perspective on implications in soil fertility and human and environmental health. Environ. Int. 2015, 75, 117–135. [Google Scholar] [CrossRef] [PubMed] [Green Version]
  4. Razzak, S.A.; Faruque, M.O.; Alsheikh, Z.; Alsheikhmohamad, L.; Alkuroud, D.; Alfayez, A.; Hossain, S.M.Z.; Hossain, M.M. A comprehensive review on conventional and biological-driven heavy metals removal from industrial wastewater. Environ. Adv. 2022, 7, 100168. [Google Scholar] [CrossRef]
  5. Hossain, S.M.Z.; Sultana, N.; Jassim, M.S.; Coskuner, G.; Hazin, L.M.; Razzak, S.A.; Hossain, M.M. Soft-computing modeling and multiresponse optimization for nutrient removal process from municipal wastewater using microalgae. J. Water Process Eng. 2022, 45, 102490. [Google Scholar] [CrossRef]
  6. Gonçalves, A.L.; Pires, J.C.M.; Simões, M. A review on the use of microalgal consortia for wastewater treatment. Algal Res. 2017, 24, 403–415. [Google Scholar] [CrossRef]
  7. Razzak, S.A. In situ biological CO2 fixation and wastewater nutrient removal with Neochloris oleoabundans in batch photobioreactor. Bioprocess Biosyst. Eng. 2019, 42, 93–105. [Google Scholar] [CrossRef]
  8. Ince, M.; Kaplan Ince, O. Heavy Metal Removal Techniques Using Response Surface Methodology: Water/Wastewater Treatment. In Biochemical Toxicology—Heavy Metals and Nanomaterials; IntechOpen: London, UK, 2020. [Google Scholar]
  9. Paerl, H.W.; Scott, J.T.; McCarthy, M.J.; Newell, S.E.; Gardner, W.S.; Havens, K.E.; Hoffman, D.K.; Wilhelm, S.W.; Wurtsbaugh, W.A. It Takes Two to Tango: When and Where Dual Nutrient (N & P) Reductions Are Needed to Protect Lakes and Downstream Ecosystems. Environ. Sci. Technol. 2016, 50, 10805–10813. [Google Scholar] [CrossRef] [Green Version]
  10. Passos, F.; Gutiérrez, R.; Brockmann, D.; Steyer, J.P.; García, J.; Ferrer, I. Microalgae production in wastewater treatment systems, anaerobic digestion and modelling using ADM1. Algal Res. 2015, 10, 55–63. [Google Scholar] [CrossRef] [Green Version]
  11. Faruque, M.O.; Mohammed, K.A.; Hossain, M.M.; Razzak, S.A. Influence of elevated CO2 concentrations on growth, nutrient removal, and CO2 biofixation using Chlorella kessleri cultivation. Int. J. Environ. Sci. Technol. 2020, 18, 913–926. [Google Scholar] [CrossRef]
  12. Molazadeh, M.; Ahmadzadeh, H.; Pourianfar, H.R.; Lyon, S.; Rampelotto, P.H. The use of microalgae for coupling wastewater treatment with CO2 biofixation. Front. Bioeng. Biotechnol. 2019, 7, 42. [Google Scholar] [CrossRef] [PubMed] [Green Version]
  13. Hossain, S.M.Z.; Alnoaimi, A.; Razzak, S.A.; Ezuber, H.; Al-Bastaki, N.; Safdar, M.; Alkaabi, S.; Hossain, M.M. Multiobjective optimization of microalgae (Chlorella sp.) growth in a photobioreactor using Box-Behnken design approach. Can. J. Chem. Eng. 2018, 96, 1903–1910. [Google Scholar] [CrossRef]
  14. Kırlı, M.S.; Fahrioğlu, M. Sustainable development of Turkey: Deployment of geothermal resources for carbon capture, utilization, and storage. Energy Sources Part A Recover. Util. Environ. Eff. 2019, 41, 1739–1751. [Google Scholar] [CrossRef]
  15. Nayak, M.; Karemore, A.; Sen, R. Performance evaluation of microalgae for concomitant wastewater bioremediation, CO2 biofixation and lipid biosynthesis for biodiesel application. Algal Res. 2016, 16, 216–223. [Google Scholar] [CrossRef]
  16. Rahman, S.M.; Al-Ismail, F.S.; Haque, M.E.; Shafiullah, M.; Islam, M.R.; Chowdhury, M.T.; Alam, M.S.; Razzak, S.A.; Ali, A.; Khan, Z.A. Electricity generation in Saudi Arabia: Tracing opportunities and challenges to reducing greenhouse gas emissions. IEEE Access 2021, 9, 116163–116182. [Google Scholar] [CrossRef]
  17. Cheah, W.Y.; Show, P.L.; Chang, J.S.; Ling, T.C.; Juan, J.C. Biosequestration of atmospheric CO2 and flue gas-containing CO2 by microalgae. Bioresour. Technol. 2015, 184, 190–201. [Google Scholar] [CrossRef]
  18. Omar Faruque, M.; Ilyas, M.; Mozahar Hossain, M.; Abdur Razzak, S. Influence of Nitrogen to Phosphorus Ratio and CO2 Concentration on Lipids Accumulation of Scenedesmus dimorphus for Bioenergy Production and CO2 Biofixation. Chem. Asian J. 2020, 5, 4307–4320. [Google Scholar] [CrossRef]
  19. Renuka, N.; Sood, A.; Prasanna, R.; Ahluwalia, A.S. Phycoremediation of wastewaters: A synergistic approach using microalgae for bioremediation and biomass generation. Int. J. Environ. Sci. Technol. 2015, 12, 1443–1460. [Google Scholar] [CrossRef] [Green Version]
  20. Grace, C.E.; Lakshmi, P.K.; Meenakshi, S.; Vaidyanathan, S.; Srisudha, S.; Mary, M.B. Briget Mary Biomolecular transitions and lipid accumulation in green microalgae monitored by FTIR and Raman analysis. Spectrochim. Acta Part A Mol. Biomol. Spectrosc. 2020, 224, 117382. [Google Scholar] [CrossRef]
  21. Razzak, S.A.; Ali, S.A.M.; Hossain, M.M.; deLasa, H. Biological CO2 fixation with production of microalgae in wastewater—A review. Renew. Sustain. Energy Rev. 2017, 76, 379–390. [Google Scholar] [CrossRef]
  22. Yang, J.; Xu, M.; Zhang, X.; Hu, Q.; Sommerfeld, M.; Chen, Y. Life-cycle analysis on biodiesel production from microalgae: Water footprint and nutrients balance. Bioresour. Technol. 2011, 102, 159–165. [Google Scholar] [CrossRef] [PubMed]
  23. Razzak, S.A.; Hossain, M.M.; Lucky, R.A.; Bassi, A.S.; De Lasa, H. Integrated CO2 capture, wastewater treatment and biofuel production by microalgae culturing—A review. Renew. Sustain. Energy Rev. 2013, 27, 622–653. [Google Scholar] [CrossRef]
  24. Ansari, F.A.; Singh, P.; Guldhe, A.; Bux, F. Microalgal cultivation using aquaculture wastewater: Integrated biomass generation and nutrient remediation. Algal Res. 2017, 21, 169–177. [Google Scholar] [CrossRef]
  25. Chu, W.L.; Phang, S.M. Microalgae of Biofuel and for Development Biotechnology Wastewater Treatment; Springer: Berlin/Heidelberg, Germany, 2019; ISBN 9789811322648. [Google Scholar]
  26. Higgins, B.T.; Gennity, I.; Fitzgerald, P.S.; Ceballos, S.J.; Fiehn, O.; VanderGheynst, J.S. Algal–bacterial synergy in treatment of winery wastewater. Npj Clean Water 2018, 1, 6. [Google Scholar] [CrossRef] [Green Version]
  27. Yu, H.; Kim, J.; Lee, C. Nutrient removal and microalgal biomass production from different anaerobic digestion effluents with Chlorella species. Sci. Rep. 2019, 9, 6123. [Google Scholar] [CrossRef] [PubMed] [Green Version]
  28. Ajala, S.O.; Alexander, M.L. Assessment of Chlorella vulgaris, Scenedesmus obliquus, and Oocystis minuta for removal of sulfate, nitrate, and phosphate in wastewater. Int. J. Energy Environ. Eng. 2020, 11, 311–326. [Google Scholar] [CrossRef] [Green Version]
  29. Zhai, J.; Li, X.; Li, W.; Rahaman, M.H.; Zhao, Y.; Wei, B.; Wei, H. Optimization of biomass production and nutrients removal by Spirulina platensis from municipal wastewater. Ecol. Eng. 2017, 108, 83–92. [Google Scholar] [CrossRef]
  30. Jiang, Y.; Zhang, W.; Wang, J.; Chen, Y.; Shen, S.; Liu, T. Utilization of simulated flue gas for cultivation of Scenedesmus dimorphus. Bioresour. Technol. 2013, 128, 359–364. [Google Scholar] [CrossRef]
  31. Li, X.; Hu, H.-y.; Gan, K.; Sun, Y.-x. Effects of different nitrogen and phosphorus concentrations on the growth, nutrient uptake, and lipid accumulation of a freshwater microalga Scenedesmus sp. Bioresour. Technol. 2010, 101, 5494–5500. [Google Scholar] [CrossRef]
  32. Baldisserotto, C.; Demaria, S.; Accoto, O.; Marchesini, R.; Zanella, M.; Benetti, L.; Avolio, F.; Maglie, M.; Ferroni, L.; Pancaldi, S. Removal of nitrogen and phosphorus from thickening effluent of an urban wastewater treatment plant by an isolated green microalga. Plants 2020, 9, 1802. [Google Scholar] [CrossRef]
  33. Mohsenpour, S.F.; Hennige, S.; Willoughby, N.; Adeloye, A.; Gutierrez, T. Integrating micro-algae into wastewater treatment: A review. Sci. Total Environ. 2021, 752, 142168. [Google Scholar] [CrossRef] [PubMed]
  34. Lutzu, G.A.; Zhang, W.; Liu, T. Feasibility of using brewery wastewater for biodiesel production and nutrient removal by Scenedesmus dimorphus Algae as a model for production of high value products (HVP) and biofuel View project. Environ. Technol. 2016, 37, 1568–1581. [Google Scholar] [CrossRef] [PubMed]
  35. Beuckels, A.; Smolders, E.; Muylaert, K. Nitrogen availability influences phosphorus removal in microalgae-based wastewater treatment. Water Res. 2015, 77, 98–106. [Google Scholar] [CrossRef]
  36. Jiang, L.; Luo, S.; Fan, X.; Yang, Z.; Guo, R. Biomass and lipid production of marine microalgae using municipal wastewater and high concentration of CO2. Appl. Energy 2011, 88, 3336–3341. [Google Scholar] [CrossRef]
  37. Ji, M.K.; Abou-Shanab, R.A.I.; Kim, S.H.; Salama, E.S.; Lee, S.H.; Kabra, A.N.; Lee, Y.S.; Hong, S.; Jeon, B.H. Cultivation of microalgae species in tertiary municipal wastewater supplemented with CO2 for nutrient removal and biomass production. Ecol. Eng. 2013, 58, 142–148. [Google Scholar] [CrossRef]
  38. Wang, Y.; Chen, T.; Qin, S. Heterotrophic cultivation of Chlorella kessleri for fatty acids production by carbon and nitrogen supplements. Biomass Bioenergy 2014, 47, 402–409. [Google Scholar] [CrossRef]
  39. Abreu, A.P.; Fernandes, B.; Vicente, A.A.; Teixeira, J.; Dragone, G. Mixotrophic cultivation of Chlorella vulgaris using industrial dairy waste as organic carbon source. Bioresour. Technol. 2012, 118, 61–66. [Google Scholar] [CrossRef] [Green Version]
  40. Tang, D.; Han, W.; Li, P.; Miao, X.; Zhong, J. CO2 biofixation and fatty acid composition of Scenedesmus obliquus and Chlorella pyrenoidosa in response to different CO2 levels. Bioresour. Technol. 2011, 102, 3071–3076. [Google Scholar] [CrossRef]
  41. Byreddy, A.R.; Gupta, A.; Barrow, C.J.; Puri, M. A quick colorimetric method for total lipid quantification in microalgae. J. Microbiol. Methods 2016, 125, 28–32. [Google Scholar] [CrossRef]
  42. Razzak, S.A. Biomass and Lipid Productivity of Neochloris oleoabundans for CO2 Biofixation and Biodiesel Application. Chem. Eng. Technol. 2018, 41, 2177–2185. [Google Scholar] [CrossRef]
  43. Eze, V.C.; Velasquez-Orta, S.B.; Hernández-García, A.; Monje-Ramírez, I.; Orta-Ledesma, M.T. Kinetic modelling of microalgae cultivation for wastewater treatment and carbon dioxide sequestration. Algal Res. 2018, 32, 131–141. [Google Scholar] [CrossRef]
  44. Xu, X.; Shen, Y.; Chen, J. Cultivation of Scenedesmus dimorphus for C/N/P removal and lipid production. Electron. J. Biotechnol. 2015, 18, 46–50. [Google Scholar] [CrossRef] [Green Version]
  45. Sydney, E.B.; da Silva, T.E.; Tokarski, A.; Novak, A.C.; de Carvalho, J.C.; Woiciecohwski, A.L.; Larroche, C.; Soccol, C.R. Screening of microalgae with potential for biodiesel production and nutrient removal from treated domestic sewage. Appl. Energy 2011, 88, 3291–3294. [Google Scholar] [CrossRef]
  46. Abou-Shanab, R.A.I.; Ji, M.K.; Kim, H.C.; Paeng, K.J.; Jeon, B.H. Microalgal species growing on piggery wastewater as a valuable candidate for nutrient removal and biodiesel production. J. Environ. Manag. 2013, 115, 257–264. [Google Scholar] [CrossRef]
  47. Molazadeh, M.; Danesh, S.; Ahmadzadeh, H.; Pourianfar, H.R. Influence of CO2 concentration and N:P ratio on Chlorella vulgaris-assisted nutrient bioremediation, CO2 biofixation and biomass production in a lagoon treatment plant. J. Taiwan Inst. Chem. Eng. 2019, 96, 114–120. [Google Scholar] [CrossRef]
  48. Cai, T.; Park, S.Y.; Li, Y. Nutrient recovery from wastewater streams by microalgae: Status and prospects. Renew. Sustain. Energy Rev. 2013, 19, 360–369. [Google Scholar] [CrossRef]
  49. Arbib, Z.; Ruiz, J.; Alvarez, P.; Garrido, C.; Barragan, J.; Perales, J.A. Chlorella stigmatophora for Urban Wastewater Nutrient Removal and CO2 Abatement. Int. J. Phytoremediation 2012, 14, 714–725. [Google Scholar] [CrossRef]
  50. Arbib, Z.; Ruiz, J.; Álvarez-Díaz, P.; Garrido-Pérez, C.; Perales, J.A. Capability of different microalgae species for phytoremediation processes: Wastewater tertiary treatment, CO2 bio-fixation and low cost biofuels production. Water Res. 2014, 49, 465–474. [Google Scholar] [CrossRef]
  51. Salama, E.S.; Kurade, M.B.; Abou-Shanab, R.A.I.; El-Dalatony, M.M.; Yang, I.S.; Min, B.; Jeon, B.H. Recent progress in microalgal biomass production coupled with wastewater treatment for biofuel generation. Renew. Sustain. Energy Rev. 2017, 79, 1189–1211. [Google Scholar] [CrossRef]
  52. Aslan, S.; Kapdan, I.K. Batch kinetics of nitrogen and phosphorus removal from synthetic wastewater by algae. Ecol. Eng. 2006, 28, 64–70. [Google Scholar] [CrossRef]
  53. Church, J.; Ryu, H.; Sadmani, A.H.M.A.; Randall, A.A.; Santo Domingo, J.; Lee, W.H. Multiscale investigation of a symbiotic microalgal-integrated fixed film activated sludge (MAIFAS) process for nutrient removal and photo-oxygenation. Bioresour. Technol. 2018, 268, 128–138. [Google Scholar] [CrossRef] [PubMed]
  54. Chen, Z.; Qiu, S.; Amadu, A.A.; Shen, Y.; Wang, L.; Wu, Z.; Ge, S. Simultaneous improvements on nutrient and Mg recoveries of microalgal bioremediation for municipal wastewater and nickel laterite ore wastewater. Bioresour. Technol. 2020, 297, 122517. [Google Scholar] [CrossRef] [PubMed]
  55. Razzak, S.A.; Ilyas, M.; Ali, S.A.M.; Hossain, M.M. Effects of CO2 Concentration and pH on mixotrophic growth of Nannochloropsis oculata. Appl. Biochem. Biotechnol. 2015, 176, 1290–1302. [Google Scholar] [CrossRef] [PubMed]
  56. Chavan, K.J.; Chouhan, S.; Jain, S.; Singh, P.; Yadav, M.; Tiwari, A. Environmental Factors Influencing Algal Biodiesel Production. Environ. Eng. Sci. 2014, 31, 602–611. [Google Scholar] [CrossRef]
  57. Vadiveloo, A.; Matos, A.P.; Chaudry, S.; Bahri, P.A.; Moheimani, N.R. Effect of CO2addition on treating anaerobically digested abattoir effluent (ADAE) using Chlorella sp. (Trebouxiophyceae). J. CO2 Util. 2020, 38, 273–281. [Google Scholar] [CrossRef]
  58. García, J.; Green, B.F.; Lundquist, T.; Mujeriego, R.; Hernández-Mariné, M.; Oswald, W.J. Long term diurnal variations in contaminant removal in high rate ponds treating urban wastewater. Bioresour. Technol. 2006, 97, 1709–1715. [Google Scholar] [CrossRef]
  59. Chi, Z.; O’Fallon, J.V.; Chen, S. Bicarbonate produced from carbon capture for algae culture. Trends Biotechnol. 2011, 29, 537–541. [Google Scholar] [CrossRef]
  60. Chen, G.; Zhao, L.; Qi, Y. Enhancing the productivity of microalgae cultivated in wastewater toward biofuel production: A critical review. Appl. Energy 2015, 137, 282–291. [Google Scholar] [CrossRef]
  61. Mofijur, M.; Rasul, M.G.; Hassan, N.M.S.; Nabi, M.N. Recent development in the production of third generation biodiesel from microalgae. Proc. Energy Procedia 2019, 156, 53–58. [Google Scholar] [CrossRef]
  62. Toledo-Cervantes, A.; Morales, M.; Novelo, E.; Revah, S. Carbon dioxide fixation and lipid storage by Scenedesmus obtusiusculus. Bioresour. Technol. 2013, 130, 652–658. [Google Scholar] [CrossRef]
  63. Ho, S.H.; Chen, C.Y.; Chang, J.S. Effect of light intensity and nitrogen starvation on CO2 fixation and lipid/carbohydrate production of an indigenous microalga Scenedesmus obliquus CNW-N. Bioresour. Technol. 2012, 113, 244–252. [Google Scholar] [CrossRef] [PubMed]
  64. Yeh, K.L.; Chang, J.S. Nitrogen starvation strategies and photobioreactor design for enhancing lipid content and lipid production of a newly isolated microalga Chlorella vulgaris ESP-31: Implications for biofuels. Biotechnol. J. 2011, 6, 1358–1366. [Google Scholar] [CrossRef] [PubMed]
  65. Xin, L.; Hong-ying, H.; Jia, Y. Lipid accumulation and nutrient removal properties of a newly isolated freshwater microalga, Scenedesmus sp. LX1, growing in secondary effluent. N. Biotechnol. 2010, 27, 59–63. [Google Scholar] [CrossRef]
Figure 1. A schematic diagram of the experimental set up (adapted from Razzak 2019, accessed on 20 January 2019).
Sustainability 15 01409 g001
Figure 2. A schematic representation of the lipid detection principle in the SPV-based colorimetric assay (adapted from Razzak 2018, accessed on 24 February 2019).
Sustainability 15 01409 g002
Figure 3. Time profiles of the biomass concentration of Scenedesmus dimorphus cultivated under different levels of nitrogen-to-phosphorous (N:P) ratios (a) without CO2 supplementation (air only) and (b) with CO2 supplementation (2% CO2 in air). Data are means ± SD (n = 3).
Sustainability 15 01409 g003
Figure 4. A comparison of the maximum biomass yield of Scenedesmus dimorphus cultivated under different levels of nitrogen-to-phosphorous (N:P) ratios with (2% CO2 in air) and without (only air) CO2 supplementation. Data are means ± SD (n = 3).
Sustainability 15 01409 g004
Figure 5. Time profiles of the effect of the total nitrogen (TN) concentration on Scenedesmus dimorphus cultivated under different levels of nitrogen-to-phosphorous (N:P) ratios (a) without CO2 supplementation (air) and (b) with CO2 supplementation (2% CO2 in air). Data are means ± SD (n = 3).
Sustainability 15 01409 g005
Figure 6. Time profiles of the effect of the total phosphorous (TP) concentration on Scenedesmus dimorphus cultivated under different levels of nitrogen-to-phosphorous (N:P) ratios (a) without CO2 supplementation (air only) and (b) with CO2 supplementation (2% CO2 in air). (c) A comparison of the removal of total phosphorous (TP) under the experimental conditions of this study. Data are means ± SD (n = 3).
Sustainability 15 01409 g006
Figure 7. Different inorganic carbon species with respect to mole fractions at different media pH (adapted from Eze et al. 2018, accessed on 15 April 2019).
Sustainability 15 01409 g007
Figure 8. Time profiles of the variation of the pH of the culture media during the cultivation of Scenedesmus dimorphus under different levels of nitrogen-to-phosphorous (N:P) ratios (a) without CO2 supplementation (air only) and (b) with CO2 supplementation (2% CO2 in air). Data are means ± SD (n = 3).
Sustainability 15 01409 g008
Figure 9. A comparison of the total lipid content (%) of Scenedesmus dimorphus cultivated under different levels of nitrogen-to-phosphorous (N:P) ratios with (2% CO2 in air) and without (air only) CO2 supplementation. Data are means ± SD (n = 3).
Sustainability 15 01409 g009
Table 1. Summary of the microalgae Scenedesmus dimorphus culturing conditions.
Microalgae speciesScenedesmus dimorphus (UTEX B 746)
Culture mediumSynthetic tertiary municipal wastewater
Process typeBatch photobioreactor
Initial working volume (mL)1700 mL including 100 mL inoculum
Initial biomass concentration (mg/L)42 to 87
Gas flow rate (cc/min)1500
Light intensity (μmol photons/m2/s)50–54 (continuous)
Nitrogen to phosphorous (N:P) ratio1:1, 2:1, 4:1, 6:1 and 8:1
CO2 conc. (%) in air0.03% (air, Case 1), 2% (Case 2)
Temperature (°C)22 ± 2
pH (initial)7–7.5
Cultivation period (days)25
Table 2. Effects of different levels of nitrogen-to-phosphorous (N:P) ratios and CO2 supplementation on the growth characteristics of Scenedesmus dimorphus.
CO2 (% v/v)N:P RatioXmax (mg/L)Pmax (mg/L/d)µmax (d−1)
0.03% (air)1:1433 ± 21.620.55 ± 1.030.1714 ± 0.00857
2:1500 ± 25.021.75 ± 1.080.1698 ± 0.00849
4:1447 ± 22.424.83 ± 1.240.2586 ± 0.01293
6:1365 ± 18.318.80 ± 0.940.1792 ± 0.00896
8:1567 ± 28.437.00 ± 1.850.3642 ± 0.01821
2%1:1587 ± 29.425.90 ± 1.290.1792 ± 0.00896
2:1733 ± 36.730.83 ± 1.540.2424 ± 0.01212
4:1640 ± 32.033.33 ± 1.670.2298 ± 0.01149
6:1573 ± 28.724.43 ± 1.220.1769 ± 0.00884
8:1647 ± 32.429.17 ± 1.450.1918 ± 0.00959
Table 3. Nitrogen removal by Scenedesmus dimorphus cultivated under different levels of nitrogen-to-phosphorous (N:P) ratios and CO2 supplementation.
CO2 (% v/v)N:P RatioTN Removal (%)Nitrogen Removal Rate (mg/L/d)Residual TN (mg/L)T10(N) (d)
0.03% (air)1:11000.8280.16
2:11001.150.114
4:1591.2922.2--
6:1351.1252.4--
8:1281.2276.6--
2%1:11001.80.13
2:11001.950.19
4:1931.963.621
6:1662.127.5--
8:1602.5843.5--
Table 4. Summary of the results achieved in this study and comparison with earlier reported work.
Wastewater MediaMicroalgae SpeciesCO2
(%)
Light Irradiance (μmol m−2 s−1)Cultivation Period, Day and Temp. (°C)Max. Biomass Conc. (mg L−1)Max. Specific Growth Rate, µmax (day−1)Initial Nutrient (mg L−1)Final Nutrient (mg L−1)Lipid Content (%)References
DomesticScenedesmus sp. 0.03 (air)607 (25)4300.44TN = 41
TP = 53
TN = 15.9
TP = 9.60
23.1[15]
Tertiary treatedScenedesmus obliquus15457 (25)3100.89TN = 8.7
TP = 1.7
TN = 0.08
TP = 0.02
27[37]
Pre-treated manureScenedesmus dimorphus152387--TN = 152
TP = 115
TN = 145.9
TP = 109.8
24.2[44]
Piggery refluentScenedesmus obliquus-4020 (25)7700.28TN = 56
TP = 13.5
TN = 21.8
TP = 5.40
31[46]
Secondary treatedScenedesmus sp. -55–6015 (25)1200.12TN = 15.5
TP = 0.5
TN = 0.16
TP = 0.01
33[65]
SyntheticScenedesmus dimorphus0.03 (air)5425 (22)4330.17TN = 15
TP = 13
TN = 0.0
TP = 6.60
-This study
SyntheticScenedesmus dimorphus0.03 (air)5425 (22)5000.17TN = 27.6
TP = 13
TN = 0.0
TP = 5.6
-This study
SyntheticScenedesmus dimorphus25425 (22)5870.18TN = 14.5
TP = 13
TN = 0.0
TP = 7.3
29This study
SyntheticScenedesmus dimorphus25425 (22)7330.24TN = 27.5
TP = 13
TN = 0.0
TP = 7.8
-This study
SyntheticScenedesmus dimorphus25425 (22)6400.23TN = 52.6
TP = 13
TN = 3.7
TP = 8.2
-This study
Disclaimer/Publisher’s Note: The statements, opinions and data contained in all publications are solely those of the individual author(s) and contributor(s) and not of MDPI and/or the editor(s). MDPI and/or the editor(s) disclaim responsibility for any injury to people or property resulting from any ideas, methods, instructions or products referred to in the content.

