Article

Managing Information Sensitivity: The Relationship between the Interbank Offered Rate and the Characteristics of Bank-Issued Wealth Management Products in China

School of Finance, Southwestern University of Finance and Economics, Chengdu 611130, China
*
Author to whom correspondence should be addressed.
Sustainability 2023, 15(2), 1392; https://doi.org/10.3390/su15021392
Submission received: 12 December 2022 / Revised: 8 January 2023 / Accepted: 9 January 2023 / Published: 11 January 2023
(This article belongs to the Special Issue Corporate Finance and Business Administration in Sustainability)

Abstract

:
Unlike previous studies that focused on measures and changes in debts’ information sensitivity, this paper examines how banks in China manage the information sensitivity of wealth management products (WMPs), one of the most important assets in Chinese shadow banking. Employing the interbank offered rate to proxy investors’ incentives for private information production, we find when the interbank offered rate rises for newly issued WMPs, banks shorten their maturity, provide them with more guarantees, and reduce the risk of their underlying assets. Moreover, these effects are more pronounced in small and medium-sized banks (SMBs) relative to the largest five state-owned (Big5) banks. Furthermore, we also find that banks reduce the number of WMPs issued to institutional investors when the interbank offered rate rises, and this effect exists in both Big5 banks and SMBs. Our findings suggest that banks adjust the characteristics of WMPs to maintain WMPs’ information insensitivity when investors’ incentives to produce private information increase. These results also indicate that there is less need for Big5 banks to adjust WMPs’ characteristics since individual investors consider WMPs issued by Big5 to be safer and thus to have less incentive to produce private information. However, institutional investors understand WMPs’ risks better and, therefore, all banks reduce the number of issues to them when the interbank rate rises.

1. Introduction

An asset is considered to be information-sensitive if the benefits of producing private information about the asset’s payoff outweigh the costs; otherwise, the asset is information-insensitive. Money-like assets such as money market funds (MMFs) are designed to be information-insensitive. This is because information-insensitive assets can protect uninformed investors from adverse selection problems and hence have greater liquidity [1,2]. However, these assets may become information-sensitive when investors are increasingly suspicious of debt defaults [3] and have greater incentives to learn the value of those assets [2,4]. As a result, safety-seeking investors may be reluctant to trade, leading to a market freeze. Recent theoretical and empirical studies have demonstrated that the failure of financial institutions to maintain the information insensitivity of their assets leads to greater risks themselves, which can spill over to other institutions and even trigger financial crises [4,5,6,7]. Therefore, it is important to understand how financial institutions manage the information sensitivity of money-like assets that they have issued.
In this paper, we examine how banks in China manage the information sensitivity of their money-like assets, i.e., wealth management products (WMPs). As the most important shadow banking asset for the Chinese banking industry, WMPs gain their money-like attributes through two main channels. First, WMPs have a very short maturity. Most WMPs have a maturity within 3 months and offer investors an early exit option. Second, WMPs are perceived to be implicitly guaranteed by banks. Investors believe that banks will bear the loss of WMPs in the case of default. While these two factors may enable WMPs to be information-insensitive, they may also pose potential risks to WMPs. Regarding the maturity, the mismatch between the shorter maturity of WMPs and the longer term of their underlying investment assets can lead to rollover risks (according to the “Report on the Development of Wealth Management Business in the Chinese Banking Industry” (2018), jointly released by the China Banking Association and the Banking Wealth Management Registration and Custody Center, more than 80% of the funds raised by WMPs are invested in long-term assets). The so-called implicit guarantee is actually built on a misperception between investors and banks about the risks of WMPs (since most WMPs are not reflected on banks’ balance sheets, banks are not legally obligated to guarantee their WMPs against losses). Therefore, there is still an incentive for WMP investors to produce private information when their suspicions about the risk of WMPs increase.
Our study begins with an analysis of situations in which investors are motivated to engage in private information production. We then examine how banks manage the WMPs’ information sensitivity by adjusting the characteristics of their WMPs in these situations. WMP investors are concerned about their principals and returns. Therefore, when investors have greater suspicions about the safety and riskiness of their WMPs, their incentives to engage in private information production increase. Two situations may affect whether a WMP can be redeemed as promised. One is whether the value of the underlying asset is sufficiently high when it eventually matures. The other is whether a bank has sufficient liquidity to meet the repayment when the underlying asset has not yet matured. In this paper, we use the interbank offered rate to measure both of these scenarios. There are two reasons why interbank market rates are a good measure of this metric. First, as an efficient market interest rate in China, the interbank offered rate has a great impact on the value of WMPs’ underlying assets. An elevated interbank offered rate implies a decline in the present value of underlying assets, increasing the incentive for investors to engage in private information production [4,8]. Second, the interbank lending market serves an important role in short-term funding for banks. Previous studies have found that banks’ liquidity status, such as loan-to-deposit ratios, affects their probability of entering the interbank market [9]. Moreover, interbank business is associated with increased risks for banks, such as mismatch between assets and liabilities, and the risks can be transmitted through interbank business [10]. Previous literature has argued that the interbank offered rates reflect banks’ credit risk and liquidity risk [11,12,13,14] and banks seeking funds through the interbank market for the redemption of maturing WMPs [15,16,17]. Thus, higher interbank offered rates imply greater liquidity difficulties for banks, increasing the incentives for investors to engage in private information production.
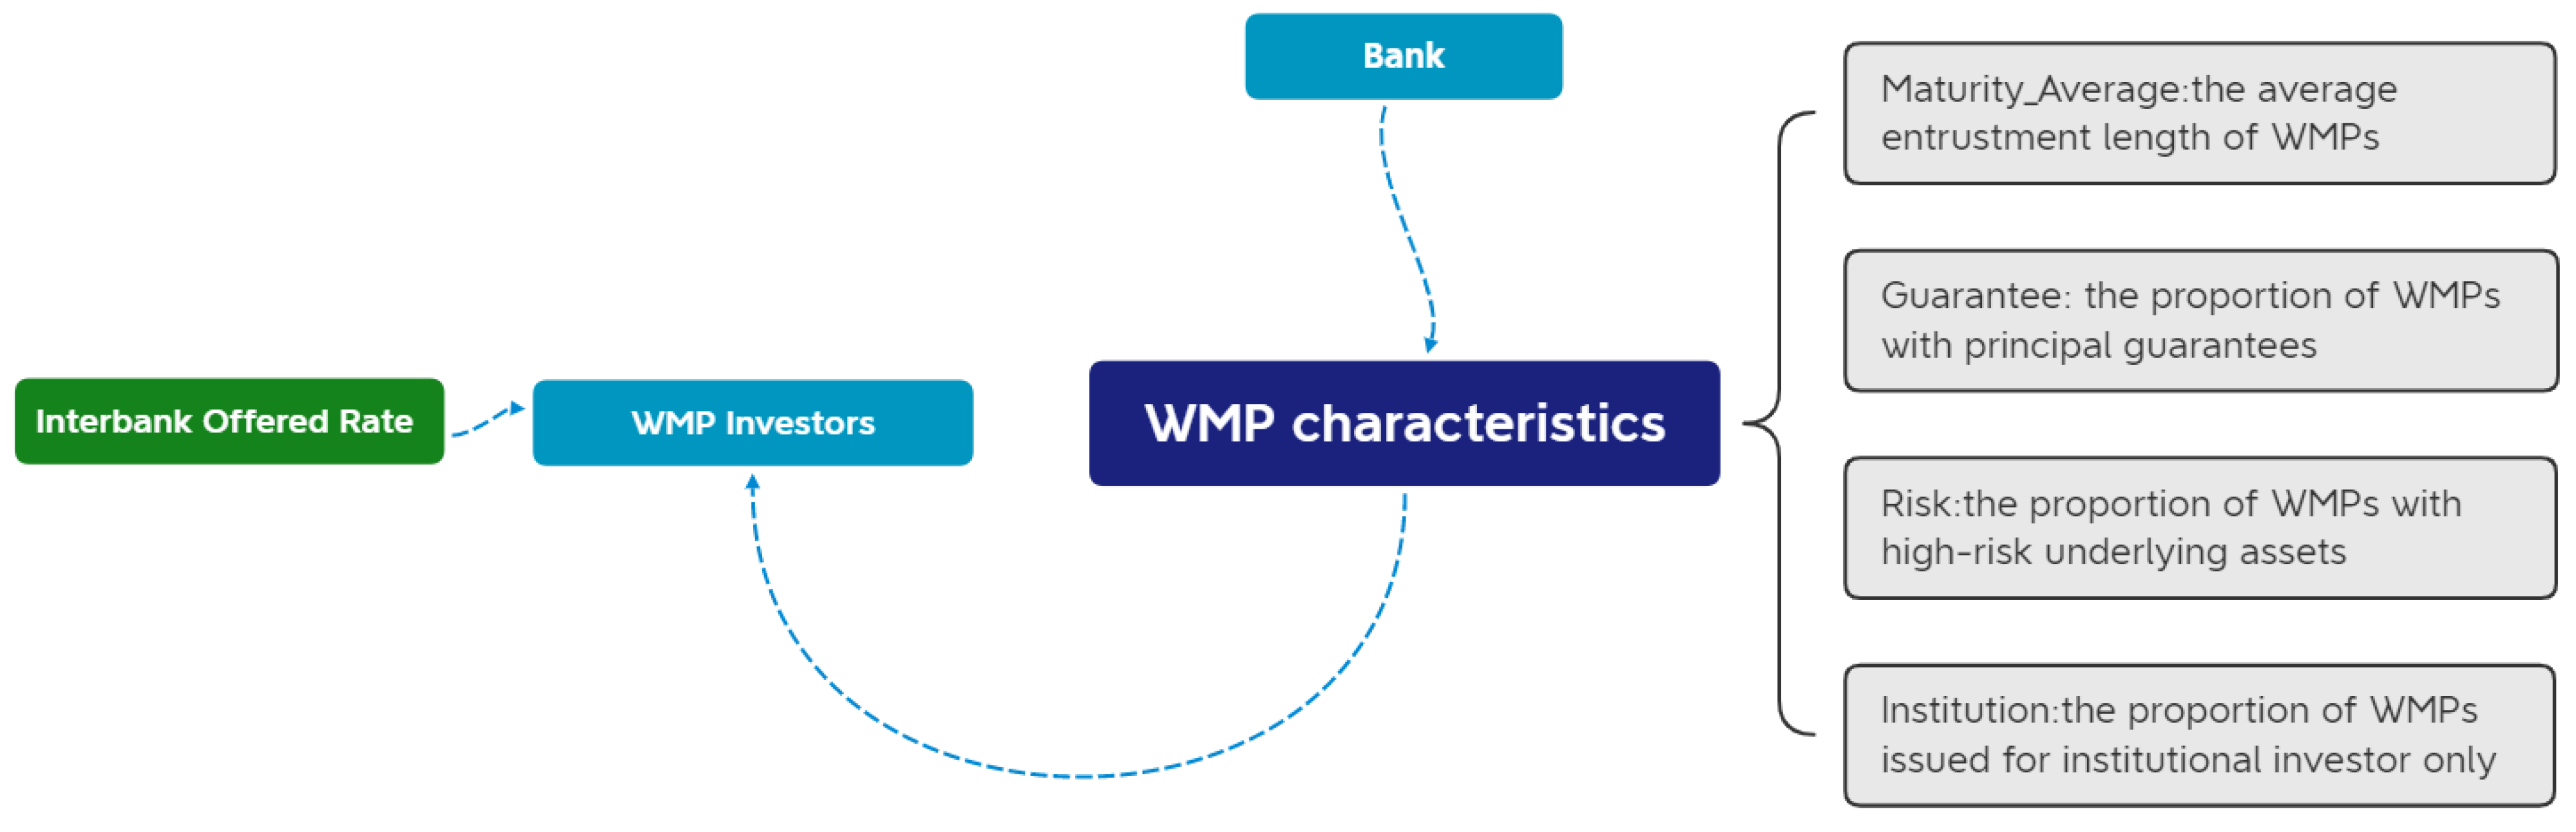
We then focus on how banks adjust the characteristics of WMPs that reduce investors’ incentives for private information production (i.e., that maintain the information insensitivity of WMPs) when the interbank offered rates increase. Four characteristics of WMPs are taken into account, namely, maturity, guarantee for the principal, underlying asset risk, and investor types. First, previous studies find that debts with a short commitment period are less prone to adverse selection problems and, hence, are less information-sensitive [1,4,18,19]. Therefore, reducing the maturity of WMPs can help reduce investors’ incentives to engage in private information production. Second, some scholars find that guarantees against future losses can reduce the need for investors to produce private information [19,20]. For WMPs investors, the principal guarantee provided by banks is essentially a guarantee against future losses and, therefore, reduces their incentives to perform private information production. Third, previous research finds that money-like assets such as MMFs with riskier underlying assets are more information-sensitive [6,21]. Thus, reducing the risk of the underlying assets helps reduce WMPs investors’ concerns about future losses and, thus, reduces their incentives to engage in private information production. Lastly, the possibility of engaging in private information production varies between different types of investors. Previous studies have found that institutional investors are more motivated to produce private information [3,6,21]. Therefore, banks can reduce the incentive for investors to engage in private information production by reducing the issuance of WMPs to institutional investors. We do not include the yield of WMP because previous literature shows that price adjustment is not an effective means of maintaining assets’ information insensitivity [4,18]. In summary, banks can manage WMPs’ information sensitivity by adjusting the above four characteristics when investors’ incentives to engage in private information production increase.
Our empirical results show that when the interbank offered rate rises, for the newly issued WMPs, banks are more likely to shorten product maturity, provide them with more guarantees, and reduce the risk of the underlying assets. We also investigate the effects of heterogeneity on banks of different sizes. Previous literature argues that investors perceive implicit guarantees by large state-owned banks to be more credible compared to those of small and medium-sized banks (SMBs) [22,23]. This implies that investors perceive WMPs issued by large state-owned banks as safer and, therefore, have less incentive to produce private information about them. Accordingly, large state-owned banks have less need to adjust the characteristics of WMPs to maintain WMPs’ information insensitivity when interbank interest rate rises. We do find that the effects of the interbank offered rate on the WMPs characteristics are more pronounced in the SMBs sample relative to the largest five state-owned banks (Big5) sample (the Big5 banks in China are the Bank of China, the Industrial and Commercial Bank of China, the Agricultural Bank of China, the China Construction Bank, and the Bank of Communications). Furthermore, we also find that banks reduced the number of WMPs issued to institutional investors when the interbank offered rate rises. This effect exists in both Big5 banks and SMBs. This result is also consistent with previous literature findings that skeptical institutional investors are more motivated to produce private information [3,6], and institutional investors are more sensitive to information production [22].
This paper contributes to the existing research in the following ways. First, since most studies on information sensitivity have mainly focused on the measurements and the variations in securities’ information sensitivity [2,5,6,24], this paper contributes to the existing literature by first empirically examining how issuers manage the information sensitivity of their debts when investors are incentivized to engage in private information production. Second, the use of short-term debts to support long-term assets exposes banks to liquidity risk [25]. Previous studies demonstrate that shadow banking activities expose banks to greater liquidity risk due to the serious maturity mismatch problem [26] and the lack of deposit insurance and capital protection [27]. This paper sheds lights on the measures banks can take to manage liquidity risk in their shadow banking activities based on the information sensitivity theory. Third, given that previous studies have linked the variations in information sensitivity to financial crises [4,5], the results of this paper have rich theoretical and practical implications for helping issuers understand and maintain financial stability. This is not just applicable to the Chinese bank WMP markets, but also has profound implications for managers of such quasi-safe assets around the world. Fourth, unlike previous literature that focuses on the pricing of WMPs [15,23,28], to the best of our knowledge, this paper is the first to reveal how banks can adjust other characteristics of the WMPs to help their issuance. Our findings can provide important insights for issuers, investors, and regulators of shadow banking products in China.
The remainder of this paper is organized as follows. Section 2 presents the background and hypotheses developments. Section 3 describes the data and methodology. Section 4 provides empirical results. Section 5 concludes.

2. WMP Industry and Hypotheses Developments

2.1. WMP Industry in China

As the largest part of China’s shadow banking system, WMPs have experienced huge growth since the first WMP was issued by China Everbright Bank (CEB) in 2004. According to Moody’s Quarterly Report Shadow Banking in China (2017), the estimated stock of outstanding WMPs is CNY 30.1 trillion at the end of 2016, representing about half of China’s total shadow banking activity and a quarter of the country’s GDP. WMPs still accounted for more than 37% (CNY 22.18 trillion) of total shadow banking assets in China in the first half of 2019, despite tightened regulatory oversight of shadow banking in recent years. The rapid growth of China’s Shadow banking has also attracted the attention of many scholars. Allen et al. [29] studied entrusted loans and found that non-financial institutions make use of their financing advantages to extend credit to those companies with financing constraints through entrusted loans. Acharya et al. [15] studied the WMPs issued by 25 Chinese banks from 2008 to 2014 and found that banks with a high loan-to-deposit ratio issue more WMPs to meet the regulatory requirements from the central bank. This is because, upon maturity of the WMPs, the principal and earnings are automatically transferred to the bank’s deposit account, which briefly raises the level of bank deposits and allows the bank to meet the regulatory targets. Similarly, some scholars have also found that competition for deposits between state-owned and non-state-owned banks appears to be an important factor driving the growth of WMPs in China [30]. Luo et al. [31] also studied bank WMPs in China but mainly focused on the maturity mismatch problem and found that the degree of WMPs’ maturity mismatch is positively correlated with banks’ non-performing loan ratio at the end of the quarter. In other words, to meet the regulatory needs of the non-performing loan ratio, banks acquire money by issuing WMPs. In general, the studies above have mainly analyzed China’s shadow banking system from the perspective of regulatory arbitrage.
Some other scholars, starting from information sensitivity theory, have considered the misperception about WMP s’ risks between investors and banks as a key factor driving WMPs’ rapid growth [22]. Investors believe that banks provide guarantees for their WMPs and, hence, perceive WMPs as safe deposit-like investment products. Furthermore, WMPs have more attractive interest rates than bank deposits. However, unlike bank deposits, WMPs without principal guarantees are not reflected on banks’ balance sheets, and banks are not legally obligated to guarantee their WMPs against losses.
The existence of this misperception makes WMPs investors less motivated to produce private information (i.e., WMPs become information-insensitive) and, thus, willing to keep buying new WMPs. In practice, banks exploit this misperception to maintain the constant issuance of their WMPs, especially before the guidance on regulating the asset management business of financial institutions was issued in 2018 (when most banks used capital pools to manage the funds raised by their WMPs). In addition, some banks’ practices in recent years have maintained this misperception of investors. The most famous is the default event of the “Cheng Zhi Jin Kai No.1” product issued by the Industrial and Commercial Bank of China (ICBC) in 2014. This product of up to CNY 3 billion will face a payment crisis due to the fact that the actual controller of the financing party is suspected of breaking the law. However, under the coordination of regulators and all parties, the products finally achieve capital protection and interest, and the annual yield is still as high as 7%.

2.2. Hypotheses Developments

A rise in interbank offered rates may increase the incentive for WMPs investors to engage in private information production and for WMPs to become information-sensitive at this time. This situation is undesirable for banks, as the maturity mismatch problem forces them to pay attention to the rollover of WMPs. However, a bank run may occur if information insensitivity cannot be maintained because no one wants the debt for fear of adverse selection problems in that case [4]. As a result, funds for short-term debt that was secured by low-risk credit collateral may no longer be able to be obtained from the market.
Previous studies have found that a short commitment period is less exposed to adverse selection problems and, hence, makes short-term debts less information-sensitive [1,4,18,19]. Hanson et al. [26] argue that, unlike traditional commercial banks that rely on deposit insurance and equity capital to create money-like assets, shadow banks create money-like assets by offering investors short investment maturities. The underlying logic is that shorter maturities ensure that investors can withdraw in time in case of losses in the future [32,33], thus reducing their incentive to produce information. This theory has a rich manifestation in practice: many researchers have found that the maturity of financial instruments underwent a significant reduction in the financial crisis [32,34,35].
If banks wish to maintain the WMPs’ information insensitivity to ensure their issuance, the first available method is shortening the maturity of the WMPs. Hence, we state the first hypothesis:
H1. 
When the interbank offered rate rises, the maturity of the newly issued WMPs shortens.
Similarly, another way to reduce investors’ fear of future losses, and thus their willingness to produce private information, is to provide them with guarantees. Previous literature has found that protecting against future losses can reduce the need for investors to produce private information [19,20]. In contrast to investors’ misperception that banks provide an implicit guarantee on their WMPs (yet in reality banks are not legally obligated to a bailout), a guarantee of principal is an explicit guarantee for WMPs. For the WMPs with principal guarantees, there is no incentive for investors to engage in private information production as the future losses will be fully borne by the bank. If banks wish to maintain the WMPs’ information insensitivity, they may provide more WMPs with guarantees. Hence, we propose the following hypothesis:
H2. 
When the interbank offered rate rises, the proportion of newly issued WMPs with principal guarantees rises.
Previous studies have found that MMFs with riskier underlying assets are more information-sensitive [6,21]. Similar to MMFs, WMPs are also a kind of short-term debt backed by the underlying assets. The riskiness of the underlying asset determines the size of the WMP investor’s incentive to engage in private information production. If banks wish to maintain the WMPs’ information insensitivity, they can reduce the risk of the underlying assets in which the newly issued WMPs are invested. Hence, we state the third hypothesis in this paper:
H3. 
When the interbank offered rate rises, the proportion of newly issued WMPs with high-risk underlying assets falls.
Compared to individual investors, institutional investors have a better understanding of the risk of WMPs, and thus have a greater incentive to engage in private information production. Previous literature on information sensitivity has found that skeptical institutional investors are more motivated to produce private information [6] and changes in the information sensitivity of short-term debt are more concentrated in money market funds issued to institutional investors [3]. Furthermore, Dang et al. [22] also argue that WMP markets rely on institutional investors in determining the WMPs’ information sensitivity.
If banks wish to maintain the WMPs’ information insensitivity to ensure their issuance, they can reduce the number of WMPs issued to institutional investors. Hence, we state the fourth hypothesis in this paper:
H4. 
When the interbank offered rate rises, the proportion of newly issued WMPs issued to institutional investors only falls.
Furthermore, previous studies on WMPs have found that large state-owned banks are some of the few entities in China that can provide credible guarantees [22] and are perceived as safer by investors [23]. This implies that investors perceive WMPs issued by large state-owned banks as safer and, therefore, as having less incentive to produce private information about them. Hence, compared to SMBs, large state-owned banks have less need to adjust the characteristics of WMPs to maintain WMPs’ information insensitivity when interbank interest rate rises. We state the fifth hypothesis in this paper:
H5. 
The effect of the interbank offered rate on the WMP characteristics is more pronounced in the sample of SMBs.
As we analyzed in Hypothesis H4, institutional investors are more aware of the fact that the so-called implicit guarantee from the bank is just a misunderstanding of the WMPs’ risk [22]. Therefore, there is no difference in the risk level of WMPs issued by either large or small banks for institutional investors. Hence, for both large and small banks, if they wish to maintain the information insensitivity of their WMPs, they should reduce the number of WMPs issued to institutional investors. We thus state the sixth hypothesis in this paper as follows:
H6. 
The effect of the interbank offered rate on the investor types of WMPs is pronounced in both the Big5 and SMB samples.
The framework for the analysis in this paper is shown in Figure 1.

3. Data and Methodology

3.1. Data

Our data on WMPs were obtained from the WIND database, a leading and widely used financial data provider in China. We cover all WMPs issued by banks in China from 2008 to 2018 since the rapid growth of WMPs started after the CNY 4 trillion stimulus plan implemented by the Chinese government after the 2008 financial crisis. Furthermore, we also obtained data on bank characteristics and the interbank offered rate from the WIND database. Considering that the issuance period of a WMP usually lasts from a few days to tens of days, it was not appropriate to merely consider the interbank offered rate on the day before the issuance. Thus, in this paper, we chose and calculated the monthly data. Overall, we obtained 16,410 monthly data points for 365 banks (the sample size varies slightly depending on the dependent variables). Our data cover a longer study period and a larger sample size compared to previous studies. For example, Acharya et al. [15] cover all WMPs issued by the 25 banks in China from 2008 to 2014, while Luo et al. [31] focus on WMPs issued by 16 listed banks from 2009 to 2016. Furthermore, to avoid the interference of extreme values, we winsorize the data by top and bottom 1%.

3.2. Methodology

We construct four indicators to measure the characteristics of WMPs issued by bank i in month t: the average entrustment length of WMPs (Maturity_Averagei,t), the proportion of WMPs with principal guarantees (Guaranteei,t), the proportion of WMPs with high-risk underlying assets (Riski,t), and the proportion of WMPs issued for institutional investors only (Institutioni,t). According to the Annual Report of China Banking Wealth Management Product (2018), the biggest proportion of funds raised by WMPs are invested in bonds, which is around 53.35%. Nonstandard debt assets account for 17.23%, and this is followed by equity assets and mutual funds investment, with 9.92% and 3.43% invested, respectively. Only 6.59% and 5.75% is invested in the interbank market and cash and bank deposits, respectively. The remaining 13.5% is invested in other assets such as financial derivatives and commodity assets. Here, we define WMPs that invest in equity assets, commodities, or financial derivatives as having higher risks. The issuance targets of WMPs include individual investors, institutional investors, and a mix of individual and institutional investors.
For the interbank offered rate, we choose the Shanghai Interbank Offered Rate (SHIBOR). Specifically, we calculated the monthly average of the SHIBOR (overnight) rate and match them with the WMP data. We also used the SHIBOR (1-week) rate for the robustness checks.
In addition, we also introduce some control variables given the existence of other factors that affect banks’ issuance of WMPs. Acharya et al. [15] found that banks compete for deposits by issuing WMPs. We calculated the Herfindahl–Hirschman index (HHIt) based on the number of WMPs issued by all banks each month t, as a reflection of the intensity of competition in the WMPs markets. We also calculated the natural logarithm of banks’ assets (LnAssetsi,t) as a control variable since previous studies found that firm assets can influence the issuance of firms’ debts [36]. Furthermore, Acharya et al. [15] found that refinancing pressure on WMPs due to maturity mismatch problems affects the issuance cost of WMPs. We introduce the proportion of all unexpired WMPs issued by bank i that matured in month t (WMPduei,t) as a control variable to capture the refinancing pressure faced by banks. In addition, we introduce the average maturity of all unexpired WMPs of bank i in month t (Maturity_Existingi,t) as a control variable since the maturity structure of existing debts can affect the maturity of debts newly issued by firms [37].
We estimate the effect of the interbank offered rate on the characteristics of WMPs by using the following model:
W M P _ C h a r a c t e r i s t i c i , t = α + β S H I B O R t 1 + γ i C o n t r o l s t 1 + F i x e d   E f f e c t s + ε i , t      
where i and t represent a bank and the month, respectively. We control for both bank fixed effects and time fixed effects.

4. Empirical Results

4.1. Descriptive Statistics

Table 1 presents the summary statistics. For the four types of WMP characteristics, the average value of Maturity_Average is 129.373 days; the average value of Guarantee is 44%; the average value of Risk is 8.1%; and the average value of Institution is 7%. Regarding the explanatory variable, the mean value of SHIBOR is 2.464%.
Table 2 gives the Pearson correlation results. The results show that there is no serious linear correlation between the variables in the regression model.

4.2. Interbank Offered Rate and the Maturity of WMPs Newly Issued by Banks

We first focus on changes in the maturity of WMPs newly issued by banks when the interbank offered rate rises. The results are reported in Table 3. The first two columns show the regression results for the overall sample, where no fixed effects are controlled in column (1) and bank and time fixed effects are added in column (2). The results of these two columns maintain good consistency. We find that the regression coefficient of SHIBOR in column 2 is negative (−2.8180) and significant at the 1% level. This result supports our hypothesis H1 that banks have shortened the maturity of the newly issued WMPs when the interbank offered rate rises. This finding implies that since shorter maturities guarantee the possibility of a future early exit for investors, thus reducing their incentive to engage in private information production, banks manage WMP’s information sensitivity by shortening the maturity of newly issued WMPs. This result is also economically significant. For each standard deviation increase in SHIBOR, the average maturity of newly issued WMPs decreases by 1.78 (0.63 × 2.8180) days or 1.4% of the average maturity of WMPs (1.78 ÷ 129.379).
The findings regarding the control variables in column (2) are also intuitive. The more competitive the market is (the smaller the HHI), the shorter the average maturity of newly issued WMPs. The positive coefficient of Maturity_Existing indicates that the maturity structure of newly issued WMPs is consistent with the maturity structure of existing WMPs. WMPs issued by large banks have longer maturities since large banks are typically perceived as safer institutions. The greater the refinancing pressure on banks (the larger the WMPdue), the shorter the average maturity of newly issued WMPs.
We then divided the sample into two groups, the largest five state-owned banks (Big5) and the small and medium-sized banks (SMBs). Columns 3 and 4 of Table 3 report the regression results. As can be seen, the significant effect of SHIBOR on Maturity_Average only existed in the sample of SMBs. This result supports hypothesis H5 that large state-owned banks have less need to maintain the information insensitivity of their WMPs by adjusting the WMPs’ characteristics than the small and medium-sized banks. This is because investors perceive that WMPs issued by large state-owned banks are safer and have no incentive to engage in private information production.
We also introduced another variable, Maturity_Percenti,t, to measure WMPs’ maturity, which represents the proportion of WMPs with maturities over 90 days (the median value of the WMPs’ maturity in our sample is close to 90 days) issued by bank i in month t. We rerun the regression and find a quite similar result in column 2 of Table 4: the regression coefficient of SHIBOR is negative (−0.0205) and significant at the 1% level, which supports hypothesis H1 that banks issue more WMPs with short maturities to reduce investors’ incentives to engage in private information production and, thus, maintain the information insensitivity of their WMPs when interbank interest rates increase. Correspondingly, the results of the heterogeneity analysis are similar: the significant effect of SHIBOR on Maturity_Percent is more pronounced in the sample of SMBs. This result also supports hypothesis H5 that there is less need for large state-owned banks to adjust WMPs’ characteristics since investors perceive that the WMPs issued by them are safer compared to the small and medium-sized banks.

4.3. Interbank Offered Rate and the Proportion of WMPs with Principal Guarantee Newly Issued by Banks

We then investigated the changes in the proportion of WMPs with principal guarantees newly issued by banks when the interbank offered rate rises. The results are shown in Table 5. The first two columns show the regression results for the overall sample, where no fixed effects are controlled in column (1) and bank and time fixed effects are added in column (2). The results of these two columns maintain good consistency. We can find that the regression coefficient of SHIBOR in column 2 of Table 5 is positive (0.0076) and significant at the 1% level. This result supports our hypothesis, H2, that banks provided more guarantees for the newly issued WMPs when the interbank offered rate rose. This result is consistent with the idea that banks maintain the information insensitivity of their WMPs by providing explicit guarantees for WMP, which can reduce the need for investors to engage in private information production. This result is also economically significant. For each standard deviation increase in SHIBOR, the proportion of WMPs with principal guarantee increases by 0.48% (0.63 × 0.00763), or 1.09%(0.48% ÷ 44%) of the mean value.
As for the control variables in column (2), the coefficient of HHI is not significant. A negative coefficient on LnAssets indicates that large banks are issuing more WMPs without principal guarantees. A positive coefficient on WMPdue indicates that banks that are under greater refinancing pressure have provided more guarantees for newly issued WMPs.
The heterogeneity analysis results in column 3 and 4 of Table 5 also indicate that the significant effect of SHIBOR on Guarantee only existed in the sample of SMBs. This result is consistent with the fact that large state-owned banks have less need to manage their information sensitivity by adjusting their WMPs’ characteristics (providing more principal guarantees) since investors perceive WMPs issued by large state-owned banks to be safer, thus supporting hypothesis H5.

4.4. Interbank Offered Rate and the Proportion of WMPs with High-Risk Underlying Assets Newly Issued by Banks

In this section, we examine the changes in the proportion of WMPs with high-risk underlying assets newly issued by banks when the interbank offered rate rises. In this paper, we define WMPs that invest in stocks, commodities, or currencies as having higher risks. Table 6 presents the results. The first two columns show the regression results for the overall sample, where no fixed effects are controlled in column (1) and bank and time fixed effects are added in column (2). The results of these two columns maintain good consistency. We can find that the regression coefficient of SHIBOR in column 2 is negative (−0.0057) and significant at the 5% level. This result supports our hypothesis H3 that banks reduced the risk of the underlying assets for the newly issued WMPs when the interbank offered rate rises. This is because the riskiness of the underlying assets determines the size of the incentive for investors in WMPs to engage in private information production. The less risky the underlying assets, the less incentive for investors to engage in private information production. This result is also economically significant. For each standard deviation increase in SHIBOR, the proportion of WMPs with high-risk underlying assets decreases by 0.36% (0.63 × 0.00571), or 4.04%(0.36% ÷ 8.9%) of the mean value.
As for the control variables in column 2, the coefficient of HHI is not significant. A positive coefficient on LnAssets indicates that large banks are issuing more WMPs that invest in the underlying assets with high risk. A negative coefficient on WMPdue indicates that banks that are under greater refinancing pressure have reduced the risk of the underlying assets for the newly issued WMP.
The heterogeneity analysis results in columns 3 and 4 of Table 6 also indicate that the significant effect of SHIBOR on Risk only existed in the sample of SMBs. This result supports hypothesis H5 that as investors perceive WMPs issued by Big5 banks as safer, there is less need for Big5 banks to adjust the characteristics of WMPs (reduce the risk of the underlying assets) for maintaining the WMP’s information insensitivity.

4.5. Interbank Offered Rate and the Proportion of WMPs Only Issued to Institutional Investors Newly Issued by Banks

Considering that the previous literature found that institutional investors are more likely to engage in private information production compared to individual investors, we focus on the changes in the proportion of WMPs newly issued by banks to institutional investors when the interbank offered rate rises. As we can see from Table 7, the first two columns show the regression results for the overall sample, where no fixed effects are controlled in column (1) and the bank and time fixed effects are added in column (2). The results of these two columns maintain good consistency. The regression coefficient of SHIBOR in column 2 is negative (−0.0069) and significant at the 1% level. This result supports our hypothesis H4 that banks reduced the number of WMPs issued only to institutional investors when the interbank offered rate rises. This finding implies that since institutional investors are more aware of the risks of WMPs and thus have greater incentives to engage in private information production relative to individual investors, banks reduce the number of WMPs issued to institutional investors to maintain the information the insensitivity of WMPs. This result is also economically significant. For each standard deviation increase in SHIBOR, the proportion of WMPs issued for institutional investors only decreases by 0.43% (0.63 × 0.00685), or 6.14% (0.43% ÷ 7%) of the mean value.
As for the control variables in column (2), the coefficient of LnAssets is no longer significant. This result is also intuitive because institutional investors are more aware than individual investors that the WMPs offered by both large and small banks are indeed risky. The more competitive the market (the smaller the HHI) is, the fewer WMPs are issued to institutional investors. A negative coefficient on WMPdue indicates that banks that are under greater refinancing pressure have reduced the number of WMPs issued only to institutional investors.
The results of the heterogeneity analysis are presented in columns 3 and 4. We can see that the coefficient of SHIBOR is significant in both SMB samples and Big5 samples. This result supports our hypothesis, H6, that, unlike individual investors, who perceive WMPs issued by large state-owned banks to be safer relative to those issued by small and medium-sized banks, institutional investors are more aware of the risks of WMPs. Hence, both Big5 banks and SMBs need to adjust the proportion of WMPs only issued to institutional investors newly issued by banks when the interbank offered rate rises.

4.6. Event Study

In this section, we try to figure out how banks adjust the characteristics of their WMPs when the interbank offered rate suddenly rises. We use the money shortage in China’s interbank market in 2013 as an exogenous shock for the event study. Starting on June 6, 2013, the overnight SHIBOR rate soared 495.8 basis points in three days due to rumors that a commercial bank was about to default on its interbank lending. As of June 20, the SHIBOR overnight rate surged 578.4 basis points to 13.44%. There is no evidence that changes in the WMP markets have led to a spike in the overnight SHIBOR rate. We introduce a dummy variable Shock, which equals one for the WMPs that are issued in June 2013 and zero otherwise. We add an interaction term between Shock and SHIBOR to the model.
Table 8 shows the regression results. We find that the coefficients of the interaction term are significant in only two characteristics, i.e., maturity and investor type. These results imply that banks rely more on adjusting maturity and investor type to manage the information sensitivity of WMP when interbank offered rates suddenly increase. These results are consistent with the findings in the previous research that the maturity of financial instruments underwent a significant reduction in the financial crisis [32,34,35] and changes in the information sensitivity of short-term debt are more concentrated in money market funds issued to institutional investors [3].

4.7. Robustness Check

We still need to consider the possibility that our results can be biased due to endogeneity concerns such as reverse causality, omitted variables, and measurement errors. First, the reverse causality problem is less likely to occur in this paper. This is because the characteristics of WMPs from a single bank are unlikely to affect the overall market rate (SHIBOR). Nevertheless, we use the lagged term of SHIBOR. Second, out of concern for omitted variables, we control for the bank and time fixed effects in the paper. Finally, we replace the SHIBOR (Overnight) with SHIBOR (1-week) and re-run the main regressions. The results, shown in Table 9, remain unchanged.
Furthermore, since the adjustment is unlikely to be instantaneous, we also use the dynamic panel data model by including the lagged dependent variable as the control variable and re-run the regressions. The results shown in Table 10 remain robust.
Last, considering that the null hypotheses are more likely to be rejected as the sample size increases [38], we re-examine the difference in the effect of SHIBOR on the characteristics of WMPs by using a dummy variable approach. We can see that the heterogeneity analysis results remain stable in Table 11.

5. Conclusions

Blocking private information production by issuing information-insensitive assets has been a common practice in money markets. However, changes in the information sensitivity of these assets, such as turning from information-insensitive to information-sensitive, will bring risks to financial institutions and even trigger financial crises. In this paper, we examined how banks manage the information sensitivity of their WMPs by using the WMP data in China. We found that banks manage their WMPs’ information sensitivity by adjusting the structure of four WMP characteristics—maturity, guarantee of the principal, underlying asset risk, and investor types—when investors are motivated to produce private information. By using the interbank offered rate to indicate investors’ incentives for private information production, we found that when the interbank offered rate rises, for the newly issued WMPs, banks have shortened their maturity, provided them with more guarantees, and reduced the risk of the underlying assets they invest in. Moreover, these effects are more pronounced in small and medium-sized banks (SMBs) relative to the five largest state-owned (Big5) banks. Furthermore, we also found that banks reduced the number of WMPs issued to institutional investors when the interbank offered rate rose and this effect existed in both Big5 banks and SMBs.
The findings in this paper imply that banks reduced investors’ incentives to engage in private information production by adjusting the characteristics of newly issued WMPs. Specifically, shorter maturities ensure that investors withdraw in time in case of losses in the future, and providing principal guarantees and reducing the risk of the underlying assets reduces investors’ concerns about future losses. Moreover, as institutional investors are more motivated and capable to engage in private information production, banks reduce the number of WMPs issued to them. In addition, the results of the heterogeneity analysis indicate that since institutional investors are more aware of the WMPs’ risks, all banks have reduced the number of WMPs issued to them.
The findings also provide informative implications for regulators, banks, and WMP investors. First, banks maintain the information insensitivity of WMPs by reducing the maturity of new issues, which will in turn further exacerbate the maturity mismatch problem of WMPs and may increase banks’ liquidity risk [25,26]. Second, by providing a principal guarantee for WMPs, banks bear the losses in the event of default of WMPs, thus increasing the risk of the bank itself. In addition, the creditworthiness of small and medium-sized banks is low compared to large banks [15,22,23]. Therefore, providing guarantees may not be a viable option for small and medium-sized banks. Third, banks can reduce the underlying asset risk by investing in safer assets, which will also lead to lower returns. However, lower returns offered by newly issued WMPs are not competitive with other investment opportunities [22]. Therefore, investors may choose securities other than WMPs, leading to difficulties for banks to refinance. Fourth, the result also indicates that institutional investors are more sophisticated and better understand the effect of the interbank offered rate change on the WMP markets.
Moreover, the results of this paper have profound implications for managers of quasi-safe assets around the world. Since previous studies suggest that financial crises are closely related to variations in the information sensitivity of such quasi-safe financial assets, it is helpful to understand how to manage the information sensitivity of these assets.
Finally, future research may focus on the impact of regulatory policy or public events on the WMP’s information sensitivity and figure out how banks will respond to these shocks. Such as the implementation of new regulations on asset management in China or the COVID-19 shock.

Author Contributions

Conceptualization, G.B. and C.C.; methodology, C.C.; investigation, G.B. and C.C.; writing—Original draft preparation, C.C.; writing—Review, G.B and C.C. All authors have read and agreed to the published version of the manuscript.

Funding

This research received no external funding.

Institutional Review Board Statement

Not applicable.

Informed Consent Statement

Not applicable.

Data Availability Statement

The data presented in this study are available on request from the corresponding author.

Conflicts of Interest

The authors declare no conflict of interest.

References

  1. Gorton, G.; Pennacchi, G. Financial Intermediaries and Liquidity Creation. J. Financ. 1990, 45, 49–71. [Google Scholar] [CrossRef]
  2. Dang, T.V.; Gorton, G.; Holmström, B. The Information Sensitivity of a Security. 2013; unpublished work. [Google Scholar]
  3. Baghai, R.P.; Giannetti, M.; Jäger, I. Liability Structure and Risk-Taking: Evidence from the Money Market Fund Industry. J. Finan. Quant. Anal. 2021, 57, 1771–1804. [Google Scholar] [CrossRef]
  4. Dang, T.V.; Gorton, G.; Holmström, B. The Information View of Financial Crises. Annu. Rev. Financ. Econ. 2020, 12, 39–65. [Google Scholar] [CrossRef]
  5. Brancati, E.; Macchiavelli, M. The information sensitivity of debt in good and bad times. J. Financial. Econ. 2019, 133, 99–112. [Google Scholar] [CrossRef]
  6. Gallagher, E.A.; Schmidt, L.D.W.; Timmermann, A.; Wermers, R. Investor Information Acquisition and Money Market Fund Risk Rebalancing during the 2011–2012 Eurozone Crisis. Rev. Financ. Stud. 2020, 33, 1445–1483. [Google Scholar] [CrossRef]
  7. Gorton, G.; Ordoñez, G. Collateral Crises. Amer. Econ. Rev. 2014, 104, 343–378. [Google Scholar] [CrossRef]
  8. Dang, T.V.; Gorton, G.; Holmström, B. Ignorance, Debt and Financial Crises. 2012; unpublished work. [Google Scholar]
  9. Petropoulos, A.; Siakoulis, V.; Lazaris, P.; Chatzis, S. Re-constructing the interbank links using machine learning techniques. An application to the Greek interbank market. Intell. Syst. Appl. 2021, 12, 200055. [Google Scholar] [CrossRef]
  10. Zhang, A.; Wang, S.; Liu, B.; Fu, J. How government regulation of interbank financing impacts risk for Chinese commercial banks. J. Asian Econ. 2020, 66, 101148. [Google Scholar] [CrossRef]
  11. Dubecq, S.; Monfort, A.; Renne, J.-P.; Roussellet, G. Credit and liquidity in interbank rates: A quadratic approach. J. Bank. Financ. 2016, 68, 29–46. [Google Scholar] [CrossRef] [Green Version]
  12. Schwarz, K. Mind the Gap: Disentangling Credit and Liquidity in Risk Spreads. Rev. Financ. 2019, 23, 557–597. [Google Scholar] [CrossRef]
  13. Filipović, D.; Trolle, A.B. The term structure of interbank risk. J. Financ. Econ. 2013, 109, 707–733. [Google Scholar] [CrossRef] [Green Version]
  14. Michaud, F.-L.; Upper, C. What drives interbank rates? Evidence from the Libor panel. BIS Q. Rev. 2008. Available online: https://www.bis.org/publ/qtrpdf/r_qt0803f.htm (accessed on 11 December 2022).
  15. Acharya, V.V.; Qian, J.; Su, Y.; Yang, Z. In the Shadow of Banks: Wealth Management Products and Issuing Banks’ Risk in China. 2021; unpublished work. [Google Scholar]
  16. Hachem, K.C.; Song, Z.M. Liquidity Regulation and Unintended Financial Transformation in China. 2016; unpublished work. [Google Scholar]
  17. Liao, P. Interaction between non-standard debt and wealth management products in China. J. Appl. Financ. Bank. 2020, 10, 149–166. [Google Scholar]
  18. PÉRignon, C.; Thesmar, D.; Vuillemey, G. Wholesale Funding Dry-Ups. J. Financ. 2018, 73, 575–617. [Google Scholar] [CrossRef] [Green Version]
  19. Holmstrom, B. Understanding the Role of Debt in the Financial System. 2015; unpublished work. [Google Scholar]
  20. Duygan-Bump, B.; Parkinson, P.; Rosengren, E.; Suarez, G.A.; Willen, P. How Effective Were the Federal Reserve Emergency Liquidity Facilities? Evidence from the Asset-Backed Commercial Paper Money Market Mutual Fund Liquidity Facility. J. Financ. 2013, 68, 715–737. [Google Scholar] [CrossRef]
  21. Cipriani, M.; La Spada, G. Investors’ appetite for money-like assets: The MMF industry after the 2014 regulatory reform. J. Financ. Econ. 2021, 140, 250–269. [Google Scholar] [CrossRef]
  22. Dang, T.V.; Wang, H.; Yao, A. Chinese Shadow Banking: Bank-Centric Misperceptions. 2014; unpublished work. [Google Scholar]
  23. Huang, J.; Huang, Z.; Shao, X. The Risk of Implicit Guarantees: Evidence from Shadow Banks in China. 2019; unpublished work. [Google Scholar] [CrossRef]
  24. Dang, T.V.; Li, W.; Wang, Y. The Empirical Information Sensitivity of Treasury Bonds and Stocks. 2021; unpublished work. [Google Scholar]
  25. Diamond, D.W.; Dybvig, P.H. Bank runs, deposit insurance, and liquidity. J. Polit. Econ. 1983, 91, 401–419. [Google Scholar] [CrossRef]
  26. Hanson, S.G.; Shleifer, A.; Stein, J.C.; Vishny, R.W. Banks as patient fixed-income investors. J. Financ. Econ. 2015, 117, 449–469. [Google Scholar] [CrossRef] [Green Version]
  27. Liu, Z.; Xie, C. Liquidity, capital requirements, and shadow banking. Int. Rev. Econ. Financ. 2021, 76, 1379–1388. [Google Scholar] [CrossRef]
  28. Allen, F.; Gu, X.; Qian, J.; Qian, Y. Implicit Guarantee and Shadow Banking: The Case of Trust Products. 2017; unpublished work. [Google Scholar]
  29. Allen, F.; Qian, Y.; Tu, G.; Yu, F. Entrusted loans: A close look at China’s shadow banking system. J. Financ. Econ. 2019, 133, 18–41. [Google Scholar] [CrossRef]
  30. Wang, Z.; Zhao, H.; Li, L. The positive side of bank wealth management products: Evidence from bank lending rate. J. Financ. Stab. 2022, 58, 100950. [Google Scholar] [CrossRef]
  31. Luo, R.; Fang, H.; Liu, J.; Zhao, S. Maturity mismatch and incentives: Evidence from bank issued wealth management products in China. J. Bank. Financ. 2019, 107, 105615. [Google Scholar] [CrossRef]
  32. Gorton, G.; Metrick, A.; Xie, L. The flight from maturity. J. Financ. Intermed. 2020, 47, 100872. [Google Scholar] [CrossRef]
  33. He, Z.; Xiong, W. Rollover risk and credit risk. J. Financ. 2012, 67, 391–430. [Google Scholar] [CrossRef] [Green Version]
  34. Covitz, D.; Liang, N.; Suarez, G.A. The Evolution of a Financial Crisis: Collapse of the Asset-Backed Commercial Paper Market. J. Financ. 2013, 68, 815–848. [Google Scholar] [CrossRef]
  35. Krishnamurthy, A.; Nagel, S.; Orlov, D. Sizing up repo. J. Financ. 2014, 69, 2381–2417. [Google Scholar] [CrossRef]
  36. Barclay, M.J.; Smith, C.W., Jr. The maturity structure of corporate debt. J. Financ. 1995, 50, 609–631. [Google Scholar] [CrossRef]
  37. Choi, J.; Hackbarth, D.; Zechner, J. Corporate debt maturity profiles. J. Financ. Econ. 2018, 130, 484–502. [Google Scholar] [CrossRef]
  38. Lin, M.; Lucas, H.C., Jr.; Shmueli, G. Research Commentary—Too Big to Fail: Large Samples and the p-Value Problem. Inf. Syst. Res. 2013, 24, 906–917. [Google Scholar] [CrossRef]
Figure 1. Analytical Framework.
Sustainability 15 01392 g001
Table 1. Summarized Statistics. This table shows the summarized statistics. Maturity_Average represents the average maturity (in days) of all WMPs issued by bank i in month t. Maturity_Percent represents the proportion of WMPs with maturities over 90 days issued by bank i in month t. Guarantee represents the proportion of WMPs with principal guarantee issued by bank i in month t. Risk represents the proportion of WMPs with high-risk underlying assets issued by bank i in month t. Institution represents the proportion of WMPs issued only to institutional investors issued by bank i in month t. SHIBOR is the monthly average of the Shanghai interbank offered rate (overnight rate). HHI represents the monthly concentration degree of the whole bank WMPs markets, which measures the intensity of competition in the WMPs markets. Maturity_Existing is the average maturity (in days) of all unexpired WMPs of bank i in month t. LnAssets is the natural log of a bank’s total assets. WMPdue is the proportion of all WMPs issued by bank i that matured in month t.
nMeanStd. DevMinp25Medianp75Max
Maturity_Average16,410129.37956.1542.00093.250123.222157.298311.667
Guarantee16,5850.4400.3760.0000.0670.3750.8001.000
Risk11,4270.0890.2640.0000.0000.0000.0001.000
Institution16,5850.0700.1750.0000.0000.0000.0001.000
SHIBOR16,4102.4640.6300.8042.1352.4892.7284.360
HHI16,4100.0300.0190.0140.0190.0230.0350.118
MaturityExisting16,410123.44743.1012.00099.100120.888142.300261.968
LnAssets16,41016.2051.71413.16214.95415.90917.01421.243
WMPdue16,4100.1830.0950.0090.12500.1670.2170.500
Table 2. Pearson correlation results. This table shows Pearson correlation results. Maturity_Average represents the average maturity (in days) of all WMPs issued by bank i in month t. Maturity_Percent represents the proportion of WMPs with maturities over 90 days issued by bank i in month t. Guarantee represents the proportion of WMPs with principal guarantee issued by bank i in month t. Risk represents the proportion of WMPs with high-risk underlying assets issued by bank i in month t. Institution represents the proportion of WMPs issued only to institutional investors issued by bank i in month t. SHIBOR is the monthly average of the Shanghai interbank offered rate (overnight rate). HHI represents the monthly concentration degree of the whole bank WMPs markets, which measures the intensity of competition in the WMPs markets. Maturity_Existing is the average maturity (in days) of all unexpired WMPs of bank i in month t. LnAssets is the natural log of a bank’s total assets. WMPdue is the proportion of all WMPs issued by bank i that matured in month t.
(1)(2)(3)(4)(5)(6)(7)(8)(9)(10)
MaturityAverage(1)1.000
MaturityPercent(2)0.5761.000
(0.000)
Guarantee(3)−0.091−0.1321.000
(0.000)(0.000)
Risk(4)0.1520.167−0.0451.000
(0.000)(0.000)(0.000)
Institution(5)0.138−0.027−0.054−0.0251.000
(0.000)(0.000)(0.000)(0.001)
SHIBOR(6)−0.100−0.0840.012−0.021−0.0751.000
(0.000)(0.000)(0.062)(0.006)(0.000)
HHI_WMP(7)0.084−0.1600.004−0.0440.410−0.0271.000
(0.000)(0.000)(0.521)(0.000)(0.000)(0.000)
MaturityExisting(8)0.5550.378−0.1110.1340.114−0.0660.0911.000
(0.000)(0.000)(0.000)(0.000)(0.000)(0.000)(0.000)
LnAssets(9)0.087−0.027−0.209−0.0230.3670.0290.2640.1351.000
(0.000)(0.000)(0.000)(0.009)(0.000)(0.000)(0.000)(0.000)
WMPdue(10)−0.339−0.3490.141−0.1030.0050.0170.114−0.356−0.1081.000
(0.000)(0.000)(0.000)(0.000)(0.422)(0.013)(0.000)(0.000)(0.000)
Table 3. Interbank Offered Rate and the Maturity of WMPs Newly Issued by Banks. This table shows the effect of the interbank offered rate on the maturity of WMPs newly issued by banks in China from 2008 to 2018. The first two columns report the regression results for the overall sample, column (3) reports the regression results for the sample of the five largest state-owned (Big5) banks, and column (4) reports the regression results for the sample of the small and medium-sized banks (SMBs). Maturity_Average is the dependent variable, which represents the average maturity (in days) of all WMPs issued by bank i in month t. SHIBOR is the monthly average of the Shanghai interbank offered rate (overnight rate). HHI represents the monthly concentration degree of the whole bank WMPs markets, which measures the intensity of competition in the WMPs markets. Maturity_Existing is the average maturity (in days) of all unexpired WMPs of bank i in month t. LnAssets is the natural log of a bank’s total assets. WMPdue is the proportion of all WMPs issued by bank i that matured in month t. Robust t-statistics appear in parentheses below the coefficients; ** p < 0.05, *** p < 0.01.
Full SampleBig5 SampleSMBs Sample
(1)(2)(3)(4)
SHIBOR−2.3130 ***−2.8180 ***−3.4320−2.9270 ***
(−4.17)(−5.30)(−1.29)(−5.41)
HHI25.9700320.4000 ***−32.3200328.1000 ***
(1.34)(9.48)(−0.21)(8.79)
Maturity_Existing0.6400 ***0.5120 ***0.4910 ***0.5010 ***
(71.99)(49.78)(10.54)(47.19)
LnAssets−0.7600 ***15.0000 ***−19.290016.2200 ***
(−3.53)(10.61)(−1.54)(11.17)
WMPdue−125.2000 ***−88.9500 ***−308.3000 ***−80.6300 ***
(−30.97)(−20.34)(−9.91)(−18.46)
Constant90.4200 ***−163.1000 ***534.9000 **−179.5000 ***
(1.98)(−6.88)(1.98)(−7.45)
Bank Fixed NoYesYesYes
Time FixedNoYesYesYes
Observations16,41016,41065615,754
Adjusted-R20.3680.1960.3790.184
Table 4. Interbank Offered Rate and the Proportion of WMPs with Maturities Over 90 Days Newly Issued by Banks. This table shows the effect of the interbank offered rate on the proportion of WMPs with maturities over 90 days newly issued by banks in China from 2008 to 2018. The first two columns report the regression results for the overall sample, column (3) reports the regression results for the sample of the five largest state-owned (Big5) banks, and column (4) reports the regression results for the sample of the small and medium-sized banks(SMBs). Maturity_Percent is the dependent variable, which represents the proportion of WMPs with maturities over 90 days issued by bank i in month t. SHIBOR is the monthly average of the Shanghai interbank offered rate (overnight rate). HHI represents the monthly concentration degree of the whole bank WMPs markets, which measures the intensity of competition in the WMPs markets. Maturity_Existing is the average maturity (in days) of all unexpired WMPs of bank i in month t. LnAssets is the natural log of a bank’s total assets. WMPdue is the proportion of all WMPs issued by bank i that matured in month t. Robust t-statistics appear in parentheses below the coefficients; * p < 0.1, ** p < 0.05, *** p < 0.01.
Full SampleBig5 SampleSMBs Sample
(1)(2)(3)(4)
SHIBOR−0.0195 ***−0.0205 ***−0.0150 *−0.0214 ***
(−6.84)(−7.88)(−1.78)(−7.88)
HHI−2.6040 ***−0.0646−0.1790−0.0891
(−26.10)(−0.39)(−0.37)(−0.48)
Maturity_Existing0.0027 ***0.0021 ***0.0009 ***0.0021 ***
(58.32)(40.61)(5.97)(40.04)
LnAssets−0.0142 ***0.1190 ***0.0906 **0.1180 ***
(−12.78)(17.11)(2.28)(16.17)
WMPdue−0.6690 ***−0.5190 ***−1.3880 ***−0.4870 ***
(−32.13)(−24.18)(−14.12)(−22.24)
Constant0.7480 ***−1.4260 ***−1.2060−1.4000 ***
(37.93)(−12.27)(−1.42)(−11.58)
Bank FixedNoYesYesYes
Time FixedNoYesYesYes
Observations16,41016,41065615,754
Adjusted-R20.3350.2140.3710.212
Table 5. Interbank Offered Rate and the Proportion of WMPs with Principal Guarantee Newly Issued by Banks. This table shows the effect of the interbank offered rate on the proportion of WMPs with principal guarantees newly issued by banks in China from 2008 to 2018. The first two columns report the regression results for the overall sample, column (3) reports the regression results for the sample of the five largest state-owned (Big5) banks, and column (4) reports the regression results for the sample of the small and medium-sized banks (SMBs). Guarantee is the dependent variable, which represents the proportion of WMPs with principal guarantee issued by bank i in month t. SHIBOR is the monthly average of the Shanghai interbank offered rate (overnight rate). HHI represents the monthly concentration degree of the whole bank WMPs markets, which measures the intensity of competition in the WMPs markets. LnAssets is the natural log of a bank’s total assets. WMPdue is the proportion of all WMPs issued by bank i that matured in month t. Robust t-statistics appear in parentheses below the coefficients; *** p < 0.01.
Full SampleBig5 SampleSMBs Sample
(1)(2)(3)(4)
SHIBOR−0.00200.0076 ***−0.01370.0093 ***
(−0.45)(2.59)(−1.02)(3.07)
HHI1.7890 ***−0.2490−1.2540−0.2120
(11.44)(−1.33)(−1.65)(−1.01)
LnAssets−0.0485 ***−0.1210 ***−0.2030 ***−0.1200 ***
(−28.01)(−15.71)(−3.22)(−14.95)
WMPdue0.4890 ***0.3100 ***0.4540 ***0.3040 ***
(16.54)(13.45)(3.22)(13.05)
Constant1.0880 ***2.3400 ***4.6700 ***2.2890 ***
(36.47)(17.89)(3.48)(17.05)
Bank Fixed NoYesYesYes
Time FixedNoYesYesYes
Observations16,58516,58565815,927
Adjusted-R20.1690.1340.1330.135
Table 6. Interbank Offered Rate and the Proportion of WMPs with High-risk Underlying Assets Newly Issued by Banks. This table shows the effect of the interbank offered rate on the proportion of WMPs with high-risk underlying assets newly issued by banks in China from 2008 to 2018. The first two columns report the regression results for the overall sample, column (3) reports the regression results for the sample of the five largest state-owned (Big5) banks, and column (4) reports the regression results for the sample of the small and medium-sized banks (SMBs). Risk is the dependent variable, which represents the proportion of WMPs with high-risk underlying assets issued by bank i in month t. SHIBOR is the monthly average of the Shanghai interbank offered rate (overnight rate). HHI represents the monthly concentration degree of the whole bank WMPs markets, which measures the intensity of competition in the WMPs markets. LnAssets is the natural log of a bank’s total assets. WMPdue is the proportion of all WMPs issued by bank i that matured in month t. Robust t-statistics appear in parentheses below the coefficients; * p < 0.1, ** p < 0.05, *** p < 0.01.
Full SampleBig5 SampleSMBs Sample
(1)(2)(3)(4)
SHIBOR−0.0035−0.0057 **−0.0071−0.0058 **
(−0.96)(−2.39)(−0.89)(−2.31)
HHI−0.9600 ***−0.1160−1.1670 ***0.0005
(−8.07)(−0.78)(−2.59)(0.00)
LnAssets−0.0039 ***0.0138 **−0.0690 *0.0187 ***
(−2.66)(2.13)(−1.85)(2.72)
WMPdue−0.3070 ***−0.1610 ***−0.3790 ***−0.1460 ***
(−11.24)(−7.69)(−4.51)(−6.73)
Constant0.2480 ***−0.09311.6580 **−0.1750
(9.48)(−0.82)(2.08)(−1.48)
Bank Fixed NoYesYesYes
Time FixedNoYesYesYes
Observations11,42711,42761810,809
Adjusted-R20.1200.1210.1310.123
Table 7. Interbank Offered Rate and the Proportion of WMPs Only Issued to Institutional Investors Newly Issued by Banks. This table shows the effect of the interbank offered rate on the proportion of WMPs only to institutional investors newly issued by banks in China from 2008 to 2018. The first two columns report the regression results for the overall sample, column (3) reports the regression results for the sample of the five largest state-owned (Big5) banks, and column (4) reports the regression results for the sample of small and medium-sized banks(SMBs). Institution is the dependent variable, which represents the proportion of WMPs issued only to institutional investors issued by bank i in month t. SHIBOR is the monthly average of the Shanghai interbank offered rate (overnight rate). HHI represents the monthly concentration degree of the whole bank WMPs markets, which measures the intensity of competition in the WMPs markets. LnAssets is the natural log of a bank’s total assets. WMPdue is the proportion of all WMPs issued by bank i that matured in month t. Robust t-statistics appear in parentheses below the coefficients; * p < 0.1, ** p < 0.05, *** p < 0.01.
Full SampleBig5 SampleSMBs Sample
(1)(2)(3)(4)
SHIBOR−0.0073 ***−0.0069 ***−0.0400 **−0.0055 ***
(−3.84)(−4.09)(−2.29)(−3.40)
HHI2.4110 ***1.3920 ***2.4830 ***1.5940 ***
(36.28)(13.09)(3.57)(14.26)
LnAssets0.0342 ***0.00630.2040 ***0.0102 **
(46.60)(1.44)(3.54)(2.36)
WMPdue0.0045−0.0647 ***−0.9920 ***−0.0343 ***
(0.36)(−4.94)(−7.68)(−2.75)
Constant−0.5400 ***−0.0449−3.7930 ***−0.1270 *
(−42.58)(−0.60)(−3.09)(−1.77)
Bank Fixed NoYesYesYes
Time FixedNoYesYesYes
Observations16,58516,58565815,927
Adjusted-R20.2280.1310.1030.153
Table 8. Event Study. This table shows the shock effect based on the money shortage in June 2013. Maturity_Average is the dependent variable in column (1), which represents the average maturity (in days) of all WMPs issued by bank i in month t. Maturity_Percent is the dependent variable in column (2), which represents the proportion of WMPs with maturities over 90 days issued by bank i in month t. Guarantee is the dependent variable in column (3), which represents the proportion of WMPs with principal guarantee issued by bank i in month t. Risk is the dependent variable in column (4), which represents the proportion of WMPs with high-risk underlying assets issued by bank i in month t. Institution is the dependent variable in column (5), which represents the proportion of WMPs issued only to institutional investors issued by bank i in month t. SHIBOR is the monthly average of the Shanghai interbank offered rate (overnight rate). Shock is a dummy variable and equals one for the WMPs which are issued in June 2013 and zero otherwise. HHI represents the monthly concentration degree of the whole bank WMPs markets, which measures the intensity of competition in the WMPs markets. Maturity_Existing is the average maturity (in days) of all unexpired WMPs of bank i in month t. LnAssets is the natural log of a bank’s total assets. WMPdue is the proportion of all WMPs issued by bank i that matured in month t. Robust t-statistics appear in parentheses below the coefficients; * p < 0.1, ** p < 0.05, *** p < 0.01.
(1) Maturity_Average(2) Maturity_Percent(3) Guarantee(4) Risk(5) Institution
SHIBOR−4.5780 ***−0.0260 ***0.0079 ***−0.0055 **−0.0064 ***
(−7.84)(9.53)(2.67)(−2.29)(−3.82)
SHIBOR × Shock−3.9040 ***−0.0121 *−0.0067−0.0051−0.0109 ***
(−2.73)(1.79)(−0.92)(−0.95)(−2.64)
HHI483.7000 ***0.6190 ***−0.2510−0.11801.3880 ***
(13.14)(3.57)(−1.34)(−0.79)(13.05)
LnAssets23.9500 ***0.1560 ***−0.1220 ***0.01370 **0.0060
(15.67)(21.69)(−15.73)(2.10)(1.35)
Maturity_Existing0.5100 ***0.0021 ***
(51.78)(42.61)
WMPdue−138.6000 ***−0.7110 ***0.3100 ***−0.1600 ***−0.0636 ***
(−30.53)(−33.22)(13.47)(−7.66)(−4.85)
Constant−236.1000 ***−1.7560 ***2.3430 ***−0.0911−0.0400
(−9.13)(−14.41)(17.91)(−0.80)(−0.54)
Bank Fixed YesYesYesYesYes
Time FixedYesYesYesYesYes
Observations16,48116,48116,58511,42716,585
Adjusted-R20.1650.1280.1340.1210.103
Table 9. Robustness check. This table shows robustness check results after replacing SHIBOR(overnight) with SHIBOR(1-week). Maturity_Average is the dependent variable in column 1, which represents the average maturity of all WMPs issued by bank i in month t and is in days. Maturity_Percent is the dependent variable in column 2, which represents the proportion of WMPs with maturities over 90 days issued by bank i in month t. Guarantee is the dependent variable in column 3, which represents the proportion of WMPs with principal guarantee issued by bank i in month t. Risk is the dependent variable in column 4, which represents the proportion of WMPs with high-risk underlying assets issued by bank i in month t. Institution is the dependent variable in column 5, which represents the proportion of WMPs issued only to institutional investors issued by bank i in month t. HHI represents the monthly concentration degree of the whole bank WMPs’ markets, which measures the intensity of competition in the WMPs markets. MaturityExisting is the average maturity (in days) of all unexpired WMPs of bank i in month t. LnAssets is the natural log of a bank’s total assets. WMPdue is the proportion of all WMPs issued by bank i that matured in month t. Robust t-statistics appear in parentheses below the coefficients; *** p < 0.01.
(1) Maturity_Average(2) Maturity_Percent(3) Guarantee(4) Risk(5) Institution
SHIBOR(1-week)−4.783 ***−0.031 ***0.009 ***−0.012 ***−0.014 ***
(−10.05)(−13.25)(3.59)(−5.44)(−9.31)
HHI302.500 ***−0.175−0.213−0.2051.331 ***
(8.95)(−1.06)(−1.14)(−1.36)(12.51)
LnAssets13.230 ***0.107 ***−0.118 ***0.0080.0008
(9.31)(15.40)(−15.09)(1.27)(0.17)
WMPdue−87.210 ***−0.508 ***0.306 ***−0.155 ***−0.057 ***
(−19.97)(−23.76)(13.26)(−7.40)(−4.36)
MaturityExisting0.504 ***0.002 ***
(48.94)(39.64)
Constant−126.400 ***−1.196 ***2.272 ***0.0190.069
(−5.26)(−10.16)(17.09)(0.16)(0.91)
Bank Fixed YesYesYesYesYes
Time FixedYesYesYesYesYes
Observations16,41016,41016,58511,42716,585
Adjusted-R20.1990.2200.1310.1190.097
Table 10. Robustness check. This table shows robustness check results after using the dynamic panel data model. Maturity_Average is the dependent variable in column 1, which represents the average maturity of all WMPs issued by bank i in month t and is in days. Maturity_Percent is the dependent variable in column 2, which represents the proportion of WMPs with maturities over 90 days issued by bank i in month t. Guarantee is the dependent variable in column 3, which represents the proportion of WMPs with principal guarantee issued by bank i in month t. Risk is the dependent variable in column 4, which represents the proportion of WMPs with high-risk underlying assets issued by bank i in month t. Institution is the dependent variable in column 5, which represents the proportion of WMPs issued only to institutional investors issued by bank i in month t. SHIBOR is the monthly average of the Shanghai interbank offered rate (overnight rate). WMP_Characteristic(t-1) represents the lagged dependent variable in each regression. HHI represents the monthly concentration degree of the whole bank WMPs’ markets, which measures the intensity of competition in the WMPs markets. MaturityExisting is the average maturity (in days) of all unexpired WMPs of bank i in month t. LnAssets is the natural log of a bank’s total assets. WMPdue is the proportion of all WMPs issued by bank i that matured in month t. Robust t-statistics appear in parentheses below the coefficients; ** p < 0.05, *** p < 0.01.
(1) Maturity_Average(2) Maturity_Percent(3) Guarantee(4) Risk(5) Institution
SHIBOR−1.773 ***−0.0132 ***0.000334 ***−0.00209 ***−0.00136 ***
(−3.63)(−5.68)(3.01)(−2.98)(−3.36)
WMP_Characteristic(t-1)0.434 ***0.475 ***0.778 ***0.830 ***0.800 ***
(54.21)(64.90)(158.70)(157.11)(171.16)
HHI221.9 ***−0.0755−0.0834−0.08420.286 ***
(7.13)(−0.51)(−0.71)(−1.02)(4.49)
LnAssets9.933 ***0.0638 ***−0.0254 ***0.004130.00371
(7.62)(10.24)(−5.22)(1.16)(1.41)
Maturity_Existing0.218 ***0.000743 ***
(19.96)(15.07)
WMPdue−48.21 ***−0.290 ***0.0549 ***−0.0233 **−0.0201 **
(−11.78)(−14.91)(3.79)(−1.98)(−2.57)
Constant−107.7 ***−0.719 ***0.499 ***−0.0420−0.0476
(−4.93)(−6.90)(6.04)(−0.67)(−1.07)
Bank Fixed YesYesYesYesYes
Time FixedYesYesYesYesYes
Observations16,39516,39516,58511,10416,585
Adjusted-R20.3210.3780.6220.6900.645
Table 11. Robustness check. This table shows robustness check results after using the dummy variable approach. Maturity_Average is the dependent variable in column 1, which represents the average maturity (in days) of all WMPs issued by bank i in month t. Maturity_Percent is the dependent variable in column 2, which represents the proportion of WMPs with maturities over 90 days issued by bank i in month t. Guarantee is the dependent variable in column 3, which represents the proportion of WMPs with principal guarantee issued by bank i in month t. Risk is the dependent variable in column 4, which represents the proportion of WMPs with high-risk underlying assets issued by bank i in month t. Institution is the dependent variable in column 5, which represents the proportion of WMPs issued only to institutional investors issued by bank i in month t. SHIBOR is the monthly average of the Shanghai interbank offered rate (overnight rate). SMB is a dummy variable that equals one when the bank is a small and medium-sized bank and otherwise equals 0. HHI represents the monthly concentration degree of the whole bank WMPs’ markets, which measures the intensity of competition in the WMPs markets. MaturityExisting is the average maturity (in days) of all unexpired WMPs of bank i in month t. LnAssets is the natural log of a bank’s total assets. WMPdue is the proportion of all WMPs issued by bank i that matured in month t. Robust t-statistics appear in parentheses below the coefficients; ** p < 0.05, *** p < 0.01.
(1) Maturity_Average(2) Maturity_Percent(3) Guarantee(4) Risk(5) Institution
SHIBOR−2.789−0.00898−0.0131−0.00471−0.0400 ***
(−1.43)(−0.94)(−1.20)(−0.60)(−3.27)
SHIBOR × SMB−0.0303 ***−0.0125 ***0.0224 ***−0.00110 **0.0345 ***
(−4.51)(−3.63)(3.75)(−2.30)(3.36)
HHI320.4 ***−0.0414−0.291−0.1141.352 ***
(9.42)(−0.25)(−1.54)(−0.76)(12.63)
LnAssets15.00 ***0.119 ***−0.122 ***0.0139 **0.00540
(10.59)(17.16)(−15.80)(2.13)(1.23)
Maturity_Existing0.512 ***0.00205 ***
(49.78)(40.62)
WMPdue−88.95 ***−0.518 ***0.309 ***−0.161 ***−0.0654 ***
(−20.33)(−24.15)(13.42)(−7.69)(−4.99)
Constant−163.2 ***−1.435 ***2.355 ***−0.0938−0.0306
(−6.87)(−12.32)(17.98)(−0.83)(−0.41)
Bank Fixed YesYesYesYesYes
Time FixedYesYesYesYesYes
Observations16,41016,41016,58511,42716,585
Adjusted-R20.1960.2140.1340.1210.103
Disclaimer/Publisher’s Note: The statements, opinions and data contained in all publications are solely those of the individual author(s) and contributor(s) and not of MDPI and/or the editor(s). MDPI and/or the editor(s) disclaim responsibility for any injury to people or property resulting from any ideas, methods, instructions or products referred to in the content.

