Article

The Vegetation Composition and Carbon Stock of Old Shrub Typology to Support the Rehabilitation Program in Sumatra and Kalimantan Islands, Indonesia

National Research and Innovation Agency, Jl. Raya Jakarta Bogor Km. 46, Bogor 16911, West Java, Indonesia
*
Author to whom correspondence should be addressed.
Sustainability 2023, 15(2), 1389; https://doi.org/10.3390/su15021389
Submission received: 23 November 2022 / Revised: 23 December 2022 / Accepted: 9 January 2023 / Published: 11 January 2023

Abstract

:
The typology of certain old shrubs assists with the selection of suitable plant species for rehabilitation. The carbon stock dynamic in old shrubs is fundamental due to their high uptake during the growth process phase. A plot of 100 m × 100 m (1 hectare) was created in each location, referring to the work of Mueller-Dombois and Ellenberg. The plot was further divided into subsquares measuring 20 m × 20 m; in each plot, there were 25 subplots. Research results showed that the diversity index of old shrubs at the tree, pole, and seedling stage is 2.50–2.66, 1.23–1.50, and 0.67–1.11, respectively. For Kalimantan, the diversity index is lower than that on Sumatra Island, which is 1.64–1.80, 1.00–1.02, and 0.52–0.81, respectively. The carbon stock of the old shrub forest in Sumatra has an average of 36.61 Mg C per ha (standard deviation 14.54 Mg C per ha) to 72.50 Mg C per ha (standard deviation 25.61 Mg C per ha), while Kalimantan has an average of 47.94 Mg C per ha (standard deviation 13.30 Mg C per ha) to 144.07 Mg C per ha (standard deviation 54.64 Mg C per ha). The dynamics of the vegetation composition and carbon stock in each old shrub’s typology are considered when choosing a suitable model, including high carbon stock content, to provide optimal results for rehabilitation activities.

1. Introduction

Lowland tropical rainforests are generally species rich, especially in primary forests. In general, lowland primary forests in Sumatra and Kalimantan are dominated by plant species from the Dipterocarpaceae family. Primary forest ecosystems can transform into secondary forests and old or young shrubs due to various forest disturbances, including fires, natural disasters, and non-environmentally friendly logging. The old shrub is a small- to large-sized perennial woody plant dominated by small perennial woody plants [1]. Unlike herbaceous plants, old shrubs have persistent woody stems aboveground. Shrubs may be deciduous or evergreen. The old shrub has the advantage of greater tolerance for mechanical disturbances, and they are usually outcompeted by the surrounding trees in terms of light acquisition. In the forest, they are more frequently found in early successional stages [2].
The size of the old shrub area in Indonesia’s dryland is 11,330,200 ha, whereas in Sumatra Island, it covers 2,941,600 ha (the Riau, Jambi, and South Sumatra Provinces comprise 38,700 ha, 775,800 ha, and 275,700 ha, respectively). The shrub area on Kalimantan Island amounts to 4,145,600 ha (that of West Kalimantan and East and North Kalimantan amounts to 334,600 ha and 2,237,200 ha, respectively) [1]. Most of the old shrub areas on the islands of Sumatra and Kalimantan have degraded, primarily as a result of human activities. The rehabilitation program represents the government’s efforts to improve land quality and cover. The level of land degradation is strongly influenced by forest land management, and the land degradation level will affect the vegetation composition [3]. Apart from the forest land management aspect, currently, the phenomenon of climate change also affects the condition of vegetation in various regions worldwide. There have been indications of a decline in plant species richness due to global warming, and different plant lifeforms exhibit varying sensitivities to climate change [4,5]. Temperature and precipitation can affect species richness [4], further influencing ecosystem productivity [6].
Rehabilitation activity requires adaptive vegetation species that are tolerant to specific environmental conditions. Rehabilitation is also related to species compositions, structures, or processes leading to a degraded ecosystem [7]. Using an inappropriate vegetation species for rehabilitation will not provide the maximum results for their growth [8]. Therefore, it is necessary to provide accurate data and information about the vegetation composition from many locations on the islands of Sumatra and Kalimantan. The old shrubs in Sumatra and Kalimantan are high-value vegetation, since they are part of the dry lowland rainforest typical of the Sundaland region, with specific species compositions, as well as diversity [9,10,11,12]. However, few studies have explored the selection of potential species for rehabilitation, and little is known about their potential carbon stocks. Determining the typology of old shrubs is crucial for the rehabilitation of degraded areas, especially in relation to the selection of appropriate plant species. In addition, the carbon stock dynamics in old shrubs is fundamental because of their high uptake during the growth process phase. For this reason, the role of old shrubs as CO2 absorbers must be appropriately managed. Carbon dioxide uptake is closely related to standing biomass [13]. The amount of biomass in an area is obtained from the production of biomass density and tree species [14]. Great potential for reducing CO2 levels can be achieved through good forest land management practices [15], one of which can be conducted via the rehabilitation of degraded old shrubs.
Accurate data and information about the vegetation composition from many locations in Indonesia, including in the islands of Sumatra and Kalimantan, is essential to support suitable plant species for the rehabilitation of degraded areas. This study aims to (a) identify the vegetation species and carbon stock dynamics as the basis to determine the typology of old shrubs on the islands of Sumatra and Kalimantan and (b) to assess the typology of old shrubs to support the rehabilitation program and its strategy.

2. Materials and Methods

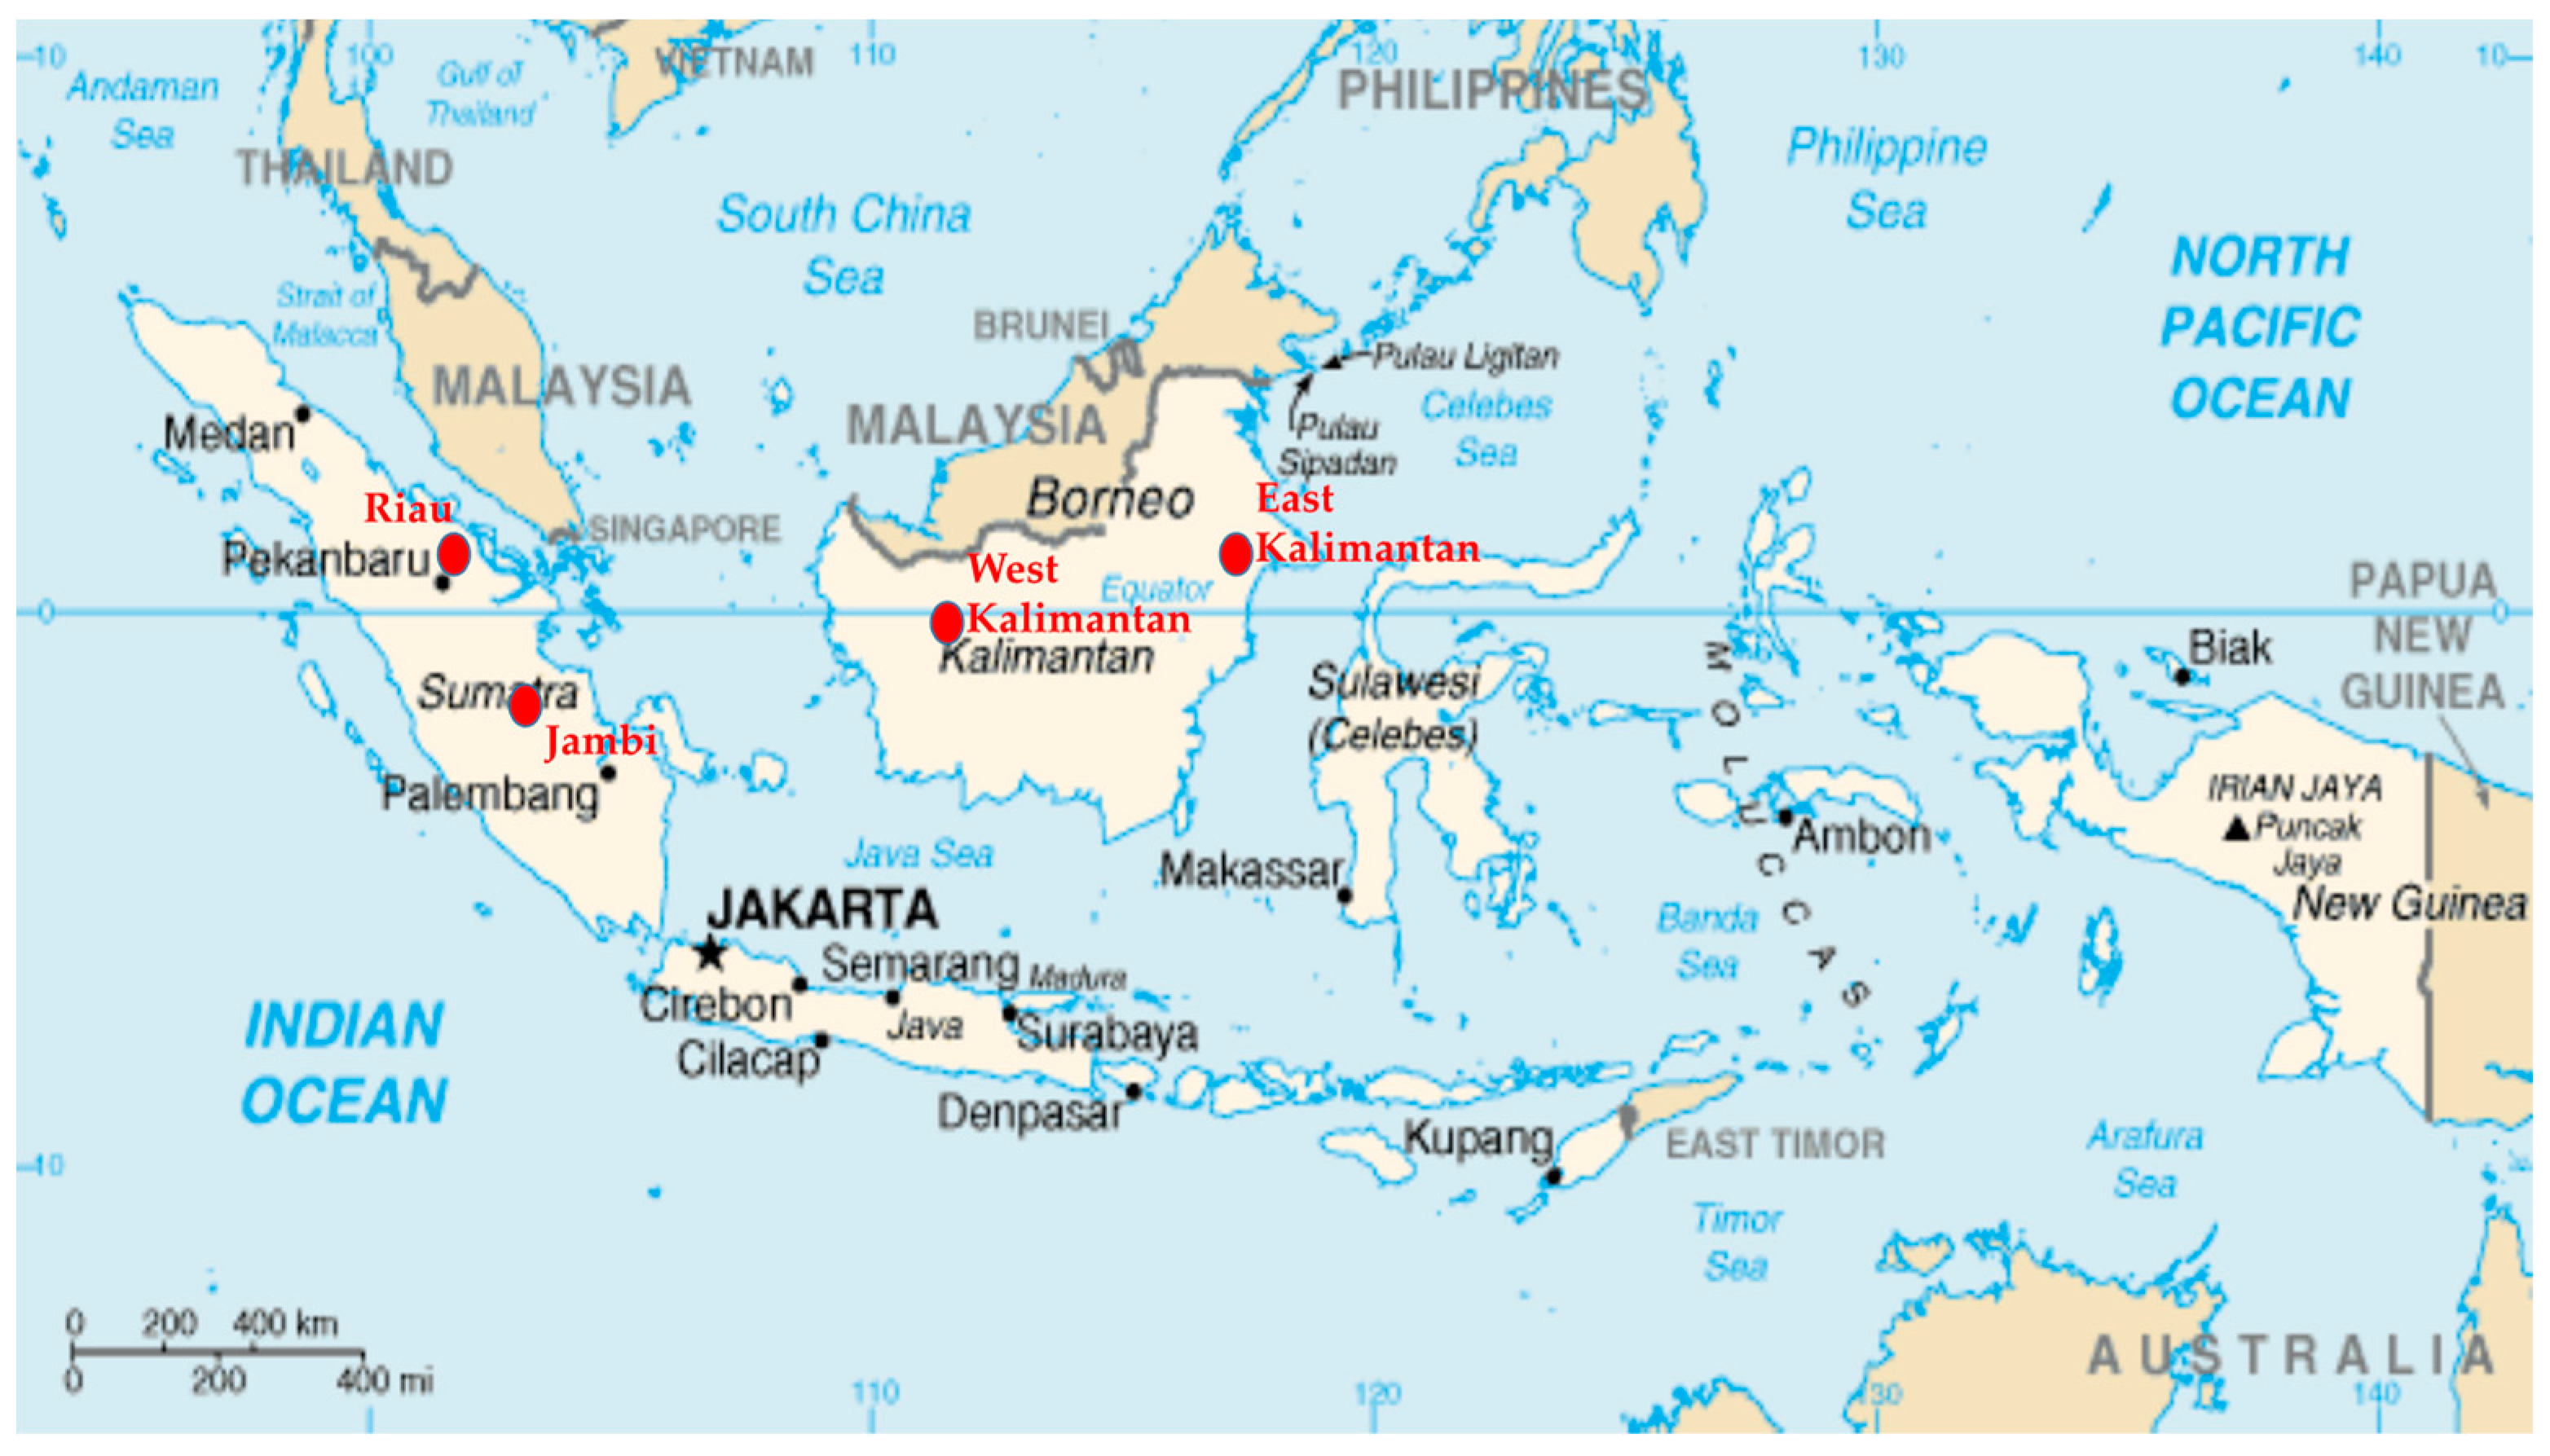
2.1. Description of the Study Area and Its Context

The study was conducted in lowland tropical rainforests, especially at the old shrub level, at two locations in the year 2019. These locations were Sumatra Island (the Riau Province and the Jambi Province) and Kalimantan Island (the West Kalimantan Province and the East Kalimantan Province). The old shrub is a small- to large-sized perennial woody plant dominated by small perennial woody plants. The research locations consisted of four plot locations: (a) a one-hectare plot in the Riau Province (0°43′50,50″ N and 101°20′58,80″ E); (b) a one-hectare plot in the Jambi Province (1°27′34,092″ S and 103°13′1,2″ E); (c) a one-hectare plot in the West Kalimantan Province (0°11′30,30” N and 111°18′59,10″ E); and (d) a one-hectare plot in the East Kalimantan Province (0°33′42,92″ N and 117°27′00,94″ E). These sites are highlighted in Figure 1.
The selection of research locations is based on the representation of vegetation conditions in the study area. The dry lowland tropical rainforests in Sumatra are mainly spread over the Riau and Jambi provinces, with an area of 38,700 ha and 775,800 ha, respectively. In Kalimantan, the dry lowland tropical rainforests are found in the provinces of West Kalimantan and East Kalimantan, covering an area of 334,600 ha and 2,237,200 ha, respectively. The study location was originally a primary natural forest, and later, it was managed and utilized through a selective cutting scheme, becoming a production forest. In subsequent developments, the vegetation progressed into shrubs with the status of a conservation forest.
All of the plots represent the Dipterocarpaceae species. We choose one plot as a representative area of each province, using a purposive sampling approach. The biophysical characteristics of each study site are presented in Table 1.

2.2. Survey and Sampling Designs

A plot of 100 m × 100 m (1 hectare) was created in each location, following the techniques outlined in [17]. The plot was divided into subsquares measuring 20 m × 20 m so that each plot contained several subplots (Figure 2). A 5 m × 5 m subplot was created in each 20 m × 20 m area, and a 2 m × 2 m subplot was created in each 5 m × 5 m area (Figure 2), respectively. In total, we created 4 plots containing 100 subplots for trees, 100 subplots for saplings, and 100 subplots for seedlings.
The research design adopts purposive random sampling to obtain accurate analytical results. Old shrubs were categorized into three size classes, according to their developmental stage, i.e., (1) seedling—height < 1.5 m (2) sapling—DBH < 10 cm and height ≥ 1.5 m, and (3) tree—DBH ≥ 10 cm. The criteria for tree, sapling, and seedling levels follow those used in vegetation studies [18,19]. Trees were measured in 20 m × 20 m plots. Saplings were measured in subplots of 5 m × 5 m, and seedlings were counted in 2 m × 2 m plots. Measurements of diameter and total height, along with the recording of species names, were carried out at the tree and sapling levels in the subplots. The calculation of the numbers and the recording of the species names were carried out at the seedling level. The vegetation composition and carbon stock were analyzed in terms of the plot locations. For the unknown species, samples of material such as leaves, flowers, and fruits, as herbarium material, were taken to the herbarium at the Center for Forest Research and Development, Bogor, for further identification, as demonstrated in [20].
Soil sampling was conducted in the study site using a composited sample method. Composited samples of soil materials were collected from 5 points in each 100 m × 100 m plot with 30 cm depth, using a ring sampler. The soil samples were analyzed in the Soil Research Laboratory, Ministry of Agriculture, Republic of Indonesia. Chemical characteristics, such as pH, C, N, P, organic matter (OM), CEC (cation exchangeable capacity), BS (base saturation), Ca, Mg, K, Na, Al, and H, were also analyzed.

2.3. Estimating Vegetation Composition and Diversity

Changes in the vegetation composition and plant species diversity of the forest ecosystem are commonly used to reflect the impact of any intervention in the system. One of the parameters used to estimate the changes is the use of the important value index (IVI). The IVI is obtained from the sum of the vegetation analyses, which includes the value of relative frequency, relative density, and relative dominance [17,21]. The equation for calculating relative density, relative frequency, relative dominance, and the important value index is described as follows:
Relative   density   % = number   of   individuals   for   a   species total   number   of   individuals   for   all   species   in   the   plot × 100 %
Relative   frequency   % = frequency   of   a   species total   number   of   frequency   for   all   species   in   the   plot × 100 %
Relative   dominance   % = total   base   area   of   a   species total   base   area   of   all   species   in   the   plot × 100 %
Important value index (%) = Relative density + relative frequency + relative dominance
Vegetation diversity is calculated using the Shannon diversity index equation, as follows [17]:
Shannon s   diversity   index = i = 1 T abundance   index   ×   ln   of   abundance   index
Completely randomized design (CRD) and one-way ANOVA at a significance level of 5% were used to detect differences in plant diversity between study sites. Furthermore, the effect was tested to compare the means of all diversity using Duncan’s multiple range test (DMRT). SPSS Version 8.0 software was used to support statistical analysis.

2.4. Estimating Carbon Stock

Carbon stock estimation was developed based on the above-ground biomass calculated from all the plots established in the study area. The biomass and carbon stocks were evaluated at a tree with DBH > 10 cm. The calculation of stand biomass was analyzed using an allometric equation, as follows [22]:
Stand   biomass   kg / tree = 0.0559 ×   wood   density   × diameter   at   breast   height 2 ×   height
where the unit measurement of the diameter at breast height is in cm, the unit measurement of wood density is in gr/cm3, and the unit measurement of height is in m. This allometric equation used the average wood density of 0.61 gr/cm3. The average rainfall in the research location is between 1500 mm/year–4000 mm/year.
The calculation of the carbon content and the carbon dioxide values was performed using the following equations [21,23]:
Carbon   stock   kg = dry   organic   matter   kg × 47 %
Carbon dioxide (kg) = Carbon stock (kg) × 3.67
Ultimately, the calculation of the total aboveground tree biomass for each plot was obtained from the sum of all the estimated aboveground biomass values of each tree in the plot and expressed in Mg (mega grams). All of the measured parameters, along with the subsequent analysis, are presented in Table 2.

3. Results

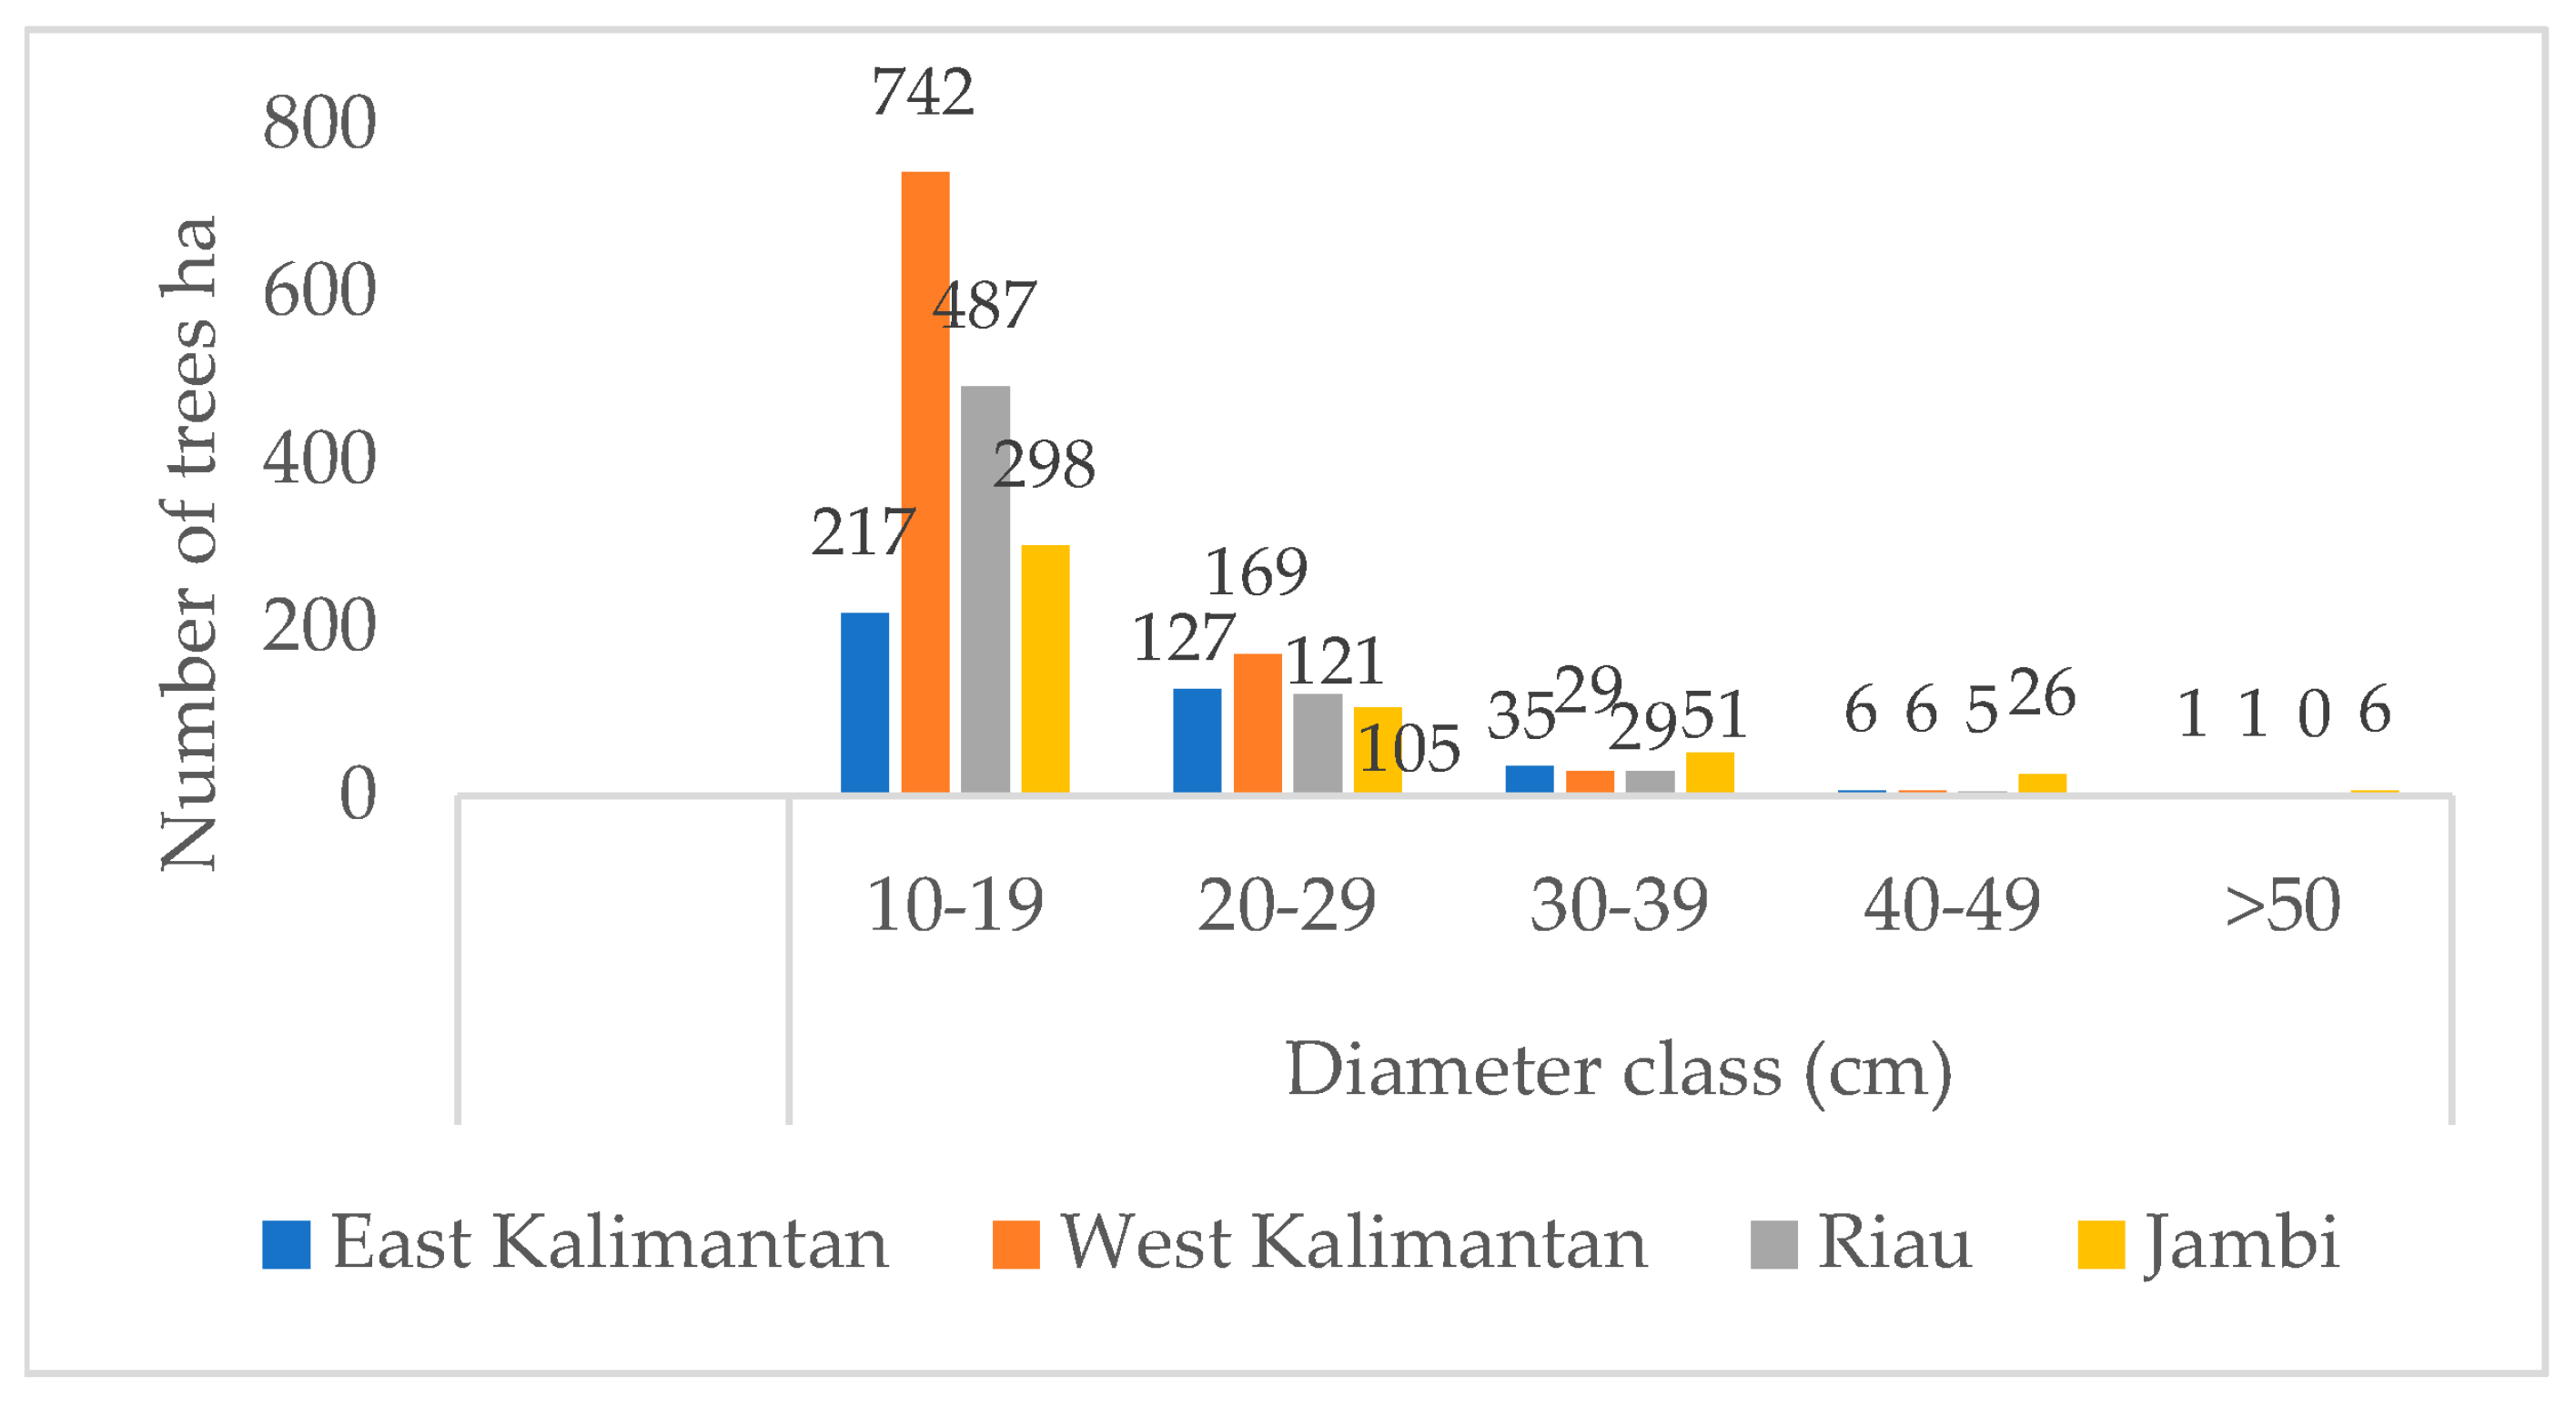
3.1. Vegetation Composition and Regeneration

A total of 41 species, 33 genera, and 24 families were recorded from the Jaung River old shrub forest area, Sintang, West Kalimantan. The four families with the highest number of species included Rubiaceae (six species), and three families were identified with three species each (Apocynaceae, Clusiaceae, and Euphorbiaceae). Porterandia glabrifolia Ridl. experience complete regeneration in the seedling, sapling, and tree stages.
This study recorded 103 species from 79 genera and 38 families in the old-growth secondary protection forest of the Menamang Kanan River, Kutai Kartanegara District, East Kalimantan Province. The four families with the highest number of species were Lauraceae (11 species), Rubiaceae (10 species), Annonaceae (6 species), and Lamiaceae (6 species). The dominant tree species with the highest IVI and a complete regeneration phase was Melicope lunu-akenda (Gaertn.) T.G. Hartley.
In the Rantau Bertuah Siak Riau conservation forest area, 51 species of tree (46 genera and 29 families), 32 species of sapling, and 13 species of seedling stages were recorded. Calophyllum macrocarpum Hook.f. (IVI = 27.88%), with 74 individuals per ha, Shorea dasyphylla Foxw. (IVI = 21.98%), with 40 individuals per ha, and Gironniera nervosa Planch (IVI = 19.99%), with 50 individuals per ha showed high dominance based on tree density per hectare. Calophyllum macrocarpum Hook.f. is the dominant species, and it undergoes a complete regeneration stage.
In the conservation forest areas of Bangko Lake, Batang Hari, Jambi Province, 61 tree species, 54 genera, 28 families, 33 species of saplings, and 23 species of seedlings were recorded from 25 subplots. The species richness of the tree level in the study sites is far higher than that shown in the results of survey [24], where 54 species were recorded per hectare. However, the number of families in the study site is relatively low compared to the survey results in the old secondary forest (37 families) and the young secondary forest (29 families), as recorded [24] in the Batanghari, Jambi province. Archidendron bubalinum (Jack.) Nielsen shows a complete regeneration stage.
The distribution of individual plants in the canopy layer can be interpreted as the distribution of trees per unit area in the various diameter classes. It is referred to as the forest stand structure [25]. The stand structure based on the tree diameter class in the research plot is presented in Figure 3.

3.2. Carbon Stock Dynamics

The carbon dynamic at the research site varied from 36.61 Mg C per ha to 144.07 Mg C per ha and is strongly influenced by the stand density (N per ha) at each site in Riau, Jambi, West Kalimantan, and East Kalimantan. Overall, the carbon stocks in the study sites in West and East Kalimantan are higher than those in Sumatra (Riau and Jambi) due to the higher stand density at the study sites in Kalimantan compared to those at Sumatra (Table 3). This is also the result of better standing stocks on the study sites of Kalimantan Island, which allow it to absorb and store more carbon. The growth of this stand was influenced by the chemical characteristics of the soil N, P, K, Ca, Mg, Na, and CEC in Kalimantan, which were of better quality than those in Sumatra (Table 4).
The amount of biomass and the carbon content of the forest stands with a diameter of 10 cm is shown in Table 3.

3.3. Typology of Old Shrubs on the Islands of Sumatra and Kalimantan

The typology of old shrubs is based on the vegetation composition and the carbon stocks dynamic on the two main islands of Sumatra and Kalimantan, as shown in Table 5. The definition of old shrubs used here is a small- to large-sized perennial woody plant dominated by small perennial woody plants [1], and land-cover vegetation dominated by young trees growing back into the forest. In addition, older forest stands (such as a transitional forest) can still be found [26].
The dominant species in the provinces of Riau, Jambi, West Kalimantan, and East Kalimantan vary according to the characteristics of their respective habitats. This variation is mainly due to the diversity of species at each of these locations, with different diversity indices between locations (Table 6). Based on the results of further tests using Duncan’s multiple range test at the tree level, it is indicated that the diversity index at each location on each island does not differ significantly. On the contrary, the locations between islands are significantly different from each other (Table 6). This fact shows that the diversity of species in each site is a vital determinant in the typology of the old shrubs. On the island of Sumatra, the old shrubs diversity index at the tree, sapling, and seedling stages were 2.50–2.66, 1.23–150, and 0.67–1.11, respectively. Meanwhile, on the island of Borneo, the diversity index of old shrubs was lower than that on the island of Sumatra for the tree, sapling, and seedling stages, at 1.64–1.80; 1.00–1.02, and 0.52–0.81, respectively.

4. Discussion

4.1. Vegetation Composition and Regeneration

A study from the lowland rainforest of Kalimantan [27] showed that the floristic composition among locations varies; each has its characteristic genera. This condition is affected by habitat and geographic factors. The species numbers of tree, sapling, and seedling stages in the conservation forest area of Rantau Bertuah Siak, Riau Province, are much lower than those noted in the surveys [24,28]. Meanwhile, the tree species richness in the conservation forest areas of Bangko Lake, Batang Hari, Jambi Province is far higher than the results obtained in other studies [19].
Regeneration is a natural process in the forest ecosystem in which the organism mechanism will renew the forest stand structure to maintain and extend its existence. Young trees will replace mature trees when they have been logged, burned, toppled due to natural disasters, or are physiologically dead. Moreover, these are all natural phenomena. The regeneration process depends on several factors, including the creation of a natural gap in the tropical forest which has undergone a complex process. Vegetation composition and complete regeneration are fundamental in a natural forest ecosystem process in which the organism renews the forest stand structure to maintain and continue its existence. Tree species with complete regeneration are always present at seedling, sapling, and tree stages [29].
The ability of trees to utilize solar energy, nutrients or minerals, and water, as well as the nature of competition, is varied, even in the same sites [30], leading to the variation in diameter class distribution in the forest stand. At this research site, the forest stand structure has been decreasing in terms of the number of trees, from small to large diameter. This is in line with other studies which state that there are more small-diameter classes in natural forests than large-diameter classes [31].

4.2. Carbon Stock Dynamics

The carbon dynamic at this site is part of the dynamics of the landscape caused by disturbances to the forested areas, which transform into old shrub forest areas [32]. The growth process in young trees is relatively faster than that in old trees due to the optimization of the photosynthetic process [33].
The biomass and carbon content in the trees at a diameter of 10 cm vary. The results of research [34] in the Central Kalimantan Forest show that the carbon stock can reach 73.08 Mg C per ha, which is higher than the results obtained in this study, except for in West Kalimantan. Meanwhile, the results of research [35] in the secondary forest of Mandiangin, South Kalimantan, estimated a carbon stock of 81.59 Mg C per ha. Forest ecosystems can store carbon and are considered the largest carbon pool in terrestrial ecosystems [36,37]. The great potential for storing carbon in old shrub forests on Sumatra Island (Riau and Jambi) and Kalimantan Island (West Kalimantan and East Kalimantan) is shown in Table 3.
On Sumatra Island (Riau and Jambi), plant species such as Shorea dasyphylla Foxw., Calophyllum macrocarpum Hook.f., Lithocarpus gracilis (Korth.) Soepadmo, Prunus arborea (Blume) Kalkman, Alseodhapne bancana Miquel, and Agelaea trinervis (Llanos) Merr. have great potential for storing carbon in old shrub forests. Meanwhile, on the island of Borneo (West Kalimantan and East Kalimantan), the plant species of Combretocarpus rotundatus (Miq.) Danser, Porterandia sp., Maccaranga gigantea (Rchb.f. & Zoll.) Muell.Arg., Melicope lunu-akenda (Gaertn.) T.G. Hartley, and Callicarpa pentandra Roxb. have great potential for storing carbon in old shrub forests.

4.3. Typology of Old Shrubs on the Islands of Sumatra and Kalimantan to Support Rehabilitation in Degraded Forests

The diversity of species in each site is a crucial determinant for the typology of old shrubs. In this study, the diversity index of old shrubs in Kalimantan was lower than in Sumatra for the tree, sapling, and seedling stages. This study’s typology of old shrubs based on vegetation composition and carbon stock dynamics can support proper species selection for degraded forest land rehabilitation.
The dynamic of carbon stock among locations varies, except in West Kalimantan, which has the highest carbon stock of 144.07 Mg C per ha. According to research conducted in Reference [26], the average carbon stock in the old shrubs forest is 60 Mg C per ha. Therefore, the carbon stock in the study sites of Riau, Jambi, and East Kalimantan has a similar value to that estimated in other research [26]. The high carbon stock in the old shrubs forest of West Kalimantan indicated the presence of a transition forest towards the old secondary forest, as shown in Figure 4. Several dominant species in the study sites also become species that can store a large amount of carbon. Examples of such species include Calophyllum macrocarpum Hook.f. (in Sumatra Island), Combretocarpus rotundatus (Miq.) Danser, Porterandia glabrifolia Ridl., and Macaranga gigantea (Rchb.f. and Zoll.) Mull.Arg. (on Kalimantan Island).
The selection of plant species primarily determines the success of a rehabilitation program. This study’s typology of old shrubs can support the selection of suitable species for rehabilitating degraded forest land. The presence of old shrubs in plant stands indicates previous disturbances caused by logging, fire, or other factors. Unlike herbaceous plants, old shrubs have strong woody stems that grow less than 2 m per year and often form the undergrowth of tall trees. Shrubs are categorized as old shrubs if the forest disturbance has occurred over a long time, while young shrubs are shrubs that have just formed. Thus, if left undisturbed, old shrubs will shortly turn into secondary forests. With plant species that have become old shrubs, a choice of plant species for rehabilitating degraded forest land is available [38]. In addition to the selection of plant species, it is also necessary to examine the growth of these plants, which can be determined based on their biomass and carbon stocks.
In addition, parameters of endemicity characteristics, conservation status, and distribution of biogeographical areas are essential when it comes to selecting valuable species for rehabilitation programs. As represented in Table 3, species that exhibit high endemicity, enjoy protected conservation status, and are native species in the biogeographical distribution area take priority in the development of dry lowland tropical rainforest rehabilitation programs in Sumatra and Kalimantan.

5. Conclusions

The old shrubs on Sumatra Island (Riau and Jambi) and Kalimantan Island (West Kalimantan and East Kalimantan) are dominated by endemic and fast-growing species that have the potential to rehabilitate degraded forest land and support environmental services (carbon stocks) ecosystem conservation as a biodiverse habitat. The typology of the old shrubs on Sumatra Island and Kalimantan Island can be determined based on the vegetation composition and the carbon stocks dynamic. The diversity index of old shrubs at the tree, sapling, and seedling stages on Sumatra Island is higher than that of Kalimantan Island. On the other hand, the carbon stock of old shrubs on Sumatra Island is lower than that of Kalimantan Island.
The dynamics of vegetation composition and carbon stock in each typology of old shrubs can be considered when determining suitable species in order to ensure high carbon stocks to provide maximum results for rehabilitation.

Author Contributions

Each author (I.W.S.D., N.M.H., T.S., M.W., A.S., R.G., R.S., D., V.Y., E.K., M.T., R.T.K., and Z.) had an equal role as main contributors who equally discussed the conceptual ideas and the outline, conducted the literature reviews, performed the analysis, prepared the initial draft, provided critical feedback on each section, as well as revised and finalized the manuscript. All authors have read and agreed to the published version of the manuscript.

Funding

This research was collaboration between Forest Research & Development Center and Sinar Mas Group.

Informed Consent Statement

Not applicable.

Data Availability Statement

The datasets used and/or analyzed during the current study are available from the corresponding author on reasonable request.

Acknowledgments

We thank the anonymous reviewers for their detailed comments and corrections.

Conflicts of Interest

The authors declare no conflict of interest.

References

  1. Ministry of Environment and Forestry. Rekalkulasi Penutupan Lahan Indonesia Tahun 2020 (Land Cover Recalculation of Indonesia Year 2020); Ministry of Environment and Forestry: Jakarta, Indonesia, 2021.
  2. Gaitán, J.J.; Bran, D.E.; Oliva, G.E. Patagonian Desert. In Reference Module in Earth Systems and Environmental Sciences; Goldstein, M.I., DellaSala, D.A., Eds.; Elsevier: Amsterdam, The Netherlands, 2020. [Google Scholar]
  3. Liira, J.; Sepp, T.; Parrest, O. The Forest Structure and Ecosystem Quality in Conditions of Anthropogenic Disturbance along Productivity Gradient. Ecol. Mgmt. 2007, 250, 34–46. [Google Scholar] [CrossRef]
  4. Sun, Y.; Sun, Y.; Yao, S.; Akram, M.A.; Hu, W.; Dong, L.; Li, H.; Wei, M.; Gong, H.; Xie, S.; et al. Impact of Climate Change on Plant Species Richness Across Drylands in China: From Past to Present and Into the Future. Ecol. Indic. 2021, 132, 108288. [Google Scholar] [CrossRef]
  5. Harrison, S. Plant Community Diversity Will Decline More than Increase Under Climatic Warming. Philos. Trans. R. Soc. B-Biol. Sci. 2020, 375, 20190106. [Google Scholar] [CrossRef] [Green Version]
  6. Wei, M.; Li, H.; Akram, M.A.; Dong, L.; Sun, Y.; Hu, W.; Gong, H.; Zhao, D.; Xiong, J.; Yao, S.; et al. Quantifiying Drought Resistance of Drylands in Northern China from 1982 to 2015: Regional Disparity in Drought Resistance. Forests 2022, 13, 100. [Google Scholar] [CrossRef]
  7. Stanturf, J.A.; Palik, B.J.; Dumroese, R.K. Contemporary Forest Restoration: A Review Emphasizing Function. For. Ecol. Manag. 2014, 331, 292–323. [Google Scholar] [CrossRef]
  8. German, D.A.; Shmakov, A.I.; Xian-Chun, Z.; Wen-Li, C.; Smirnov, S.V.; Lei, X.; Kamelin, R.V.; Jian, W. Some New Floristic Findings in Xinjiang, China. J. Syst. Evol. 2006, 44, 603. [Google Scholar] [CrossRef]
  9. Hermawan, A. Komposisi Species Pohon Hutan Pamah dan Keanekaragaman Artocarpus serta Pola Sebarannya di Hutan Adat Imbo Mangendai, Kabupaten Sorolangan, Provinsi Jambi. Masteral Degree Thesis, Universitas Indonesia, Depok, Indonesia, 2013. (In Indonesian). [Google Scholar]
  10. Sakai, A.; Arbain, A.; Sugiarti, S.; Rahmah, K.; Mirwanto, E.; Takahashi, M.; Ucok, A. Composition and Diversity of Tree Species After Fire Disturbance in A Lowland Tropical Forest in East Kalimantan, Indonesia. Biodiversitas 2022, 23, 1576–1587. [Google Scholar] [CrossRef]
  11. Anas, A. Studi Fisiologi Hutan Pamah di Zona Inti Bagian Tengah Taman Nasional Bukit Duabelas, Provinsi Jambi. Masteral Degree Thesis, Universitas Indonesia, Depok, Indonesia, 2013. (In Indonesian). [Google Scholar]
  12. Sheil, D.; Kartawinata, K.; Samsoedin, I.; Priyadi, H. The Lowland Forest Tree Community in Malinau, Kalimantan (Indonesia Borneo), Results From A One Hectare Plot. Plant Ecol. Divers. 2010, 3, 59–66. [Google Scholar] [CrossRef]
  13. Wang, F.; Eagle, M.; Kroeger, K.D.; Spivak, A.C.; Tang, J. Plant Biomass and Rates of Carbon Dioxide Uptake are Enhanced by Successful Restoration of Tidal Connectivity in Salt Marshes. Sci. Total Environ. 2021, 750, 141566. [Google Scholar] [CrossRef]
  14. Dharmawan, I.W.S.; Samsoedin, I. The Dynamics of Carbon Biomass Potential in Logged over Forest Landscapes in the Malinau Research Forest. J. For. Soc. Econ. Res. 2012, 9, 12–20. [Google Scholar] [CrossRef]
  15. Subiandono, E.; Bismark, M.; Heriyanto, N.M. Ability Avicennia Marina (Forsk.) Vierh. and Rhizophora Apiculata Bl. in the Absorption of Heavy Metal Pollutants. J. For. Res. Nat. Cons. 2013, 9, 23–32. [Google Scholar] [CrossRef] [Green Version]
  16. Indonesian Soil Research Institute. Land Map of Sumatra Island, Jambi Province; Indonesian Soil Research Institute: Bogor, Indonesia, 2018. [Google Scholar]
  17. Mueller-Dombois, D.; Ellenberg, H. Ekologi Vegetasi: Tujuan Dan Metode (Terjemahan Aims and Methods of Vegetation Ecology Oleh); Kartawinata, K., Abdulhadi, R., Eds.; LIPI Press & Yayasan Pustaka Obor: Jakarta, Indonesia, 2016. [Google Scholar]
  18. Mansur, M.; Kartawinata, K. Phytosociology of a Lower Montane Forest on Mt. Batulanteh, Sumbawa, Indonesia. Reinwardtia 2017, 16, 77–92. [Google Scholar] [CrossRef] [Green Version]
  19. Heriyanto, N.M.; Priatna, D.; Kartawinata, K.; Samsoedin, I. Structure and Composition of the Forests in Rantau Bertuah Protected Area, Siak Regency, Riau Province. Bot. Gard. Bull. 2020, 23, 69–81. [Google Scholar]
  20. WFO. World Flora Online; Published on the Internet. Available online: http://www.worldfloraonline.org (accessed on 15 August 2022).
  21. Garsetiasih, R.; Heriyanto, N.M.; Adinugroho, W.C.; Gunawan, H.; Dharmawan, I.W.S.; Sawitri, R.; Yeny, I.; Mindawati, N.; Denny. Connectivity of Vegetation Diversity, Carbon Stock, and Peat Depth in Peatland Ecosystems. Glob. J. Environ. Sci. Manag. 2022, 8, 369–388. [Google Scholar] [CrossRef]
  22. Chave, J.; Réjou-Méchain, M.; Búrquez, A.; Chidumayo, E.; Colgan, M.S.; Delitti, W.B.C.; Duque, A.; Eid, T.; Fearnside, P.M.; Goodman, R.C.; et al. Improved Allometric Models to Estimate the Aboveground Biomass of Tropical Trees. Glob. Chang. Biol. 2014, 20, 3177–3190. [Google Scholar] [CrossRef]
  23. Martin, A.R.; Thomas, S.C. A Reassessment of Carbon Content in Tropical Trees. PLoS ONE 2011, 6, e23533. [Google Scholar] [CrossRef] [PubMed] [Green Version]
  24. Heriyanto, N.M.; Samsoedin, I.; Bismark, M. Biodiversity of Flora and Fauna in the Bukit Datuk Dumai Forest Area, Riau Province. Sylva Lestari J. 2019, 7, 82–94. [Google Scholar] [CrossRef]
  25. Heriyanto, N.M.; Samsoedin, I.; Kartawinata, K. Tree Species Diversity, Structural Characteristics and Carbon Stock in a One-Hectare Plot of the Protection Forest Area in West Lampung Regency, Indonesia. Reinwardtia 2019, 18, 1–18. [Google Scholar] [CrossRef]
  26. Golden Agri-Resources; SMART. Laporan Penelitian Hutan Berstok Karbon Tinggi; Jakarta, Indonesia, 2012. Available online: https://www.goldenagri.com.sg/wp-content/uploads/2016/02/04062012-HCS-forest-study-report-Foreword-Exe-Summary-Bahasa.pdf (accessed on 20 September 2022).
  27. Slik, J.W.F.; Poulsen, A.D.; Ashton, P.S.; Cannon, C.H.; Eichhorn, K.A.O.; Kartawinata, K.; Lanniari, I.; Nagamasu, H.; Nakagawa, M.; Van Nieuwstadt, M.G.L.; et al. A Floristic Analysis of the Lowland Dipterocarp Forests of Borneo. J. Biogeogr. 2003, 30, 1517–1531. [Google Scholar] [CrossRef]
  28. Nursanti, N.; Novriyanti, N.; Cory, W. Various Types of Potential Drug Plants in Muhammad Sabki Urban Forest Jambi City. Media Konserv. 2018, 23, 169–177. [Google Scholar] [CrossRef]
  29. Sadili, A.; Kartawinata, K.; Soedjito, H.; Sambas, E. Tree Species Diversity in a Pristine Montane Forest Previously Untouched by Human Activities in Foja Mountains, Papua, Indonesia. Reinwardtia 2018, 17, 133–154. [Google Scholar] [CrossRef]
  30. Kartawinata, K. Diversitas Ekosistem Alami Indonesia: Ungkapan Singkat Dengan Sajian Foto Dan Gambar; Cetakan, K., Kartawinata, J.A., Abdulhadi, R., Eds.; LIPI Press; Yayasan PustakaObor Indonesia: Bogor, Indonesia, 2016. [Google Scholar]
  31. Samsoedin, I.; Heriyanto, N.M.; Bismark, M. Biodiversity of Flora and Fauna in Pertamina Bukit Datuk Dumai Forest Area, Riau Province. J. For. Res. Nat. Conserv. 2014, 11, 77–89. [Google Scholar] [CrossRef]
  32. Zeller, K.A.; Lewsion, R.; Fletcher, R.J.; Tulbure, M.G.; Jennings, M.K. Understanding the Importance of Dynamic Landscape Connectivity. Land 2020, 9, 303. [Google Scholar] [CrossRef]
  33. Widhi, S.J.K.; Murti, S.H. Forest Carbon Stock Estimation Using Landsat 8 Imagery in Tesso Nilo National Park, Riau. J. Bumi Indones. 2014, 3, 1–11. [Google Scholar]
  34. Dharmawan, I.W.S. Evaluasi Dinamika Cadangan Karbon Tetap Pada Hutan Gambut Primer Dan Bekas Terbakar Di Hampangen Dan Kalampangan, Kalimantan Tengah/Evaluation of the Dynamics of Fixed Carbon Stocks in Primary and Burnt Peat Forests in Hampangen and Kalampangan, Central; IPB University: Bogor, Indonesia, 2012. [Google Scholar]
  35. Yamani, A. Study of Carbon Content in Secondary Natural Forest in Mandiangin Education Forest, Faculty of Forestry UNLAM. Trop. For. J. 2013, 1, 85–91. [Google Scholar] [CrossRef]
  36. Sun, W.; Liu, X. Review on Carbon Storage Estimation of Forest Ecosystem and Applications in China. For. Ecosyst. 2020, 7, 4. [Google Scholar] [CrossRef] [Green Version]
  37. Zhao, M.; Yang, J.; Zhao, N.; Liu, Y.; Wang, Y.; Wilson, J.P.; Yue, T. Estimation of China’s Forest Stand Biomass Carbon Sequestration Based on the Continuous Biomass Expansion Factor Model and Seven Forest Inventories from 1977 to 2013. Ecol. Mgmt. 2019, 448, 528–534. [Google Scholar] [CrossRef]
  38. Kasaye, M.; Abebe, G.; Abiyu, A.; Wondie, M.; Belay, B. Selection of Different Trees/Shrubs Species for Rehabilitation of Degraded Lands in Wag-Lasta Area, Northeastern Ethiopia. Forest Res. 2020, 9, 231. [Google Scholar] [CrossRef]
Figure 1. The geographic location of the study area in the Riau, Jambi, West Kalimantan, and East Kalimantan Provinces. The Riau and Jambi Provinces belong to Sumatera Island, while West Kalimantan and East Kalimantan belong to Kalimantan Island.
Sustainability 15 01389 g001
Figure 2. Plot design of each study site in Riau, Jambi, West Kalimantan, and East Kalimantan provinces.
Sustainability 15 01389 g002
Figure 3. Graph of the forest stand structure in the research sites. This graph shows the number of trees per ha in each diameter class (cm) of the research sites.
Sustainability 15 01389 g003
Figure 4. Vertical profile of the stands on Sumatra Island (Riau, Jambi) and Kalimantan Island (West Kalimantan and East Kalimantan). This graph shows tree height (m) of each tree.
Sustainability 15 01389 g004
Table 1. Biophysical characteristic of each study site [16].
CharacteristicRiau ProvinceJambi ProvinceWest Kalimantan ProvinceEast Kalimantan Province
Altitude (asl)60406070
Topography (%)0–8 (gentle)0–3 (flat)0–8 (gentle)0–8 (gentle)
Soil
  • Red-Yellow Podzolic
  • pH 4–6
  • Low fertility
Alluvial-Podsolic, Red-Yellow Podsolic Association Reddish Brown
  • Red-yellow/ultisol podzolic
  • pH 4–6
  • Low fertility
  • Podsolic Red-Yellow/Ultisol
  • pH of 4–6
  • Low fertility
Vegetation categoryPamah tropical rainforestLowland tropical rainforestLowland tropical rainforestLowland tropical rainforest
Table 2. Parameters measured and analysis performed.
PlotParameterType of Analysis
  • 20 m × 20 m
  • 5 m × 5 m
Name of speciesSpecies composition
Endemicity
Conservation status
Number of speciesSpecies density
Frequency of speciesImportant value index
Shannon index
DBHStand biomass
Carbon stock
HeightStand biomass
Carbon stock
2 m × 2 mName of speciesSpecies composition
Endemicity
Conservation status
Number of speciesSpecies density
Frequency of speciesImportant value index
Shannon index
Table 3. Results of the number of trees per ha, the calculation of biomass and carbon stock, and the estimation of the CO2 equivalent in each research site.
SiteNumber of
Trees per ha
Biomass
Mg per ha
Carbon
Mg per ha
Carbondioxide Equivalent
Mg CO2eq per ha
Sumatra Island
RiauMean = 642Mean = 73.22Mean = 36.61Mean = 134.36
Median = 625Median = 74.47Median = 35.00Median = 140.00
Std dev = 200.61Std dev = 21.38Std dev = 14.54Std dev = 46.86
Std error = 40.12Std error = 4.28Std error = 2.91Std error = 9.37
JambiMean = 486Mean = 154.26Mean = 72.50Mean = 266.08
Median = 500Median = 159.94Median = 75.17Median = 275.87
Std dev = 97.92Std dev = 54.48Std dev = 25.61Std dev = 95.79
Std error = 19.58Std error = 10.90Std error = 5.12Std error = 19.16
Kalimantan Island
West KalimantanMean = 947Mean = 306.54Mean = 144.07Mean = 528.75
Median = 1025Median = 344.68Median = 162.00Median = 526.00
Std dev = 427.78Std dev = 116.24Std dev = 54.64 Std dev = 100.77
Std error = 85.55Std error = 23.25Std error = 10.93Std error = 20.15
East KalimantanMean = 386Mean = 102.20Mean = 47.94Mean = 175.94
Median = 375Median = 103.95Median = 48.85Median = 179.30
Std dev = 109.94Std dev = 32.03Std dev = 13.30Std dev = 44.98
Std error = 21.99Std error = 6.41Std error = 2.66Std error = 8.99
Table 4. Results of the chemical characteristics at each research site.
SitespH (H2O)C-org (%)N-total (%)P Bray (I/II)
(ppm)
OM (%)CEC (me 100g−1)BS (%)
Sumatra Island
Riau4.30.410.066.90.711.4238.82
Jambi4.20.320.054.40.553.2217.04
Kalimantan Island
East Kalimantan4.40.280.051.60.483.0215.16
West Kalimantan4.20.480.0911.00.834.9311.03
SitesNH4OAc 1N pH 7 ExtractionKCl
Ca (me 100g−1)Mg (me 100g−1)K (me 100g−1)Na (me 100g−1)Al (me 100g−1)H (me 100g−1)
Sumatra Island
Riau0.170.040.070.262.011.29
Jambi0.140.080.040.290.761.08
Kalimantan Island
East Kalimantan0.140.040.070.211.430.28
West Kalimantan0.170.060.090.223.211.56
Table 5. Old shrubs typology based on the vegetation composition and the carbon dynamic in each research site location. The vegetation composition consists of the dominant plant species and the diversity index. The carbon dynamic consist of the carbon stock and the plant species with a high carbon stock.
TypologySumatra IslandKalimantan Island
RiauJambiWest KalimantanEast Kalimantan
Vegetation composition
Dominant SpeciesCalophyllum macrocarpum Hook.f., Shorea leprosula Miq., Gironniera nervosa Planch, Lithocarpus gracilis (Korth.) Soepadmo, Palaquium sumatranum BurckAstronia macrophylla Blume, Nauclea orientalis (L.) L., Xerospermum noronhianum (Blume) BlumeCombretocarpus rotundatus (Miq.) Danser, Porterandia glabrifolia Ridl., Alstonia scholaris (L.) R.Br.Macaranga gigantea (Rchb.f. & Zoll.) Mull.Arg., Melicope denhamii (Seem.) T.G. Hartley, Shorea seminis (de Vriese) Slooten
Diversity IndexMean = 2.66Mean = 2.50Mean = 1.64Mean = 1.80
Median = 2.63Median = 2.43Median = 1.56Median = 1.88
Std dev = 0.24Std dev = 0.19Std dev = 0.33Std dev = 0.40
Std error = 0.05Std error = 0.04Std error = 0.07Std error = 0.08
Carbon Dynamic
Carbon Stock (Mg C per ha)Mean = 36.61Mean = 72.50Mean = 144.07Mean = 47.94
Median = 35.00Median = 75.17Median = 162.00Median = 48.85
Std dev = 14.54Std dev = 25.61Std dev = 54.64Std dev = 13.30
Std error = 2.91Std error = 5.12Std error = 10.93Std error = 2.66
Species with high carbon stockShorea dasyphylla Foxw., Calophyllum macrocarpum Hook.f., Lithocarpus gracilis (Korth.) SoepadmoPrunus arborea (Blume) Kalkman, Alseodhapne bancana Miquel, Agelaea trinervis (Llanos) Merr. Combretocarpus rotundatus (Miq.) Danser, Porterandia sp., Maccaranga gigantea (Rchb.f. & Zoll.) Muell.Arg.Macaranga gigantea (Rchb.f. & Zoll.) Mull. Arg., Melicope lunu-akenda (Gaertn.) T.G. Hartley, Callicarpa pentandra Roxb.
Species with endemisityDryobalanops oblongifolia Dyer.
Intsia palembanica Miq.
Euodia aromatica Blume Garcinia dioica BlumeDracontomelon dao Merr.& Rolfe., Dipterocarpus caudiferus Merr.
Species with conservation priorityIntsia palembanica Miq.Lophopetalum javanicum (Zoll.)Turz.Dryobalaops abnormis V.Sl.Eusideroxylon zwageri Teijsm. & Binn.
Biogeography Flora of Sundaland Flora of Sundaland Flora of Sundaland Flora of Sundaland
Table 6. Diversity index at tree, sapling, and seedling stage in each location of the research sites.
SitesDiversity Index at Various Plant Stages
TreesSaplingsSeedlings
Sumatra Island
RiauMean = 2.66 b *Mean = 1.23 bMean = 0.67 b
Median = 2.63Median = 1.24Median = 0.67
Std dev = 0.24Std dev = 0.28Std dev = 0.27
Std error = 0.05Std error = 0.06Std error = 0.05
JambiMean = 2.50 bMean = 1.50 cMean = 1.11 c
Median = 2.43Median = 1.49Median = 1.09
Std dev = 0.19Std dev = 0.35Std dev = 0.43
Std error = 0.04Std error = 0.07Std error = 0.09
Kalimantan Island
West KalimantanMean = 1.64 aMean = 1.00 abMean = 0.52 a
Median = 1.56Median = 1.05Median = 0.62
Std dev = 0.33Std dev = 0.35Std dev = 0.33
Std error = 0.07Std error = 0.07Std error = 0.07
East KalimantanMean = 1.80 aMean = 1.02 aMean = 0.81 b
Median = 1.88Median = 1.02Median = 0.80
Std dev = 0.40Std dev = 0.41Std dev = 0.52
Std error = 0.08Std error = 0.08Std error = 0.10
* Significant using the one-way ANOVA test at a level of α < 0.05. Numbers followed by the same letters are not significantly different.
Disclaimer/Publisher’s Note: The statements, opinions and data contained in all publications are solely those of the individual author(s) and contributor(s) and not of MDPI and/or the editor(s). MDPI and/or the editor(s) disclaim responsibility for any injury to people or property resulting from any ideas, methods, instructions or products referred to in the content.

