
Evaluation of Land Carrying Capacity of 31 Provinces in China Based on a Natural–Societal-Supply–Demand Framework

Abstract
:1. Introduction
2. Materials and Methods
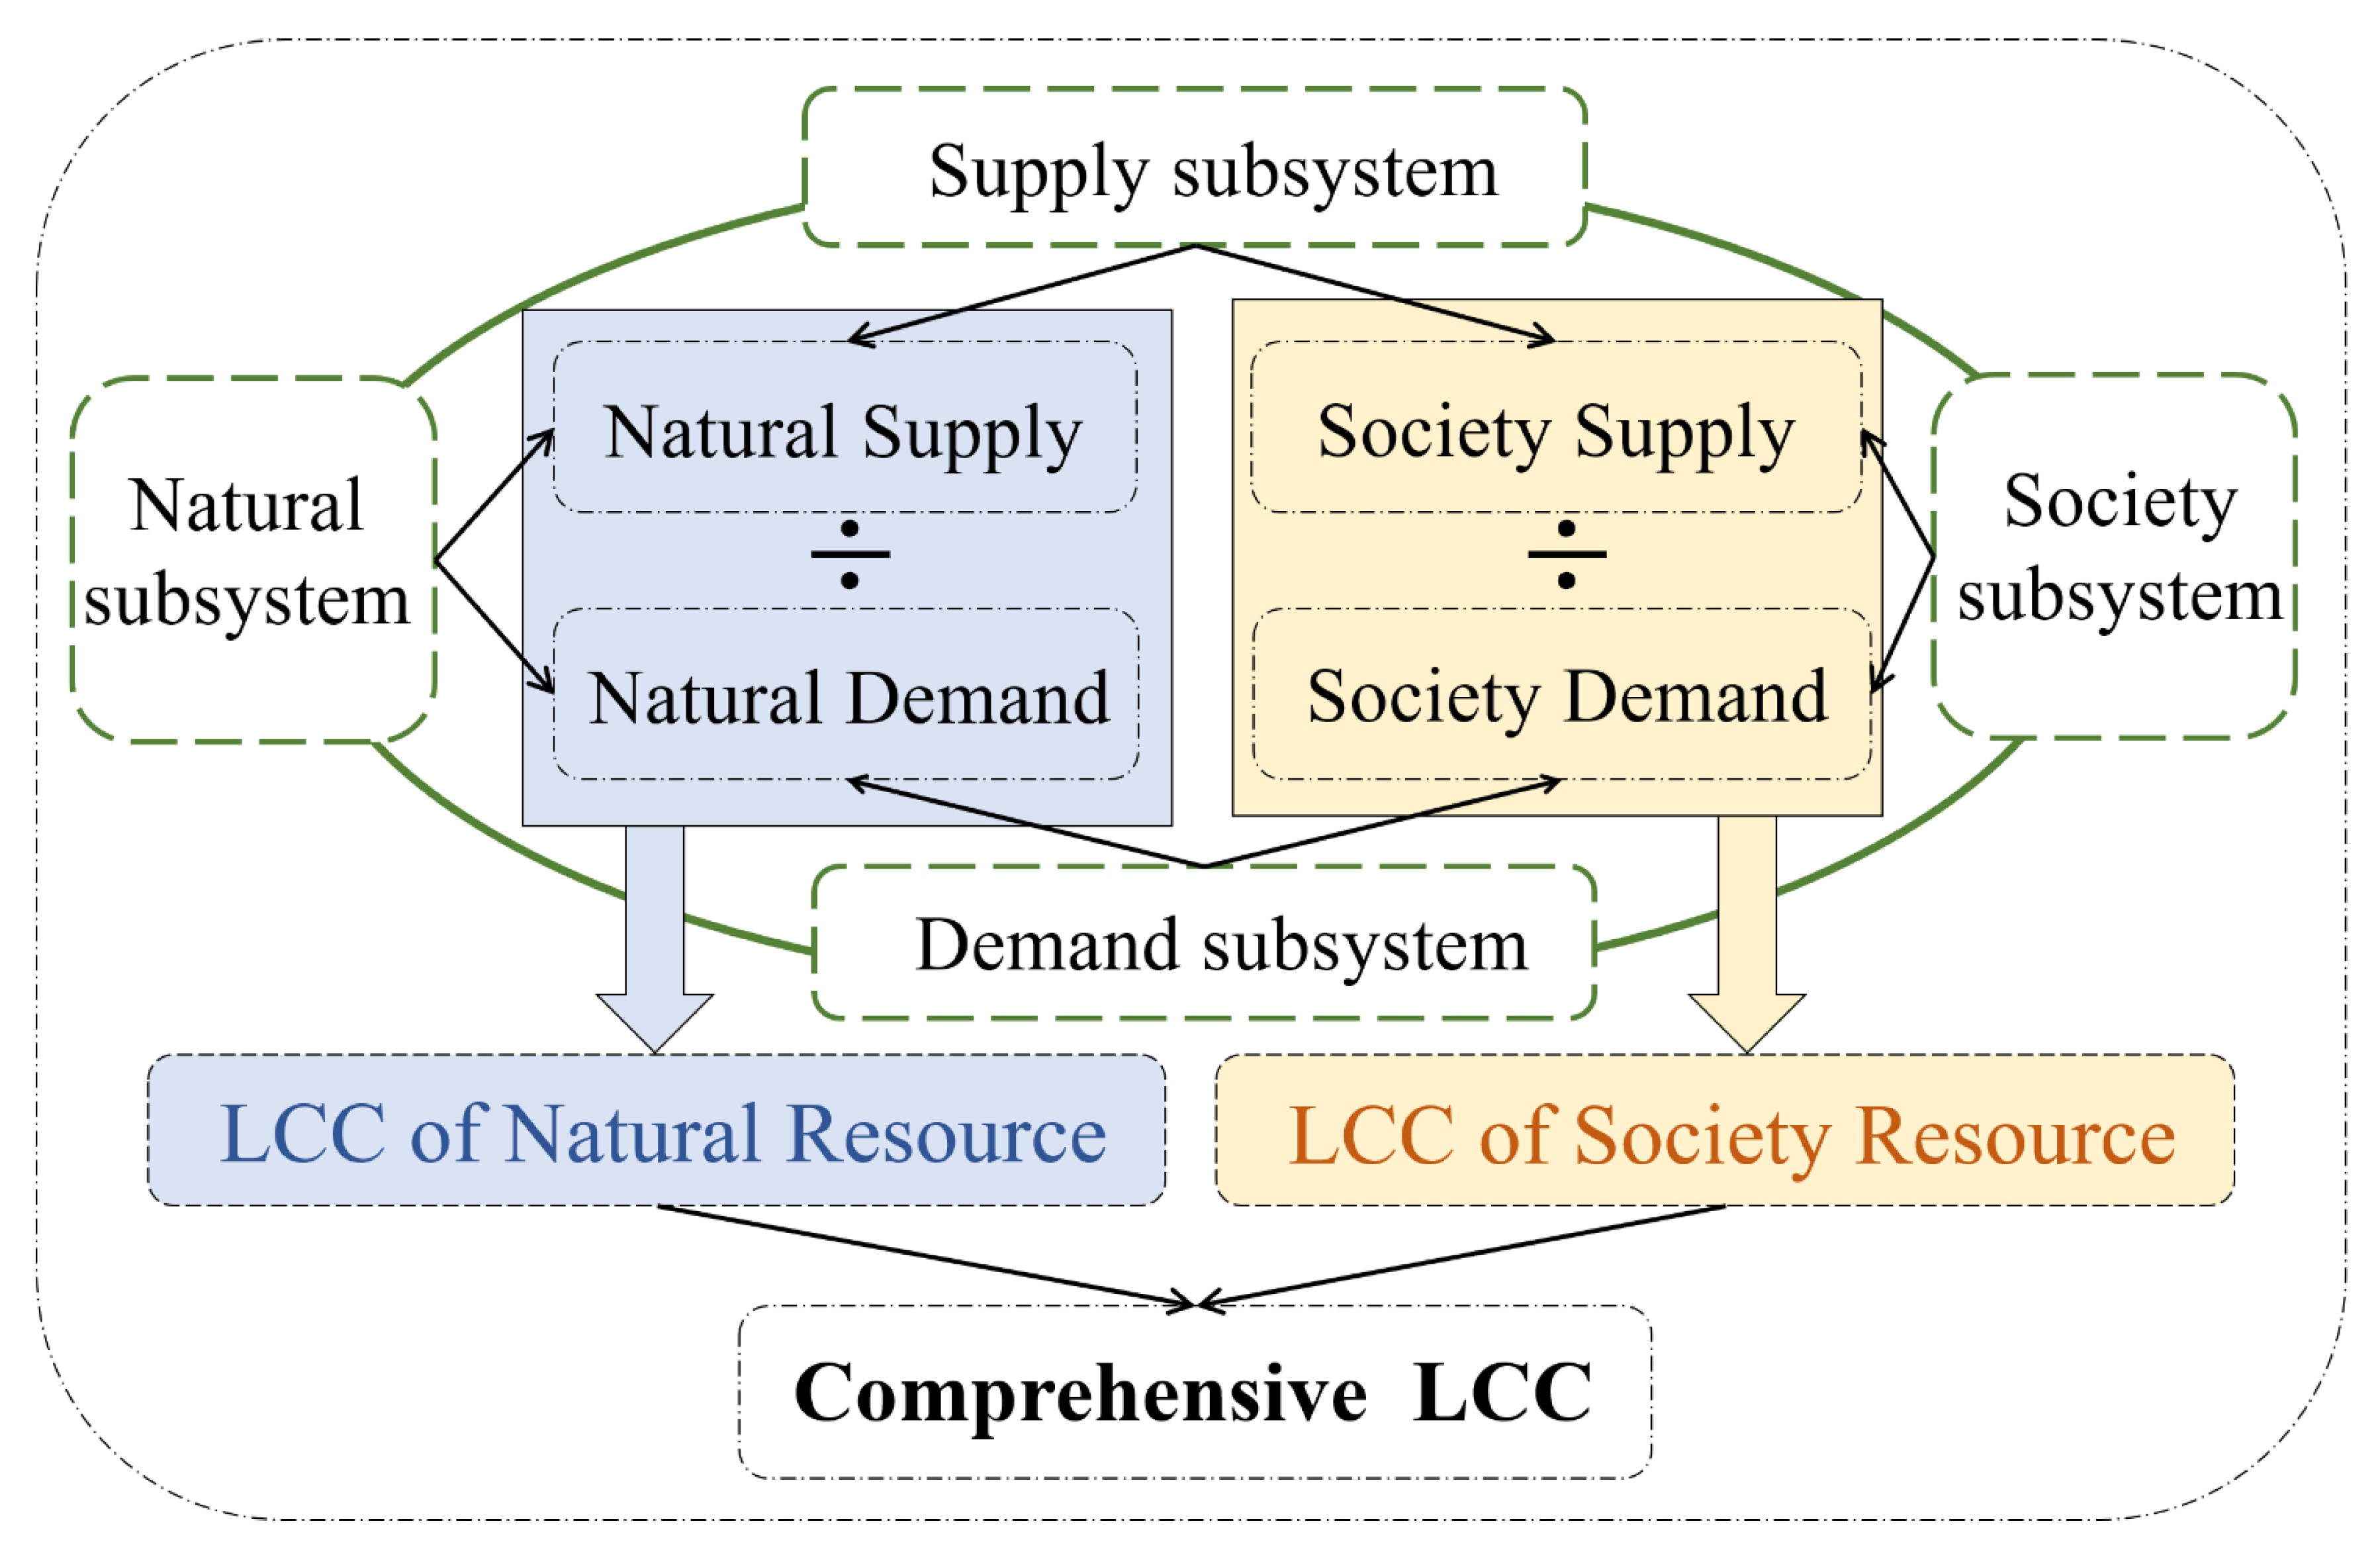
2.1. Establish Evaluation Framework
2.2. Evaluation Indicators
2.2.1. Food
2.2.2. Air
2.2.3. Shelters
2.2.4. Water
2.2.5. Transportation, Public Facilities, Education
2.3. Evaluation Method of Each Subsystem
2.3.1. Standardization of Indicators
2.3.2. Find the Optimal Vector
2.3.3. Calculate the Gray Correlation Coefficient
2.3.4. Determine the Weight
2.4. Calculation of LCC and Its Classification
2.5. Obstacles Indicators Analysis
2.6. Data Sources
3. Results
3.1. The Evaluation Results of Each Subsystem
- (1)
- The spatial distribution of the NS is generally low in the northwest and high in the southeast; the highest value is distributed along the four major rivers of China. Among them, the NS of Heilongjiang province is highest in all provinces, which is approximately 2.5 times higher than the average value and almost 34 times higher than the lowest one (Qinghai province). The NS of Heilongjiang, Anhui, Henan, Shandong, Sichuan, and Yunnan are all significantly higher than other provinces. Beijing, Tianjin, Shanghai, Hainan, and Ningxia are significantly lower than the average.
- (2)
- The spatial distribution of the SS is very different from that of the NS. The SS is low in the southwest and northeast, and high in the south-central area of China. The highest value was mainly distributed in several major urban agglomerations: Beijing-Tianjin-Hebei Urban Agglomeration, Yangtze River Delta, Chengdu-Chongqing Urban Agglomeration and Guangdong-Hong Kong-Macao Urban Agglomeration. The SS of Guangdong province is highest and is approximately 2.0 times than the average value. The SS of Hebei, Jiangsu, Henan, Shandong, Hunan, and Sichuan are all significantly higher than other provinces. The SS of Tianjin, Shanghai, Hainan, Tibet, Qinghai, and Ningxia are significantly lower than the average.
- (3)
- The ND of the 31 provinces ranges from 0.05 to 1.00. Guangdong has the highest ND, which is 3.12 times than the average. The value of Guangdong, Jiangsu, Shandong, Henan, and Sichuan are significantly higher than the others, and Tianjin, Shanghai, Hainan, Tibet, Qinghai, and Ningxia are obviously lower than the average. The spatial distribution of the highest value is more obviously concentrated in several urban agglomerations.
- (4)
- The SD of the 31 provinces ranges from 0.10 to 0.78. Guangdong has the highest value and is 2.32 times higher than the average. Other high SD provinces include Jiangsu, Shandong, and Henan. Additionally, the SD of Tianjin, Beijing, Shanghai, Jilin, Heilongjiang, Hainan, Tibet, and Qinghai are obviously lower than the average. Compared with the ND, the spatial distribution of the high value areas of the SD is more concentrated.
- (5)
- According to the curve in Figure 2 and the value of CV, it shows that the four subsystems vary greatly between provinces, and their spatial distribution is very uneven. The CV of ND is the highest among the four subsystems. However, the curve of the NS and SS are relatively similar. The value of the SS is higher than that of the NS, except in Jilin, Heilongjiang, Anhui, Yunnan, and Tibet. The curve of the ND and SD are not only very similar in trend, but also in value. The values of the ND and SD are very close in most provinces, but they have great differences in some provinces, especially in Guangdong, Sichuan, Tibet, and Hainan.
3.2. Analysis of LCC
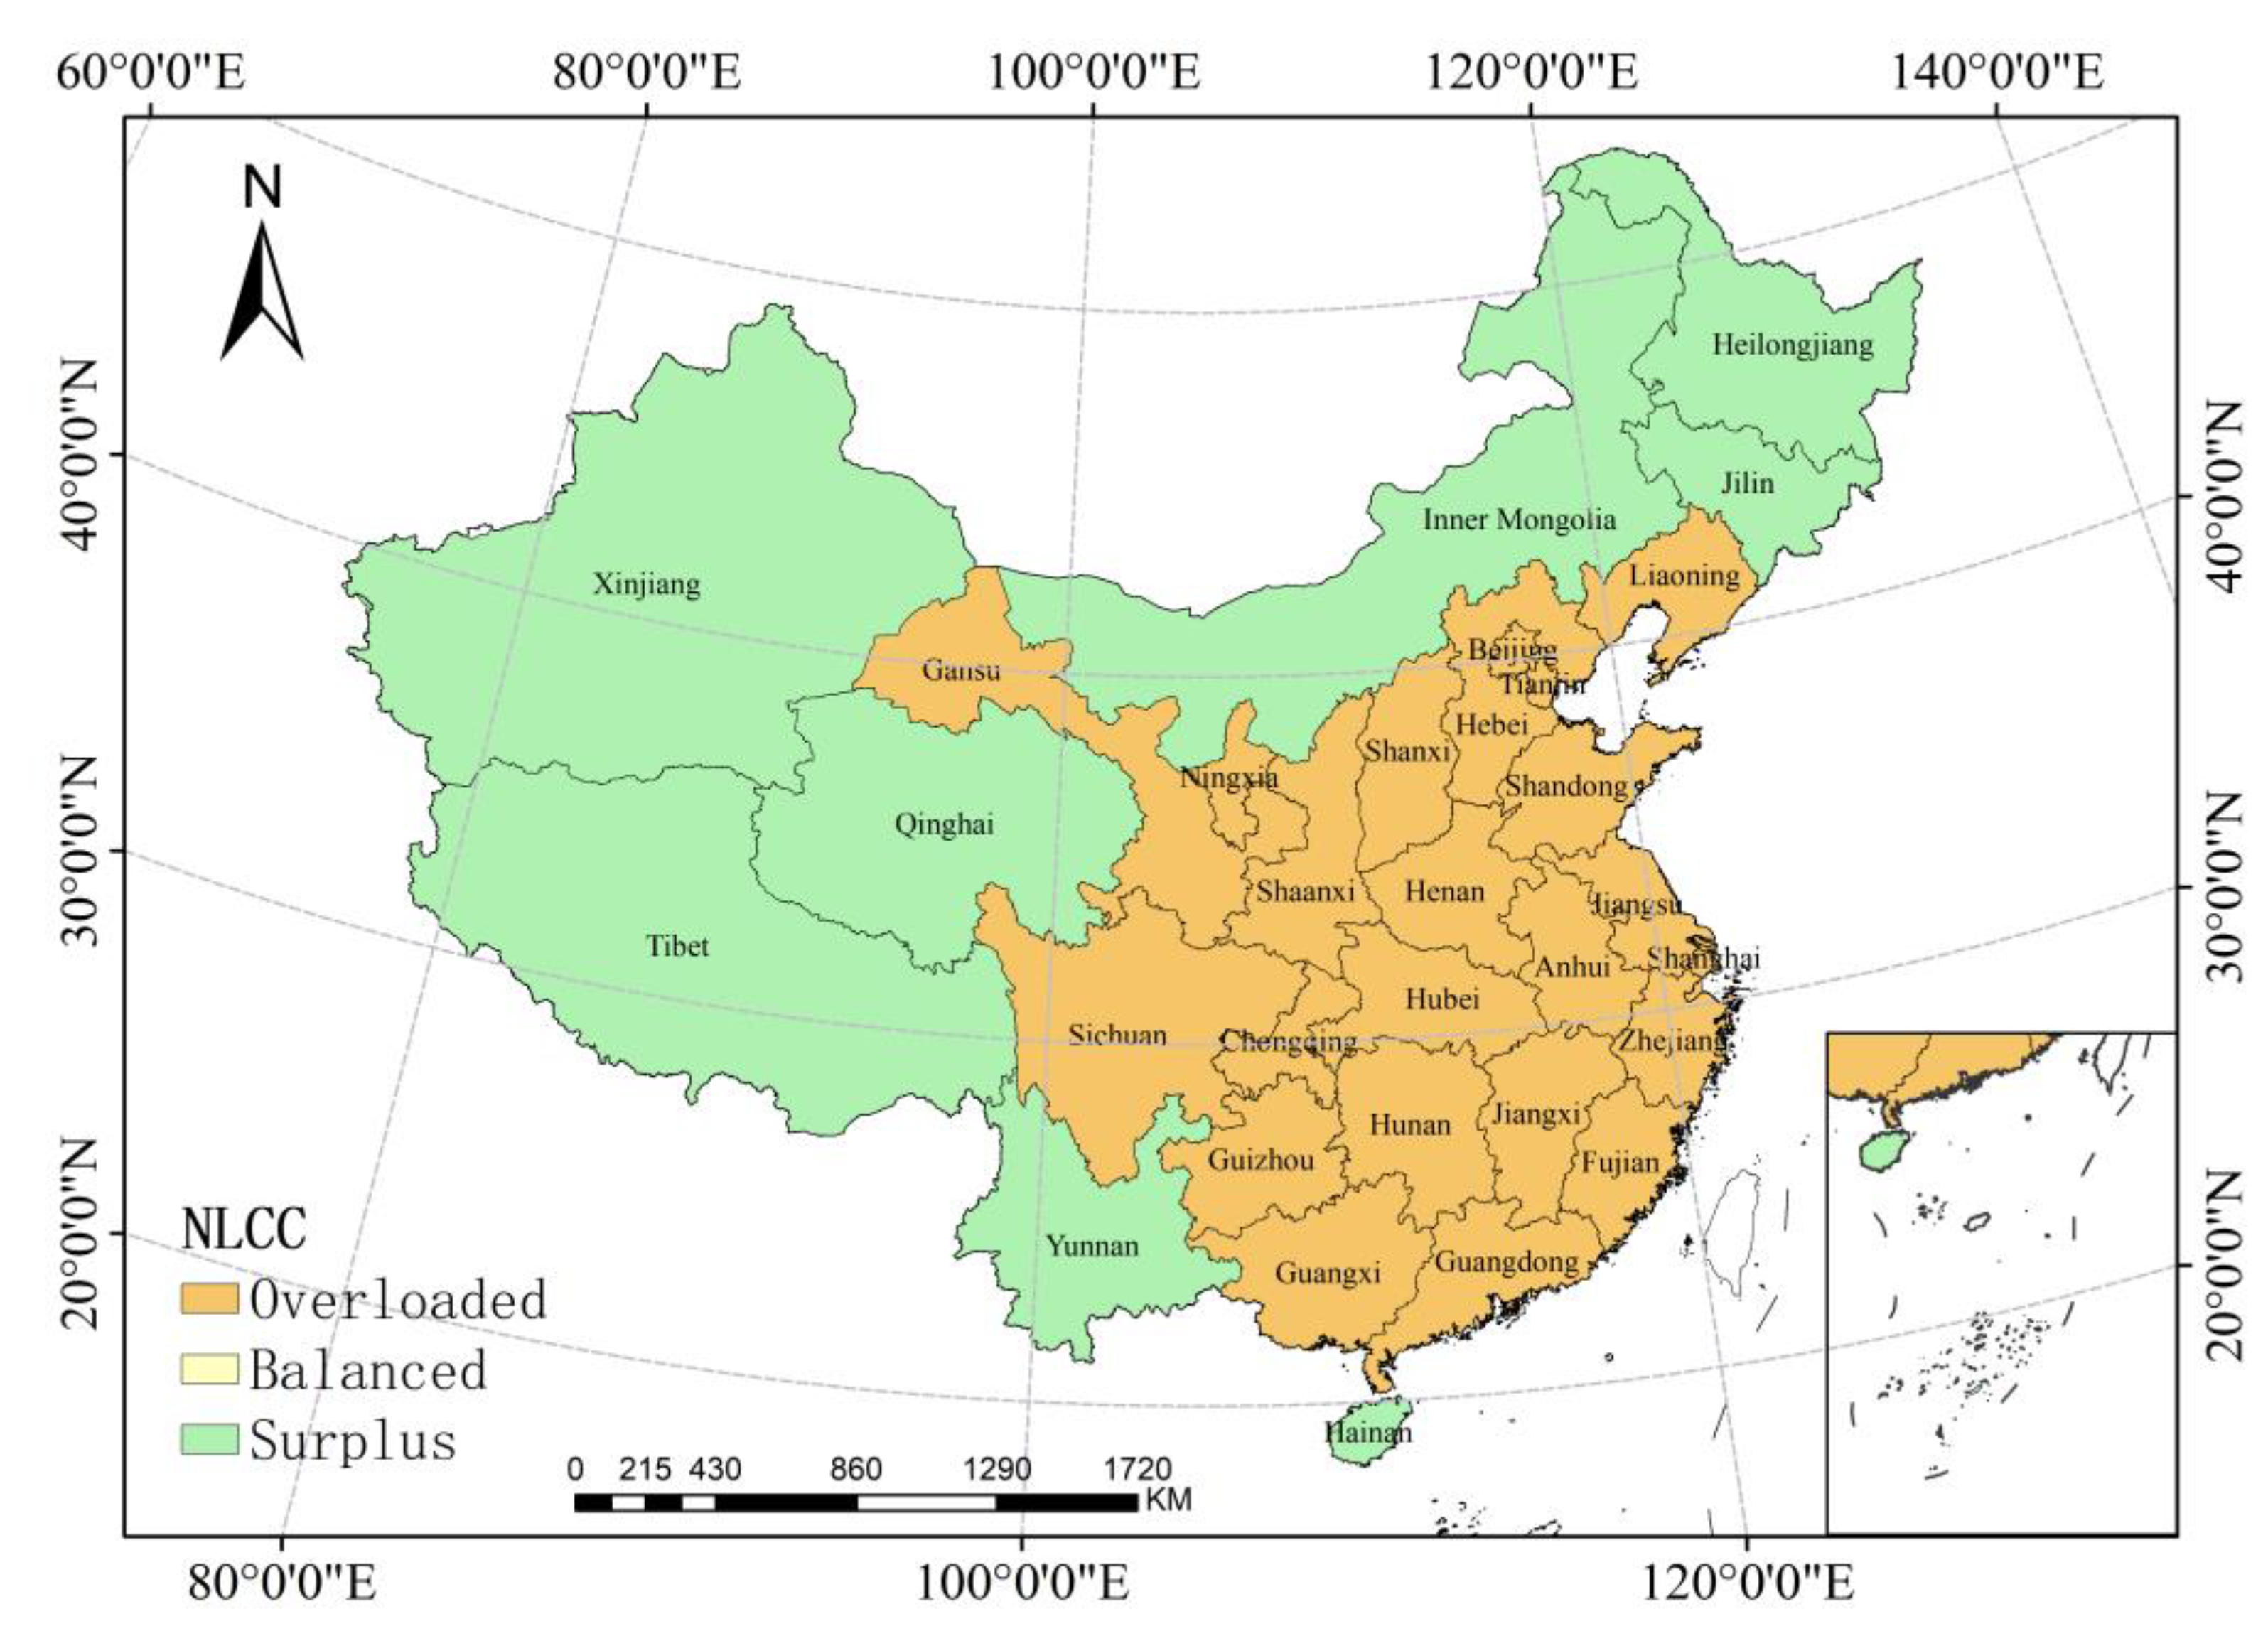
- (1)
- The natural subsystems of most provinces in China cannot meet the natural needs of human beings. Only 7 provinces belong to surplus regions of NLCC, and 23 provinces are overloaded with NLCC. Surplus provinces are concentrated in the sparsely populated provinces in northeast and southwest China. Most of the overloaded provinces are concentrated in the southeast of China. Among them, Guangdong, Beijing, Tianjin, Shanghai, and Zhejiang are seriously overloaded. The other 6 provinces in central and southeast China are slightly overloaded, and 12 provinces are obviously overloaded.
- (2)
- The overload of the societal subsystem seems not as serious as that of the natural subsystem, and the societal supply of most provinces can meet the societal needs of humans. There are 24 provinces belonging to surplus regions in SLCC. The surplus area is mainly located in Northeast China. SLCC is overloaded in 7 provinces, including Ningxia, Guizhou, Henna, Anhui, Jiangsu, Tibet and Hainan.
- (3)
- The number of overloaded provinces in LCC is 17, which is obviously less than that of NLCC and much more than that in SLCC. The overloaded provinces are mainly concentrated in the eastern coastal area and the middle-east of China. The distribution of surplus area coincides with that of NLCC and CLCC.
3.3. Obstacles Indicators Analysis
- (1)
- The NLCC overloaded province can be divided into three types, according to the primary obstacle indicators. Among them, Beijing, Tianjin, Shanxi, Shanghai, Jiangsu, Anhui, Shandong, Gansu, Qinghai, Ningxia, and Xinjiang are mainly limited by NPP; Fujian, Jiangxi, Hubei, Hunan, Chongqing, Sichuan, Guizhou, Yunnan, and Shaanxi are mainly limited by area of the residential land; Hebei, Liaoning, and Henan are mainly limited by water resources.
- (2)
- The SLCC overloaded province can be divided into three types, according to the primary obstacle indicators of SLCC: Jiangsu is mainly limited by area of afforestation, Henan and Anhui are mainly limited by area of other construction land, and Hainan, Ningxia, Tibet, and Guizhou are mainly limited by investment in urban infrastructure.
- (3)
- The LCC overloaded province can be divided into two types according to the obstacle indicators: Hebei, Shanxi, Shanghai, Jiangsu, Zhejiang, Anhui, Fujian, Hubei, Hunan, Guangdong, Hainan, Chongqing, Shaanxi, and Ningxia are mainly limited by natural obstacles, and Shandong, Henan, and Guizhou are limited by both natural and societal obstacles.
- (4)
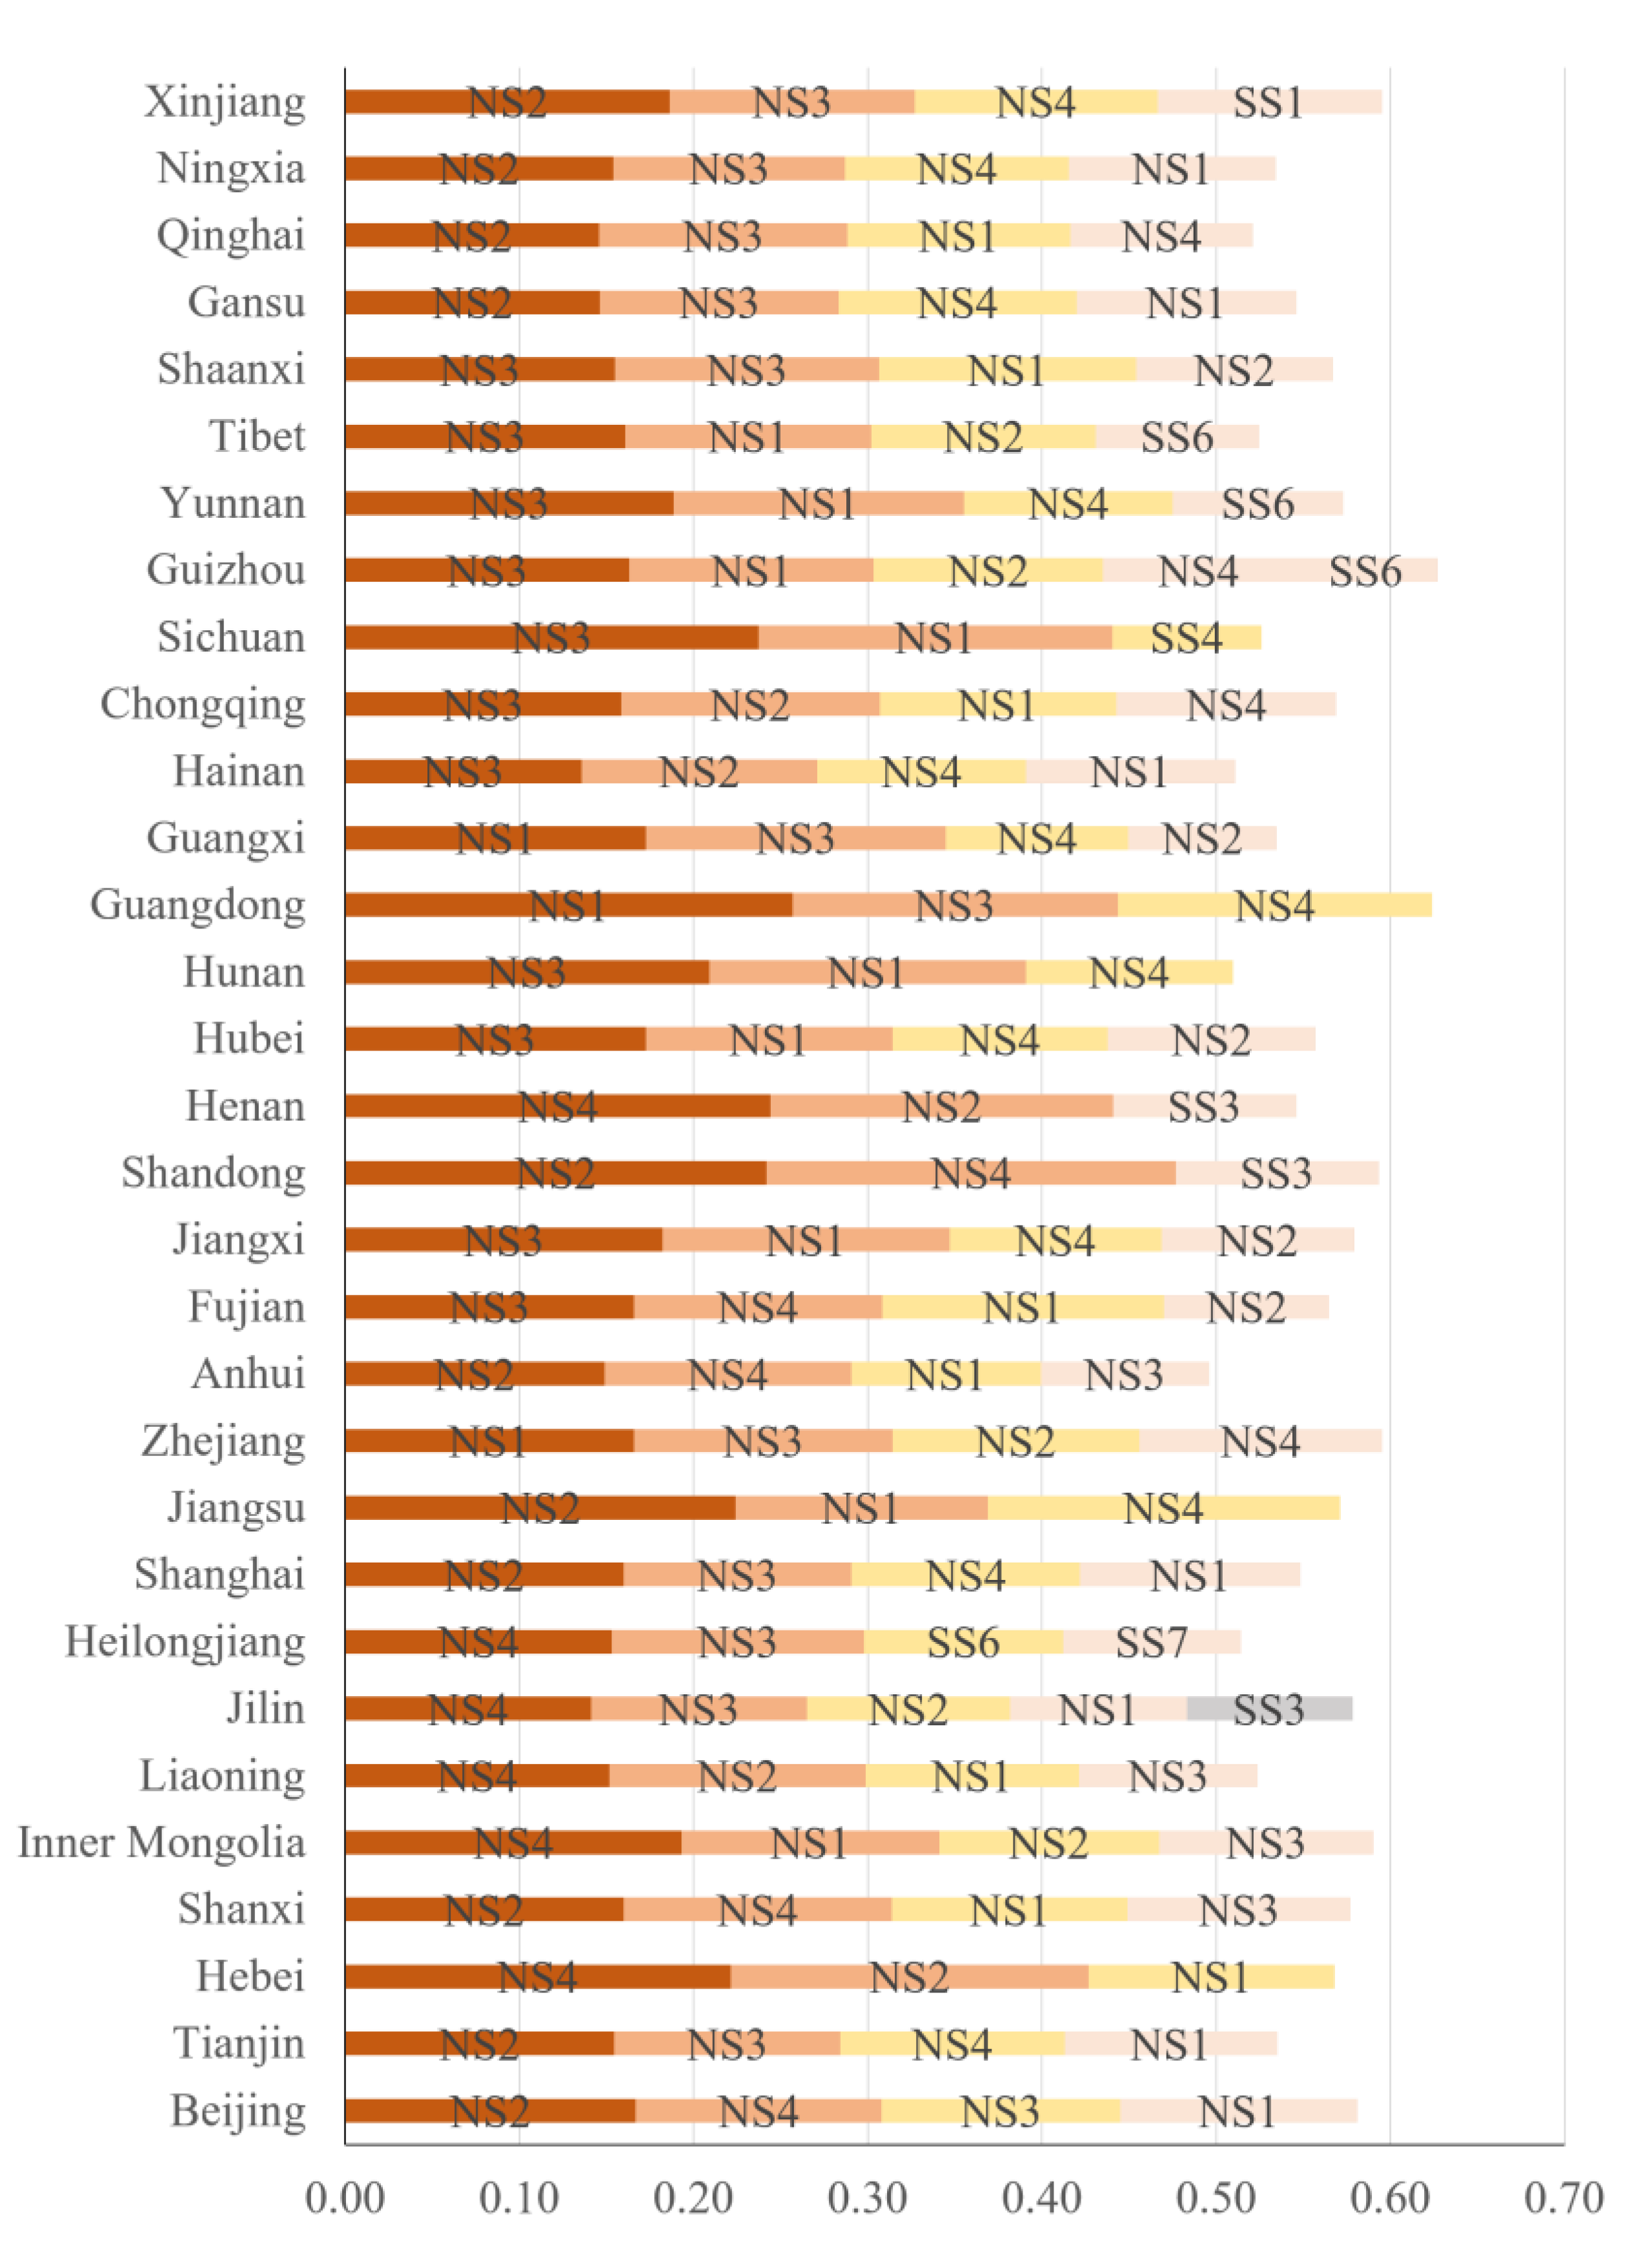
- The shortage of natural resources is the key factor affecting LCC overloading in most provinces. Agroclimatic potential productivity (NS1), NPP (NS2), area of the residential land (NS3), and total water resources (NS4) were the most common obstacle indicators of LCC in China. Among the 31 provinces, there were 11 provinces primarily limited by NPP, 11 provinces primarily limited by area of the residential land, 6 provinces primarily limited by total water resources, and 3 provinces primarily limited by agroclimatic potential productivity.
- (5)
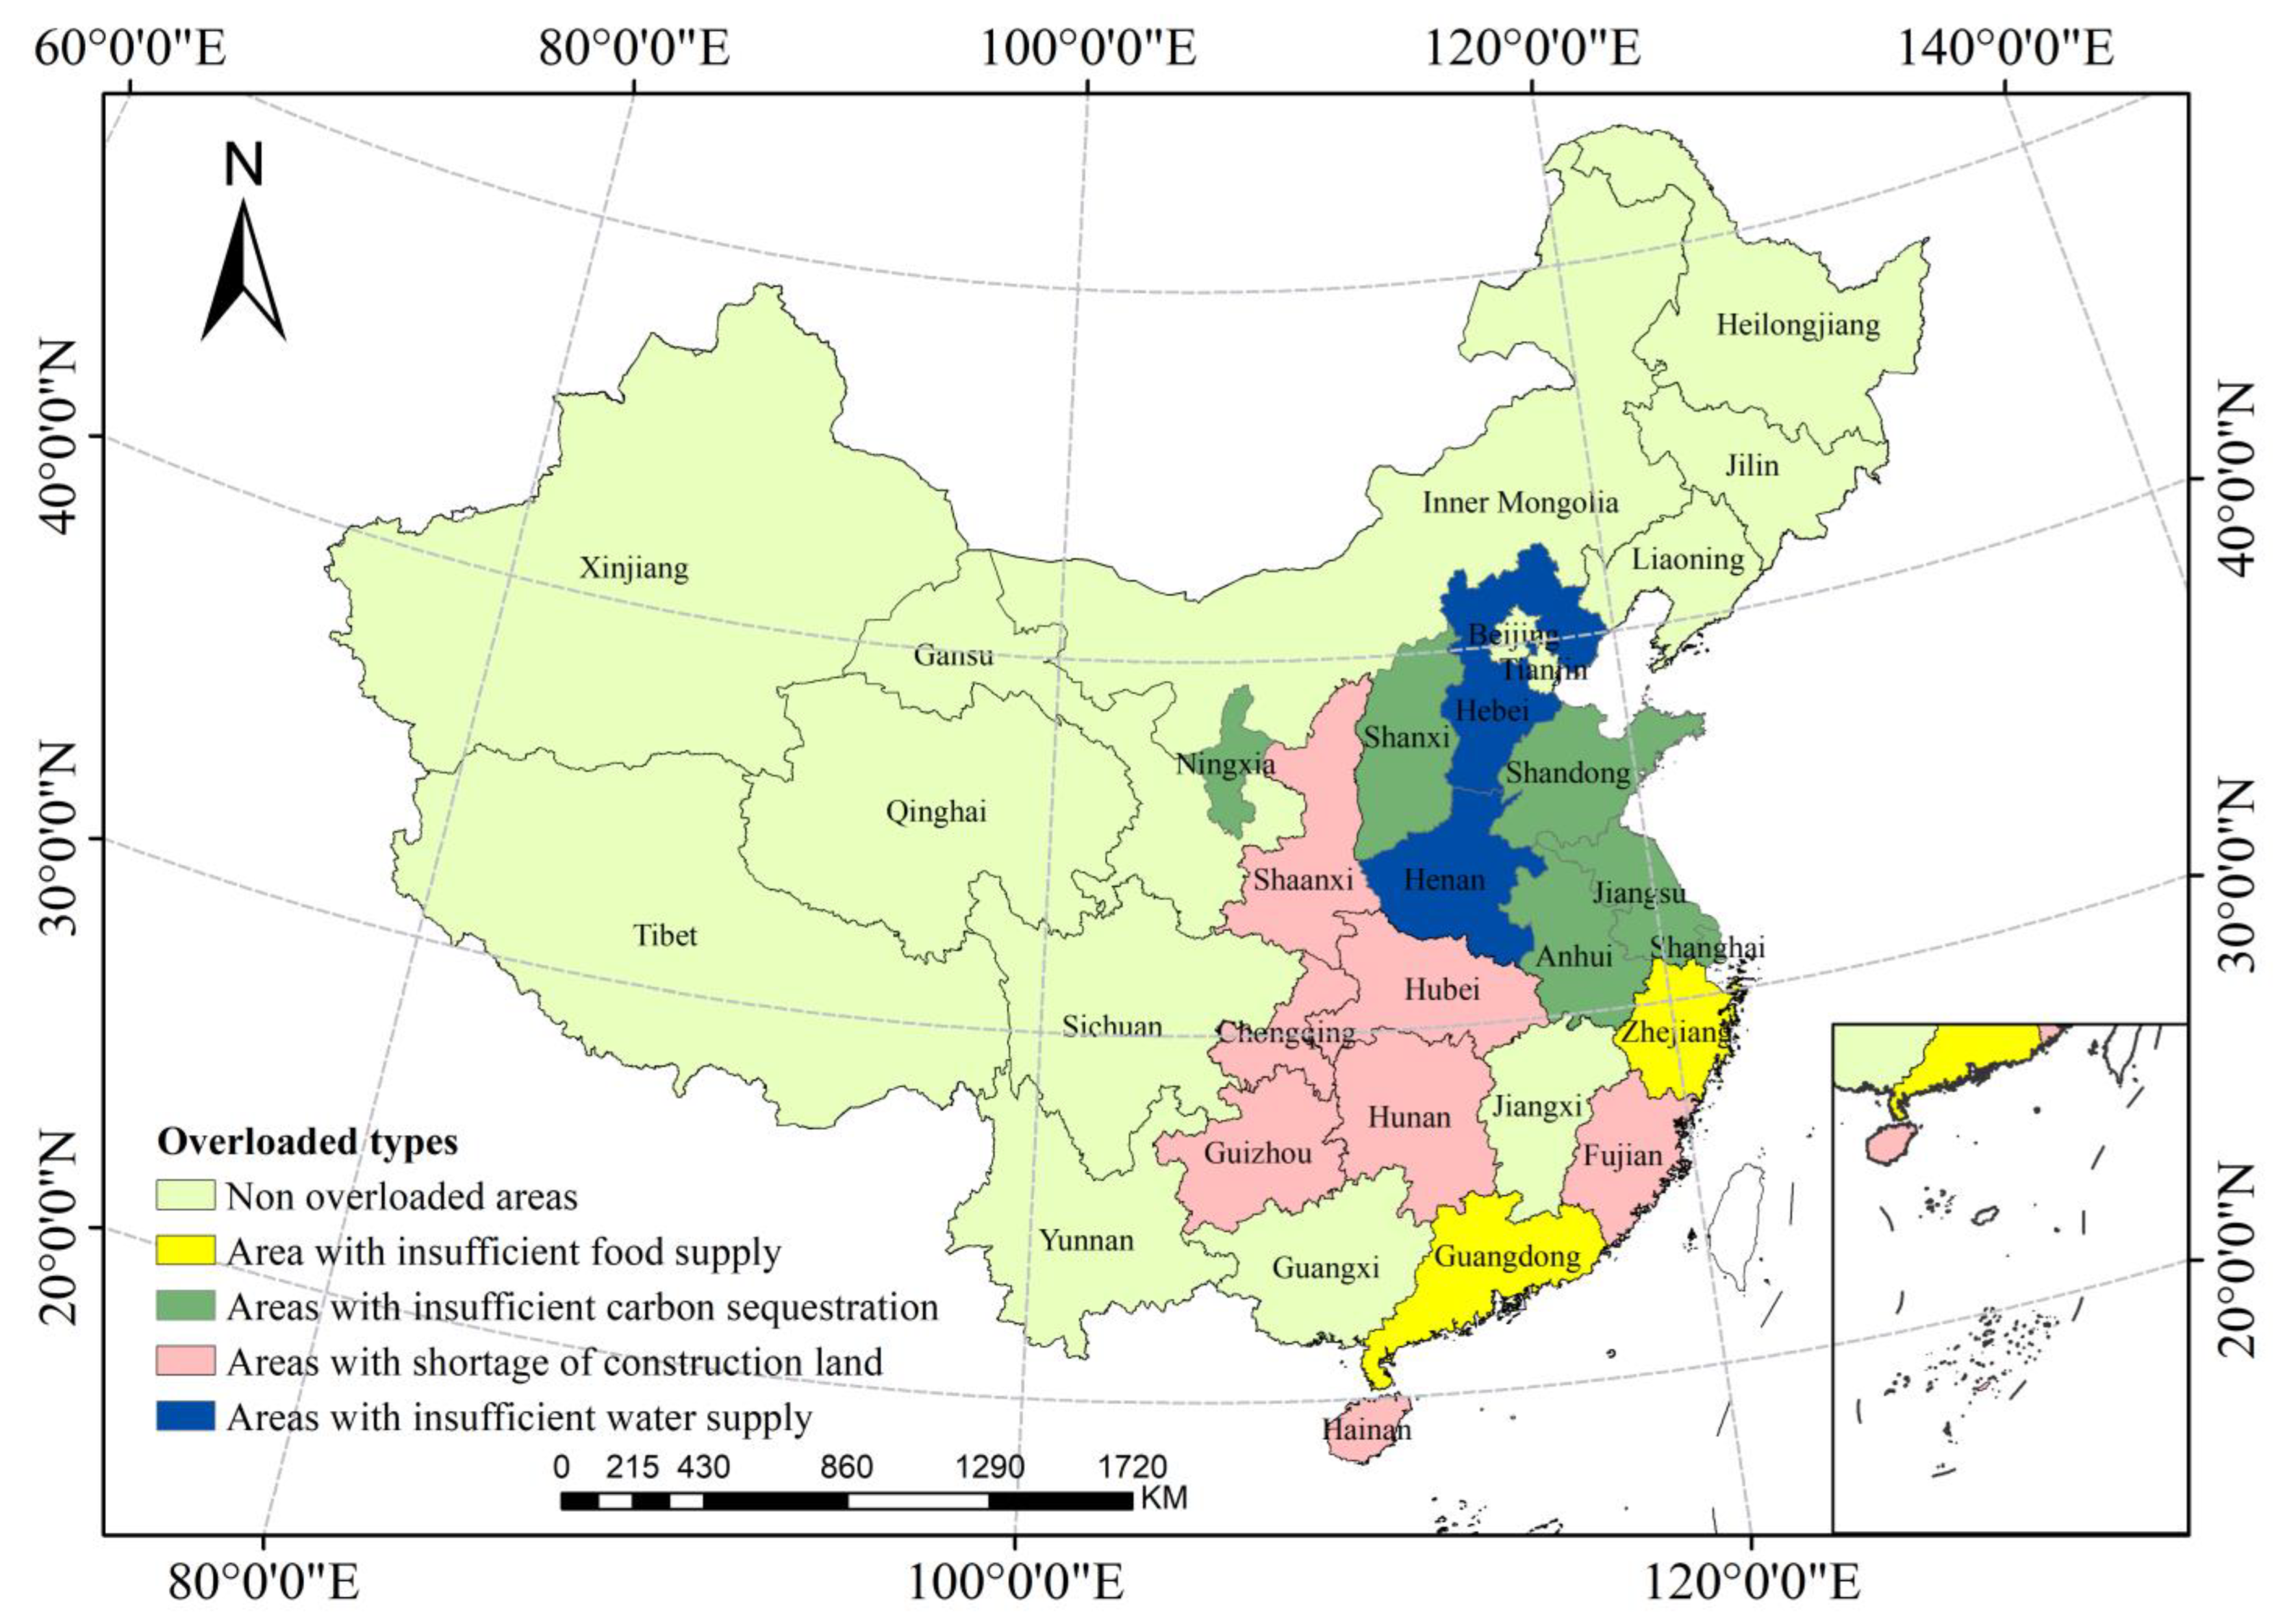
- According to the corresponding physiological supply of these primary obstacle indicators, the overloaded types can be classified into four types: areas with an insufficient food supply, areas with an insufficient carbon sequestration, areas with a shortage of construction land, and areas with an insufficient water supply. Figure 8 shows the spatial distribution of these areas. Areas with an insufficient food supply were mainly in the southeast, areas with an insufficient carbon sequestration and areas with an insufficient water supply were concentrated in north China, and areas with a shortage of construction land were concentrated in central China. These obstacle indicators are the main problems that need to be solved in the future for these regions.
4. Discussion
5. Conclusions
- (1)
- The NS of China shows great regional differences. The distribution of the NS is generally low in the northwest and high in the southeast of China, and the highest area is distributed along the four major rivers of China. Heilongjiang has the highest NS, while Qinghai has the lowest. The NS of 23 provinces cannot meet the natural needs of human beings, among which Guangdong, Beijing, Tianjin, Shanghai, and Zhejiang are seriously overloaded.
- (2)
- The SS is low in the southwest and northeast, and high in the south central area of China. The highest value of SS mainly coincides with the several major urban agglomerations. The societal subsystem of 7 provinces cannot meet the societal needs, among which Ningxia, Guizhou, Henna, Anhui, and Jiangsu are slightly overloaded, and Tibet and Hainan are obviously overloaded.
- (3)
- The number of overloaded provinces in LCC is 17, and most of them are concentrated in the middle-east and eastern coastal area of China. The societal subsystem of Beijing, Tianjin, Hebei, Jiangsu, Yunnan, and Shanghai has significantly made up for the shortcomings of the NS, and has improved the comprehensive LCC.
- (4)
- The shortage of natural resources is the key factor affecting LCC overloading in most provinces. Agroclimatic potential productivity, NPP, area of the residential land, and total water resources were the most common obstacle indicators of LCC. Hebei, Shanxi, Shanghai, Jiangsu, Zhejiang, Anhui, Fujian, Hubei, Hunan, Guangdong, Hainan, Chongqing, Shaanxi, and Ningxia are mainly limited by natural obstacles; meanwhile, Shandong, Henan, and Guizhou are limited by both natural and societal obstacles.
- (5)
- The areas with an insufficient food supply were mainly in the southeast, the areas with an insufficient carbon sequestration and the areas with insufficient water supply were concentrated in north China, and areas with a shortage of construction land were concentrated in central China. For China, ensuring food security, achieving carbon neutrality, improving the use efficiency of construction land, and rationally allocating water resources, are the key points to improve LCC and realize the sustainable utilization of land resources.
Author Contributions
Funding
Institutional Review Board Statement
Informed Consent Statement
Data Availability Statement
Acknowledgments
Conflicts of Interest
References
- National Bureau of Statistics of China. Nanjing. 2020. Available online: http://data.stats.gov.cn (accessed on 5 July 2022).
- Wei, X.; Shen, L.; Liu, Z.; Luo, L.; Chen, Y. Comparative analysis on the evolution of ecological carrying capacity between provinces during urbanization process in China. Ecol. Indic. 2020, 112, 106179. [Google Scholar] [CrossRef]
- Shi, Y.; Shi, S.; Wang, H. Reconsideration of the methodology for estimation of land population carrying capacity in Shanghai metropolis. Sci. Total Environ. 2018, 652, 367–381. [Google Scholar] [CrossRef] [PubMed]
- Tong, S.; Feng, Z.; Yang, Y.; Lin, Y.; Wu, Y. Research on Land Resource Carrying Capacity: Progress and Prospects. J. Resour. Ecol. 2018, 9, 331–340. [Google Scholar] [CrossRef]
- Lin, L.; Liu, Y.; Chen, J.; Zhang, T.; Zeng, S. Comparative analysis of environmental carrying capacity of the Bohai Sea Rim area in China. J. Environ. Monit. 2011, 13, 3178. [Google Scholar] [CrossRef]
- Liu, R.Z.; Borthwick, A.G.L. Measurement and assessment of carrying capacity of the environment in Ningbo, China. J. Environ. Manag. 2011, 92, 2047–2053. [Google Scholar] [CrossRef]
- Malthus, T.R. Essai sur le principe de population—En tant qu’il influe sur le progrès futur de la société, avec des remarques sur les théories de M. Godwin, de M. Condorcet et d’autres auteurs suivi de Une vue sommaire du principe de population. Sib. Math. J. 1980. [Google Scholar]
- Savari, M.; Yazdanpanah, M.; Rouzaneh, D. Factors affecting the implementation of soil conservation practices among Iranian farmers. Sci. Rep. 2022, 12, 8396. [Google Scholar] [CrossRef]
- Kumar, P.; Rai, S.C.; Verma, R. Evaluating the status of gross and net food availability in special reference to carrying capacity of land of Sikkim. Curr. Res. Environ. Sustain. 2021, 3, 100099. [Google Scholar] [CrossRef]
- Yanti, R. The Sustainable of Environmental Carrying Capacity to Support on Food Security (Nagari Sulit Air, X Koto Diatas District, Solok, West Sumatra). IOP Conf. Ser. Earth Environ. Sci. 2018, 197, 012030. [Google Scholar] [CrossRef]
- Čuček, L.; Klemeš, J.J.; Kravanja, Z. A Review of Footprint analysis tools for monitoring impacts on sustainability. J. Clean. Prod. 2012, 34, 9–20. [Google Scholar] [CrossRef]
- Yang, Y.; Cai, Z. Ecological security assessment of the Guanzhong Plain urban agglomeration based on an adapted ecological footprint model. J. Clean. Prod. 2020, 260, 120973. [Google Scholar] [CrossRef]
- Liao, S.; Wang, D.; Xia, C.; Tang, J. China’s provincial process CO2 emissions from cement production during 1993–2019. Sci. Data 2022, 9, 165. [Google Scholar] [CrossRef] [PubMed]
- Cheng, J.; Zhou, K.; Chen, D.; Fan, J. Evaluation and analysis of provincial differences in resources and environment carrying capacity in China. Chin. Geogr. Sci. 2016, 26, 539–549. [Google Scholar] [CrossRef]
- Luan, C.; Liu, R.; Peng, S.; Li, W. Improving integrated environmental zoning from the perspective of logic scoring of preference and comparative advantage: A case study of Liangjiang New Area, China. J. Clean. Prod. 2021, 325, 129350. [Google Scholar] [CrossRef]
- Wu, K.; Chen, K.; Gao, Y.; Jiang, S.; Huang, H. Applying a Set of Potential Methods for the Integrated Assessment of the Marine Eco-Environmental Carrying Capacity in Coastal Areas. Sustainability 2022, 14, 4416. [Google Scholar] [CrossRef]
- Guo, S.; Li, C.; Liu, S.; Zhou, K. Land carrying capacity in rural settlements of three gorges reservoir based on the system dynamic model. Nat. Resour. Model. 2018, 31, e12152. [Google Scholar] [CrossRef]
- Liu, H. Comprehensive carrying capacity of the urban agglomeration in the Yangtze River Delta, China. Habitat Int. 2012, 36, 462–470. [Google Scholar] [CrossRef]
- Wei, C.; Guo, Z.Y.; Wu, J.P.; Ye, S.F. Constructing an assessment indices system to analyze integrated regional carrying capacity in the coastal zones—A case in Nantong. Ocean Coast. Manag. 2014, 93, 51–59. [Google Scholar] [CrossRef]
- Xu, K.; Wang, J.; Wang, J.; Wang, X.; Chi, Y.; Zhang, X. Environmental function zoning for spatially differentiated environmental policies in China. J. Environ. Manag. 2020, 255, 109485.1–109485.10. [Google Scholar] [CrossRef]
- Maslow, A.H. Dynamics of personality organization. II. Psychol. Rev. 1943, 50, 541–558. [Google Scholar] [CrossRef]
- Ren, Y.; Shen, L.; Wei, X.; Wang, J.; Cheng, G. A guiding index framework for examining urban carrying capacity. Ecol. Indic. 2021, 133, 108347. [Google Scholar] [CrossRef]
- Zhou, W.; Elshkaki, A.; Zhong, S.; Shen, L. Study on relative carrying capacity of land resources and its zoning in 31 provinces of China. Sustainability 2021, 13, 1459. [Google Scholar] [CrossRef]
- Pu, L.; Zhang, S.; Yang, J.; Chang, L.; Xiao, X. Assessing the impact of climate changes on the potential yields of maize and paddy rice in Northeast China by 2050. Theor. Appl. Climatol. 2020, 140, 167–182. [Google Scholar] [CrossRef]
- Du, Q.; Wang, N.; Che, L. Forecasting China’s Per Capita Carbon Emissions Under a New Three-Step Economic Development Strategy. J. Resour. Ecol. 2015, 6, 318–323. [Google Scholar]
- Fang, J.Y.; Yang, Y.H.; Wenhong, M.A.; Mohammat, A.; Shen, H.H. Ecosystem carbon stocks and their changes in China’s grasslands. Sci. China 2010, 53, 757–765. [Google Scholar] [CrossRef]
- Liu, Z.; Guan, D.; Wei, W.; Davis, S.J.; Ciais, P.; Bai, J.; Peng, S.; Zhang, Q.; Hubacek, K.; Marland, G. Reduced carbon emission estimates from fossil fuel combustion and cement production in China. Nature 2015, 524, 335–338. [Google Scholar] [CrossRef] [Green Version]
- Fischer, G.; Nachtergaele, F.O.; Prieler, S.; Teixeira, E.; Tóth, G.; Velthuizen, H.V.; Verelst, L.; Wiberg, D. Global Agro-Ecological Zones (GAEZ v3.0); IIASA: Laxenburg, Austria; FAO: Rome, Italy, 2012. [Google Scholar]
- Traill, W.B.; Bedouin, R.; Gourlie, K.; Husch, J.; Lustre, A. Report of the Evaluation of Codex Alimentarius and other FAO and WHO Food Standards Work. Acta Gastro-Enterol. Belg. 2003, 28, 10–32. [Google Scholar]
- Food and Agriculture Organization of the United Nations. Population supporting capacity of land in the Asia and Pacific Region: Note by FAO; Unpublished; FAO: Rome, Italy, 1982. [Google Scholar]
- IPCC Climate Change 2007, Synthesis Report. 2008. Available online: http://www.ipcc.ch/publications_and_data/ar4/syr/en/contents.html (accessed on 5 July 2022).
- Zhang, F.; Wang, Y.; Ma, X.; Wang, Y.; Yang, G.; Zhu, L. Evaluation of resources and environmental carrying capacity of 36 large cities in China based on a support-pressure coupling mechanism. Sci. Total Environ. 2019, 688, 838–854. [Google Scholar] [CrossRef]
- Kuo, Y.; Yang, T.; Huang, G.W. The use of grey relational analysis in solving multiple attribute decision-making problems. Comput. Ind. Eng. 2008, 55, 80–93. [Google Scholar] [CrossRef]
- Huang, H.; Wang, R.; Wang, J.; Chai, J.; Xiao, Y. Temporal and spatial evolution and obstacle diagnosis of resource and environment carrying capacity in the Loess Plateau. PLoS ONE 2021, 16, e0256334. [Google Scholar] [CrossRef]


| Indicators | Natural Subsystem | Societal Subsystem |
|---|---|---|
| Supply subsystem | NS1: Agroclimatic potential productivity | SS1: The improvement of productivity |
| NS2: NPP | SS2: Area of afforestation | |
| NS3: Area of the residential land | SS3: Area of other construction land | |
| NS4: Natural water resources | SS4: Total water supply | |
| <Null> | SS5: Length of transport routes | |
| <Null> | SS6: Investment in urban infrastructure | |
| <Null> | SS7: Expenditure for education | |
| Demand subsystem | ND1: Theoretical per capita grain demand | SD1: Grain consumption per capita |
| ND2: The total carbon sequestration from human respiration and household energy consumption | SD2: The total carbon sequestration from the fossil fuels combustion and cement production | |
| ND3: Total residential land demand | SD3: Total public land demand. | |
| ND4: Residents’ water consumption | SD4: Water consumption of industry | |
| <Null> | SD5: Sum of passenger traffic and freight traffic | |
| <Null> | SD6: GDP | |
| <Null> | SD7: Average school enrolment per 100,000 population |
| Indicators | Calculation Method | Data Source |
|---|---|---|
| NS1 | GAEZ model | GAEZ v3.0 [28] |
| NS2 | MOD17A | |
| NS3 | Land use and cover data | |
| NS4 | The water resources bulletins of China in 2021 | |
| SS1 | Actual productivity–Potential productivity | 2021 China Statistics Yearbook |
| SS2 | China Statistics Yearbook in 2021 | |
| SS3 | Total construction land-Residential land | Land use and cover data |
| SS4 | The water resources bulletins of China in 2021 | |
| SS5 | China Statistics Yearbook in 2021 | |
| SS6 | China Statistics Yearbook in 2021 | |
| SS7 | China Statistics Yearbook in 2021 | |
| ND1 | Per capita food demand [29,30] | China Statistics Yearbook in 2021 |
| ND2 | IPCC emission factor method [13,31] | National standard of China: GB 50137—2011 |
| ND3 | Per capita residential land demand × Population | National standard of China: GB 50137—2011 |
| ND4 | The water resources bulletins of China in 2021 | |
| SD1 | China Statistics Yearbook in 2021 | |
| SD2 | IPCC emission factor method [13,31] | China Statistics Yearbook in 2021 |
| SD3 | Per public land demand × Population | National standard of China: GB 50137—2011 |
| SD4 | The water resources bulletins of China in 2021 | |
| SD5 | China Statistics Yearbook in 2021 | |
| SD6 | China Statistics Yearbook in 2021 | |
| SD7 | China Statistics Yearbook in 2021 |
| Categories | LCC (NLCC, SLCC) |
|---|---|
| Surplus | LCC > 1 |
| Balanced | LCC = 1 |
| Overloaded | LCC < 1 |
| NS | SS | ND | SD | |
|---|---|---|---|---|
| Average | 0.2650 | 0.3926 | 0.3209 | 0.3470 |
| Standard deviation | 0.1593 | 0.1781 | 0.2333 | 0.1764 |
| Coefficient of variation (CV) | 0.6009 | 0.4537 | 0.7270 | 0.5082 |
| NS1 | NS2 | NS3 | NS4 | SS1 | SS2 | SS3 | SS4 | SS5 | SS6 | SS7 | |
|---|---|---|---|---|---|---|---|---|---|---|---|
| Beijing | 0.136 | 0.167 | 0.137 | 0.141 | 0.070 | 0.077 | 0.086 | 0.074 | 0.022 | 0.037 | 0.053 |
| Tianjin | 0.122 | 0.154 | 0.130 | 0.129 | 0.061 | 0.075 | 0.065 | 0.069 | 0.063 | 0.070 | 0.062 |
| Hebei | 0.141 | 0.206 | 0.071 | 0.221 | 0.058 | 0.042 | 0.000 | 0.087 | 0.078 | 0.028 | 0.068 |
| Shanxi | 0.135 | 0.160 | 0.128 | 0.154 | 0.057 | 0.054 | 0.046 | 0.078 | 0.053 | 0.067 | 0.068 |
| Inner Mongolia | 0.148 | 0.126 | 0.123 | 0.193 | 0.034 | 0.000 | 0.009 | 0.081 | 0.083 | 0.105 | 0.097 |
| Liaoning | 0.122 | 0.147 | 0.103 | 0.152 | 0.062 | 0.073 | 0.060 | 0.072 | 0.052 | 0.085 | 0.072 |
| Jilin | 0.101 | 0.117 | 0.124 | 0.141 | 0.038 | 0.076 | 0.095 | 0.072 | 0.070 | 0.090 | 0.075 |
| Heilongjiang | 0.000 | 0.002 | 0.145 | 0.153 | 0.127 | 0.105 | 0.115 | 0.056 | 0.081 | 0.115 | 0.102 |
| Shanghai | 0.127 | 0.160 | 0.131 | 0.131 | 0.065 | 0.077 | 0.080 | 0.062 | 0.047 | 0.068 | 0.052 |
| Jiangsu | 0.145 | 0.224 | 0.047 | 0.202 | 0.056 | 0.123 | 0.100 | 0.000 | 0.058 | 0.005 | 0.039 |
| Zhejiang | 0.166 | 0.142 | 0.149 | 0.140 | 0.077 | 0.085 | 0.033 | 0.072 | 0.058 | 0.032 | 0.046 |
| Anhui | 0.108 | 0.149 | 0.097 | 0.142 | 0.066 | 0.088 | 0.096 | 0.059 | 0.078 | 0.049 | 0.069 |
| Fujian | 0.162 | 0.095 | 0.166 | 0.143 | 0.068 | 0.068 | 0.038 | 0.065 | 0.074 | 0.055 | 0.066 |
| Jiangxi | 0.165 | 0.111 | 0.182 | 0.122 | 0.034 | 0.065 | 0.058 | 0.062 | 0.078 | 0.054 | 0.069 |
| Shandong | 0.114 | 0.242 | 0.000 | 0.235 | 0.049 | 0.116 | 0.058 | 0.088 | 0.049 | 0.000 | 0.049 |
| Henan | 0.091 | 0.196 | 0.051 | 0.244 | 0.018 | 0.105 | 0.094 | 0.088 | 0.043 | 0.000 | 0.068 |
| Hubei | 0.142 | 0.120 | 0.173 | 0.123 | 0.066 | 0.070 | 0.041 | 0.057 | 0.060 | 0.076 | 0.072 |
| Hunan | 0.182 | 0.118 | 0.209 | 0.119 | 0.008 | 0.015 | 0.052 | 0.058 | 0.074 | 0.090 | 0.075 |
| Guangdong | 0.257 | 0.137 | 0.187 | 0.181 | 0.076 | 0.096 | 0.002 | 0.046 | 0.000 | 0.018 | 0.000 |
| Guangxi | 0.173 | 0.086 | 0.172 | 0.104 | 0.058 | 0.076 | 0.071 | 0.059 | 0.083 | 0.044 | 0.074 |
| Hainan | 0.120 | 0.135 | 0.136 | 0.120 | 0.064 | 0.072 | 0.074 | 0.066 | 0.072 | 0.077 | 0.064 |
| Chongqing | 0.136 | 0.148 | 0.159 | 0.126 | 0.054 | 0.047 | 0.070 | 0.075 | 0.062 | 0.058 | 0.065 |
| Sichuan | 0.203 | 0.054 | 0.237 | 0.077 | 0.000 | 0.072 | 0.081 | 0.086 | 0.070 | 0.046 | 0.074 |
| Guizhou | 0.140 | 0.132 | 0.163 | 0.110 | 0.053 | 0.051 | 0.064 | 0.073 | 0.074 | 0.082 | 0.059 |
| Yunnan | 0.167 | 0.000 | 0.189 | 0.120 | 0.052 | 0.056 | 0.077 | 0.081 | 0.089 | 0.098 | 0.072 |
| Tibet | 0.141 | 0.129 | 0.161 | 0.000 | 0.070 | 0.073 | 0.094 | 0.078 | 0.087 | 0.092 | 0.074 |
| Shaanxi | 0.148 | 0.113 | 0.155 | 0.152 | 0.057 | 0.049 | 0.070 | 0.079 | 0.051 | 0.062 | 0.065 |
| Gansu | 0.126 | 0.146 | 0.137 | 0.137 | 0.066 | 0.041 | 0.065 | 0.068 | 0.069 | 0.078 | 0.067 |
| Qinghai | 0.128 | 0.146 | 0.143 | 0.105 | 0.066 | 0.043 | 0.073 | 0.072 | 0.073 | 0.083 | 0.069 |
| Ningxia | 0.119 | 0.154 | 0.133 | 0.128 | 0.060 | 0.065 | 0.065 | 0.063 | 0.072 | 0.074 | 0.066 |
| Xinjiang | 0.107 | 0.186 | 0.141 | 0.139 | 0.129 | 0.067 | 0.016 | 0.000 | 0.069 | 0.077 | 0.068 |
Disclaimer/Publisher’s Note: The statements, opinions and data contained in all publications are solely those of the individual author(s) and contributor(s) and not of MDPI and/or the editor(s). MDPI and/or the editor(s) disclaim responsibility for any injury to people or property resulting from any ideas, methods, instructions or products referred to in the content. |
© 2023 by the authors. Licensee MDPI, Basel, Switzerland. This article is an open access article distributed under the terms and conditions of the Creative Commons Attribution (CC BY) license (https://creativecommons.org/licenses/by/4.0/).
Share and Cite
Hu, H.; Han, L. Evaluation of Land Carrying Capacity of 31 Provinces in China Based on a Natural–Societal-Supply–Demand Framework. Sustainability 2023, 15, 1037. https://doi.org/10.3390/su15021037
Hu H, Han L. Evaluation of Land Carrying Capacity of 31 Provinces in China Based on a Natural–Societal-Supply–Demand Framework. Sustainability. 2023; 15(2):1037. https://doi.org/10.3390/su15021037
Chicago/Turabian StyleHu, Huijuan, and Ling Han. 2023. "Evaluation of Land Carrying Capacity of 31 Provinces in China Based on a Natural–Societal-Supply–Demand Framework" Sustainability 15, no. 2: 1037. https://doi.org/10.3390/su15021037