Article

Towards Sustainable Development: Investigating the Heterogeneity and Driving Factors of Green Total Factor Productivity in Coal Enterprises

1
School of Management, Xi’an University of Science and Technology, Xi’an 710054, China
2
Energy Economy and Management Research Center, Xi’an University of Science and Technology, Xi’an 710054, China
3
School of Economics and Management, China University of Mining and Technology, Xuzhou 221116, China
*
Author to whom correspondence should be addressed.
Sustainability 2023, 15(19), 14626; https://doi.org/10.3390/su151914626
Submission received: 18 August 2023 / Revised: 24 September 2023 / Accepted: 3 October 2023 / Published: 9 October 2023
(This article belongs to the Topic Energy Economics and Sustainable Development)

Abstract

:
Understanding the heterogeneity and driving factors of green total factor productivity (GTFP) in coal enterprises can provide guidance for policy design regarding the sustainable development of coal in the future. In contrast to previous research at the macro level, we adopt and extend the data envelopment analysis method to measure and quantitatively decompose the GTFP of coal enterprises, examine inter-enterprise heterogeneity at multiple levels, explain the effects of the key driving factors and moderating factors of GTFP in theory, and subsequently conduct empirical testing using data obtained from 639 coal enterprises in China. The results indicate that there is significant inter-enterprise heterogeneity in GTFP in terms of enterprise scale, enterprise growth stage, government–enterprise collusion (GEC), and regional differences. The enterprise scale and enterprise growth stage have significantly positive effects on GTFP, while GEC has a significantly negative effect on GTFP. Technological progress, scale efficiency, and pure technical efficiency have moderating effects on enterprise scale, enterprise growth stage, and GEC. The results have valuable policy implications; it is necessary for the government to allocate significant resources towards thoroughly examining the potential effects arising from the heterogeneity of GTFP among coal enterprises, to weaken control over the aggregate target, and to strengthen the use of market-oriented policy instruments.

1. Introduction

The sustainable development goals of The 2030 Agenda for Sustainable Development, adopted at the seventieth session of the United Nations General Assembly in 2015, reflect a shared vision of humankind and a social contract between world leaders and peoples [1,2]. Climate change is the current focus of and urgent issue for global sustainable development. By the end of December 2021, 136 countries had set carbon-neutral targets. The Chinese government has made a solemn commitment to achieve carbon peaking goals by 2030 and carbon neutrality goals by 2060 (“double carbon” goal) [3,4]. Considering the resource endowment pattern of rich coal, little oil, and little gas, and the fact that renewable energy generation is not yet reliable and energy storage technologies are not yet sufficiently advanced, the share of energy consumption of coal is still 56% in 2022, and its status quo as the energy type with the highest share of energy consumption will be difficult to change for a long time [5,6]. Therefore, it is an important issue to promote the green transformation of China’s coal industry, which is aimed at achieving the “double carbon” goal and sustainable development goal of China.
According to the concept of sustainable development in the industrial sector and the requirements of the national sustainable development goals for the development of the coal industry, sustainable development in the coal industry can be defined as the intensive, efficient, and clean development of the coal industry [7,8,9]. To measure the level of sustainable development, existing studies have incorporated energy and environmental factors into the measurement framework of total factor productivity (TFP) [10] and proposed the concept of green total factor productivity (GTFP), which meets the concept of sustainable development in the coal industry [11,12]. As shown in Figure 1, the growth rate of China’s coal GTFP exhibited fluctuations over the period from 1990 to 2022. The accumulated GTFP had a fluctuating increase in 1990–2006, had a significant decrease in 2007–2009, and fluctuated in 2010–2021. Thus, what are the key factors that promote and hinder GTFP growth in the coal industry? Industry-level GTFP evolution is the result of inter-enterprise GTFP evolution [13]. The GTFP evolution within and among coal enterprises with different GTFPs forms the GTFP evolution of the coal industry. Therefore, GTFP evolution can provide important bases for policy design regarding sustainable development in the coal industry by enriching our knowledge of the characteristics of GTFP in the coal industry at the micro level.
Nevertheless, the existing studies on the measurement, heterogeneity, and driving factors of GTFP in the coal industry have primarily focused on the macro level of analysis. Insufficient attention has been given to analyses at the micro level, particularly in regard to inter-enterprise heterogeneity and the driving factors of GTFP. At the macro level, Cai et al. [14] used the DEA method to measure GTFP in the coal industry using the Global Malmquist–Luenberger productivity index and analyzed the differences in GTFP at the regional level. Li et al. [15] further explored the driving factors of GTFP and showed that resource abundance constrained regional GTFP growth and that environmental regulation, investment in science and technology, and human capital have positive effects on GTFP. Also, Fang et al. [16] used the SBM-DEA method to measure the GTFP of extractive industries in China. These studies showed that foreign direct investment, industrialization level, and resource endowment had positive effects on GTFP and that investment in technological innovation had a negative effect on GTFP. Zhu et al. [17] used the DEA method to measure the GTFP of the mining industry in China from 1991 to 2014 and found that there were significant differences in GTFP among segments of the mining industry. At the micro level, there are few studies on the heterogeneity and driving factors of GTFP in the coal industry. Xu and Li [18] used the Malmquist–Luenberger productivity index (ML index) method to measure the TFP of 30 large coal enterprises in China and found that their TFPs were different, which provides an important reference for our research.
Therefore, while the current studies offer valuable insights into notable variations in the TFP among enterprises in the Chinese coal industry, they have not measured the GTFP and inter-enterprise heterogeneity by considering coal enterprises of different scales as the research sample. Furthermore, these studies have not identified the driving factors of the GTFP at a micro level. As a result, the driving factors of the GTFP in the coal industry are still a “black box” at a micro level, which makes the current sustainable development policy of China’s coal industry ignore the inter-heterogeneity. This may lead to the flow of output to less sustainable enterprises or regions and then increase the difficulty of achieving the “double carbon” goal [19].
In contrast to previous studies conducted at the macro level, the primary objective of this research is to reveal the inter-enterprise heterogeneity of GTFP and its drivers, so as to enrich the understanding of the characteristic of the GTFP at the enterprise level in China. Additionally, it seeks to mitigate the potential risk of reduced output flow to GTFP that may be triggered by ignoring inter-enterprise heterogeneity of the GTFP in the design of previous sustainable development policies. We first use the matched data from the Chinese Industrial Enterprise Database (CIED) and the Chinese Polluting Enterprise Database (CPED) to measure and decompose the GTFP of Chinese coal enterprises using the DEA method with a sample of 639 coal enterprises from 21 provinces. Secondly, a range of indicators is employed to assess the heterogeneity of GTFP and its decomposition components for enterprises in the coal industry. Thirdly, we identify the driving factors of the GTFP, such as enterprise scale, enterprise growth stage, government–enterprise collusion (GEC), and region differences, and the moderating factors, such as the TC, PEC, and SEC, and propose theoretical hypotheses. Fourthly, an econometric model is developed to empirically examine the aforementioned hypotheses, and subsequent robustness tests are performed. Finally, this study presents conclusions and policy implications aimed at promoting sustainable development in the coal industry. The research framework is depicted in Figure 2.
The potential marginal contributions can be categorized as follows: (1) Theoretical contribution. On the one hand, the identification of inter-enterprise heterogeneity enhances the comprehension of the characteristic of the GTFP in the coal industry at a micro level. On the other hand, in contrast to previous studies at a macro level, we reveal micro-level driving factors and moderating factors as well as their impact on the GTFP. (2) Practical contribution. The unsatisfactory performance of coal sustainable development policies can be partially attributed to a lack of understanding regarding the inter-enterprise heterogeneity of the GTFP and its decomposition terms. We put forward a set of policy implications that are derived from the heterogeneity and driving factors of the GTFP at the micro level. These implications serve as scientific and effective foundations for the development of policies aimed at promoting sustainable growth in the coal industry.
The subsequent sections of this study are organized as follows: Section 2 is dedicated to the measurement and decomposition of the GTFP within coal enterprises. In Section 3, we assess the inter-enterprise heterogeneity of the GTFP and its decomposition components. Section 4 identifies the driving factors of the GTFP in coal enterprises and proposes theoretical hypotheses. In Section 5, a model is constructed to analyze the driving factors of the GTFP in coal enterprises, and its results are discussed. Conclusions and policy implications are presented in Section 6.

2. Measurement and Decomposition of the GTFP in Coal Enterprises

2.1. Methodology

The DEA method does not require a priori functional forms or distributional assumptions, making it flexible in accommodating unexpected resource inputs and pollutant outputs [20]. This approach successfully addresses numerous issues associated with conventional methods of measuring TFP. The DEA Malmquist–Luenberge method further combines the nonparametric linear programming method with the theory of data envelopment analysis. The traditional DEA model has limitations in conducting dynamic analysis on efficiency changes, thus necessitating an alternative approach. In recent years, the GTFP measurement has gained popularity as it addresses these shortcomings and allows for dynamic analysis of efficiency changes [21,22].
Hence, the DEA Malmquist–Luenberge methodology is utilized to assess the GTFP of coal enterprises, enabling its decomposition into TC, PEC, and SEC. Based on the output perspective, the GTFP growth for coal companies is shown in Equation (1).
M 0 ( x t + 1 , y t + 1 , x t , y t ) = D 0 t ( x t + 1 , y t + 1 ) D 0 t ( x t , y t ) × D 0 t + 1 ( x t + 1 , y t + 1 ) D 0 t + 1 ( x t , y t ) 1 / 2
where ( x t + 1 , y t + 1 ) and ( x t , y t ) denote the input and output vectors in period t + 1 and period t, respectively. D 0 t and D 0 t + 1 denote the distance functions in period t and period t + 1, respectively, with T as the reference. If this index is greater than 1, it indicates that the GTFP has improved from period t to period t+1.
The index has the good property that it can be decomposed into an index of technical efficiency change (TEC) and TC under the assumption of constant scale payoff (Equation (2)).
M 0 ( x t + 1 , y t + 1 , x t , y t ) = D 0 t + 1 ( x t + 1 , y t + 1 ) D 0 t ( x t , y t ) × D 0 t ( x t + 1 , y t + 1 ) D 0 t ( x t , y t ) × D 0 t + 1 ( x t + 1 , y t + 1 ) D 0 t + 1 ( x t , y t ) 1 / 2 = T E C × T C
As shown in Equations (3) and (4), the TEC can be decomposed into PEC and SEC. The distance function of Equations (3) and (4) is computed utilizing linear programming techniques. CRS and VRS represent the fixed and variable returns to scale models, respectively.
P E C = D 0 t + 1 ( x t + 1 , y t + 1 | V R S ) D 0 t + 1 ( x t , y t | V R S )
S E C = D 0 t + 1 ( x t + 1 , y t + 1 | C R S ) D 0 t + 1 ( x t + 1 , y t + 1 | V R S ) × D 0 t ( x t , y t | V R S ) D 0 t ( x t , y t | C R S )
The overall model is represented by Equation (5).
M 0 ( x t + 1 , y t + 1 , x t , y t ) = P E C × S E C × T C

2.2. Data

Based on the availability of data, the time frame for this study spans from 2011 to 2013. The study includes a total of 639 coal enterprises from 21 provinces, resulting in a total of 1273 observations. We matched the data obtained from the CIED and the CPED. The CIED contains state-owned enterprises and non-state-owned industrial enterprises that generate an annual main business income exceeding CNY 5 million. These enterprises collectively contribute 90–95% of the industries’ total output value, making the CIED an effective tool for capturing the comprehensive characteristics of coal enterprises [19]. The CPED encompasses information pertaining to enterprises that contribute to 85% of the overall pollutant emissions in each region. These data include essential details about the enterprises, such as their industrial output, energy consumption, and pollutant emissions. These data are derived from enterprises that complete forms and report their information autonomously. The Ministry of Environmental Protection (MEP) in China maintains the accuracy and reliability of statistical data by conducting regular monitoring and occasional inspections through pollutant emission monitoring systems, which are considered to be the most comprehensive and reliable environmental micro-data in China. In addition, it is important to note that both the CIED and the CPED are classified as micro-databases. These databases do not address the issue of aggregating and transforming micro-data into macro-data. The utilization of this approach mitigates the risk of information loss, addresses the issue of pseudo-measures, and mitigates potential biases in metrics when transitioning from the micro level to the macro level [23].
The data were subjected to cleaning procedures in accordance with the methodologies outlined by Wei and Ullah [24]. Subsequently, the non-desired output was quantified through the measurement of environmental losses. These losses were calculated by summing up the total costs associated with the emission of pollutants, including industrial wastewater emissions, chemical oxygen demand emissions, sulfur dioxide emissions, nitrogen oxide emissions, and smoke emissions. The calculation of these costs was based on the Management of Emission Fee Collection Standards. In addition, the input indicators used in the analysis included labor, capital, and resource inputs. These inputs were quantified by considering the total number of employees, total fixed assets, and industrial water consumption at the end of the enterprise’s fiscal year, respectively.

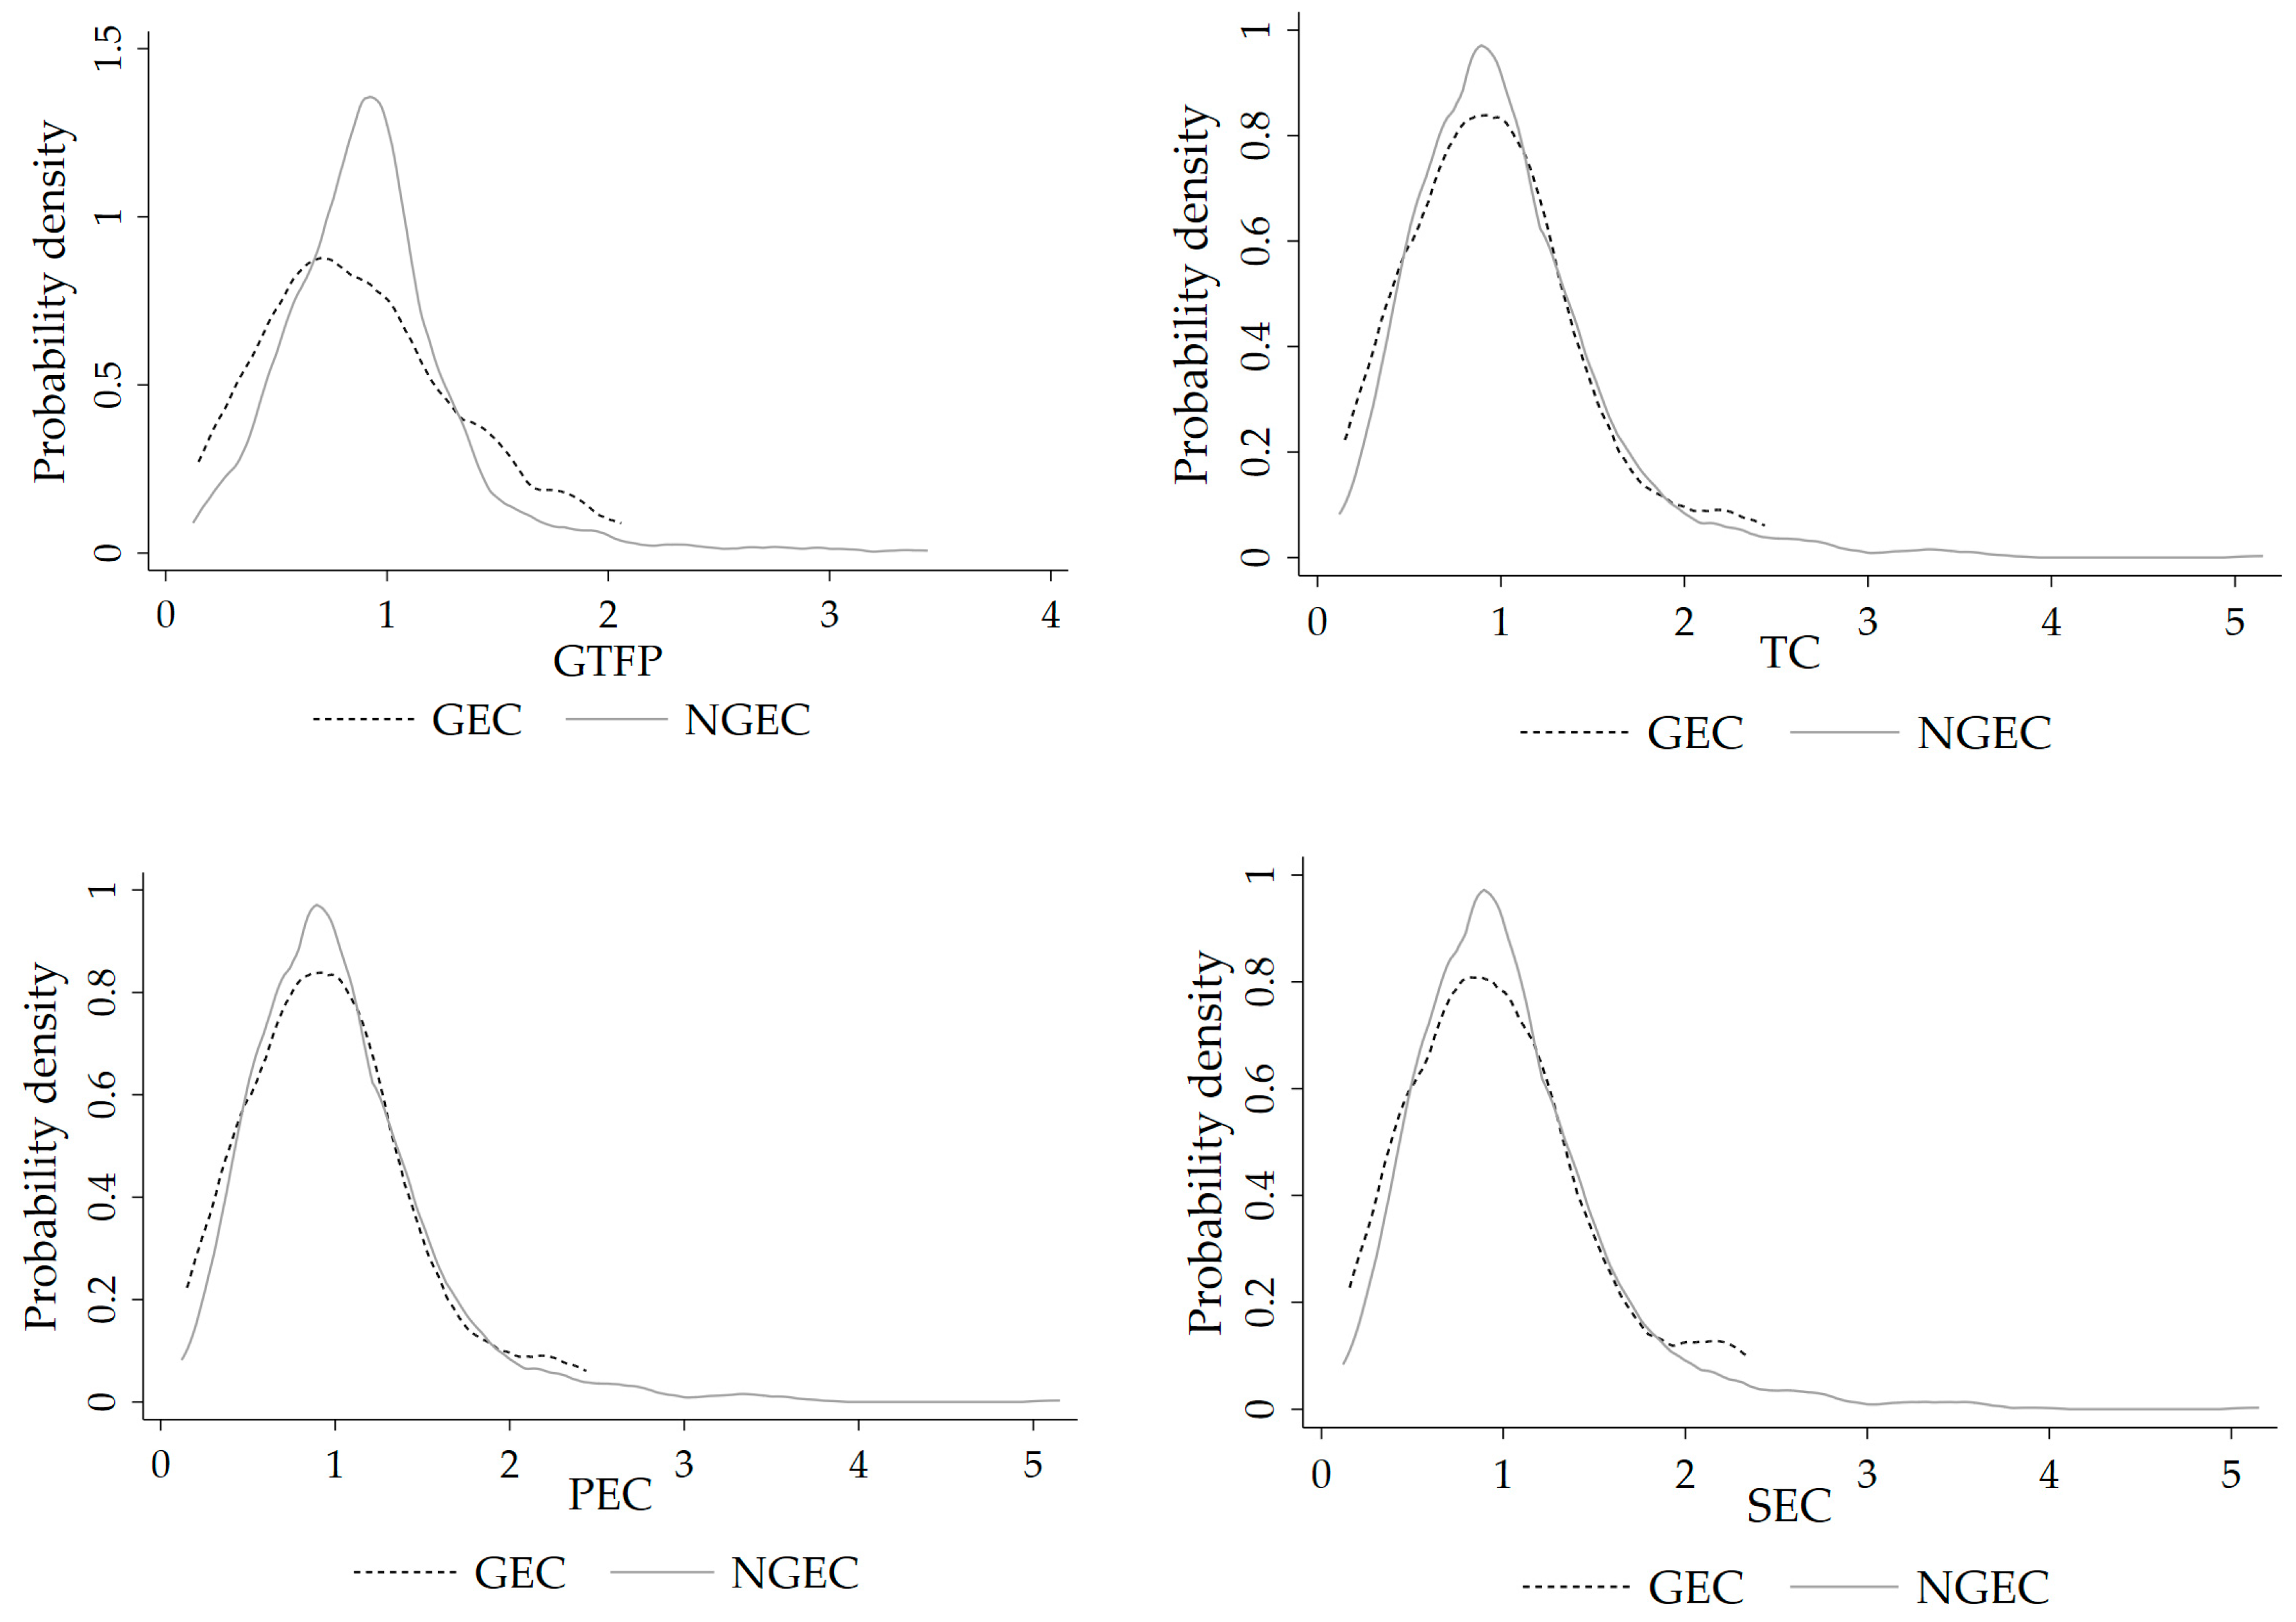
3. Inter-Enterprise Heterogeneity of the GTFP and Its Decomposition Terms

Building upon the work of Chen [25], this study focuses on measuring the inter-enterprise heterogeneity within the province and area, as well as the inter-province heterogeneity of the GTFP and its decomposition terms. To achieve this, the difference between the 90% and 10% quartiles, the difference between the 75% and 25% quartiles, and the coefficient of variation of the GTFP were chosen as the metrics. The results are presented in Table 1.
As seen in Table 1, there is significant heterogeneity in the GTFP and its decomposition terms among enterprises, even in the same province. Moreover, it can be shown that the level of heterogeneity among enterprises within the province, as measured by the GTFP and its decomposition terms, is greater than the heterogeneity observed among provinces. This phenomenon becomes apparent when examining the discrepancies observed between the quartiles at the 90th and 10th percentiles, the quartiles at the 75th and 25th percentiles, and the coefficient of variation. On the contrary, prior research has exhibited a greater emphasis on inter-province heterogeneity as opposed to inter-enterprise heterogeneity. This leads to the fact that existing policies tend to ignore inter-enterprise heterogeneity and thus result in the counter-flow of output from regions and enterprises with higher GTFP to those with lower ones [25].
The decomposition analysis of the GTFP reveals that the SEC is the primary determinant of inter-enterprise heterogeneity within the province, PEC comes second, and TC is the smallest. This implies that the inter-enterprise heterogeneity of the GTFP in the coal industry stems more from the TEC than the TC. As a result, for the change of the facts, partial coal enterprises with a world-leading GTFP and most with a low GTFP to a worldwide extent should pay full attention to improving the TEC, especially the SEC.

4. Identification of Drivers of the GTFP in Enterprises and Theoretical Hypotheses

4.1. Enterprise Scale

The classification of enterprises into large, medium, and tiny categories, as outlined in the “Statistical Classification of Large, Small, Medium, and Micro Enterprises (2017)”, is based on the utilization of business income as the primary criterion for division. As depicted in Figure 3, it is apparent that small coal enterprises demonstrate the lowest level of GTFP. Among the enterprises exhibiting a GTFP below 1.2, the predominant category comprises small enterprises, followed by medium enterprises and large enterprises. Conversely, among the enterprises with a GTFP exceeding 1.2, there is a notable absence of small enterprises, with large enterprises outnumbering medium enterprises in terms of quantity.
It can be seen that the GTFP is higher with a larger scale of enterprises, and there are indeed scale economies in coal enterprises. In reality, the acquisition of advanced technological equipment often entails substantial fixed costs, rendering it challenging for small enterprises to bear the financial burden. Large enterprises are more willing to introduce large equipment with energy-saving technology for long-term development and profits and focus on the updating of equipment [25]. In addition, as the SEC of enterprises can promote the effect of scale economy [26], the SEC enhances the effect of enterprise scale on the GTFP. Therefore, the hypothesis we propose is as follows:
H1a. Enterprise scale has a significantly positive effect on the GTFP.
H1b. The SEC has a significantly positive impact on the effect of enterprise scale on the GTFP.

4.2. Enterprise Growth Stage

The quartiles at the 75th and 25th percentiles of enterprise age are used to divide the enterprise growth stage into early, mature, and post-mature stages. As depicted in Figure 4, on average, the GTFP is the smallest in the early stage, and the GTFP is similar between the maturity and post-mature stages. This indicates that enterprises in the early stage do not have the advantage of technology, resources, and talent accumulation, and the lower-GTFP enterprises are not yet eliminated by the market, so the overall GTFP is lower [27]. During the mature and post-mature stages, established enterprises have demonstrated their viability in the market by achieving a higher overall GTFP. Alternatively, inefficient enterprises have been naturally eliminated from the market [26].
The dispersion of GTFP in the post-mature stage of coal enterprises is significantly higher in comparison to the early and maturity stages. Some enterprises in the post-mature stage are experiencing a decline in performance due to outdated management practices and the utilization of outdated green energy-saving technologies. As a result, their GTFP is not as high as that of the enterprises in the maturity stage. Despite their post-mature stage, numerous enterprises have managed to sustain their presence in the market for an extended period without facing elimination. This phenomenon can be attributed to their extensive and forward-thinking management expertise, coupled with their proactive embrace of green energy-saving technologies. Consequently, these enterprises demonstrate a significantly elevated level of GTFP.
In terms of decomposition, both SEC and PEC exhibit a pattern of initially increasing and then decreasing, whereas TC demonstrates a pattern of initially decreasing and then increasing, as observed across the early to post-mature stages. It can be presumed that the enterprise growth stage may have a nonlinear relationship with TC, PEC, and SEC. As the TC can compensate for the above constraints of enterprises in the early stages, and stimulate the enhancement of their GTFP, the TC of enterprises weakens the effect of the enterprise growth stage on GTFP [28]. Therefore, our hypothesis is as follows:
H2a. The enterprise growth stage has a significantly positive impact on the GTFP.
H2b. The TC of enterprises significantly reduces the effect of the enterprise growth stage on GTFP.

4.3. Government–Enterprise Collusion

In the realm of China’s economic governance, there is a notable tendency for local governments to place a significant emphasis on fostering local economic growth. This inclination becomes particularly pronounced when there exists a misalignment between the objectives of local governments and those of the central government, which can be attributed to the principal–agent relationship [29]. With the assistance of evaluating local officials based on GDP as the primary criterion, local governments exhibit a heightened inclination towards reducing pollution discharge standards for enterprises and augmenting their production levels in order to enhance economic performance and tax revenue [30,31]. According to GEC, enterprises contribute to swift economic growth, while local governments facilitate the acquisition of political preferential treatment opportunities [29]. As depicted in Figure 5, coal enterprises that engage in GEC exhibit a tendency to have lower GTFP compared to those that do not. It is highly probable that collusion between the government and enterprises will have an adverse impact on GTFP.
In addition, as depicted in Figure 4, the TC and PEC have a smaller gap between GEC and no GEC than the GTFP. This implies that the TC and PEC may play moderate roles in the relationship between the GTFP and GEC. Therefore, our hypothesis is as follows:
H3a. Governmententerprise collusion significantly inhibits the GTFP.
H3b. The TC significantly affects the inhibitory effect of government–enterprise collusion on GTFP.
H3c. The PEC significantly affects the inhibitory effect of government–enterprise collusion on GTFP.

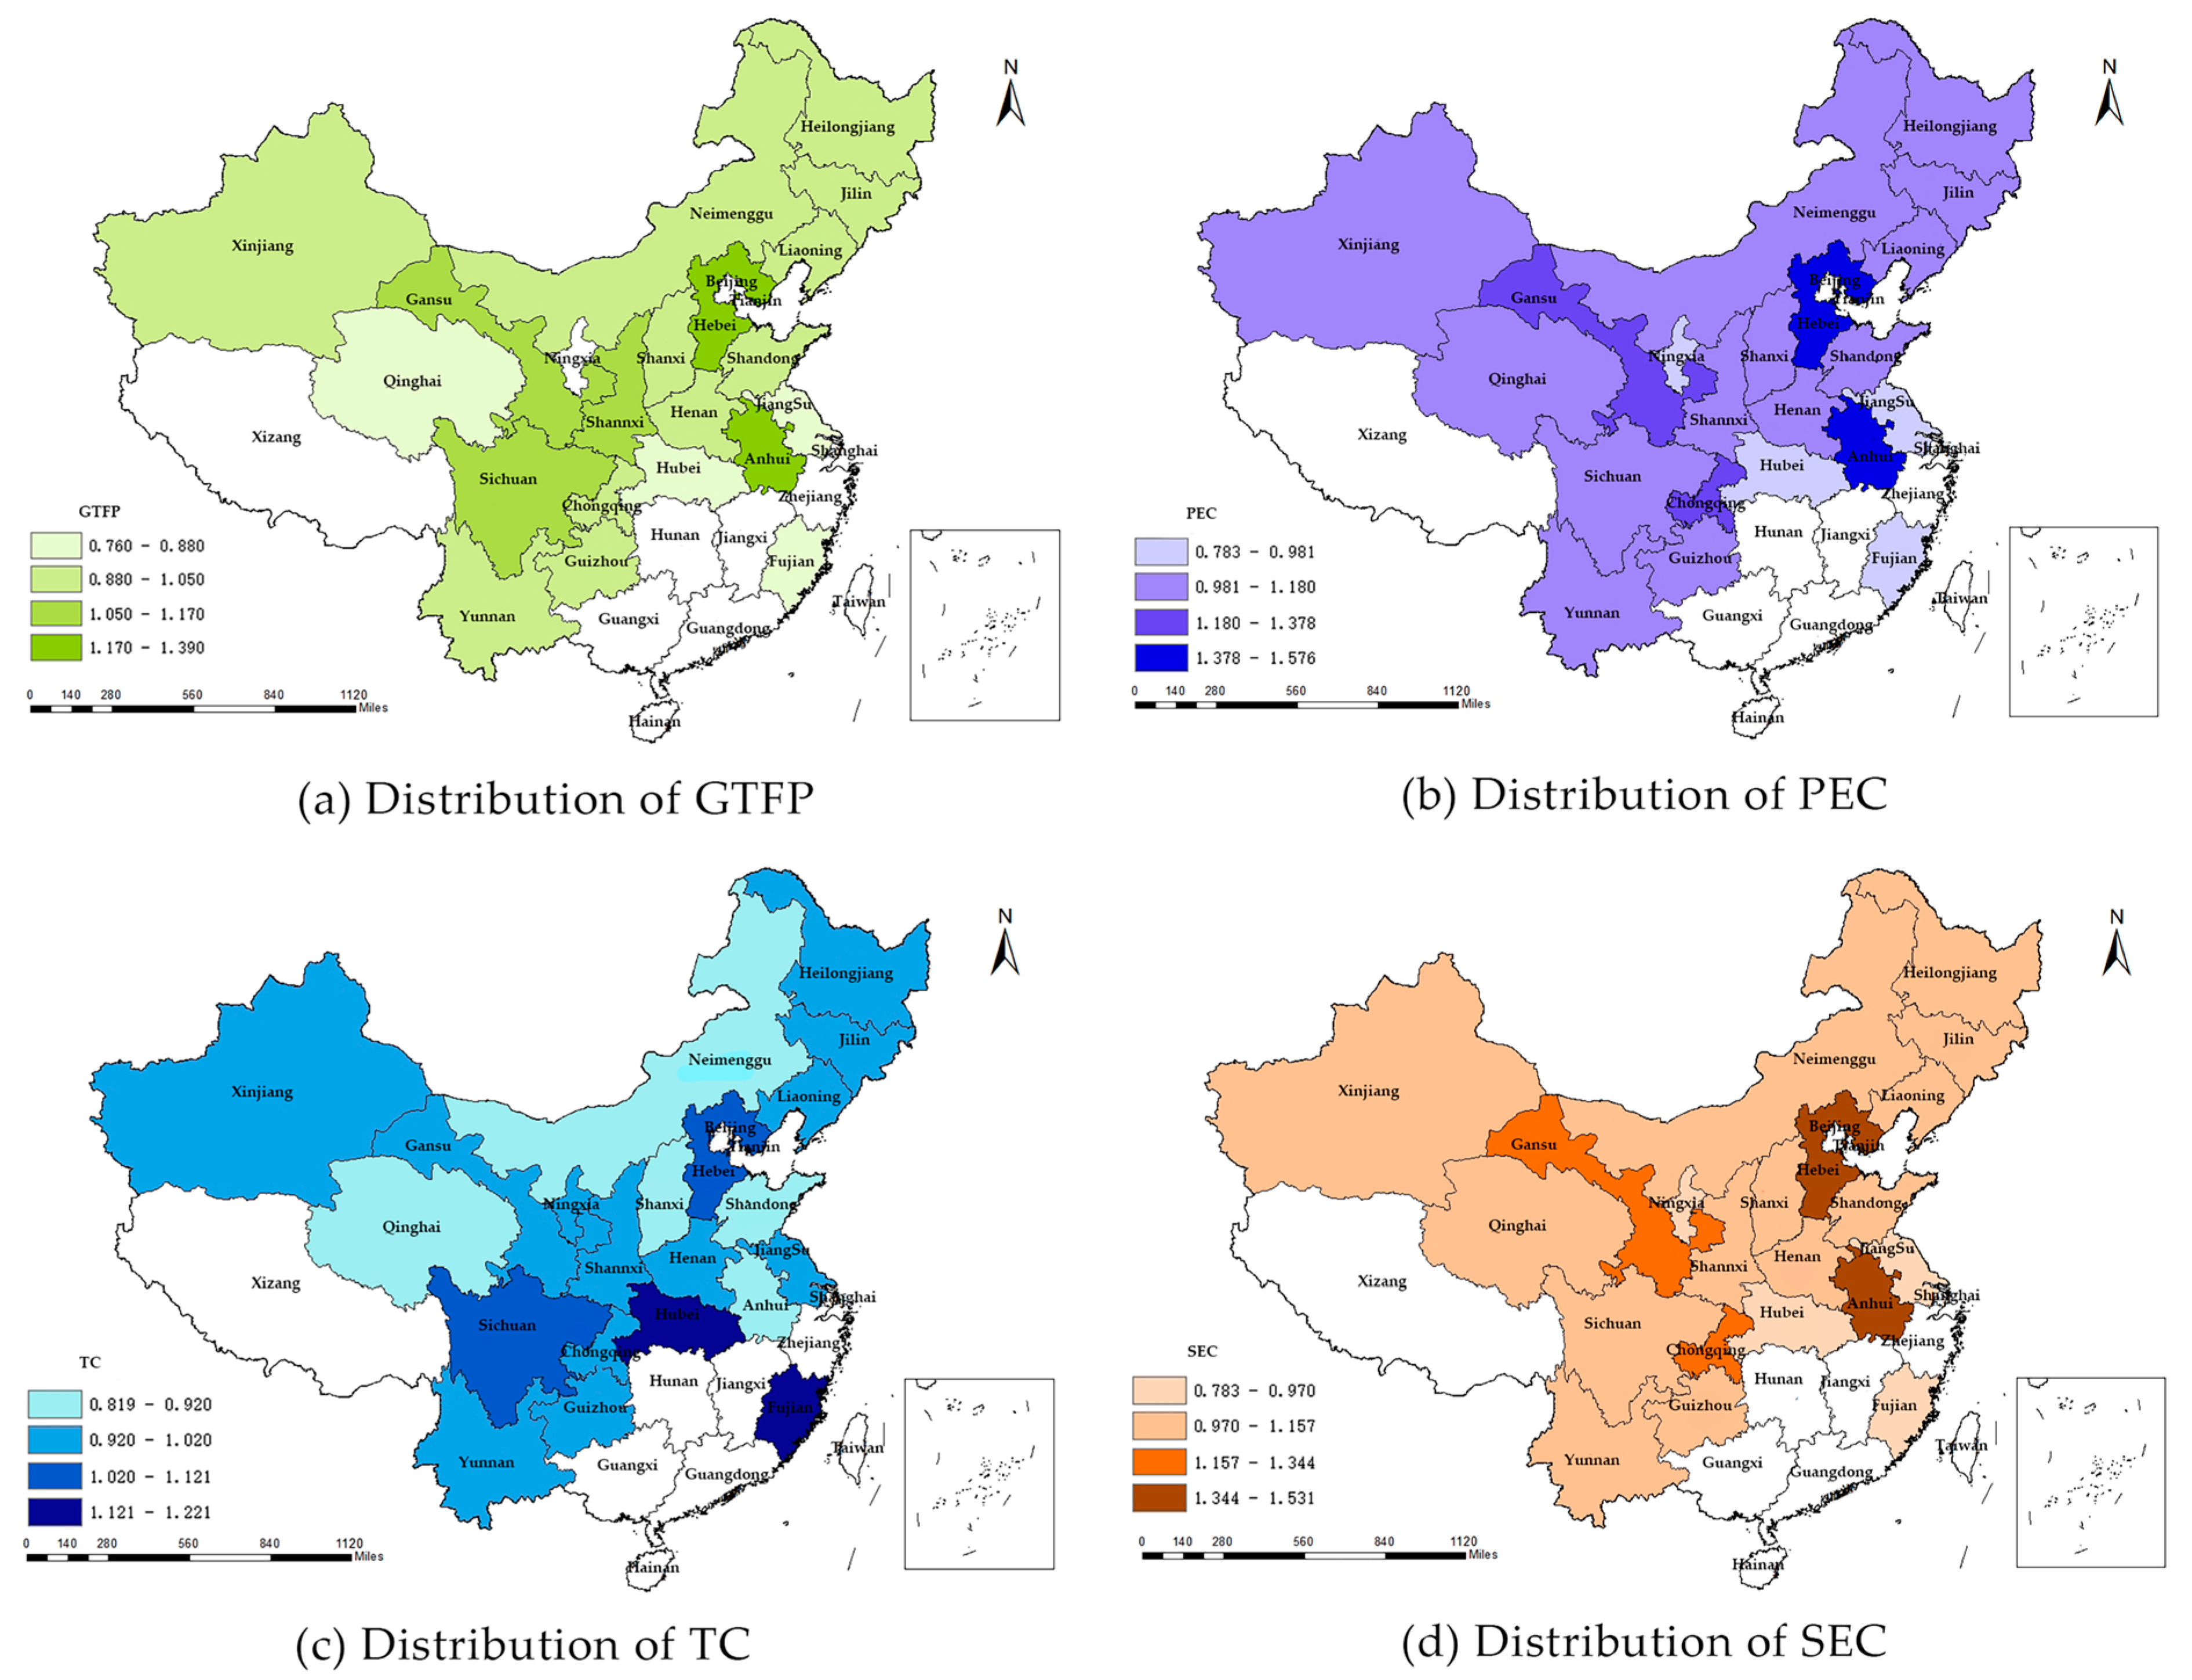
4.4. Regional Difference

The GTFP at the provincial level in the coal industry is divided into four zones, ranging from low to high: a light green zone, a medium green zone, a dark green zone, and a heavy green zone from lowness to highness, as shown in Figure 6. The GTFP differs significantly among Chinese provinces. The GTFP of the eastern region is significantly higher than that of the central and western regions, which is similar to the findings of Zhao et al. [27]. As shown in Figure 6, the provinces where the GTFP of the heavy green zone is located are Hebei and Anhui, while further west, the dark green zone is concentrated in Shaanxi, Gansu, Ningxia, etc. These provinces exhibit a certain level of coal production. However, during the process of economic expansion, there is often a simultaneous occurrence of inefficient resource exploitation and increased emissions of environmental pollutants. Consequently, this leads to a decline in the GTFP [32]. The medium green zone includes Inner Mongolia, Shanxi, and other major coal-producing provinces in China. In these regions, the natural resource endowment has not led to an improvement in GTFP, but instead has become the origin of the “resource curse” [33]. The light green zone includes Qinghai and Ningxia, which do not have advantages in terms of economic development level. Furthermore, the heterogeneity of the PEC, TC, and SEC at the provincial level is similar to that of the GTFP.

5. Model and Analysis of the Driving Factors of the GTFP in Coal Enterprises

5.1. Model

Based on the results of the heterogeneity analysis of the GTFP in coal enterprises, we identified key driving factors, or the enterprise size, enterprise growth stage, GEC, and region, and the moderating effects of the TC, PEC, and SEC on the relationship between GTFP and its decomposition terms. Thus, the econometric model for determining the driving factors of GTFP in coal enterprises is formulated, as shown in Equation (6).
G T F P i , t = β 0 + β 1 × t o v w i , t + β 2 × t o v w i , t × s e c h i , t + β 3 × a g e i , t 3 + β 4 × a g e i , t 3 × t e c h i , t + β 5 × i s t i , t + β 6 × i s t i , t × t e c h i , t + β 7 × i s t i , t × p e c h i , t + X i , t + α k + μ t + λ k , t + ε i , t
where GTFPi,t represents the GTFP of enterprise i in year t. Enterprise scale (tovwi,t) is measured by the total industrial output value of the enterprise, and its data are obtained from the CIED. The age of the enterprise (agei,t) is measured by calculating the difference between the statistical year and the year the enterprise was established. The data on the year of establishment are obtained from the CIED. The degree of GEC (isti,t) uses the dummy variable to determine whether the mayor of each city had more than two years of corporate work experience assuming office. The data were collected from official information published on authoritative websites such as People.com and Xinhua.com, according to [31]. TC (techi,t), PEC (pechi,t), and SEC (sechi,t) are used as moderating variables, and they are calculated according to Equations (2)–(6). X i , t represents the control variables, including indicators of the characteristics of enterprises such as the return on assets (kki,t). ε i , t indicates the random disturbance term. In order to exclude the effect of industry shocks and regional shocks on the empirical results, we also incorporate province fixed effects, year fixed effects, and province*year fixed effects, denoted as   α k , μ t , and λ k , t , respectively.

5.2. Results and Discussion

We utilize the generalized least squares method to estimate the parameters and employ stepwise regression to assess the robustness of the results [34]. This is done to avoid problems such as serial correlation and heteroscedasticity, which can negatively impact the fairness, validity, and consistency of the parameter estimates. The parameter estimation results are shown in Table 2. The R2 values of models (1)–(5) are all greater than 0.9, and the F-values are all greater than 10. This indicates that the models fit well and that the driving factors of enterprise scale, enterprise growth stage, and GEC can effectively explain the GTFP changes in coal enterprises well. Moreover, these driving factors pass the t-test at the 5% significance level, indicating that they have a significant impact on the GTFP of coal enterprises. The coefficients of the products of GEC and TC, GEC and PEC, enterprise scale and SEC, and enterprise growth stage and TC pass the t-test at the 5% significance level, indicating that TC, PEC, and SEC have significantly moderated the effects of the key driving factors on the GTFP.
Enterprise scale has a significantly positive effect on the GTFP of coal enterprises, which aligns with the heterogeneity observed in Figure 2 and the findings of Chen and Chen [25], as well as Yin et al. [26] in general. As shown in Table 2, for every 1-unit expansion of enterprise size, the GTFP of coal enterprises increases by 1.1–1.5 units, indicating that there are mostly economy-of-scale effects in most coal enterprises. First, advanced technological equipment with high GTFP usually has high fixed costs, which can only be afforded by mega-scale enterprises [35]. Second, it has been observed that waste heat recycling can contribute to enhancing the GTFP in large enterprises. Conversely, small enterprises often face limitations in recycling waste heat and energy due to inadequate access to suitable technology and equipment. This deficiency leads to significant resource wastage, environmental pollution, and a subsequent reduction in GTFP [36].
SEC can weaken the positive impact of enterprise size on the GTFP of coal enterprises. As the SEC increases, the actual scale of an enterprise tends to be close to its optimal scale. Even in the case of small enterprises, as long as their enterprise scale approaches the optimal scale, their GTFP can still be higher. This helps to mitigate the negative impact of small scale on the GTFP of coal enterprises. Conversely, for large enterprises, although they may benefit from the advanced technological equipment with high fixed costs, when their scale exceeds the optimal level, diseconomies of scale will emerge, resulting in a lower SEC, which weakens the enhancement effect of the GTFP brought by the scale effect.
The growth stage of enterprises exhibits a distinct “N”-like effect on the GTFP of coal enterprises; i.e., the age of enterprises has a positive effect on the GTFP of coal enterprises as a whole, but the degree of this effect varies slightly in different growth stages of enterprises. In contrast to the linear relationship observed in previous studies between the age of an enterprise and its TFP, this study reveals the presence of a nonlinear effect [26,28]. Enterprises in the early stage of growth development frequently exhibit a diminished level of GTFP because they have been established for a short period of time and do not have advantages in technology, resources, and talent accumulation, while the age of enterprises has a greater impact on the GTFP in this growth stage [37]. Enterprises with low GTFP efficiency will also experience market testing over time, and the overall GTFP increases rapidly. In the maturity stage, most of the coal enterprises have experienced the market test, the inefficient enterprises have been eliminated by the market, and the degree of the positive effect of enterprise age on the GTFP has decreased over time. However, as shown in Figure 3, in the post-maturity stage, a larger proportion of enterprises may encounter elimination as a result of their failure to align with the latest industry demands regarding green energy-saving technologies. There are fewer surviving enterprises in this stage, and they tend to have mature and innovative management experience and green energy-saving technologies updated in a timely manner. At present, the significance of enterprise age in enhancing the GTFP of coal enterprises is increasingly prominent [38].
The presence of TC can potentially diminish the positive influence of the enterprise growth stage on the coal enterprises’ GTFP. On the one hand, it has been observed that new entrants in the coal industry exhibit a greater inclination towards innovation. This willingness to innovate allows them to maintain a high level of competitiveness, both among themselves and with established enterprises in the post-maturity stage [16]. On the contrary, in the maturity and post-mature stages, enterprises face significant costs associated with technological change. Additionally, the coal industry exhibits high exit barriers and lacks a robust mechanism for market survival of the fittest. As a result, the impact of TC can potentially undermine the positive effect of the growth stage of enterprises on the GTFP [39].
GEC has a significantly negative effect on enterprises’ GTFP. This suggests that, like some other energy sectors and energy-consuming sectors, GEC exists in the Chinese coal industry, which is detrimental to the sustainable development of the coal industry [40]. The effect in the coal industry is consistent with that in other industries [41,42]. The market performance of the coal industry, as a basic industrial sector, is directly and indirectly related to local economic performance and fiscal revenue [43]. Under the assessment system that prioritizes GDP, local officials are inclined to comply with the preferences of coal enterprises, even if it means adopting low-cost, unsafe, or environmentally harmful production methods. This allows coal enterprises to continue with their crude business models in order to reduce operating costs or engage in collusion to conceal pollution and evade penalties from higher government authorities. Consequently, they are able to generate short-term surplus operating revenues. Local governments are able to attain increased fiscal revenues and greater prospects for political progress through exceptional short-term performance [44].
In addition, the negative coefficient of the product term of TC and GEC indicates that the TC of enterprises weakens the inhibitory effect of GEC on coal enterprises’ GTFP. Since local governments often collude with enterprises by loosening their emission standards, safety regulations, and equipment technology requirements, coal enterprises that have made significant technological advancements are more likely to adopt efficient energy-saving equipment, establish comprehensive sewage treatment processes, and achieve higher GTFP. Additionally, they have a tendency to engage in collusion with local governments to a lesser extent, thus weakening the inhibitory effect of GEC on the GTFP of coal enterprises.

5.3. Robustness Tests

The robustness of the results is tested using two methods, which involve the replacement of the regression method and the data processing method. The former refers to the fact that the economic model is estimated using the OLS method instead of the original generalized least squares method. The latter refers to the fact that the data of the GTFP below the 2.5% quantile and above the 97.5% quantile are truncated, while there is no truncation in the original model. As indicated in Table 2 and Table 3, upon replacing the regression method and the data processing method, the R2 value exceeds 0.85, the F-value surpasses 10, the key driving factors successfully pass the t-test at a 5% significance level, and the direction of influence also remains largely consistent with the original findings. Therefore, the results of this paper are reliable and credible.

6. Conclusions and Policy Implications

6.1. Conclusions

We utilized the matched data from the CIED and the CPED to measure and quantitatively decompose the GTFP of Chinese coal enterprises through the DEA method and analyze their heterogeneity. Based on the heterogeneity analysis, the key driving factors were identified, and their driving effects on the GTFP of coal enterprises were empirically tested. The main conclusions are as follows:
(1) There is significant heterogeneity in the GTFP and its decomposition terms among Chinese coal enterprises, even within the same province. This heterogeneity is particularly evident in terms of enterprise scale, enterprise growth stage, GEC, and regional differences. As for the scale of enterprises, the GTFP is highest for large enterprises, lower for medium enterprises, and lowest for small enterprises. This indicates that coal enterprises benefit from economies of scale. In terms of the enterprise growth stage, compared to the early growth stage, enterprises in the mature and post-mature stages have higher GTFP. Additionally, the distribution of GTFP in coal enterprises at the post-mature stage is more dispersed, with both high- and low-GTFP enterprises co-existing. From the perspective of GEC, the GTFP of enterprises participating in GEC is significantly lower than that of enterprises not participating in GEC. From the perspective of the different regions, the GTFP of the central and eastern provinces is higher than that of the western region as a whole. Specifically, the heavy green zone includes the provinces of Hebei and Anhui; the dark green zone is predominantly concentrated in Shaanxi, Gansu, Ningxia, etc.; the medium green zone comprises Inner Mongolia, Shanxi, and other major coal-producing provinces; and the light green zone includes Qinghai, Ningxia, etc.
(2) Enterprise scale and growth stage have significant positive on the GTFP of coal enterprises, while GEC has negative effects on the GTFP of coal enterprises. Meanwhile, TC, PEC, and SEC play crucial roles in moderating these effects. GEC has a significant and negative effect on the GTFP, and the TC of enterprises weakens this negative effect of GEC. The scale of an enterprise has a significant positive effect on the GTFP, but this effect is weakened by the SEC. Additionally, the actual scale of an enterprise is close to being optimal when the SEC is higher. The growth stage of an enterprise has a significant “N”-like effect on the GTFP. The overall trend is positive, but the magnitude of this effect varies slightly at different growth stages. The SEC can weaken the positive effect of enterprise scale on the GTFP.

6.2. Policy Implications

(1) It is imperative for the government to allocate sufficient attention to the potential impacts of the heterogeneity of coal enterprises in the policy formulation of sustainable development. According to the findings of our study, there is significant heterogeneity in GTFP among coal enterprises within the coal industry (Figure 3 and Figure 4). Policies that have ignored the inter-enterprise heterogeneity of the GTFP in the past are likely to result in coal enterprises with high GTFP and limited room for emission reduction being burdened with excessively high emission reduction targets. This, in turn, leads to an increase in the market share of coal enterprises with low GTFP [45,46]. Therefore, when formulating sustainable development policies for coal enterprises, it is important to adequately consider the potential impact of the heterogeneity in the GTFP of coal enterprises.
(2) The central government should enhance the regulatory system of the coal industry to reduce the chance of GEC. According to the findings of this study, GEC has an inhibiting effect on the GTFP. GEC forms in a perfect coal regulatory system in China, where the overlap of powers in both horizontal and vertical directions throughout the structure leads to regulatory complexity and ineffectiveness [47,48]. Therefore, in regulating the coal industry, it is crucial to dismantle the interconnectedness and overlap between the central government and local governments both horizontally and vertically, to implement vertical management and supervision of environmental issues in coal enterprises, and thus break the institutional basis for the collusion between government and enterprises [49].
(3) Governments should guide small- and medium-sized coal enterprises to accelerate technological upgrading and encourage their mergers and acquisitions with large enterprises [50]. According to the findings of this study, enterprise scale has a significant positive impact on the GTFP of coal enterprises (Table 2). Therefore, these past policies on the closure of small coal mines have enhanced the GTFP in the coal industry and promoted the sustainable development of the coal industry [51,52]. In addition, small- and medium-sized coal enterprises should be guided to accelerate their technological upgrades and facilitate their mergers and acquisitions with larger enterprises. This will fundamentally improve the current state of China’s leading coal enterprises, which are leading the world in technology while the industry as a whole is generally relatively backward in GTFP.
(4) The sustainable development policy of the coal industry should weaken total target control while strengthening the use of market-oriented policy instruments. The sustainable development policy of the coal industry often includes direct control of total target and constraint indices at the provincial, municipal, and enterprise levels. According to the findings of this study, there is significant regional heterogeneity in GTFP in the coal industry (Figure 6). The policy of direct total target control ensured that the enterprises and regions that took on more energy-saving and emission-reduction tasks were precisely those with high GTFP. A more reasonable approach is to utilize economic instruments, such as environmental taxes, purchase tax incentives, and credit incentives, to regulate the behavior of coal enterprises towards sustainable development. This can be achieved by implementing a price mechanism that imposes greater cost pressure on enterprises with lower GTFP. Ultimately, this approach aims to promote the sustainable development of the entire coal industry.

Author Contributions

Q.Y.: funding acquisition, supervision, data curation, writing—review and editing. J.Q.: methodology, software, writing—original draft. S.Z.: funding acquisition, supervision. D.W.: funding acquisition. J.H.: writing—review and editing. All authors have read and agreed to the published version of the manuscript.

Funding

This research was funded by the Natural Science Foundation of China (No. 72004181), Humanities and Social Science Fund of Ministry of Education of China (No. 20YJC630190), Shaanxi Provincial Philosophy and Social Science Research Project (No. 2023ZD1047), Innovation Capability Support Program of Shaanxi (No. 2021KRM009), the Natural Science Foundation of China (No. 72074210 and No. 72374196), and the National Social Science Foundation of China (No. 19BGL183).

Data Availability Statement

Please contact 16600285429@163.com for data.

Conflicts of Interest

The authors declare no conflict of interest.

References

  1. Sun, L.; Chen, J.; Li, Q.; Huang, D. Dramatic uneven urbanization of large cities throughout the world in recent decades. Nat. Commun. 2020, 11, 5366. [Google Scholar] [CrossRef]
  2. Morton, S.; Pencheon, D.; Squires, N. Sustainable Development Goals (SDGs), and their implementation: A national global framework for health, development and equity needs a systems approach at every level. Br. Med. Bull. 2017, 124, 81–90. [Google Scholar] [CrossRef]
  3. Xi, J. The Governance of China III; Foreign Languages Press: Beijing, China, 2021. [Google Scholar]
  4. Xi, J. The Governance of China IV; Foreign Languages Press: Beijing, China, 2022. [Google Scholar]
  5. Lin, J.; Fridley, D.; Lu, H.; Price, L.; Zhou, N. Has coal use peaked in China: Near-term trends in China’s coal consumption. Energy Policy 2018, 123, 208–214. [Google Scholar] [CrossRef]
  6. Lin, B.; Jia, Z. Economic, energy and environmental impact of coal-to-electricity policy in China: A dynamic recursive CGE study. Sci. Total Environ. 2019, 698, 134241. [Google Scholar] [CrossRef] [PubMed]
  7. Pu, X.; Zeng, M.; Zhang, W. Corporate sustainable development driven by high-quality innovation: Does fiscal decentralization really matter? Econ. Anal. Policy 2023, 78, 273–289. [Google Scholar] [CrossRef]
  8. Huan, Y.; Liang, T.; Li, H.; Zhang, C. A systematic method for assessing progress of achieving sustainable development goals: A case study of 15 countries. Sci. Total Environ. 2021, 752, 141875. [Google Scholar] [CrossRef]
  9. Sachs, J.D.; Schmidt-Traub, G.; Mazzucato, M.; Messner, D.; Nakicenovic, N.; Rockström, J. Six Transformations to achieve the Sustainable Development Goals. Nat. Sustain. 2019, 2, 805–814. [Google Scholar] [CrossRef]
  10. Zhou, Y.; Xu, Y.; Liu, C.; Fang, Z.; Fu, X.; He, M. The Threshold Effect of China’s Financial Development on Green Total Factor Productivity. Sustainability 2019, 11, 3776. [Google Scholar] [CrossRef]
  11. Fang, C.; Cheng, J.; Zhu, Y.; Chen, J.; Peng, X. Green total factor productivity of extractive industries in China: An explanation from technology heterogeneity. Resour. Policy 2020, 70, 101933. [Google Scholar] [CrossRef]
  12. Zhang, M.; Wang, W.; Sun, X. Measurement and Multiple Decomposition of Total Factor Productivity Growth in China’s Coal Industry. Sustainability 2023, 15, 2230. [Google Scholar] [CrossRef]
  13. Wu, L.; Ye, S.; Fu, X. Sources of productivity gains in China’s manufacturing sector: Enterprise growth or market turnover? Manag. World 2016, 32, 22–39. (In Chinese). [Google Scholar] [CrossRef]
  14. Cai, L.; Guo, Z.; Zhang, J. Research on Green Total Factor Productivity of Coal Industry in China. J. Chin. Univer. Min. Tech. 2023, 25, 161–180. (In Chinese). [Google Scholar] [CrossRef]
  15. Li, X.; Li, X.; Zhu, X.; Huang, Y.; Liu, X.; Deng, W. Dynamic relationship between resource endowment, financial agglomeration, innovation-driven, and green total factor productivity. Energy Environ. 2023. [Google Scholar] [CrossRef]
  16. Fang, Y.; Cao, H. Environmental Decentralization, Heterogeneous Environmental Regulation, and Green Total Factor Productivity—Evidence from China. Sustainability 2022, 14, 11245. [Google Scholar] [CrossRef]
  17. Zhu, X.; Chen, Y.; Feng, C. Green total factor productivity of China’s mining and quarrying industry: A global data envelopment analysis. Resour. Policy 2018, 57, 1–9. [Google Scholar] [CrossRef]
  18. Xu, C.; Li, G. Research on the Impact of Green Innovation on Total Factor Productivity of Coal Enterprises. Coal Econ. Res. I 2011, 41, 83–88. (In Chinese). [Google Scholar] [CrossRef]
  19. Zhang, P.; Tu, X. Manufacturing Agglomeration, Technological Progress and Enterprise Total Factor Energy Efficiency. China Ind. Econ. 2022, 412, 103–121. (In Chinese). [Google Scholar] [CrossRef]
  20. Pahlavan, R.; Omid, M.; Rafiee, S.; Mousavi-Avval, S.H. Optimization of energy consumption for rose production in Iran. Energy Sustain. Dev. 2012, 16, 236–241. [Google Scholar] [CrossRef]
  21. Li, P.; Chen, Y. Environmental regulation, Bargaining Power of Enterprises and Green Total Factor Productivity. Financ. Trade Econ. 2019, 40, 144–160. (In Chinese). [Google Scholar] [CrossRef]
  22. Mahapatra, B.; Bhar, C.; Mondal, S. Performance Assessment Based on the Relative Efficiency of Indian Opencast Coal Mines Using Data Envelopment Analysis and Malmquist Productivity Index. Energies 2020, 13, 4902. [Google Scholar] [CrossRef]
  23. Georgescu-Roegen, N. The Entropy Law and the Economic Process; Harvard University Press: Cambridge, MA, USA, 1971. [Google Scholar] [CrossRef]
  24. Wei, L.; Ullah, S. International tourism, digital infrastructure, and CO2 emissions: Fresh evidence from panel quantile regression approach. Environ. Sci. Pollut. Res. 2022, 29, 36273–36280. [Google Scholar] [CrossRef] [PubMed]
  25. Chen, Z.; Chen, Q. Energy Efficiency of Chinese enterprises: Heterogeneity, Influencing Factors and Policy Implications. China Ind. Econ. 2019, 381, 78–95. (In Chinese). [Google Scholar] [CrossRef]
  26. Yin, Z.; Lei, M.; Yu, X. Analysis of energy and environmental efficiency in China’s iron and steel industry based on micro data of industrial enterprises. Chin. J. Manag. Sci. S1 2014, 22, 709–715. (In Chinese). [Google Scholar] [CrossRef]
  27. Zhao, M.; Lv, L.; Wu, J.; Wang, S.; Zhang, N.; Bai, Z.; Luo, H. Total factor prodctivity of high coal-consuming industries and provincial coal consumption: Based on the dynamic spatial durbin model. Energy 2022, 251, 123917. [Google Scholar] [CrossRef]
  28. Guo, M.; Zhang, C. An empirical study of enterprise age, R&D investment and performance based on empirical data of A-share listed companies in Zhejiang Province. Commun. Financ. Account. Under 2017, 12, 5. (In Chinese). [Google Scholar] [CrossRef]
  29. Zhang, F.; Huang, K. The role of government in industrial energy conservation in China: Lessons from the iron and steel industry. Energy Sustain. Dev. 2017, 39, 101–114. [Google Scholar] [CrossRef]
  30. Lo, K.; Li, H.; Wang, M. Energy conservation in China’s energy-intensive enterprises: An empirical study of the ten-thousand enterprises program. Energy Sustain. Dev. 2015, 27, 105–111. [Google Scholar] [CrossRef]
  31. Hu, K.; Shi, D. The impact of government-enterprise collusion on environmental pollution in China. J. Environ. Manag. 2021, 292, 112744. [Google Scholar] [CrossRef]
  32. Dou, S.; Yue, C.; Xu, D.; Wei, Y.; Li, H. Rethinking the “resource curse”: New evidence from nighttime light data. Resour. Policy 2022, 76, 102617. [Google Scholar] [CrossRef]
  33. Qi, X.; Guo, P.; Guo, Y.; Liu, X.; Zhou, X. Understanding energy efficiency and its drivers: An empirical analysis of China’s 14 coal intensive industries. Energy 2019, 190, 116354. [Google Scholar] [CrossRef]
  34. Gao, C.; Zhong, Y.; Mensah, I.A.; Tao, S.; He, Y. Spatio-Temporal Impact of Global Migration on Carbon Transfers Based on Complex Network and Stepwise Regression Analysis. Sustainability 2022, 14, 844. [Google Scholar] [CrossRef]
  35. Lazzarini, S.G.; Musacchio, A. State ownership reinvented? Explaining performance differences between state-owned and private firms. Corp. Gov. Int. Rev. 2018, 26, 255–272. [Google Scholar] [CrossRef]
  36. Yu, Z.; Khan, S.A.R.; Zia-Ul-Haq, H.M.; Ma, T.; Sajid, M.J. An evolutionary game analysis on price competition in recycling industry between large and small enterprises of China. Waste Manag. Res. 2023, 41, 337–349. [Google Scholar] [CrossRef] [PubMed]
  37. Liu, L.; Hou, Y.; Zhan, X.; Wang, Z. Innovation Efficiency of High-Tech SMEs Listed in China: Its Measurement and Antecedents. Discret. Dyn. Nat. Soc. 2020, 2020, 8821950. [Google Scholar] [CrossRef]
  38. Zhao, M. Total Factor Productivity Growth of Chinese Coal Industry. Stat. Res. 2011, 28, 55–62. (In Chinese). [Google Scholar] [CrossRef]
  39. Wu, J.; Xia, Q.; Li, Z. Green innovation and enterprise green total factor productivity at a micro level: A perspective of technical distance. J. Clean. Prod. 2022, 344, 131070. [Google Scholar] [CrossRef]
  40. Xu, H.; Nakajima, K. Did China’s coal mine regulation positively affect economic growth? Resour. Policy 2016, 50, 160–168. [Google Scholar] [CrossRef]
  41. Li, S.; Yang, Q.; Zhang, Y.; Liu, J. Multi-agent evolutionary game analysis of the coal mine on-site regulatory mode. Resour. Policy 2022, 77, 102723. [Google Scholar] [CrossRef]
  42. Zhang, Q.; Etienne, X.L.; Wang, Z. Reducing coal overcapacity in China: A new perspective of optimizing local officials’ promotion system. Environ. Sci. Pollut. Res. 2022, 29, 90364–90377. [Google Scholar] [CrossRef]
  43. Guo, Y.; Zhang, B.; Chen, B.; Yang, Q.; Li, J. Disparities in socio-economic drivers behind China’s provincial energy-related mercury emission changes. J. Environ. Manag. 2019, 251, 109613. [Google Scholar] [CrossRef]
  44. Liu, Q.; Li, L. Spatial Heterogeneity of Government Regulation, Spatial Distance and Enterprise Carbon Information Disclosure: An Analysis Based on the Heavy Pollution Industry in China. Int. J. Environ. Res. Public Health 2019, 16, 4777. [Google Scholar] [CrossRef] [PubMed]
  45. The People’s Government of Shanxi Province. Notice on Decomposing and Assigning the Target Tasks of Reducing Excess Production Capacity in the Coal Industry in 2017. 2017. Available online: https://www.waizi.org.cn/policy/20854.html (accessed on 16 April 2023).
  46. The State Council of the PRC, PR. China. Opinions of the State Council on Resolving Excess Capacity in the Coal Industry and Realizing the Development of Poverty Alleviation. 2016. Available online: http://www.gov.cn/gongbao/content/2016/content_5045944.htm (accessed on 15 April 2023).
  47. Andrews-Speed, P.; Yang, M.; Shen, L.; Cao, S. The regulation of China’s township and village coal mines: A study of complexity and ineffectiveness. J. Clean. Prod. 2003, 11, 185–196. [Google Scholar] [CrossRef]
  48. Shen, L.; Gao, T.-M.; Cheng, X. China’s coal policy since 1979: A brief overview. Energy Policy 2012, 40, 274–281. [Google Scholar] [CrossRef]
  49. Lin, B.; Xu, C. Does environmental decentralization aggravate pollution emissions? Microscopic evidence from Chinese industrial enterprises. Sci. Total Environ. 2022, 829, 154640. [Google Scholar] [CrossRef]
  50. Shi, Y.; Zhang, T.; Jiang, Y. Digital Economy, Technological Innovation and Urban Resilience. Sustainability 2023, 15, 9250. [Google Scholar] [CrossRef]
  51. National Development and Reform Commission, PR. China. Reply of the National Development and Reform Commission on the Construction Plan of Large Coal Bases. 2013. Available online: http://www.nea.gov.cn/2013-10/10/c_132786276.htm (accessed on 18 April 2023). (In Chinese).
  52. National Development and Reform Commission, PR. China. Notice on Issuing the Regulations on Strengthening the Safety Management of Coal Mine Construction. 2012. Available online: http://www.nea.gov.cn/2012-12/31/c_132073582.htm (accessed on 15 April 2023). (In Chinese).
Figure 1. GTFP and accumulated GTFP in China’s coal industry in 1990–2022.
Sustainability 15 14626 g001
Figure 2. Research framework.
Sustainability 15 14626 g002
Figure 3. Heterogeneity on the enterprise scale of the GTFP and its decomposition terms in coal enterprises.
Sustainability 15 14626 g003
Figure 4. Heterogeneity in the enterprise growth stage of the GTFP and its decomposition terms in coal enterprises.
Sustainability 15 14626 g004
Figure 5. Heterogeneity in GEC of the GTFP and its decomposition terms in coal enterprises.
Sustainability 15 14626 g005
Figure 6. Heterogeneity at the provincial level in China’s coal industry. Note: The provinces not filled with color are missing values, and the reason is that these provinces produce less coal.
Sustainability 15 14626 g006
Table 1. Measurement results of the heterogeneity of the GTFP and its decomposition terms in coal enterprises.
Heterogeneity IndexQuantile
(90–10%)
Quantile
(75–25%)
Coefficient of Variation
AvgSDAvgSDAvgSD
GTFPInter-enterprise within the province1.1251.0080.4920.3510.6030.421
Inter-province0.9130.4230.600
Inter-enterprise0.9240.4331.142
TCInter-enterprise within the province0.7600.3660.3930.2320.3720.200
Inter-province0.7400.3670.382
Inter-enterprise0.6520.2710.342
PECInter-enterprise within the province1.3100.9180.6550.4740.5770.383
Inter-province1.1230.5570.556
Inter-enterprise0.2210.5991.170
SECInter-enterprise within the province1.3080.9100.6570.4700.5790.380
Inter-province1.1240.5590.566
Inter-enterprise1.2290.6031.168
Note: Avg and SD represent the average and standard deviation, respectively.
Table 2. Estimated results of the parameters.
GTFP
(1)(2)(3)(4)(5)
tech0.852 ***0.855 ***0.862 ***0.859 ***0.850 ***
(52.24)(52.94)(53.16)(48.42)(48.17)
pech0.485 ***0.486 ***0.515 ***0.515 ***0.486 ***
(9.00)(9.10)(9.58)(9.56)(9.09)
sech0.873 ***0.872 ***0.873 ***0.873 ***0.873 ***
(97.86)(98.58)(97.76)(97.44)(98.27)
ist−0.057 **−0.052 **−0.041 *−0.042 *−0.054 **
(-2.49)(−2.29)(−1.74)(−1.77)(−2.33)
tech × ist−0.357 ***−0.361 ***−0.361 ***−0.360 ***−0.361 ***
(−2.85)(−2.91)(−2.93)(−2.93)(−2.91)
pech × ist0.356 ***0.360 ***0.346 ***0.345 ***0.359 ***
(2.98)(3.04)(2.93)(2.93)(3.03)
tovw1.398 **1.373 **1.137 *1.155 *1.402 **
(2.12)(2.10)(1.75)(1.77)(2.14)
tovw × sech−1.037 *−1.020 *−0.872−0.888 *−1.047 *
(−1.92)(−1.91)(−1.63)(−1.66)(−1.95)
age310.957 ***11.317 ***10.835 ***10.877 ***11.389 ***
(2.86)(2.97)(2.86)(2.86)(2.99)
age3 × tech−11.014 ***−11.393 ***−11.540 ***−11.565 ***−11.442 ***
(−2.95)(−3.08)(−3.12)(−3.13)(−3.10)
kk 0.004 ***0.004 ***0.004 ***0.004 ***
(2.64)(2.71)(2.71)(2.65)
_cons−1.271 ***−1.275 ***−1.274 ***−1.269 ***−1.267 ***
(−21.74)(−21.98)(−13.91)(−13.71)(−21.36)
Provincial fixed effectNoNoYesNoNo
Year fixed effectNoNoNoNoYes
Provincial fixed effect × Year fixed effectNoNoNoYesNo
N12731273127312731273
R20.9010.9030.9050.9060.903
Adj. R20.9000.9020.9030.9030.902
F-statistic1142.781 ***1065.962 ***396.543 ***383.613 ***977.335 ***
Note: Values in parentheses are standard deviations; “*”, “**”, and “***” indicate coefficients significant at the 10%, 5%, and 1% levels of significance, respectively. age3 and tovw are multiplied by 0.0000001.
Table 3. Robustness tests.
Provincial Fixed Effect × Year Fixed EffectYear Fixed EffectProvincial Fixed Effect
Truncation
(2.5%, 97.5%)
OLSTruncation
(2.5%, 97.5%)
OLSTruncation
(2.5%, 97.5%)
OLS
tech0.643 ***0.855 ***0.629 ***0.842 ***0.671 ***0.858 ***
(37.21)(46.89)(37.29)(46.18)(42.48)(51.11)
pech0.444 ***0.507 ***0.423 ***0.470 ***0.448 ***0.508 ***
(11.04)(9.22)(10.67)(8.57)(11.08)(9.24)
sech0.778 ***0.873 ***0.776 ***0.873 ***0.776 ***0.873 ***
(81.61)(95.18)(82.13)(95.55)(81.02)(95.52)
ist−0.019−0.034−0.024−0.047 **−0.015−0.034
(−1.10)(−1.43)(−1.44)(−2.02)(−0.83)(−1.41)
tech × ist−0.170 *−0.347 ***−0.169 *−0.344 ***−0.180 *−0.348 ***
(−1.73)(−2.75)(−1.72)(−2.68)(−1.83)(−2.76)
pech × ist0.188 **0.333 ***0.187 **0.344 ***0.197 **0.334 ***
(2.02)(2.76)(2.01)(2.81)(2.11)(2.77)
tovw1.292 **1.226 *1.455 ***1.544 **1.145 **1.208 *
(2.58)(1.82)(2.92)(2.27)(2.28)(1.80)
tovw × sech−0.950 **−0.950 *−1.070 ***−1.168 **−0.821 **−0.934 *
(−2.30)(−1.71)(−2.60)(−2.08)(−1.98)(−1.68)
age30.540 *1.000 ***0.4871.024 ***0.564 *0.996 **
(1.82)(2.58)(1.64)(2.62)(1.89)(2.58)
age3 × tech−0.614 **−1.063 ***−0.543 *−1.024 ***−0.652 **−1.061 ***
(−2.09)(−2.80)(−1.85)(−2.68)(−2.21)(−2.79)
kk0.0010.0020.0010.0010.0010.002
(0.80)(1.34)(0.55)(0.92)(0.91)(1.34)
_cons−0.943 ***−1.258 ***−0.887 ***−1.243 ***−0.943 ***−1.264 ***
(−12.38)(−13.90)(−18.61)(−20.43)(−12.38)(−14.11)
Provincial fixed effectNoNoNoNoYesYes
Year fixed effectNoNoYesYesNoNo
Provincial fixed effect × Year fixed effectYesYesNoNoNoNo
N121112731211127312111273
R20.8620.9000.8590.8950.8620.900
Adj. R20.8580.8970.8570.8940.8580.897
F-statistic237.38 ***359.62 ***607.34 ***894.28 ***241.78 ***371.86 ***
Note: Values in parentheses are standard deviations; “*”, “**”, and “***” indicate coefficients significant at the 10%, 5%, and 1% levels of significance, respectively. age3 and tovw are multiplied by 0.0000001.
Disclaimer/Publisher’s Note: The statements, opinions and data contained in all publications are solely those of the individual author(s) and contributor(s) and not of MDPI and/or the editor(s). MDPI and/or the editor(s) disclaim responsibility for any injury to people or property resulting from any ideas, methods, instructions or products referred to in the content.

