
Estimating Groundwater Flow Velocity in Shallow Volcanic Aquifers of the Ethiopian Highlands Using a Geospatial Technique
 , ,
, , 
Abstract
:1. Introduction
2. Materials and Methods
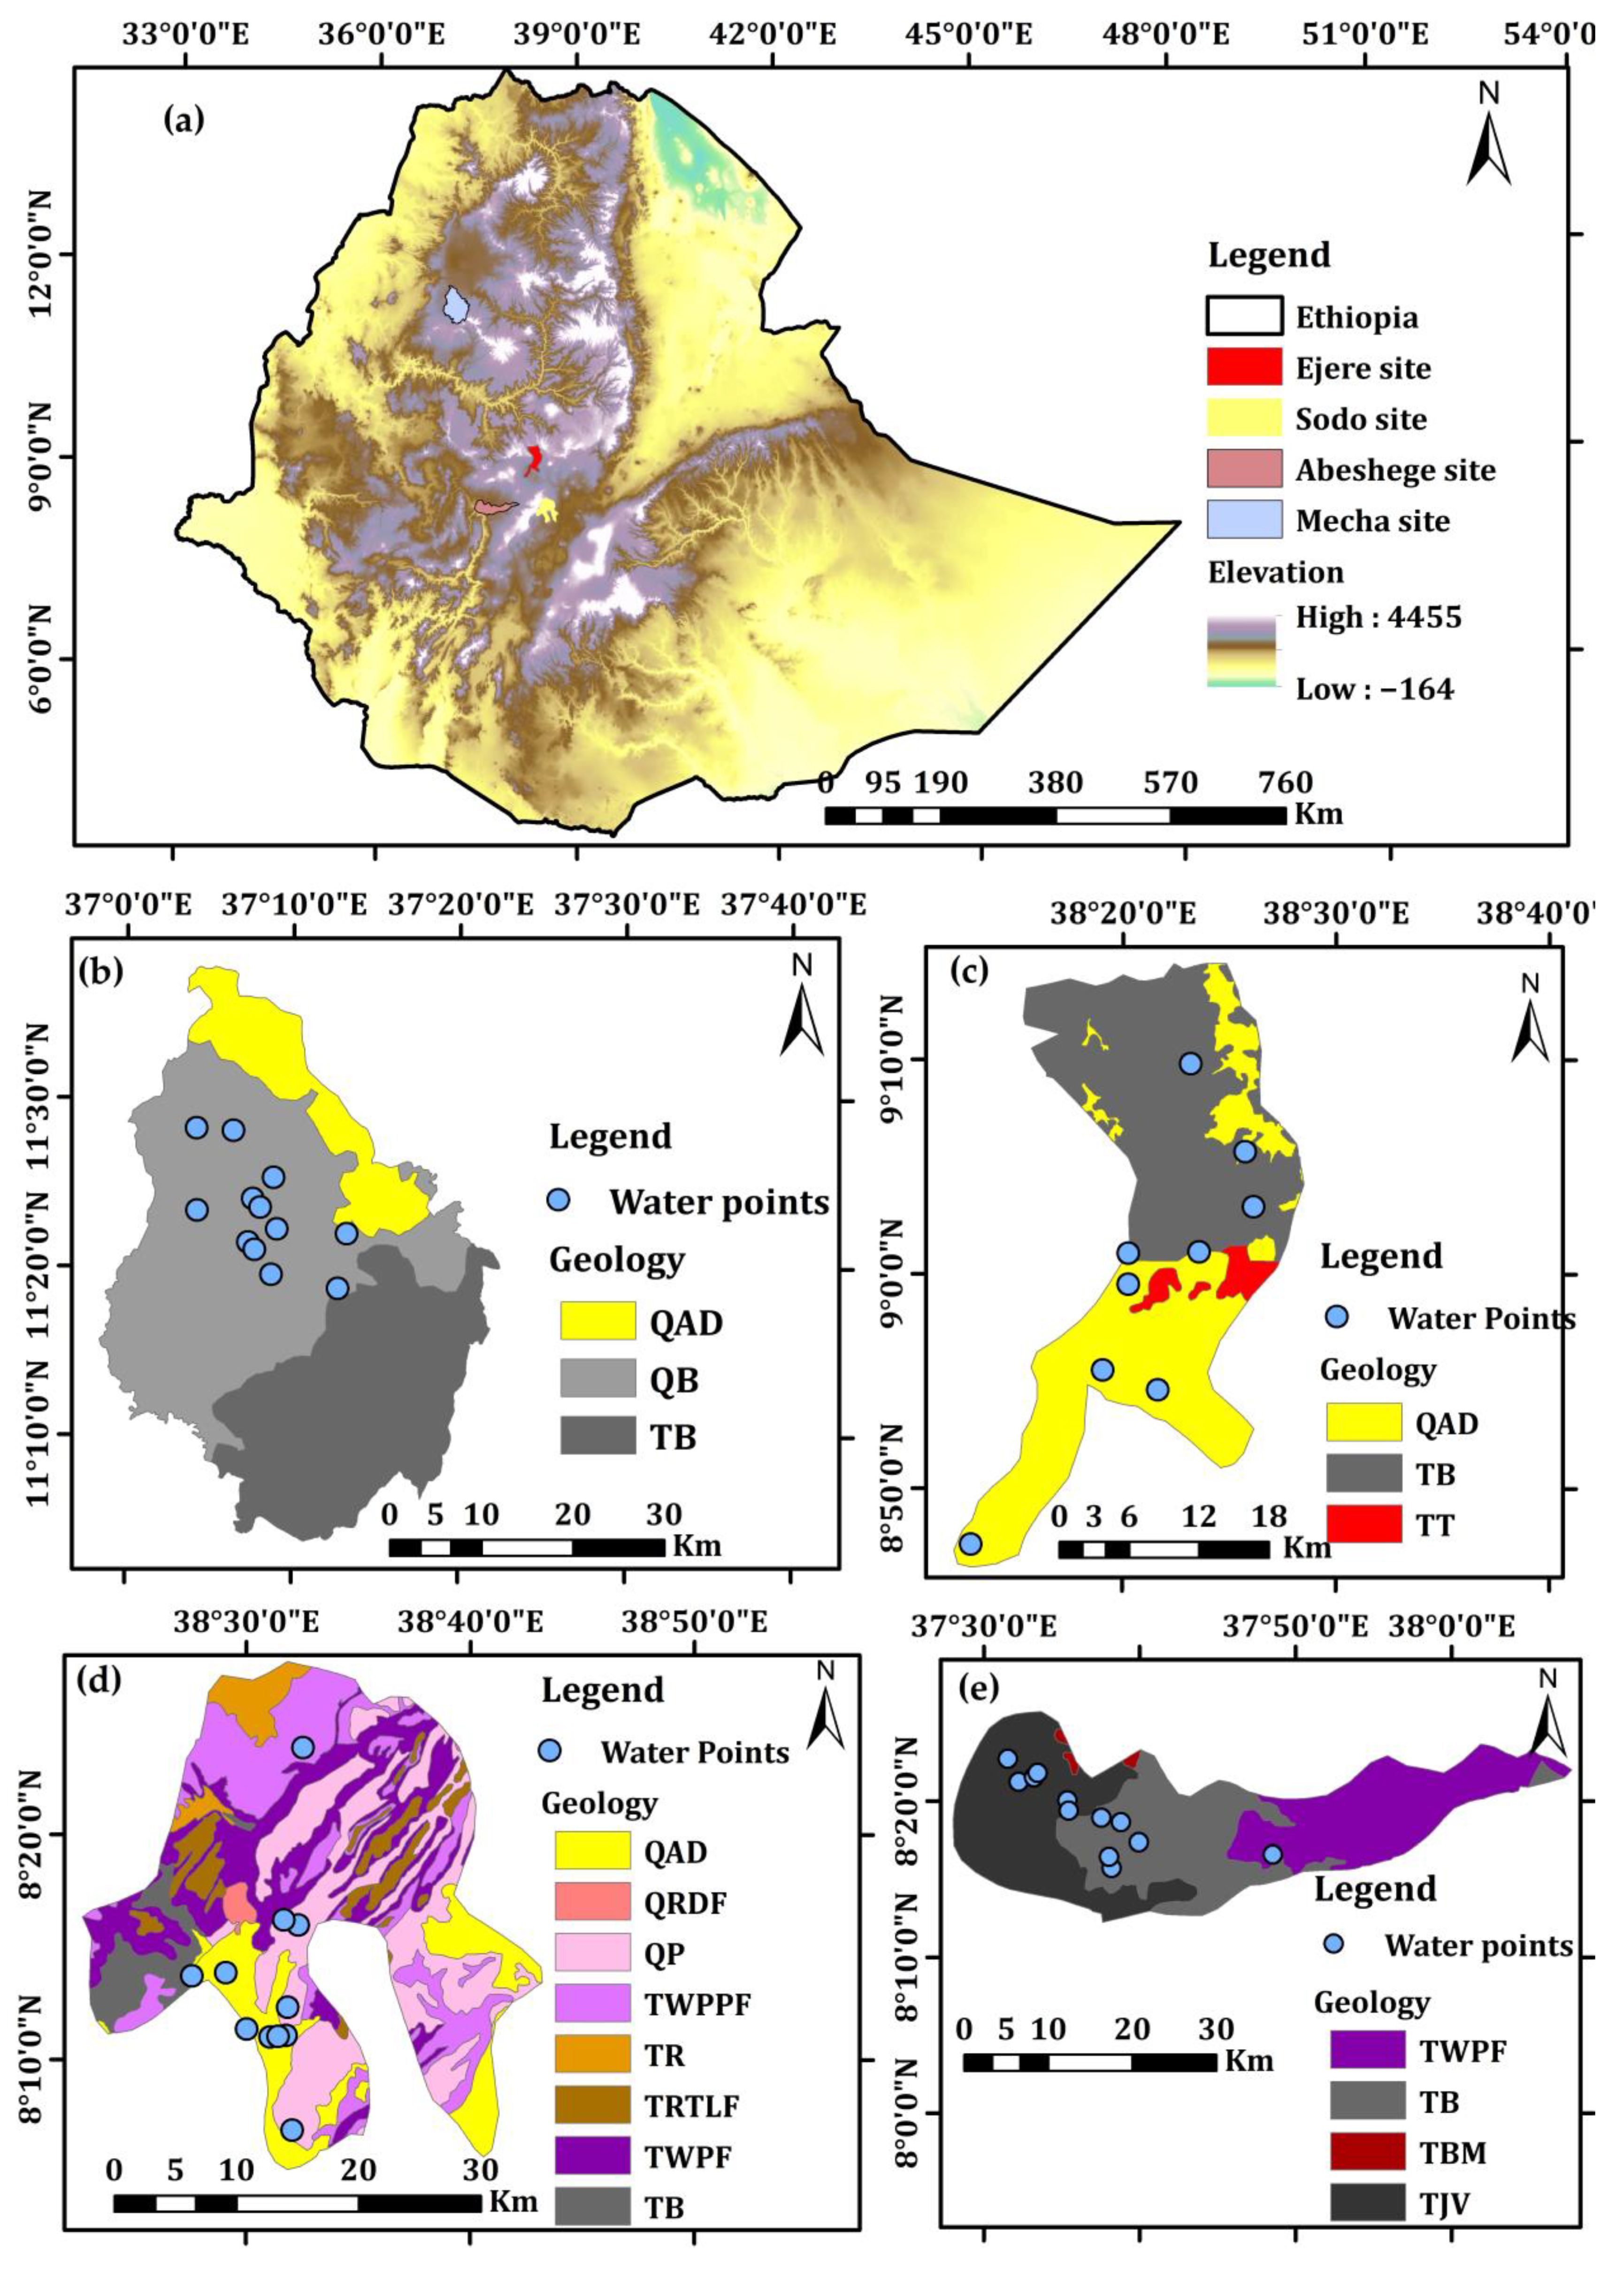
2.1. Geology and Hydrogeology
2.2. Pumping Test Data Analysis
2.3. Geospatial Technique
3. Results
3.1. Geospatial Analysis of Hydrogeological Features
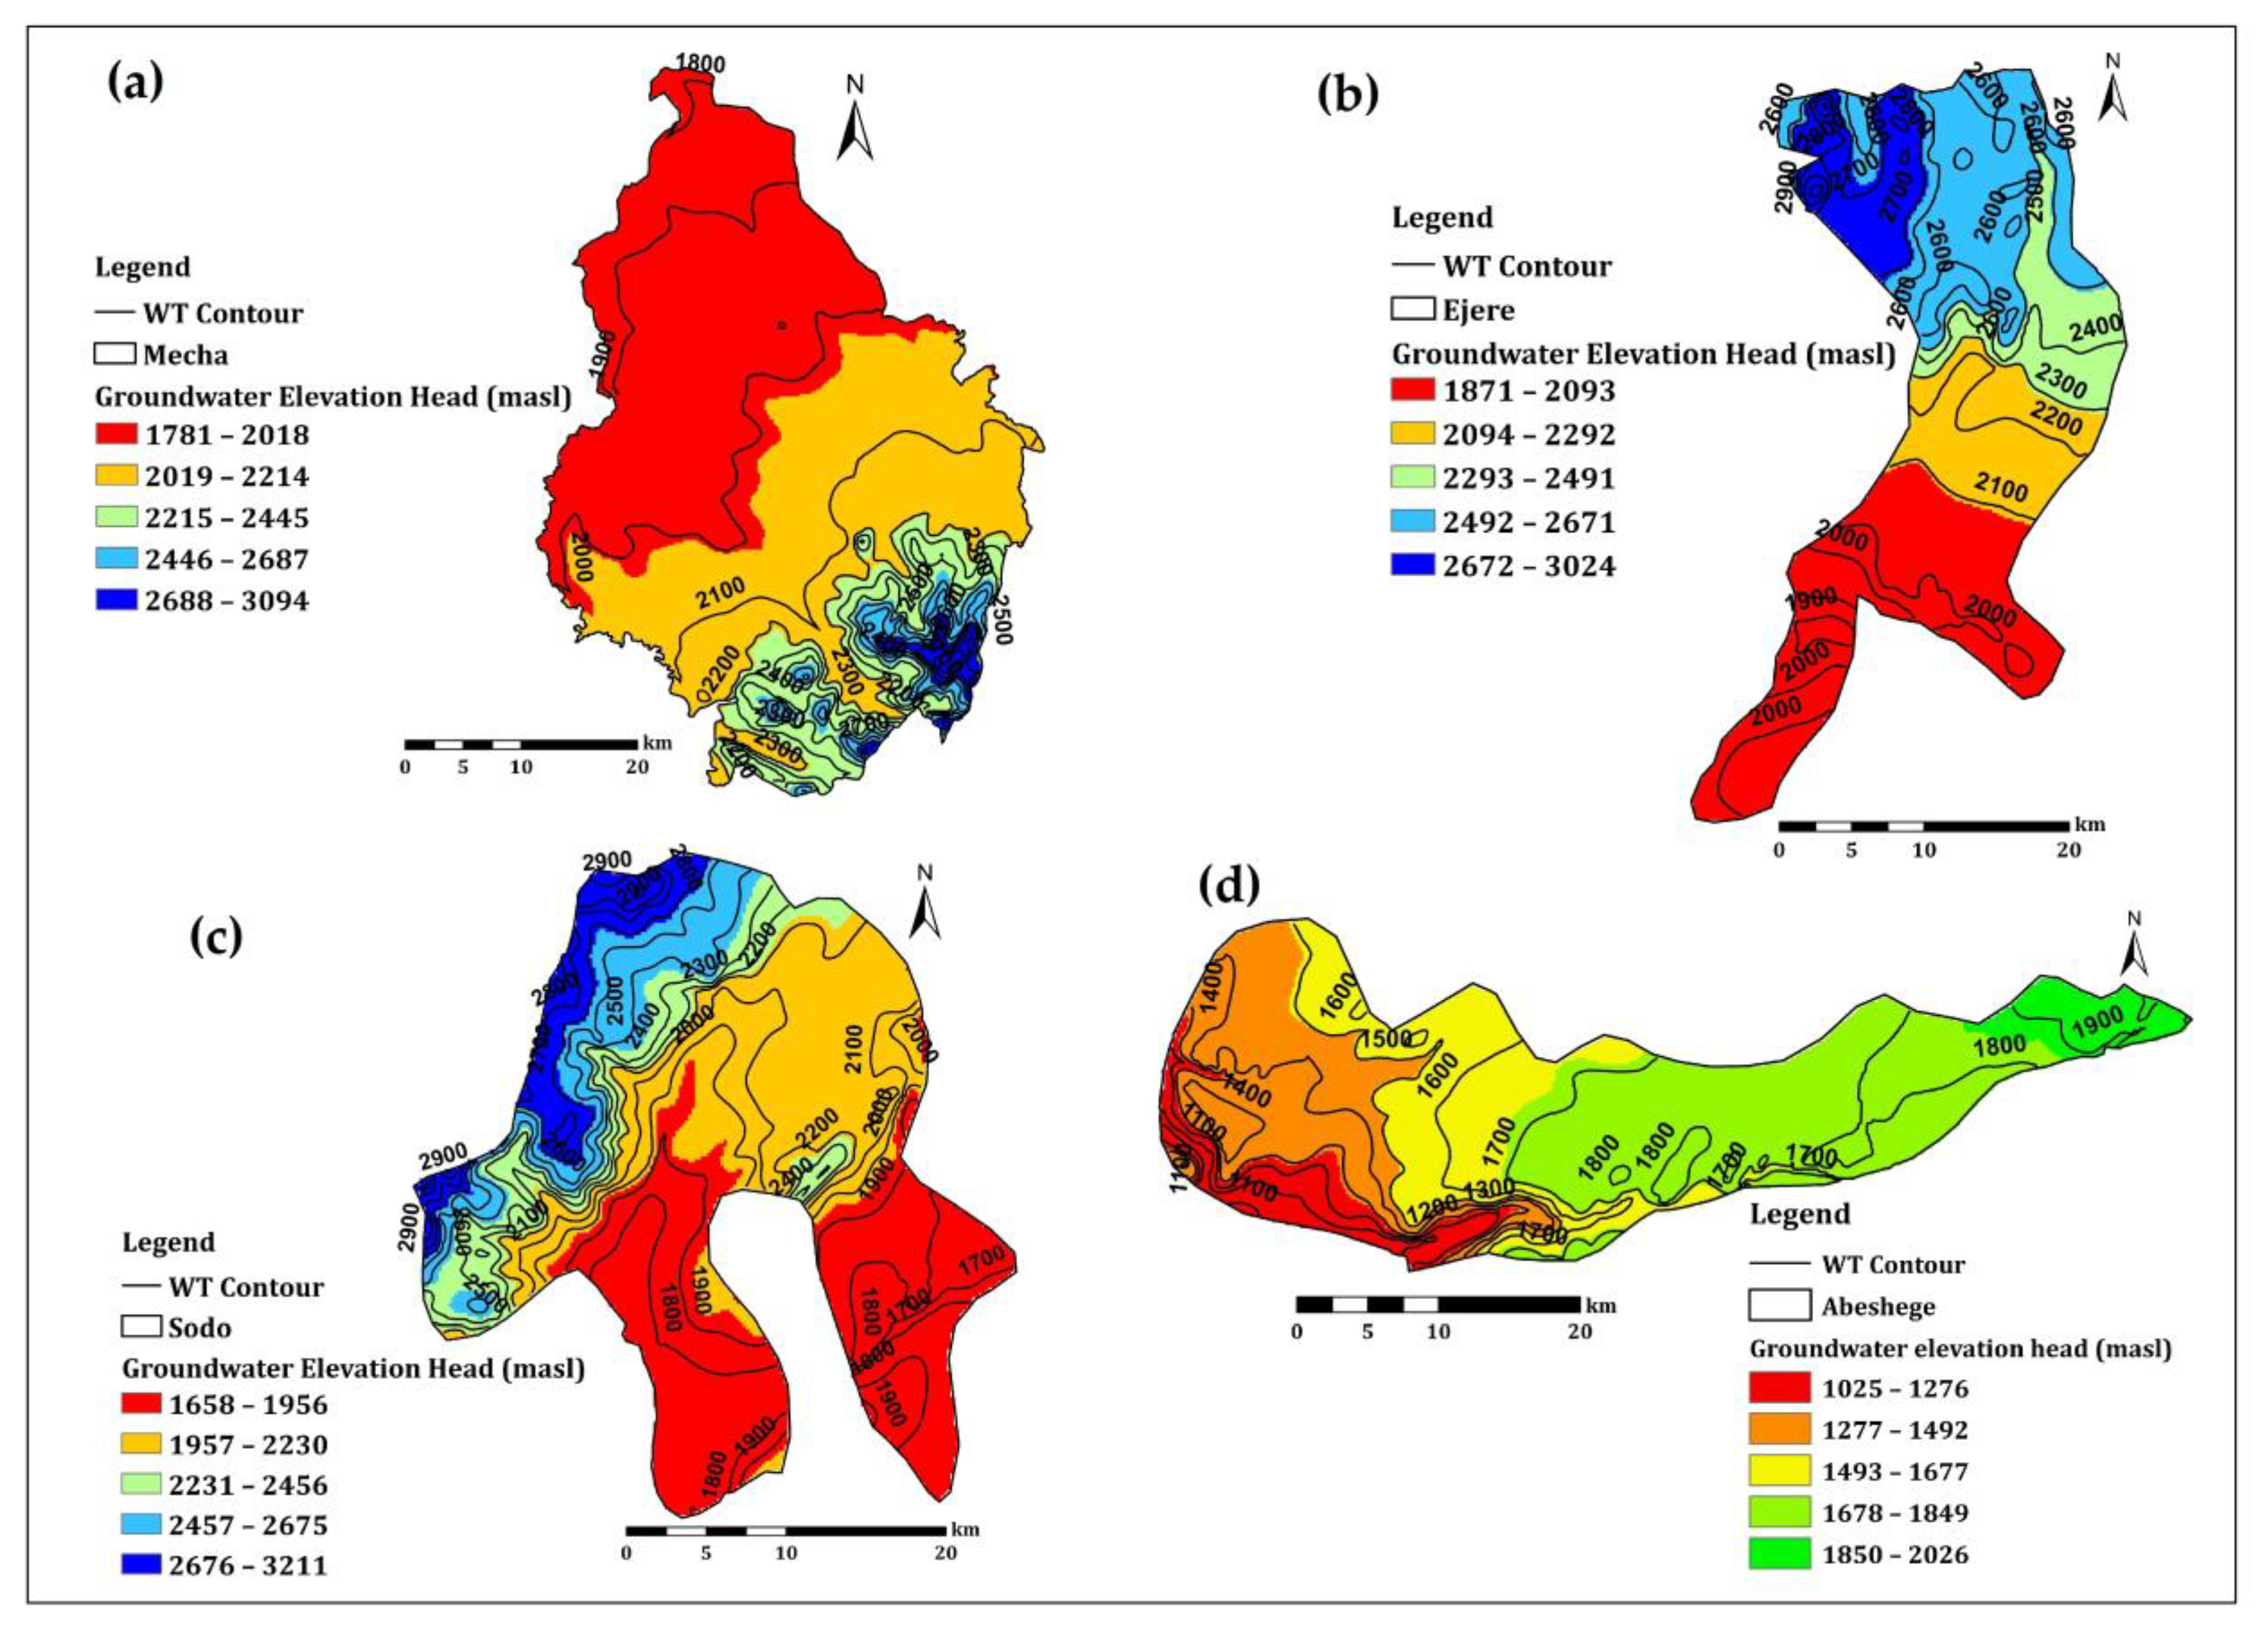
3.1.1. Groundwater Elevation Head and Water Table Contour Map of all Study Sites
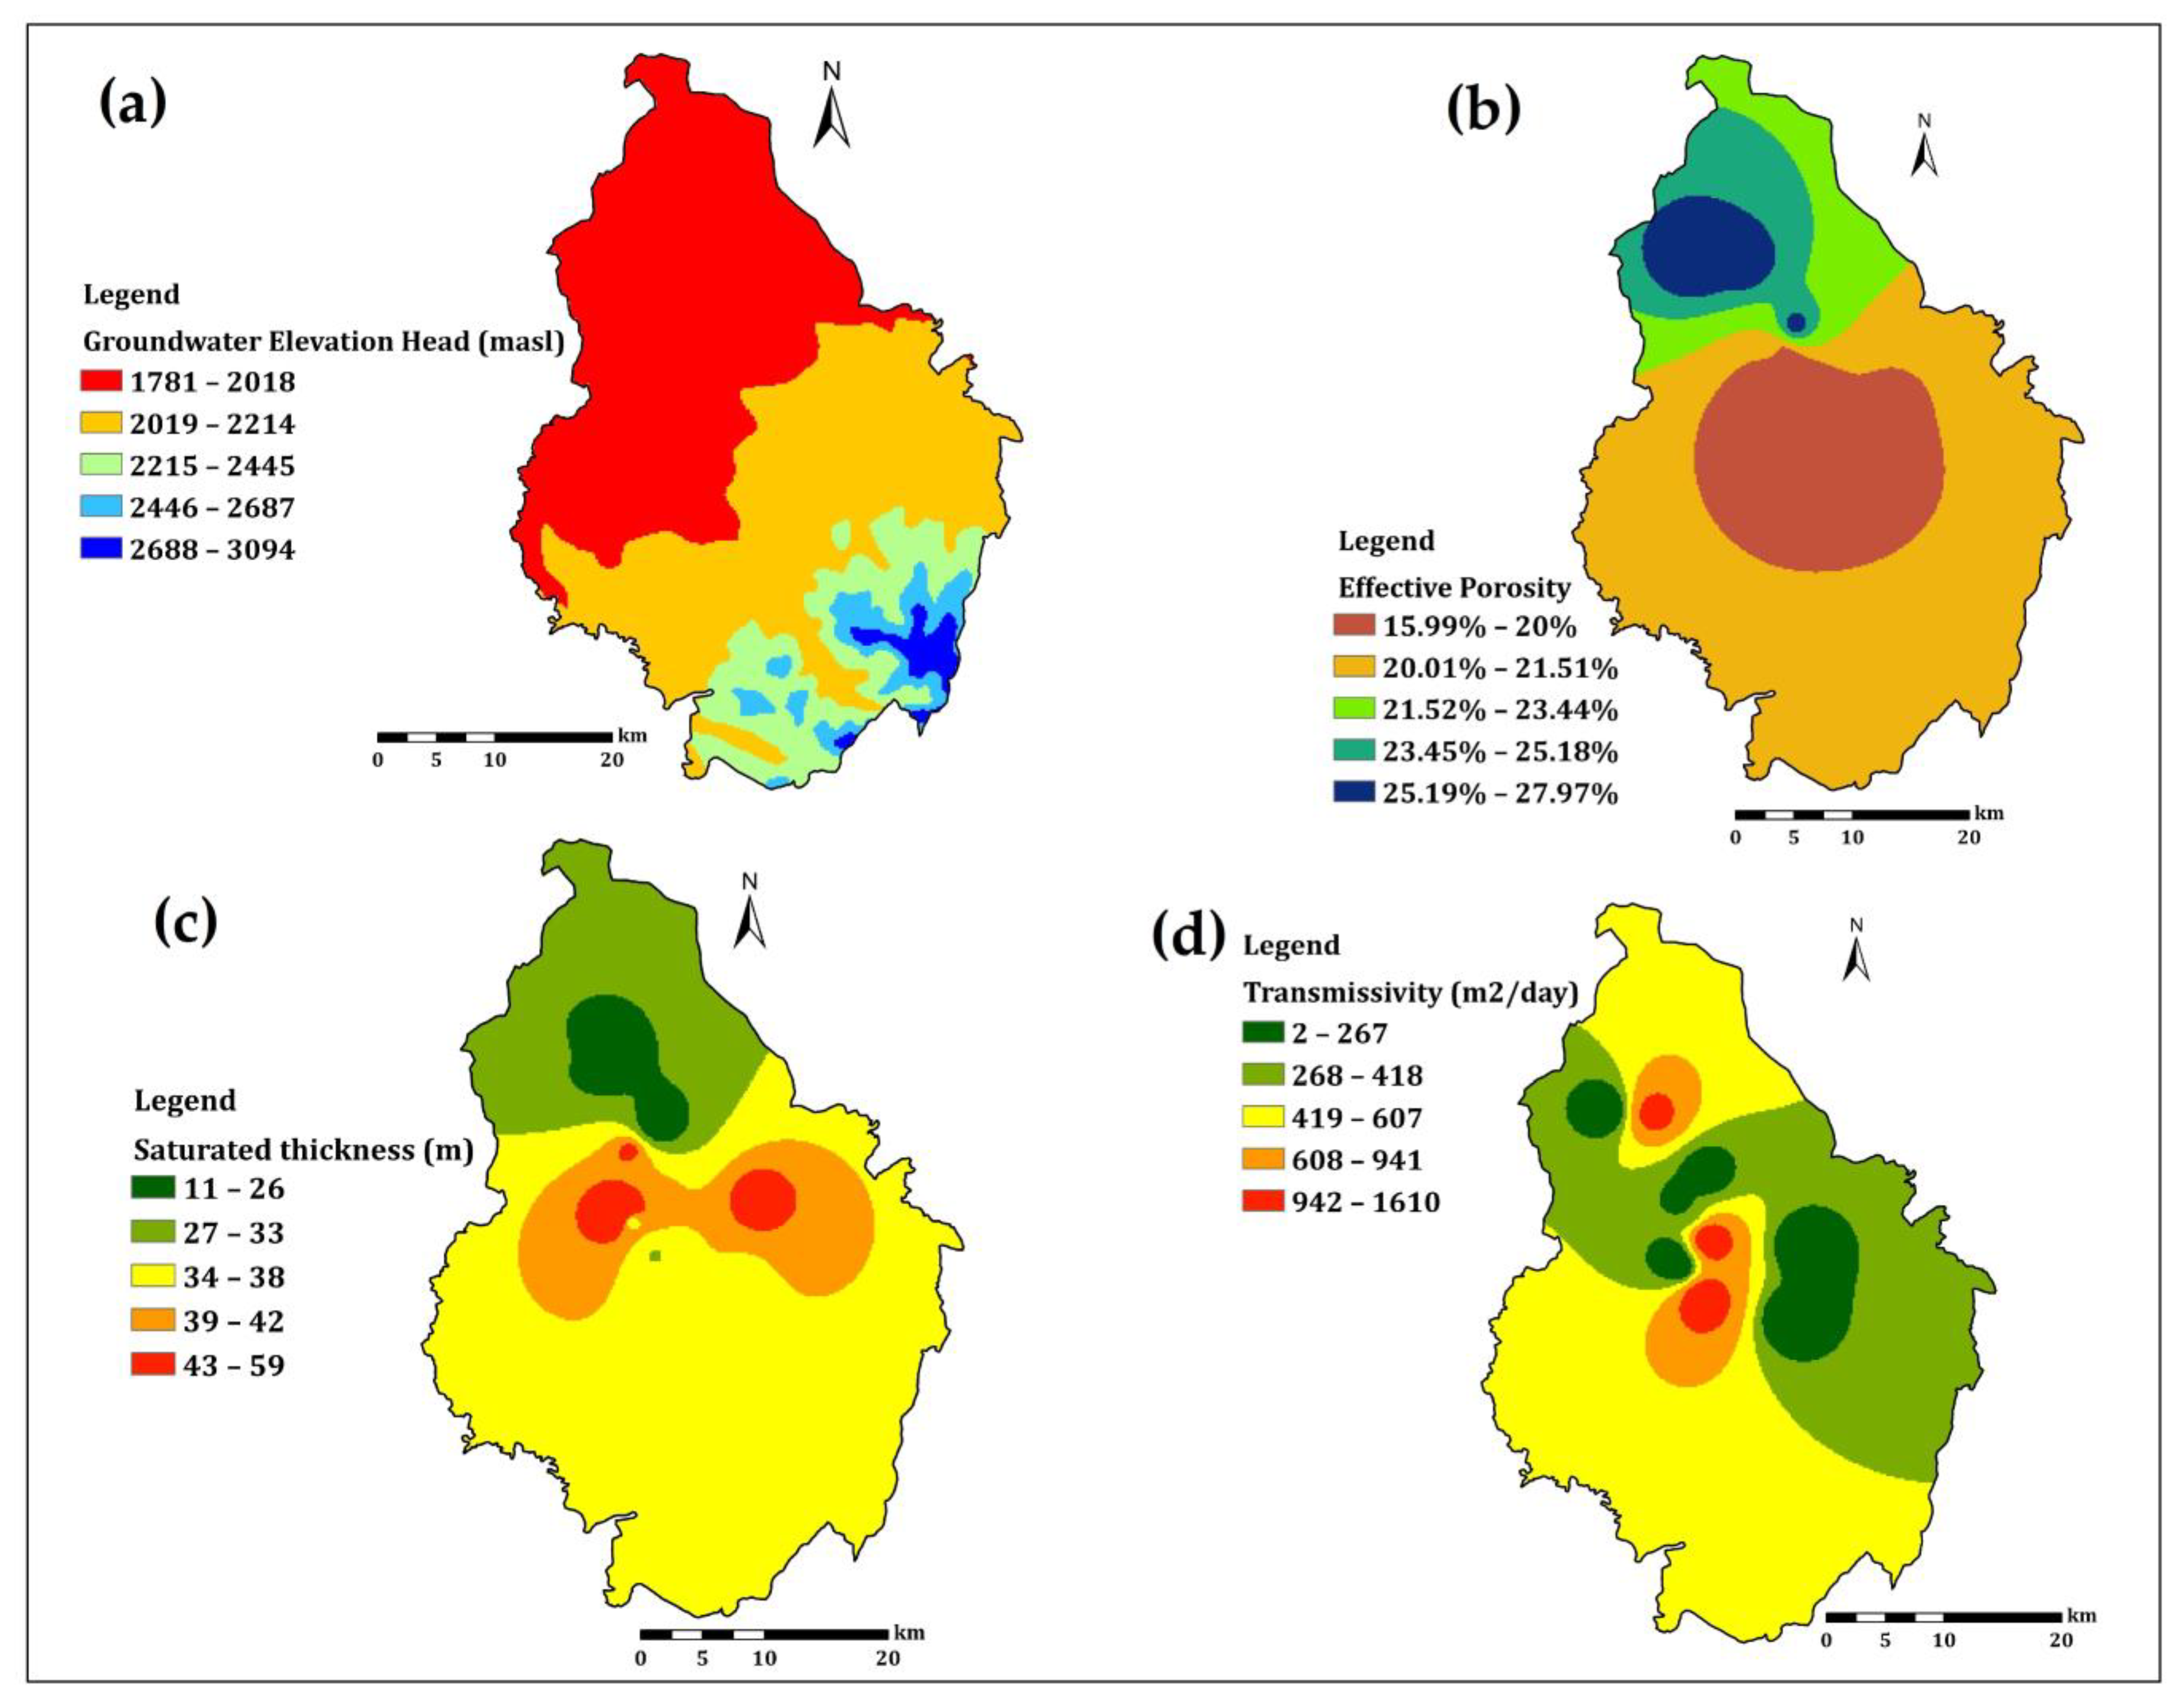
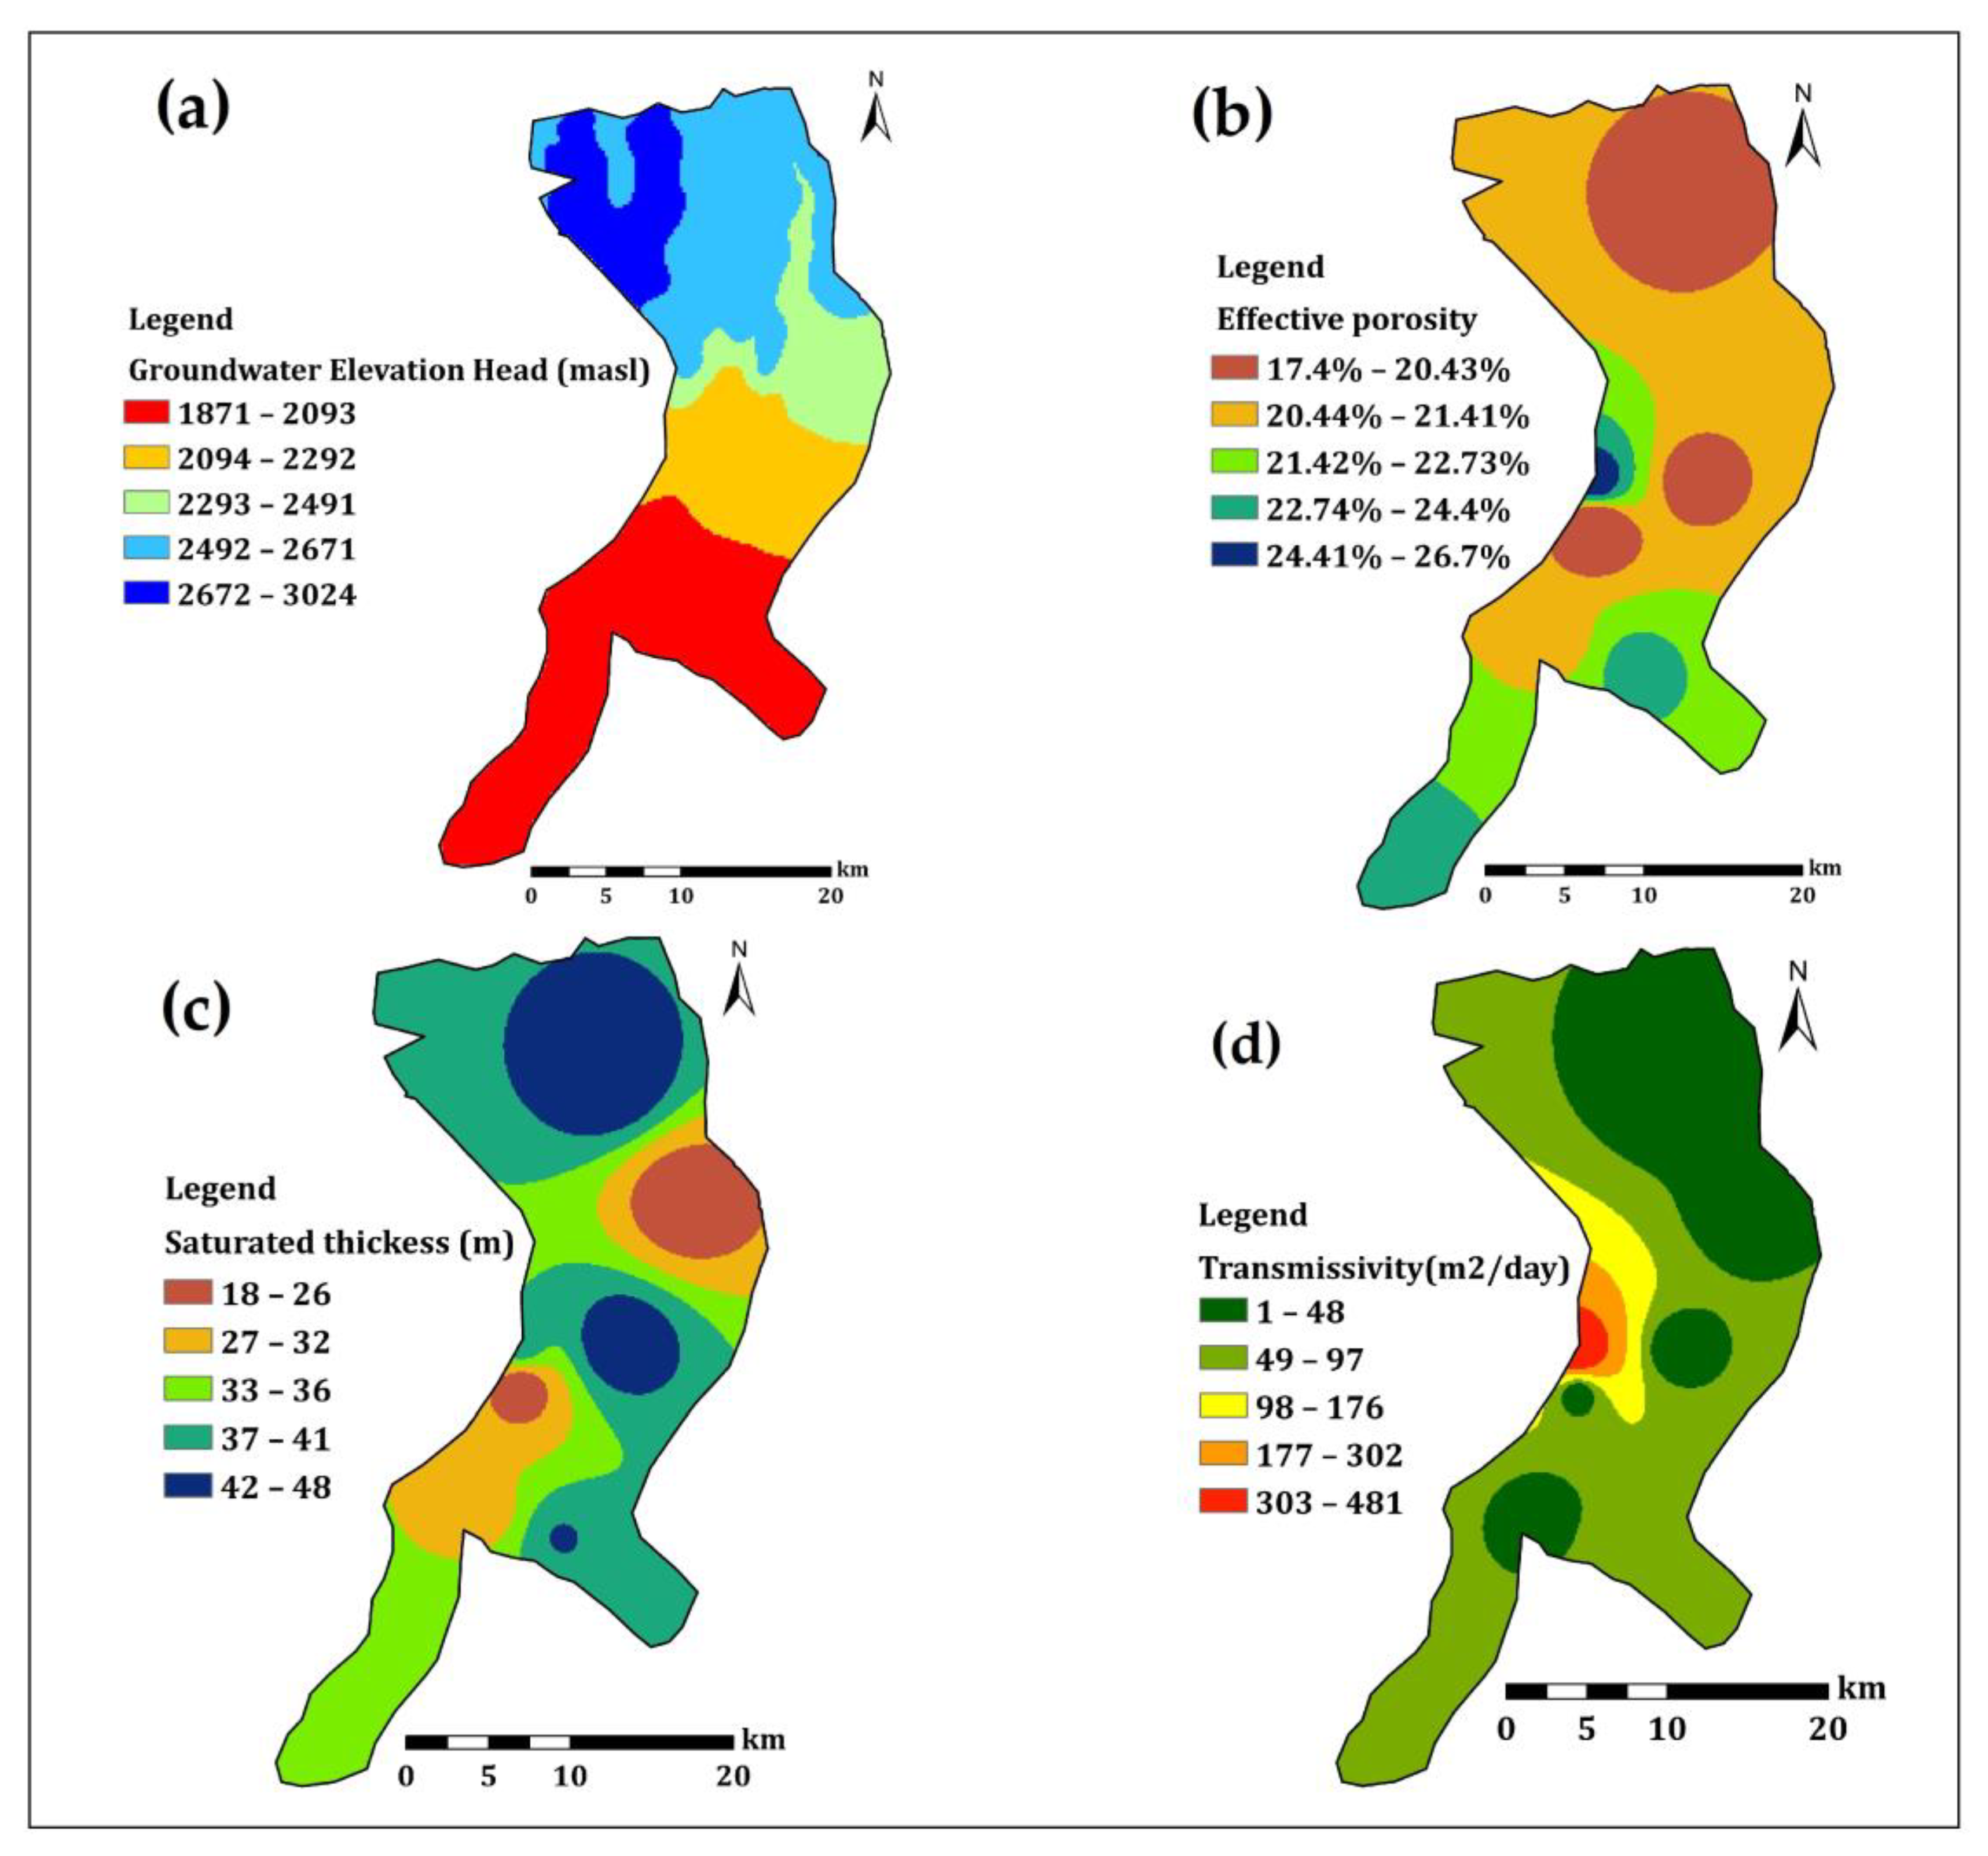
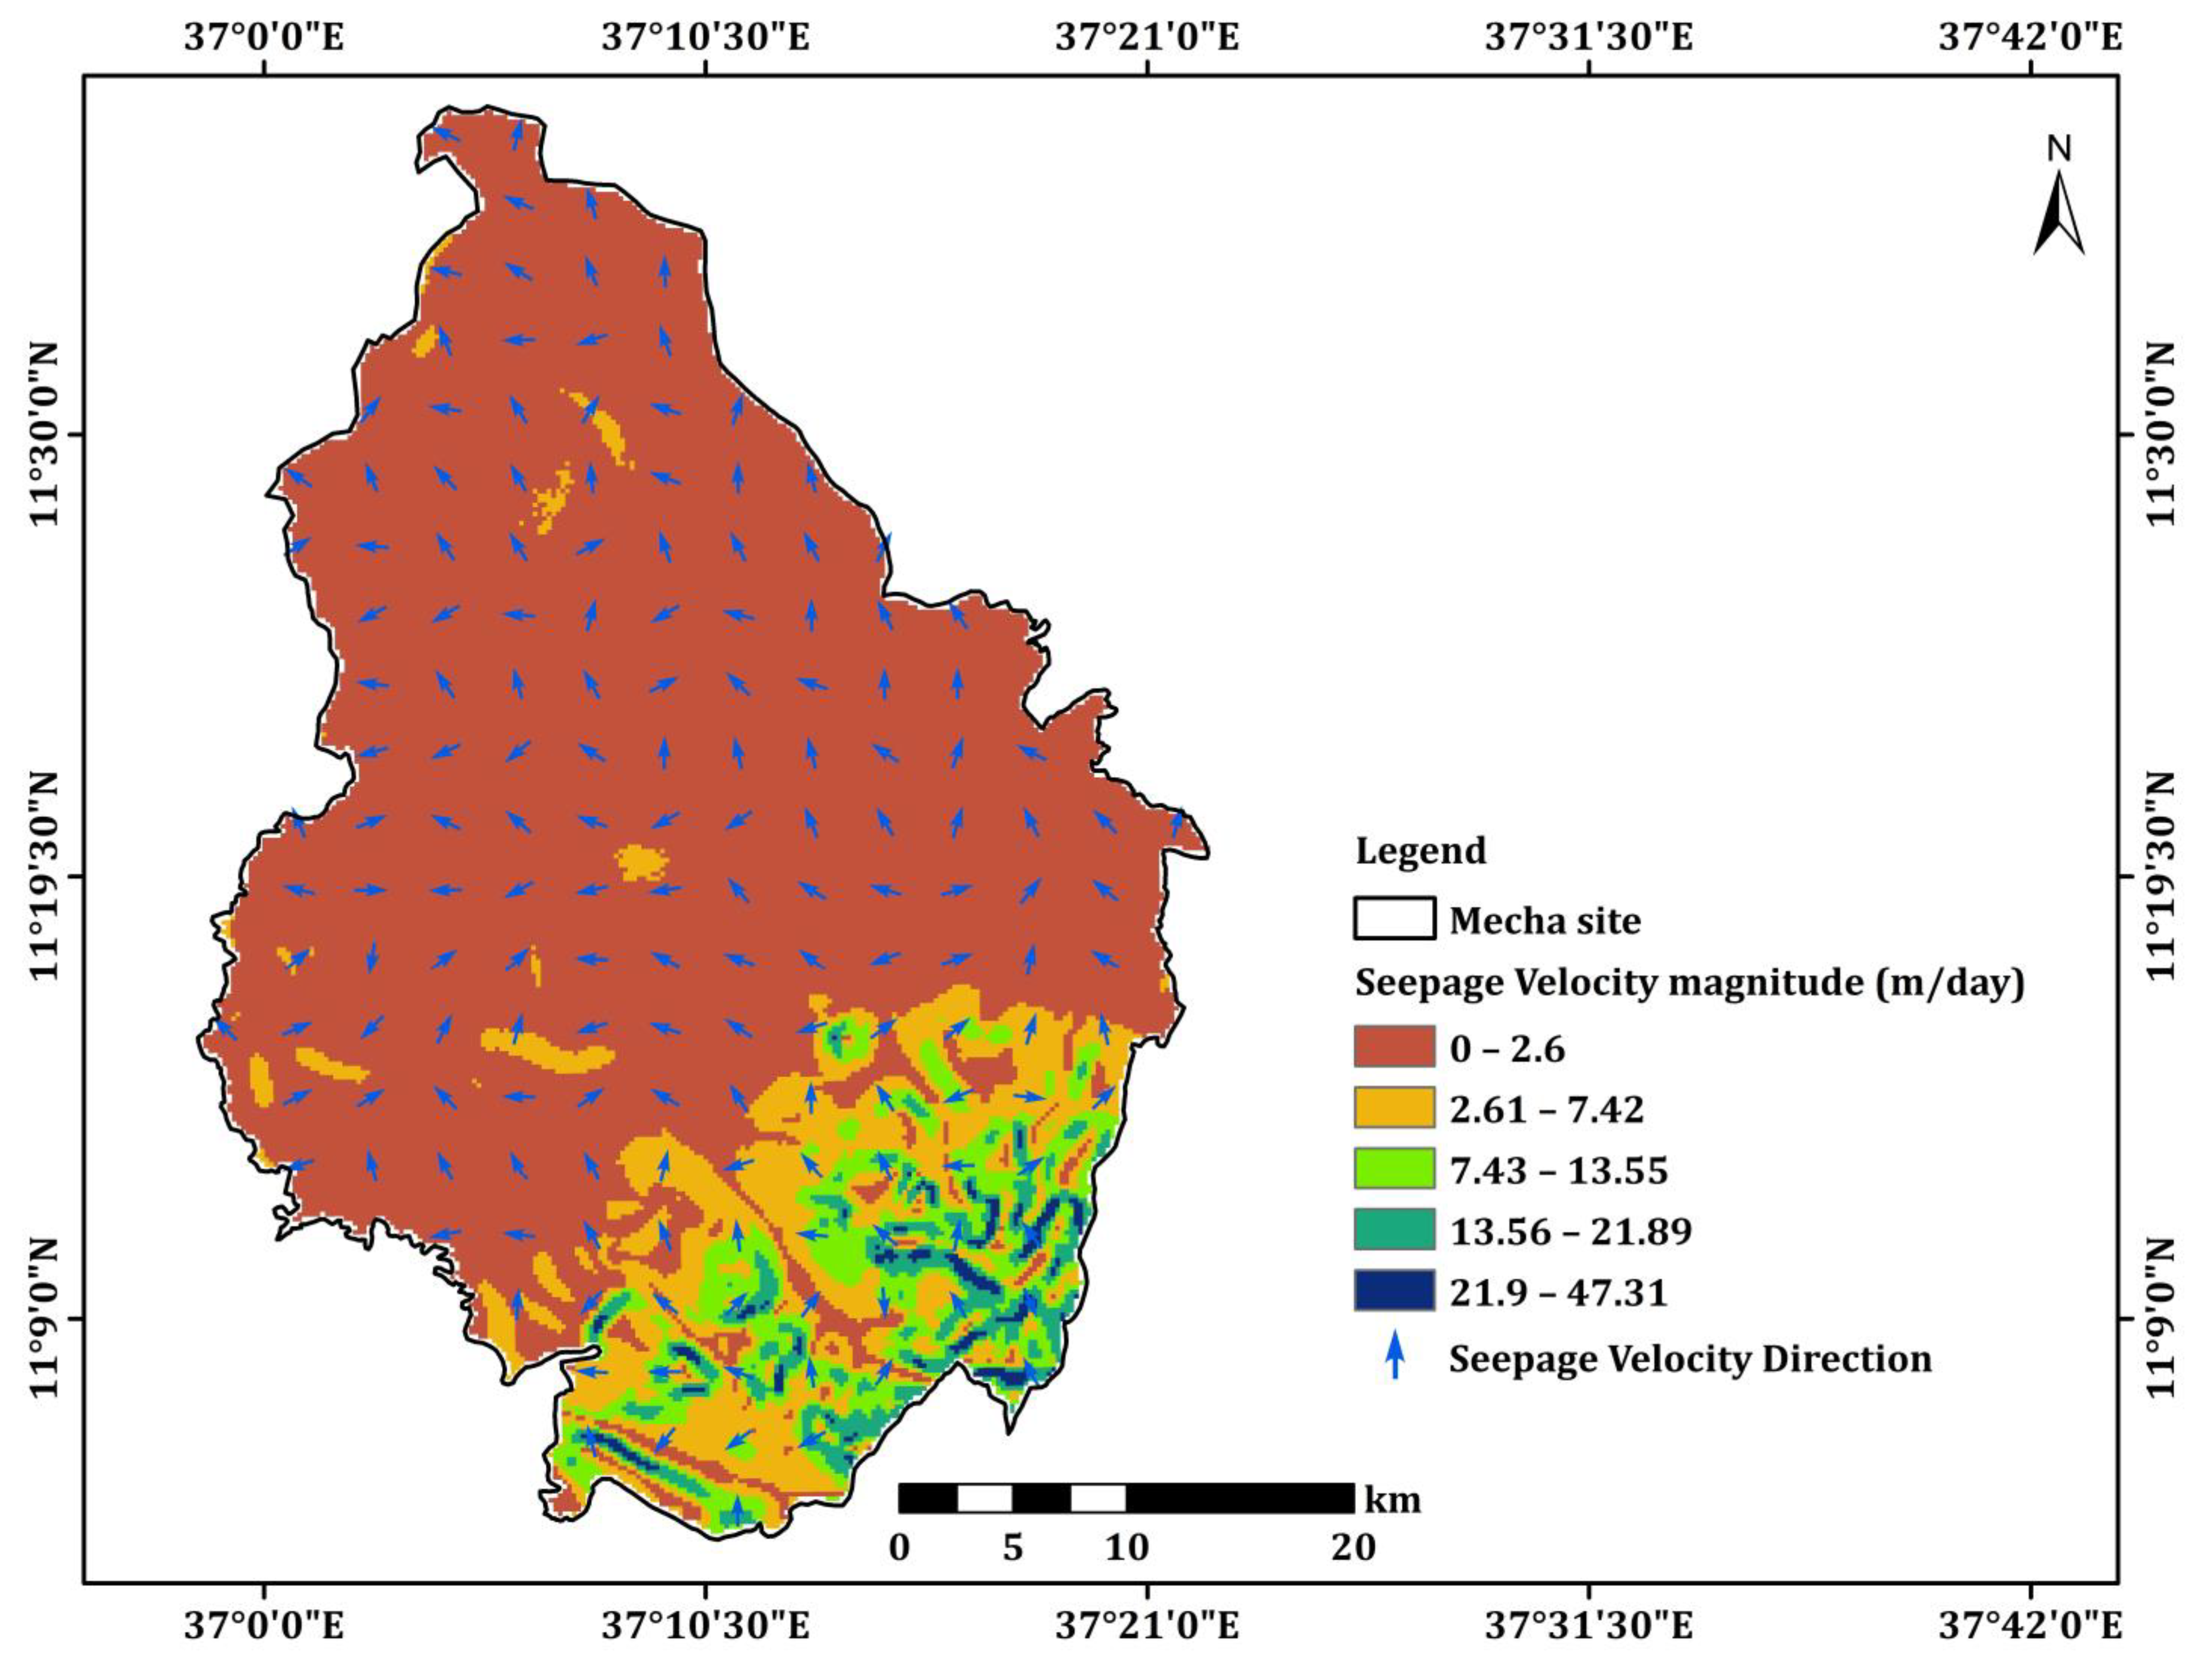
3.1.2. Mecha Site
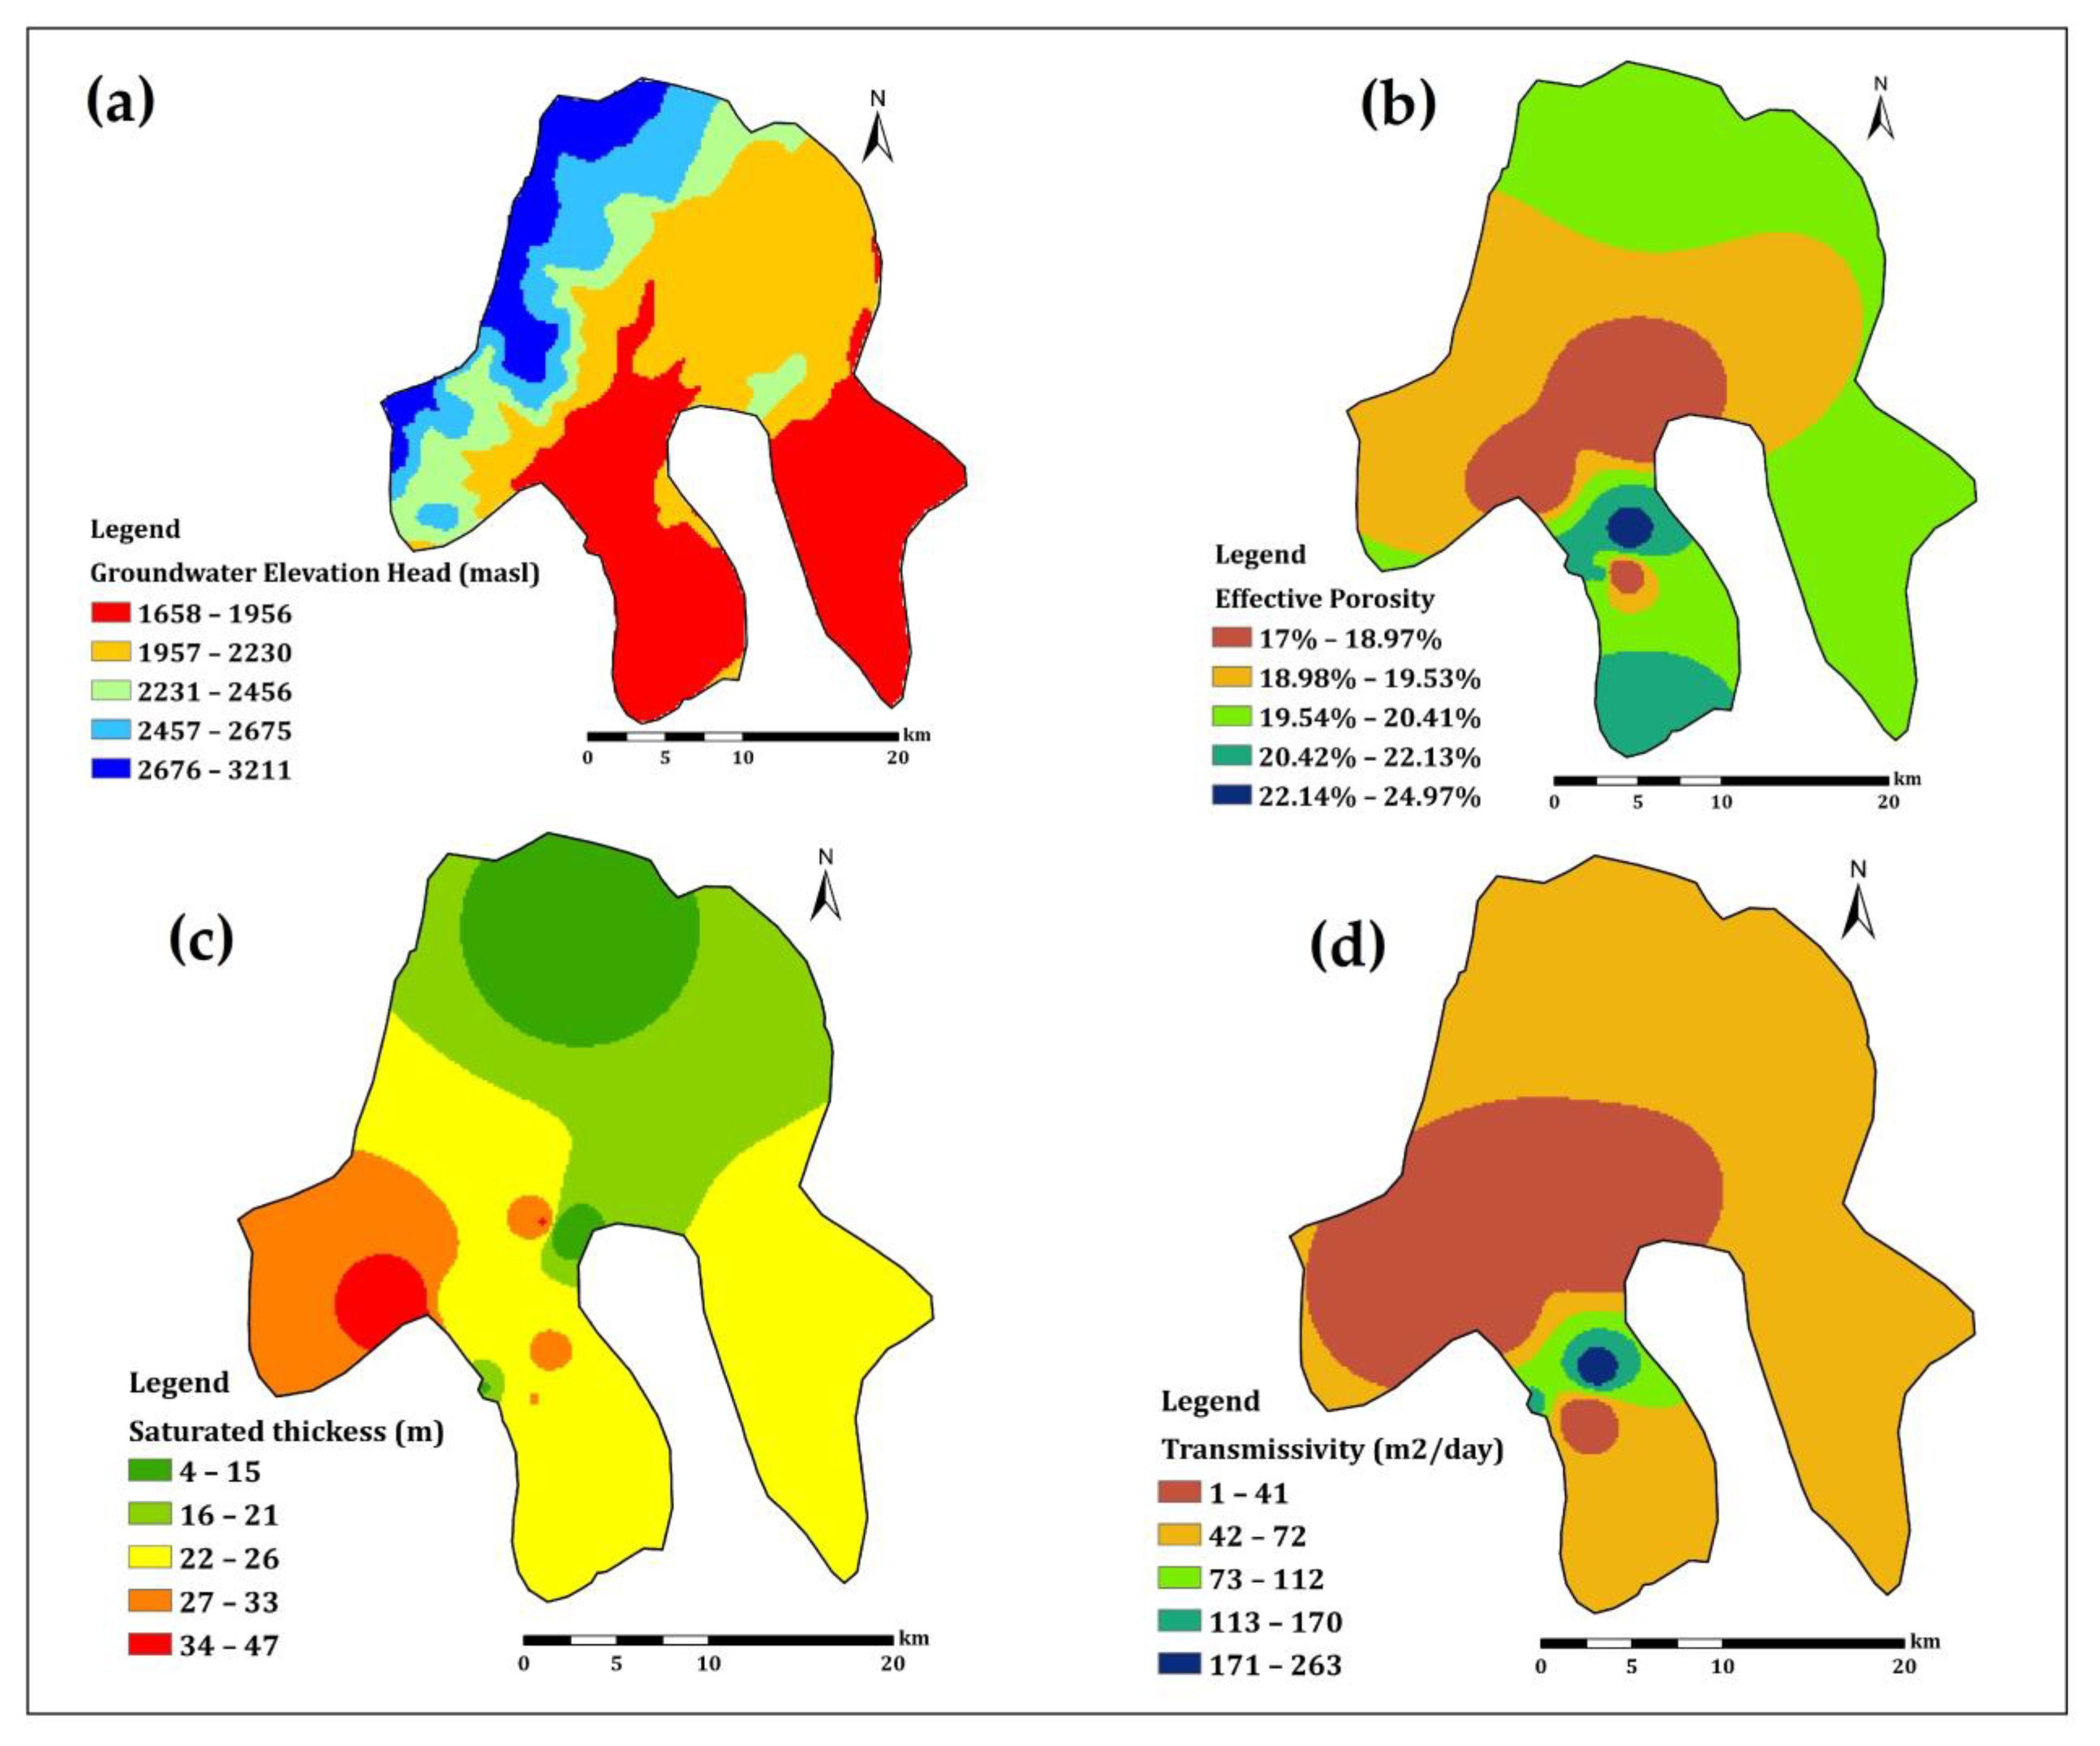
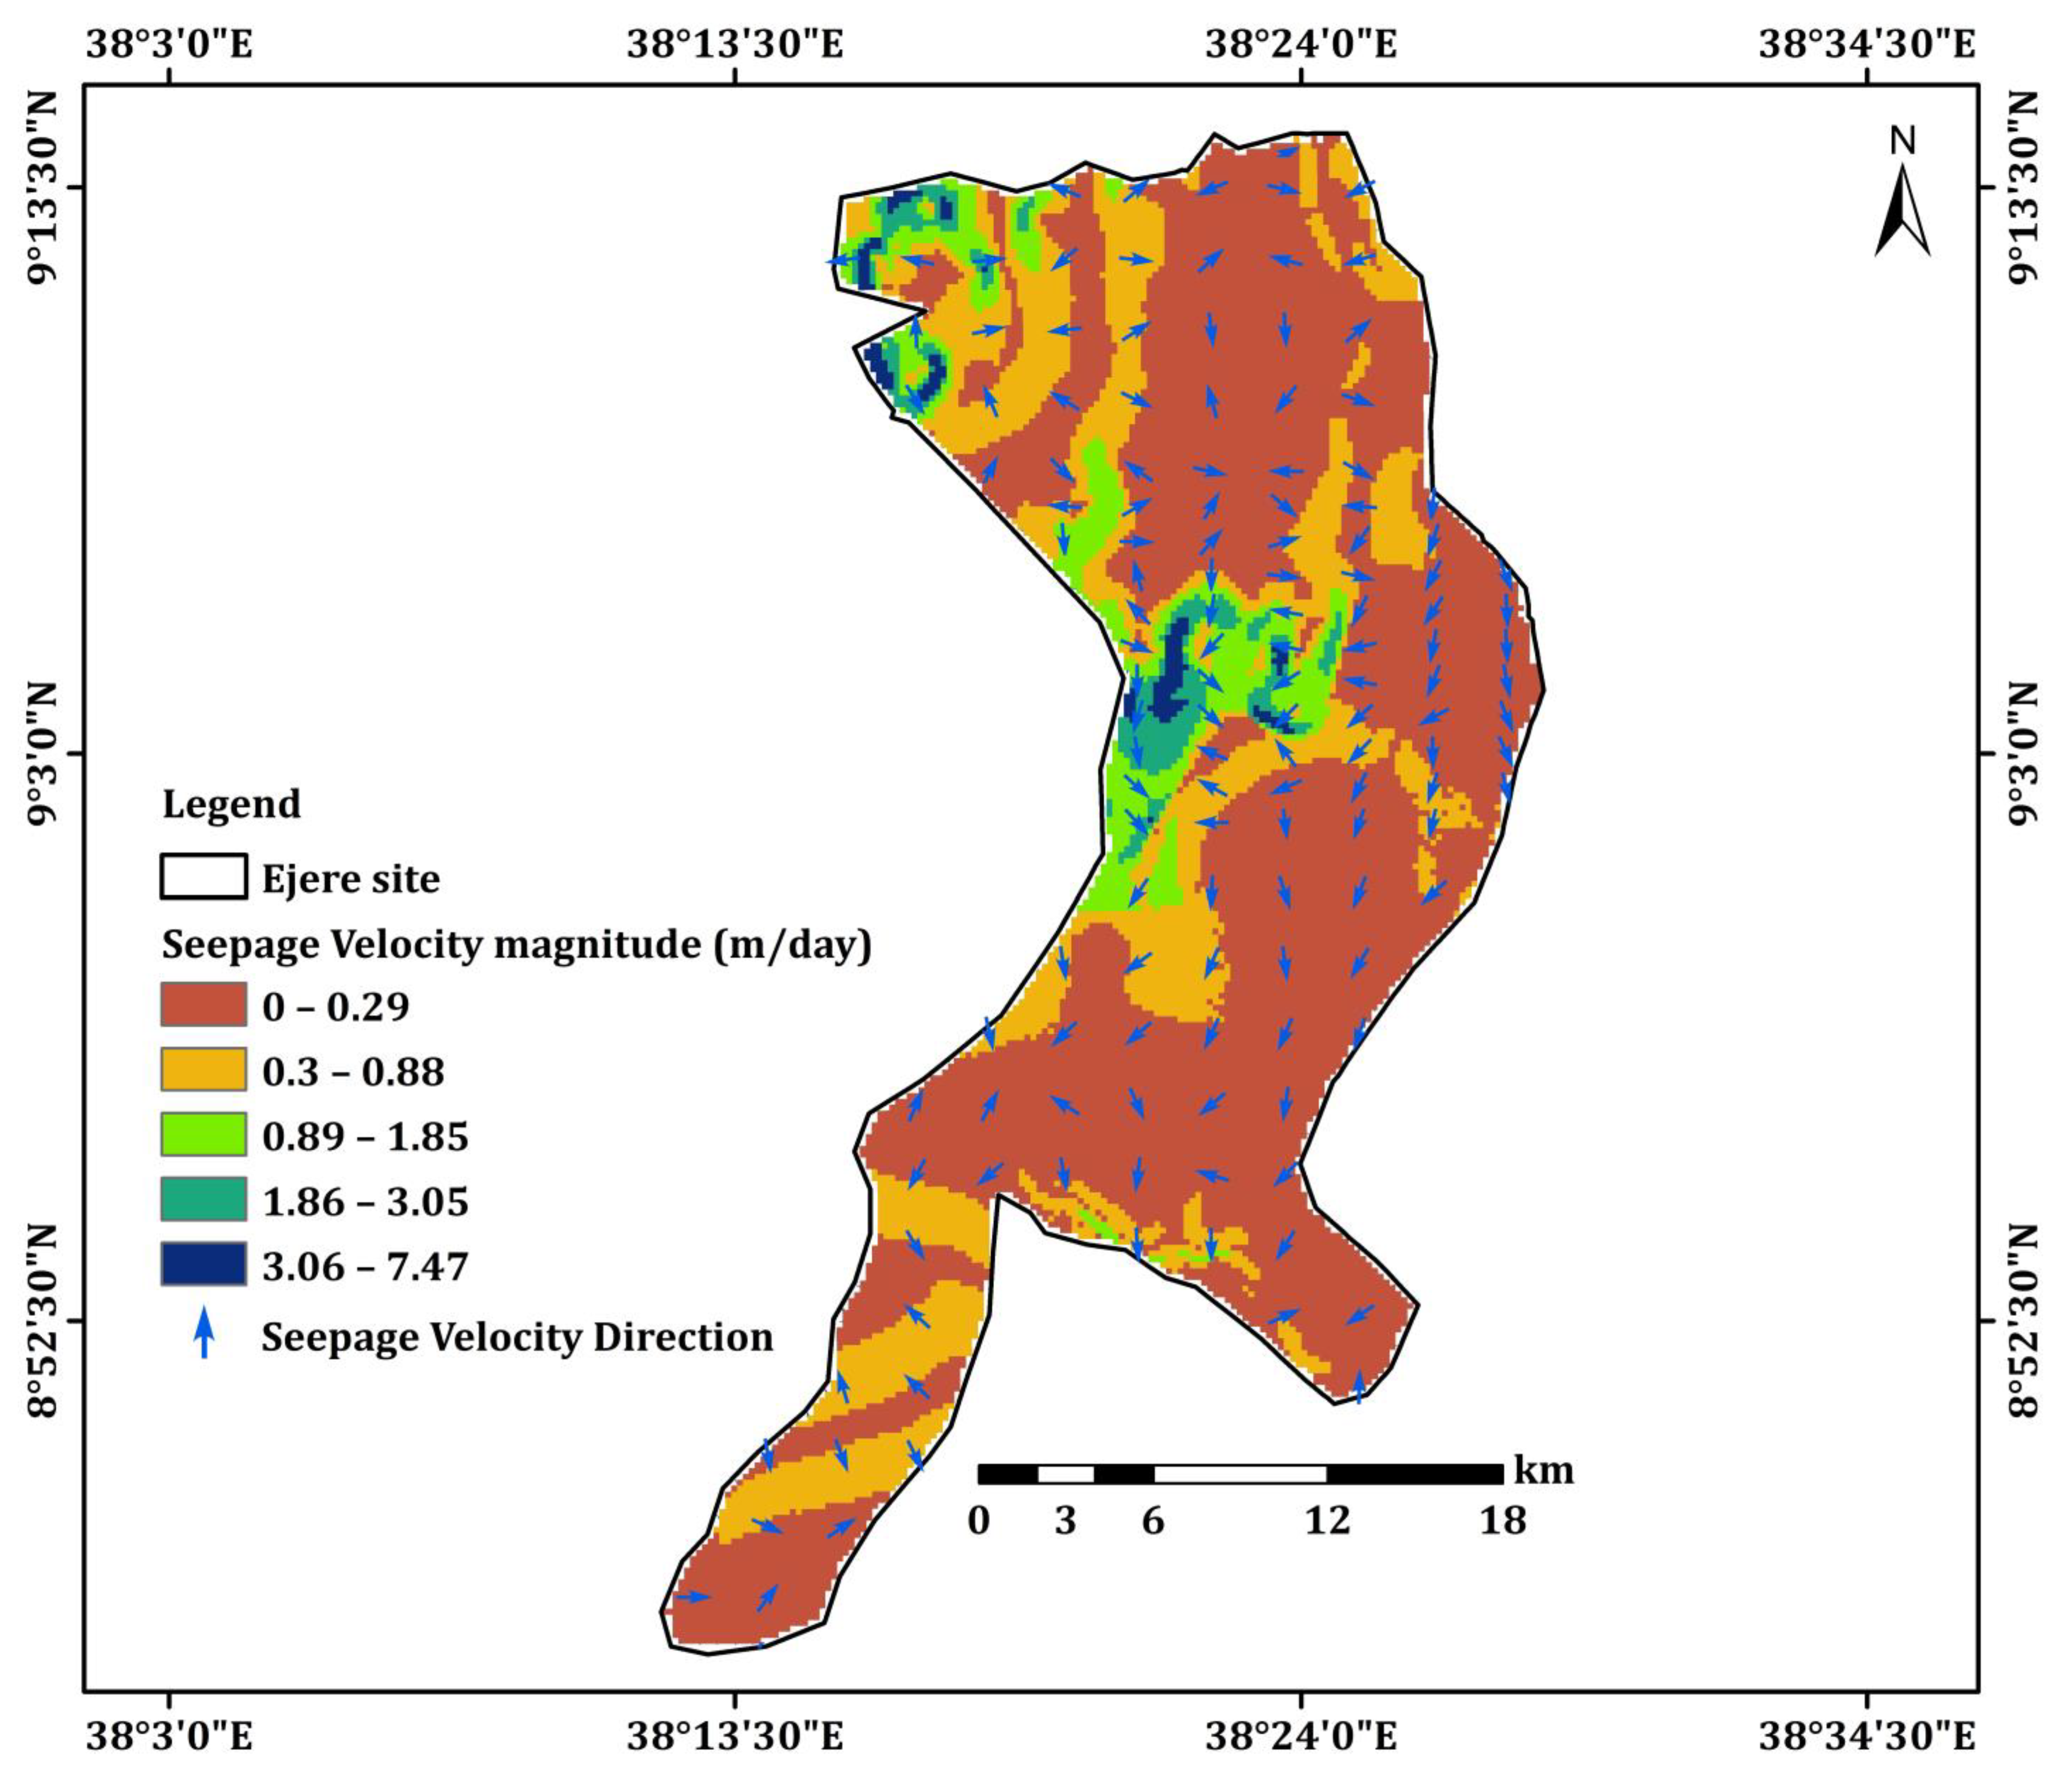
3.1.3. Ejere Site
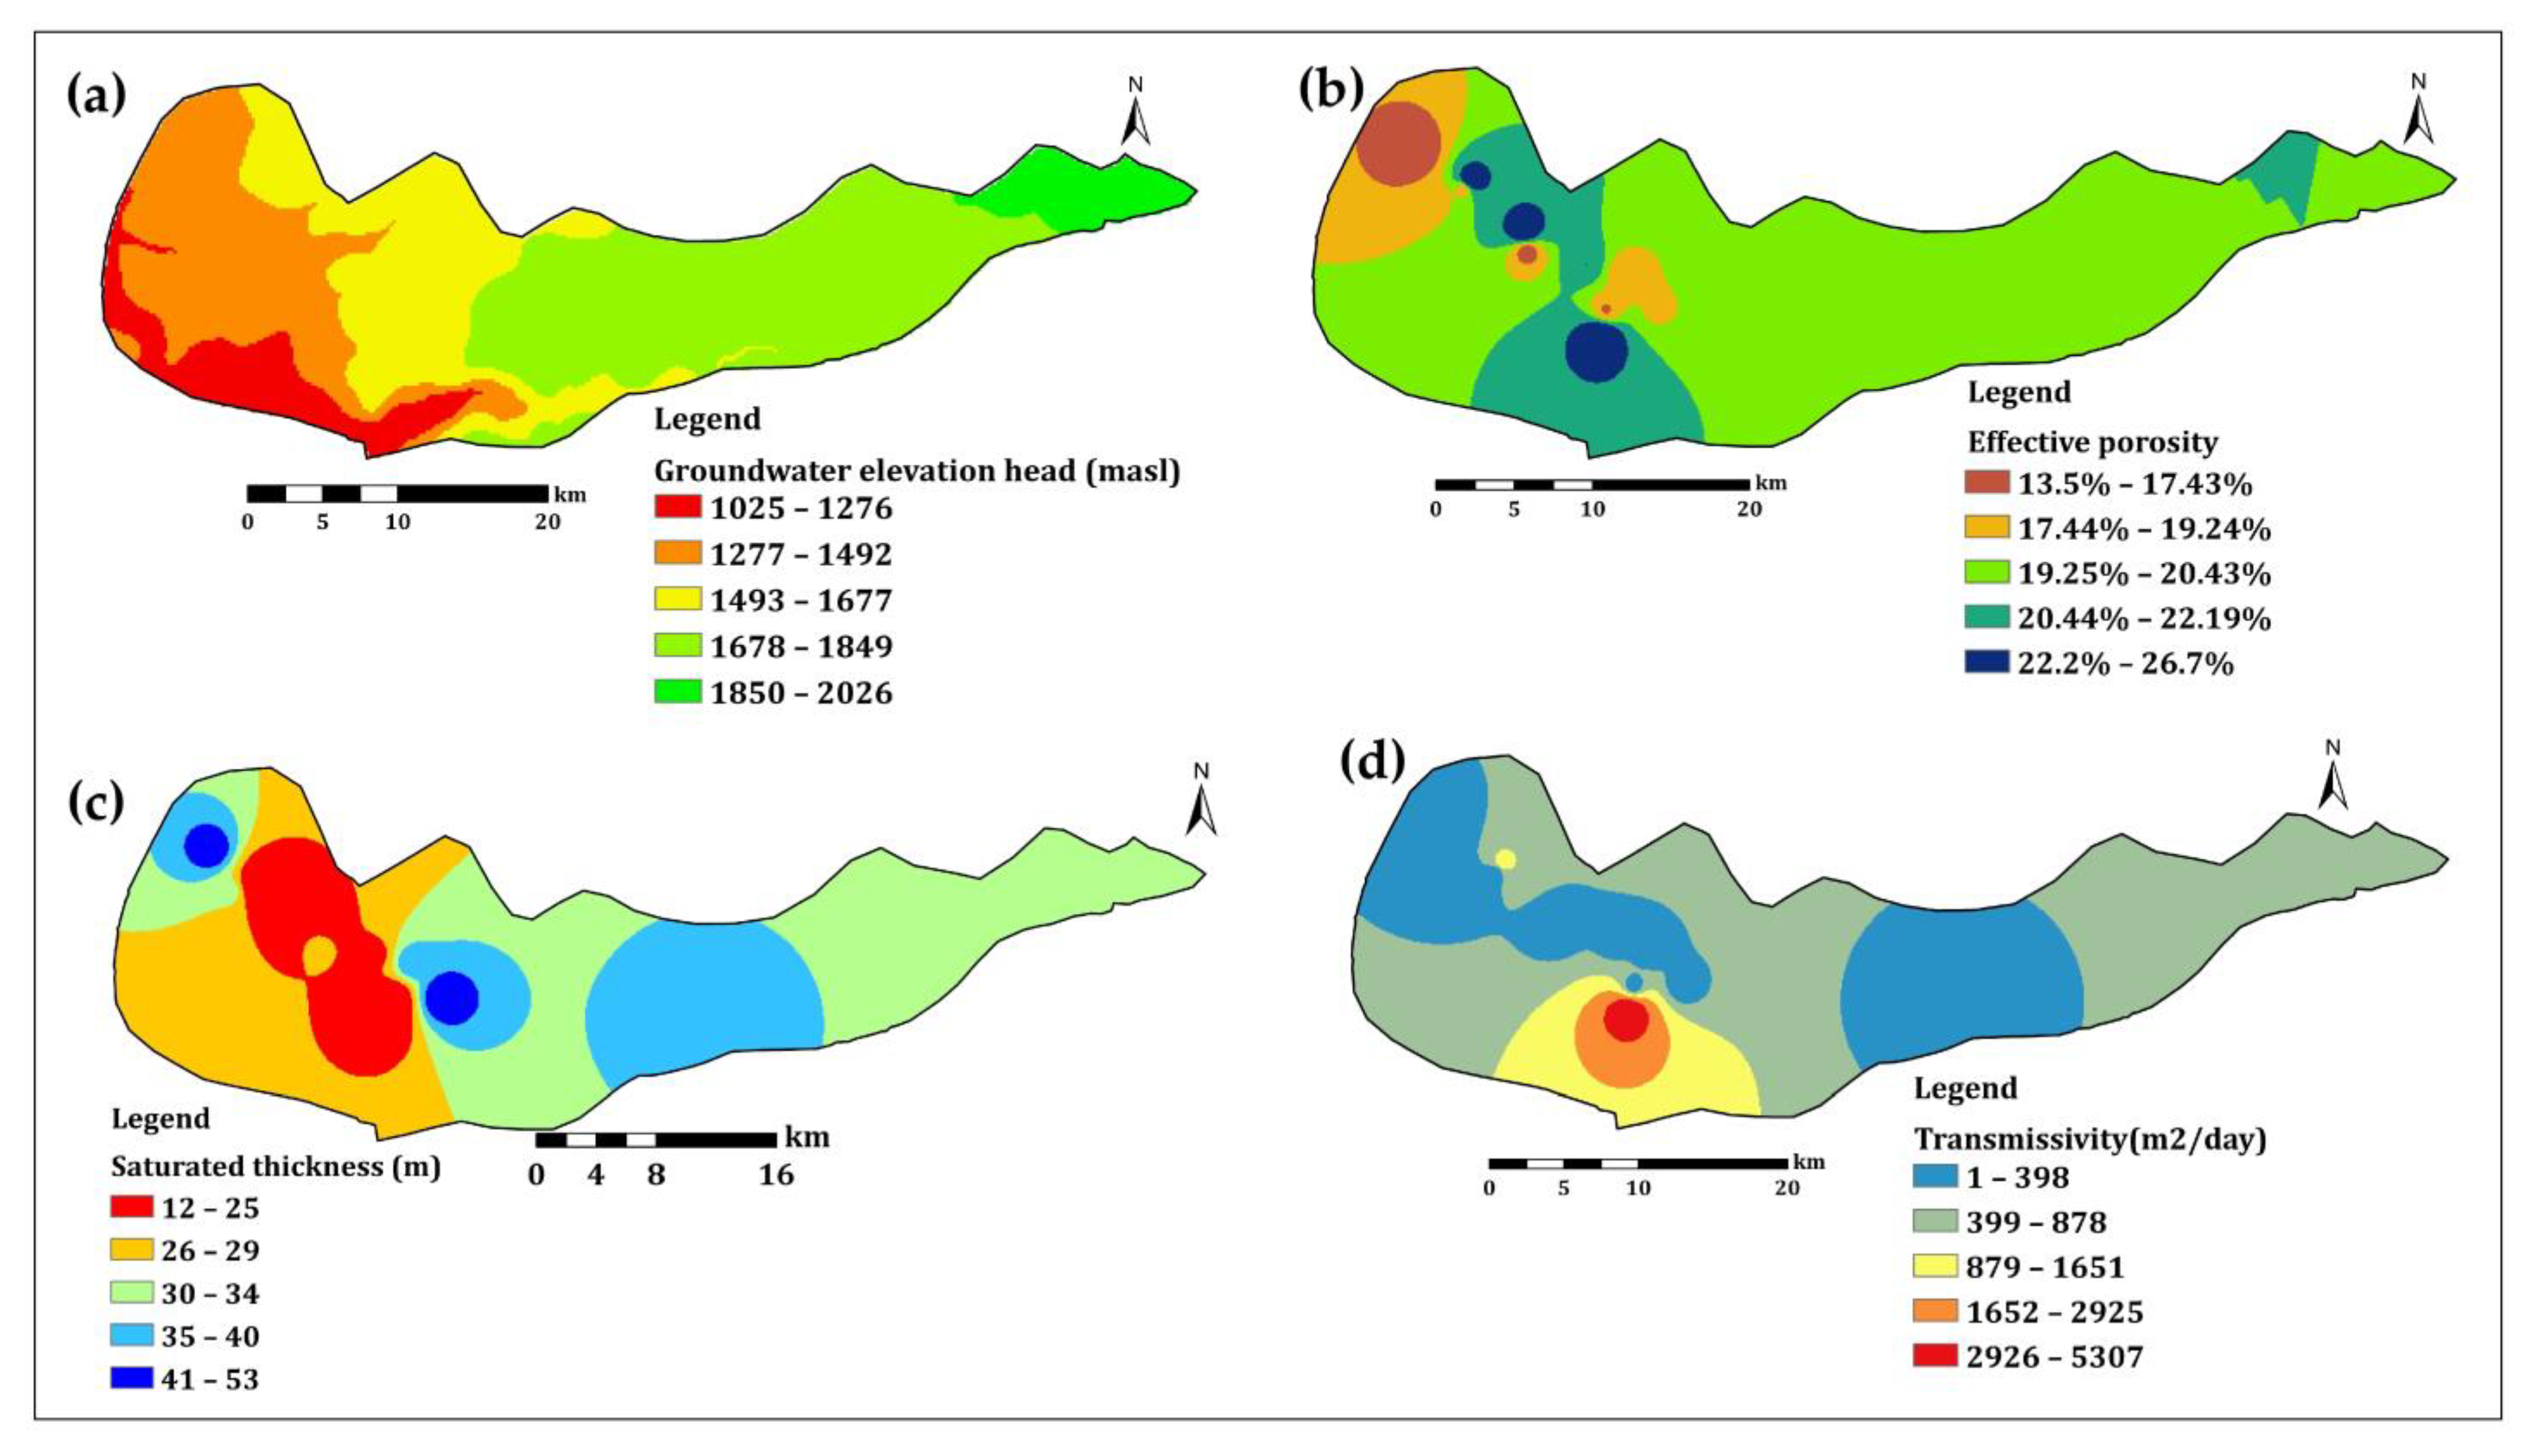
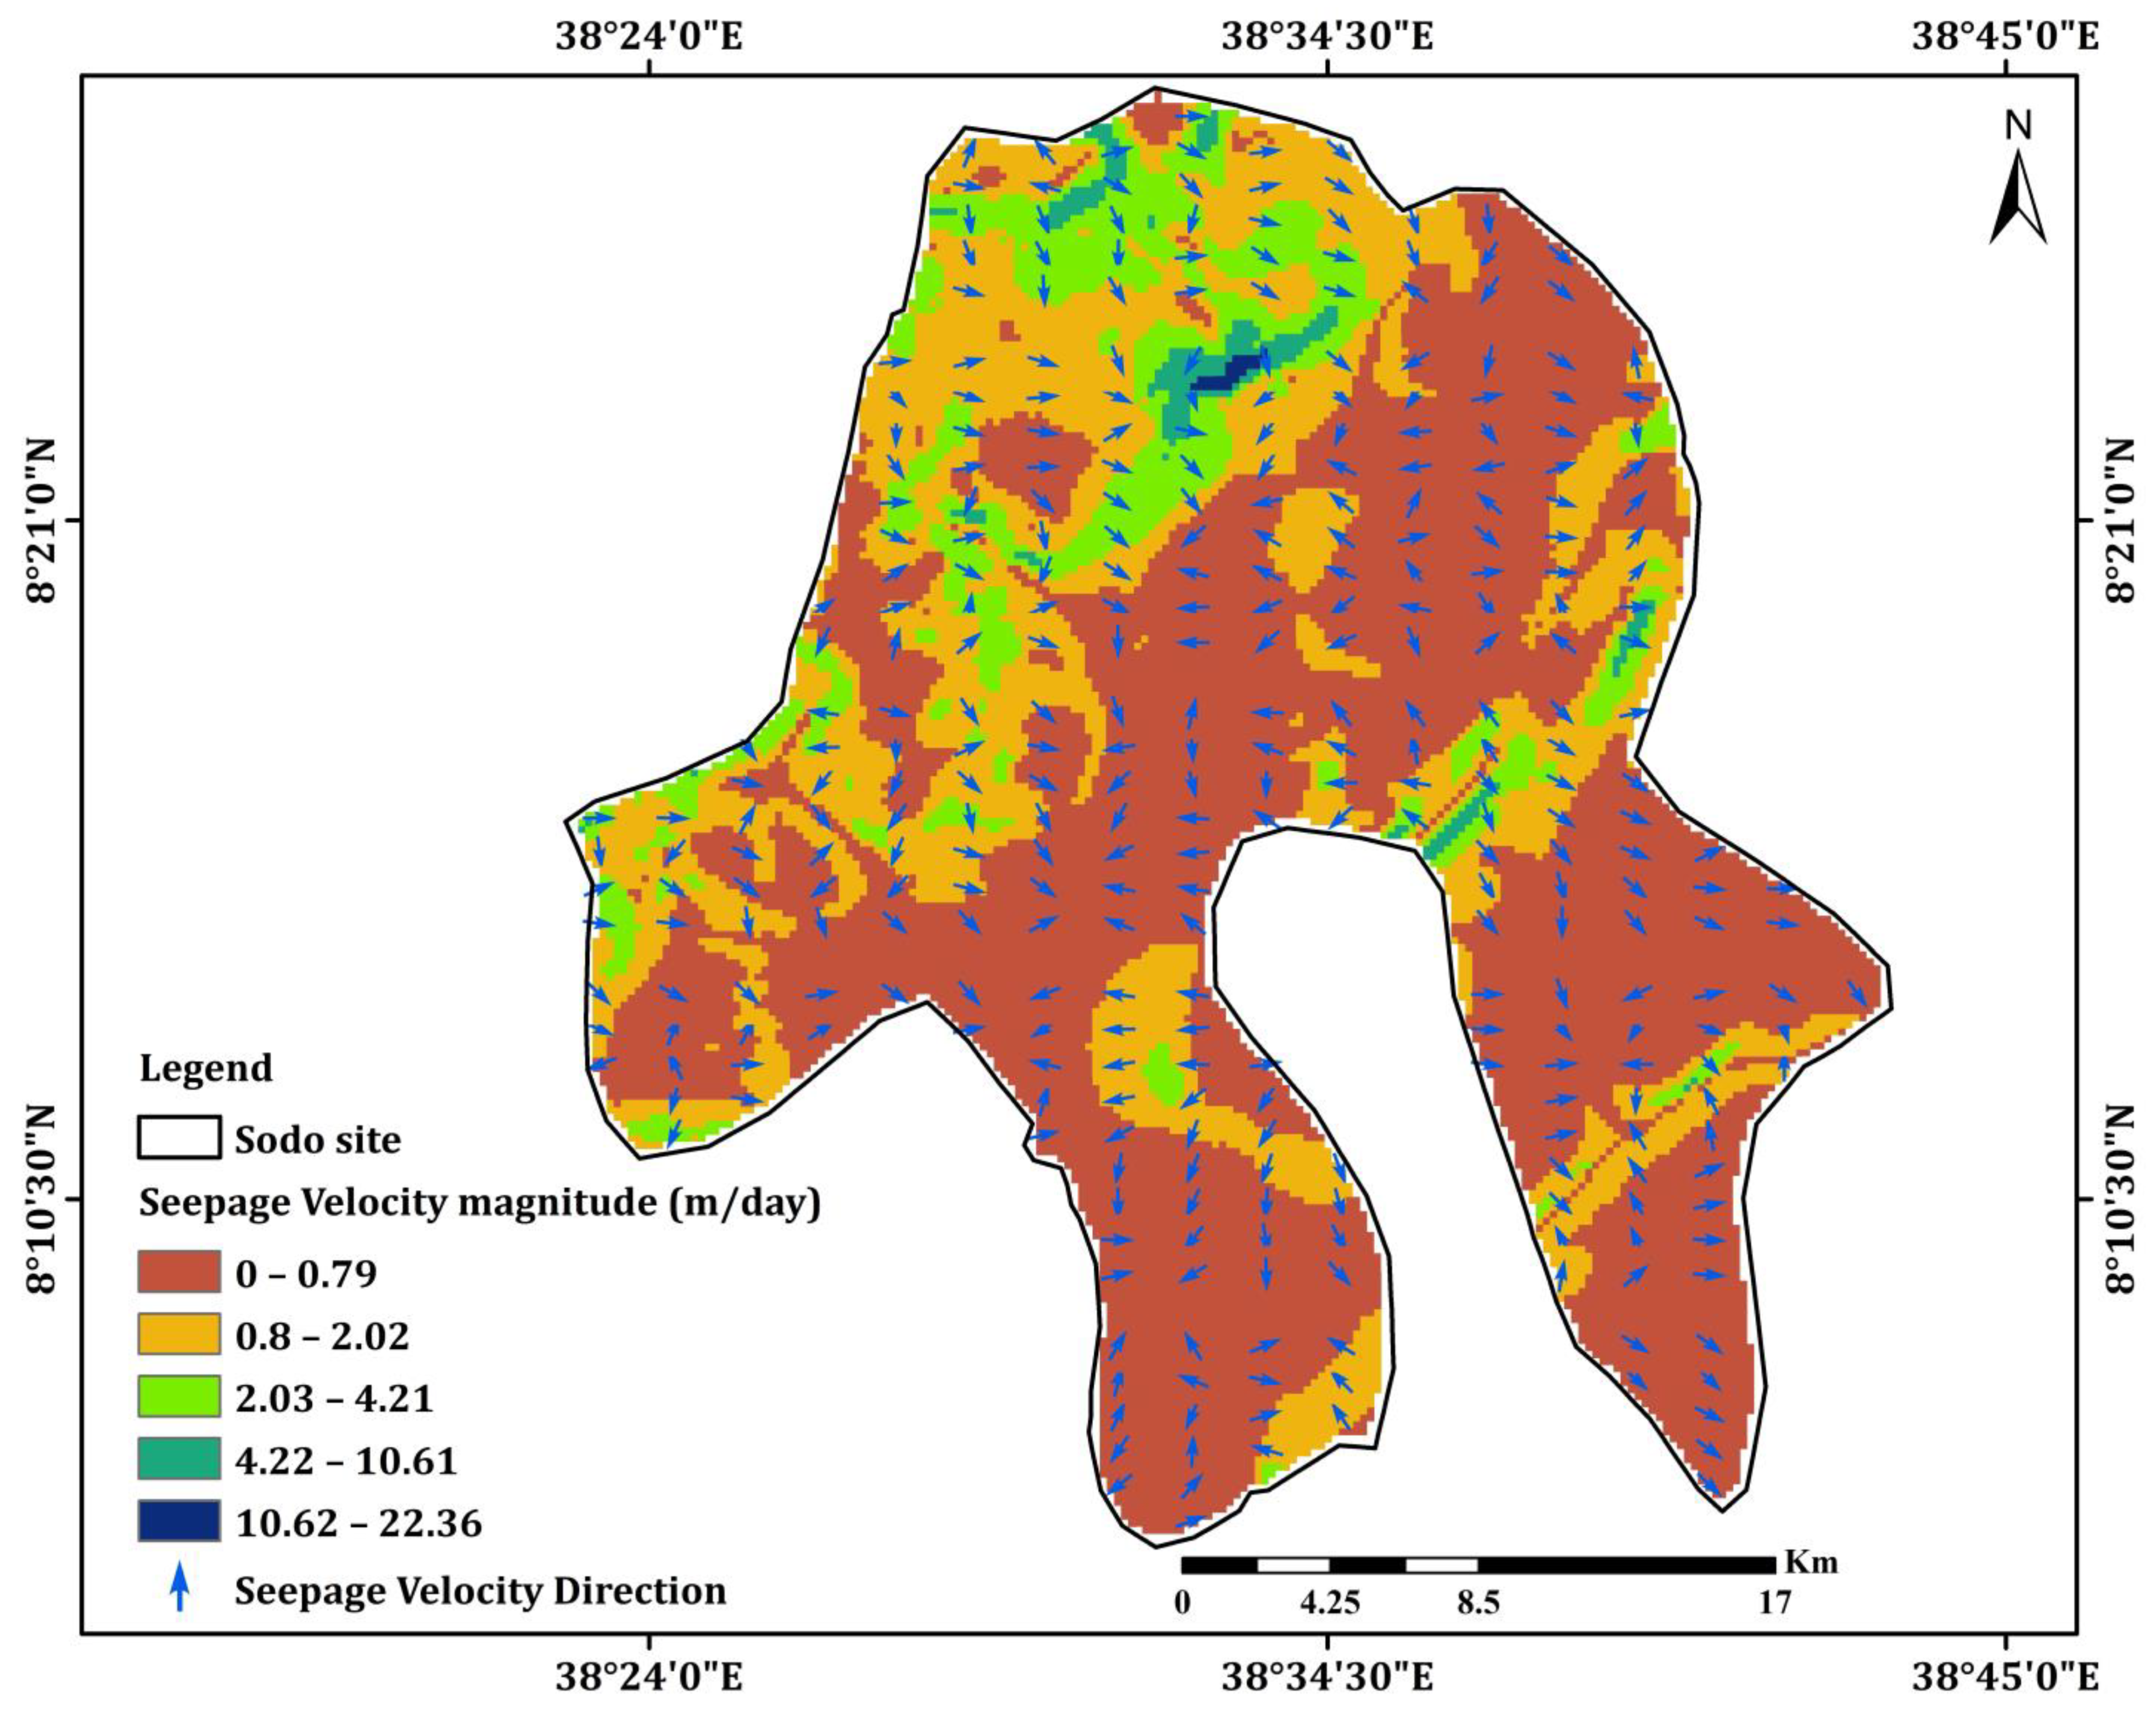
3.1.4. Sodo Site
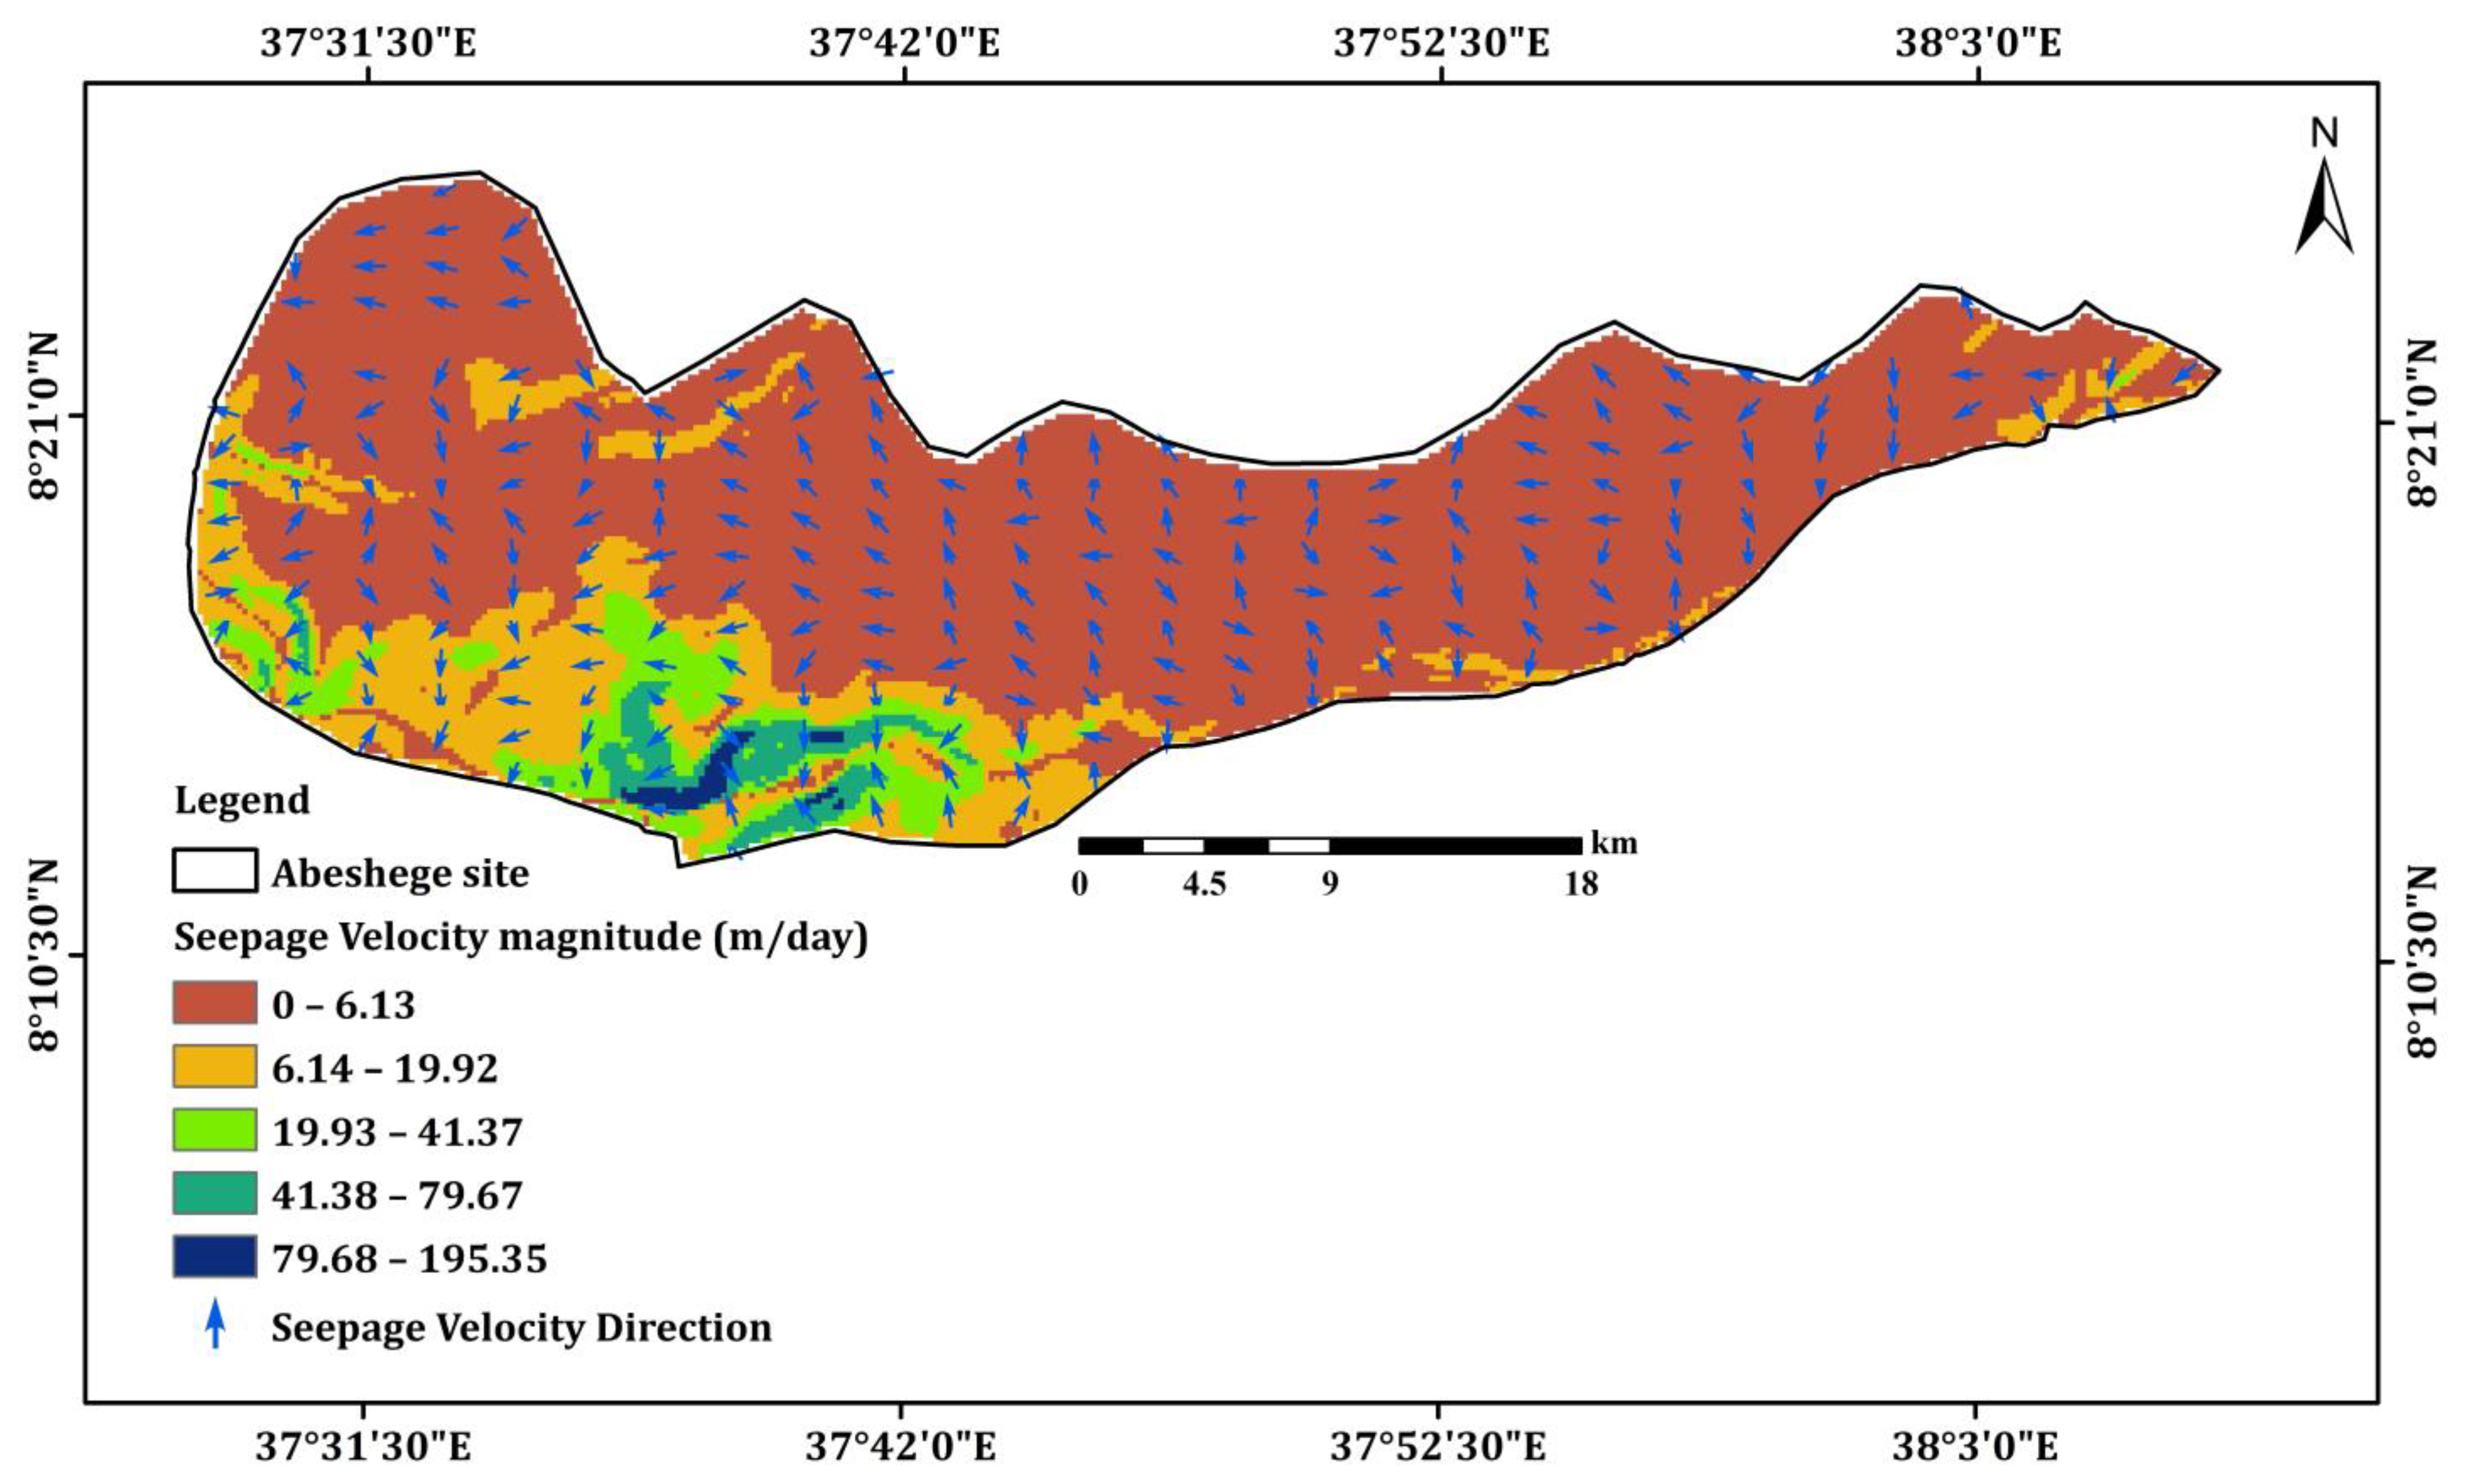
3.1.5. Abeshege Site
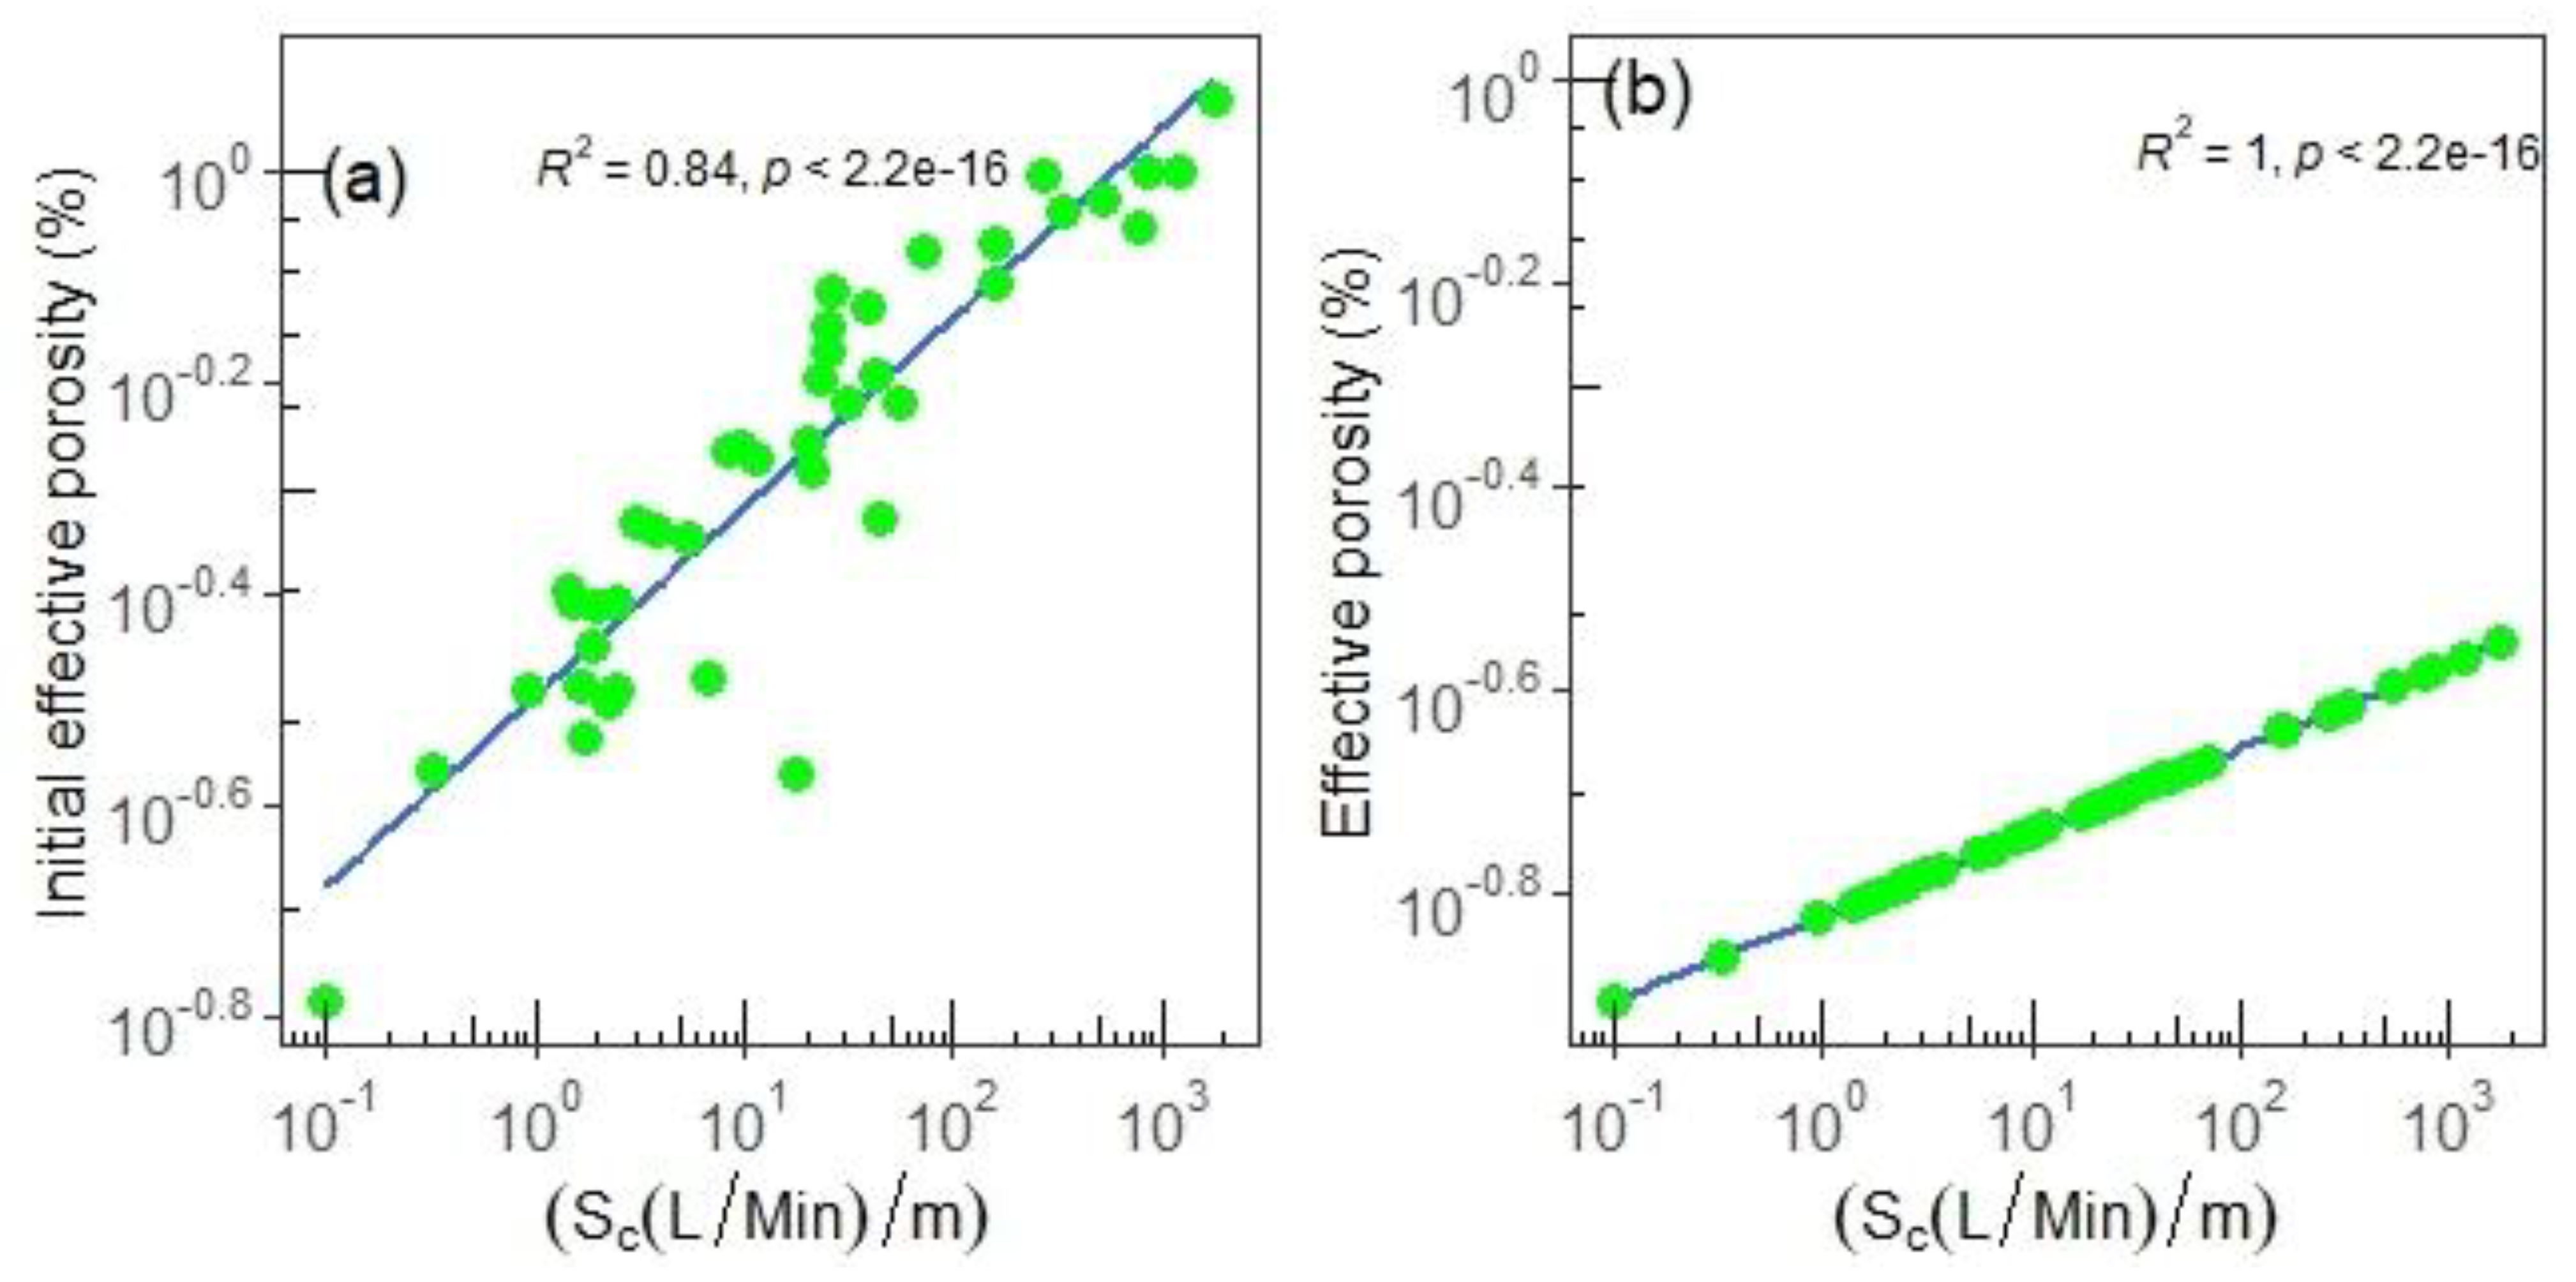
3.2. Groundwater Flow Velocity Estimation
4. Discussion
4.1. Geospatial Technique in Groundwater Flow Velocity Estimation
4.2. Importance of Groundwater Flow Velocity Estimation in Groundwater Resource Management
5. Conclusions
Supplementary Materials
Author Contributions
Funding
Institutional Review Board Statement
Informed Consent Statement
Data Availability Statement
Acknowledgments
Conflicts of Interest
References
- Macdonald, A.M.; Bell, R.A.; Kebede, S.; Azagegn, T.; Yehualaeshet, T.; Pichon, F.; Young, M.; McKenzie, A.A.; Lapworth, D.J.; Black, E.; et al. Groundwater and resilience to drought in the Ethiopian highlands. Environ. Res. Lett. 2019, 14, 095003. [Google Scholar] [CrossRef]
- MacAllister, D.J.; MacDonald, A.M.; Kebede, S.; Godfrey, S.; Calow, R. Comparative performance of rural water supplies during drought. Nat. Commun. 2020, 11, 1099. [Google Scholar] [CrossRef]
- Taylor, R.G.; Scanlon, B.; Döll, P.; Rodell, M.; Van Beek, R.; Wada, Y.; Longuevergne, L.; Leblanc, M.; Famiglietti, J.S.; Edmunds, M.; et al. Ground water and climate change. Nat. Clim. Chang. 2013, 3, 322–329. [Google Scholar] [CrossRef]
- Gowing, J.; Walker, D.; Parkin, G.; Forsythe, N.; Haile, A.T.; Ayenew, D.A. Can shallow groundwater sustain small-scale irrigated agriculture in sub-Saharan Africa? Evidence from N-W Ethiopia. Groundw. Sustain. Dev. 2020, 10, 100290. [Google Scholar] [CrossRef]
- Banks, E.W.; Cook, P.G.; Owor, M.; Okullo, J.; Kebede, S.; Nedaw, D.; Mleta, P.; Fallas, H.; Gooddy, D.; John MacAllister, D.; et al. Environmental tracers to evaluate groundwater residence times and water quality risk in shallow unconfined aquifers in sub Saharan Africa. J. Hydrol. 2021, 598, 125753. [Google Scholar] [CrossRef]
- Fenta, M.C.; Anteneh, Z.L.; Szanyi, J.; Walker, D. Hydrogeological framework of the volcanic aquifers and groundwater quality in Dangila Town and the surrounding area, Northwest Ethiopia. Groundw. Sustain. Dev. 2020, 11, 100408. [Google Scholar] [CrossRef]
- Mamo, S. Integrated Hydrological and Hydrogeological System Analysis of the Lake Tana Basin, Northwestern Ethiopiaitle. Ph.D. Thesis, Addis Ababa University, Addis Ababa, Ethipoia, 2015. Volume 263. [Google Scholar]
- Nigate, F.; Van Camp, M.; Yenehun, A.; Belay, A.S.; Walraevens, K. Recharge-discharge relations of groundwater in volcanic terrain of semi-humid tropical highlands of Ethiopia: The case of infranz springs, in the upper blue nile. Water 2020, 12, 853. [Google Scholar] [CrossRef]
- Walker, D.; Parkin, G.; Gowing, J.; Haile, A.T. Development of a hydrogeological conceptual model for shallow aquifers in the data scarce upper Blue Nile basin. Hydrology 2019, 6, 43. [Google Scholar] [CrossRef]
- Nigate, F.; Ayenew, T.; Belete, W.; Walraevens, K. Overview of the Hydrogeology and Groundwater Occurrence in the Lake Tana Basin, Upper Blue Nile River Basin; Springer: Cham, Switzerland, 2017; pp. 77–91. [Google Scholar]
- Kassune, M.; Tafesse, N.T.; Hagos, M. Characteristics and Productivity of Volcanic Rock Aquifers in Kola Diba Well Field, North-central Ethiopia. Univers. J. Geosci. 2018, 6, 103–113. [Google Scholar] [CrossRef]
- Yitbarek, A.; Razack, M.; Ayenew, T.; Zemedagegnehu, E.; Azagegn, T. Hydrogeological and hydrochemical framework of Upper Awash River basin, Ethiopia: With special emphasis on inter-basins groundwater transfer between Blue Nile and Awash Rivers. J. Afr. Earth Sci. 2012, 65, 46–60. [Google Scholar] [CrossRef]
- Devlin, J.F.; Tsoflias, G.; McGlashan, M.; Schillig, P. An inexpensive multilevel array of sensors for direct ground water velocity measurement. Gr. Water Monit. Remediat. 2009, 29, 73–77. [Google Scholar] [CrossRef]
- Bakx, W.; Bense, V.F.; Karaoulis, M.; Oude Essink, G.H.P.; Bierkens, M.F.P. Measuring groundwater flow velocities near drinking water extraction wells in unconsolidated sediments. Water 2023, 15, 2167. [Google Scholar] [CrossRef]
- Li, F.; Dai, C.; Lei, H. Review of groundwater flow velocity measurement method. Trans. Geotherm. Resour. Counc. 2019, 43, 723–734. [Google Scholar]
- Devlin, J.F. Groundwater Velocity; The Groundwater Project; University of Guelph: Guelph, ONT, Australia, 2020. [Google Scholar]
- Chae, H.; Nagano, K.; Sakata, Y.; Katsura, T.; Kondo, T. Estimation of fast groundwater flow velocity from thermal response test results. Energy Build. 2020, 206, 109571. [Google Scholar] [CrossRef]
- Ahmad, M.; Tariq, J.A.; Rafique, M.; Iqbal, N.; Choudhry, M.A.; Qureshi, R.M. Measurement of Groundwater Flow Velocity At Chashnupp Unit-2 Site Using Radiotracer Technique; Pakistan Institute of Nuclear Science and Technology: Islamabad, Pakistan, 2008. [Google Scholar]
- Englert, A. Measurement, Estimation and Modelling of Groundwater Flow Velocity at Krauthausen Test Site. Ph.D. Thesis, Aachean University, Aachean, Germany, 2003. [Google Scholar]
- Lile, O.B.; Morris, M.; Ronning, J.S. Estimating groundwater flow velocity from changes in contact resistance during a saltwater tracer experiment. Appl. Geophys. 1997, 38, 105–114. [Google Scholar] [CrossRef]
- Medici, G.; West, L.J.; Banwart, S.A. Groundwater flow velocities in a fractured carbonate aquifer-type: Implications for contaminant transport. J. Contam. Hydrol. 2019, 222, 1–16. [Google Scholar] [CrossRef] [PubMed]
- Drost, W.; Klotz, D.; Koch, A.; Moser, H.; Neumaier, F.; Rauert, W. Point dilution methods of investigating ground water flow by means of radioisotopes. Water Resour. Res. 1968, 4, 125–146. [Google Scholar] [CrossRef]
- Brouye, S. Modeling tracer injection and well-aquifer interactions: A new mathematical and numerical approach. Water Resour. Res. 2003, 39, 1070. [Google Scholar]
- Hatfield, K.; Annable, M.; Cho, J.; Rao, P.S.C.; Klammler, H. A direct passive method for measuring water and contaminant fluxes in porous media. J. Contam. Hydrol. 2004, 75, 155–181. [Google Scholar] [CrossRef]
- Osorno, T.C.; College, S.N. Development and Testing of an In-well Point Velocity Probe for Preliminary Site Characterization. Master’s Thesis, University of Kansas, Lawrence, KS, USA, 2016. [Google Scholar]
- Kearl, P.M.; Roemer, K.; Rogoff, E.B.; Renn, R.M. Characterization of a fractured aquifer using the colloidal borescope. Adv. Environ. Res. 1998, 3, 49–57. [Google Scholar]
- Liu, B.; Yan, G.; Ma, Y.; Scheuermann, A. Measurement of In-Situ Flow Rate in Borehole by Heat Pulse Flowmeter: Field-Case Study and Reflection. Geosciences 2023, 13, 146. [Google Scholar] [CrossRef]
- Essouayed, E.; Annable, M.D.; Momtbrun, M.; Atteia, O. An innovative tool for groundwater velocity measurement compared with other tools in laboratory and field tests. J. Hydrol. X 2019, 2, 100008. [Google Scholar] [CrossRef]
- Hamada, H. Estimation of groundwater flow rate using the decay of 222Rn in a well. J. Environ. Radioact. 2000, 47, 1–13. [Google Scholar] [CrossRef]
- Cook, A.J.; Love, J.C. Dighton Inferring Ground Water flow In Fractured Rock From Dissolved Radon. Ground Water 1999, 37, 606–610. [Google Scholar] [CrossRef]
- Schubert, M.; Brueggemann, L.; Knoeller, K.; Schirmer, M. Using radon as an environmental tracer for estimating groundwater flow velocities in single-well tests. Water Resour. Res. 2011, 47, 1–8. [Google Scholar] [CrossRef]
- Al-Madhlom, Q.; Al-Ansari, N.; Abid, B.; Laue, J.; Musa, H. Seepage velocity: Large scale mapping and the evaluation of two different aquifer conditions (silty clayey and sandy). Hydrology 2020, 7, 60. [Google Scholar] [CrossRef]
- Abdullah, T.O.; Ali, S.S.; Al-ansari, N.A.; Knutsson, S.; Laue, J. Magnitude and Direction of Groundwater Seepage Velocity in Different Soil and Rock Materials. Engineering 2020, 12, 242–253. [Google Scholar] [CrossRef]
- Mohr, P.; Zanettin, B. The Ethiopian flood basalt province. In Cont Flood Basalts; Springer: Berlin/Heidelberg, Germany, 1988; pp. 63–110. [Google Scholar]
- Mohr, P.A. Major volcano-tectonic lineament in the Ethiopian Rift System. Nature 1967, 213, 664–665. [Google Scholar] [CrossRef]
- Kebede, S.; Travi, Y.; Alemayehu, T.; Ayenew, T. Groundwater recharge, circulation and geochemical evolution in the source region of the Blue Nile River, Ethiopia. Appl. Geochem. 2005, 20, 1658–1676. [Google Scholar] [CrossRef]
- Peccerillo, A.; Donati, C.; Santo, A.P.; Orlando, A.; Yirgu, G.; Ayalew, D. Petrogenesis of silicic peralkaline rocks in the Ethiopian rift: Geochemical evidence and volcanological implications. J. Afr. Earth Sci. 2007, 48, 161–173. [Google Scholar] [CrossRef]
- Woldegabriel, G.; Aronson, J.L.; Walter, R.C. Geology, geochronology, and rift basin development in the central sector of the Main Ethiopia Rift. Bull. Geol. Soc. Am. 1990, 102, 439–458. [Google Scholar] [CrossRef]
- Ayenew, T.; Demlie, M.; Wohnlich, S. Hydrogeological framework and occurrence of groundwater in the Ethiopian aquifers. J. Afr. Earth Sci. 2008, 52, 97–113. [Google Scholar]
- Berehanu, B.; Azagegn, T.; Ayenew, T.; Masetti, M. Inter-Basin Groundwater Transfer and Multiple Approach Recharge Estimation of the Upper Awash Aquifer System. J. Geosci. Environ. Prot. 2017, 5, 76–98. [Google Scholar] [CrossRef]
- Demlie, M.; Wohnlich, S.; Wisotzky, F.; Gizaw, B. Groundwater recharge, flow and hydrogeochemical evolution in a complex volcanic aquifer system, central Ethiopia. Hydrogeol. J. 2007, 15, 1169–1181. [Google Scholar] [CrossRef]
- Kebede, S.; Travi, Y.; Asrat, A.; Alemayehu, T.; Ayenew, T.; Tessema, Z. Groundwater origin and flow along selected transects in Ethiopian rift volcanic aquifers. Hydrogeol. J. 2008, 16, 55–73. [Google Scholar] [CrossRef]
- Abebe, T.; Mazzarini, F.; Innocenti, F.; Manetti, P. The Yerer-Tullu Wellel volcanotectonic lineament: A transtensional structure in central Ethiopia and the associated magmatic activity. J. Afr. Earth Sci. 1998, 26, 135–150. [Google Scholar] [CrossRef]
- Boccaletti, M.; Bonini, M.; Mazzuoli, R.; Abebe, B.; Piccardi, L.; Tortorici, L. Quaternary oblique extensional tectonics in the Ethiopian Rift (Horn of Africa). Tectonophysics 1998, 287, 97–116. [Google Scholar] [CrossRef]
- Ayalew, D.; Barbey, P.; Marty, B.; Reisberg, L.; Yirgu, G.; Pik, R. Source, genesis, and timing of giant ignimbrite deposits associated with Ethiopian continental flood basalts. Geochim. Cosmochim. Acta 2002, 66, 1429–1448. [Google Scholar] [CrossRef]
- Alemu, M. Comparative Analysis of the Effects of Land Use/Land Cover Changes on Hydrology and Sedimentation: The Case of Wabeand Meki Catchments, Central Ethiopia. Ph.D. Thesis, Addis Ababa University, Addis Ababa, Ethiopia, 2017. [Google Scholar]
- Furi, W.; Razack, M.; Abiye, T.A.; Ayenew, T.; Legesse, D. Fluoride enrichment mechanism and geospatial distribution in the volcanic aquifers of the Middle Awash basin, Northern Main Ethiopian Rift. J. Afr. Earth Sci. 2011, 60, 315–327. [Google Scholar] [CrossRef]
- Abbate, E.; Bruni, P.; Sagri, M. Geology of Ethiopia: A Review and Geomorphological Perspectives. In Landscapes and Landforms of Ethiopia; Billi, P., Ed.; World Geomorphological Landscapes; Springer: Berlin/Heidelberg, Germany, 2015; pp. 33–64. [Google Scholar]
- Beccaluva, L.; Bianchini, G.; Natali, C.; Siena, F. Continental flood basalts and mantle plumes: A case study of the Northern Ethiopian Plateau. J. Petrol. 2009, 50, 1377–1403. [Google Scholar] [CrossRef]
- Kieffer, B.; Arndt, N.; Lapierre, H.; Bastien, F.; Bosch, D.; Pecher, A.; Yirgu, G.; Ayalew, D.; Weis, D.; Jerram, D.A.; et al. Flood and shield basalts from Ethiopia: Magmas from the African superswell. J. Petrol. 2004, 45, 793–834. [Google Scholar] [CrossRef]
- Lebas, M.J.; Mohr, P.A. Tholeiite from the Simien alkali basalt centre, Ethiopia. Geol. Mag. 1970, 107, 523–529. [Google Scholar] [CrossRef]
- Sembroni, A.; Faccenna, C.; Becker, T.W.; Molin, P.; Abebe, B. Long-term, deep-mantle support of the Ethiopia-Yemen Plateau. Tectonics 2016, 35, 469–488. [Google Scholar]
- Neuman, S.P. Analysis of pumping test data from anisotropic unconfined aquifers considering delayed gravity response. Water Resour. Res. 1975, 11, 329–342. [Google Scholar] [CrossRef]
- Theis, C.V. The relation between the lowering of the Piezometric surface and the rate and duration of discharge of a well using ground-water storage. Eos Trans. Am. Geophys. Union 1935, 16, 519–524. [Google Scholar] [CrossRef]
- Fitts, C.R. Groundwater Science; Elesevier: Amesterdam, The Netherlands, 2013; ISBN 9780123847058. [Google Scholar]
- Ahuja, R.; Cassel, K.; Bruce, R.; Barnes, B. Evaluation of Spatial Distribution of Hydraulic Conductivity Using Effective Porosity Data. Soil Sci. 1989, 148, 404–411. [Google Scholar] [CrossRef]
- Wilkinson, J.M. The application and revision of a new relationship to calculate effective porosity from specific capacity on a well database in the Pacific Northwest. Hydrol. Res. Lett. 2012, 103, 98–103. [Google Scholar] [CrossRef]
- Razack, M.; Huntley, D. Assesing Transmissivity from Specific Capacity in a Large and Hetrogeneous Alluvial Aquifer. Ground Water 1991, 29, 856–861. [Google Scholar] [CrossRef]
- Gupta, R.S. Hydrology & Hydraulic Systems Hydrology & Hydraulic Systems; Waveland Press: Long Grove, IL, USA, 2017; ISBN 9781478630913. [Google Scholar]
- Environmental Systems Research Institute (ESRI). Darcy Velocity, ESRI: Tysons, VA, USA, 2015.
- Maurice, L.; Taylor, R.G.; Tindimugaya, C.; MacDonald, A.M.; Johnson, P.; Kaponda, A.; Owor, M.; Sanga, H.; Bonsor, H.C.; Darling, W.G.; et al. Characteristics of high-intensity groundwater abstractions from weathered crystalline bedrock aquifers in East Africa. Hydrogeol. J. 2019, 27, 459–474. [Google Scholar] [CrossRef]
- Cherry, J. Groundwater monitoring: Some deficiencies and opportunities. In Hazardous Waste Site Investigations; Towards Better Decisions, Proceedings of the 10th ORNL Life Science Symposium, Gatlinburg, TN, USA, 21–24 May 1990; CRC Press: Boca Raton, FL, USA, 1990. [Google Scholar]
- Aley, T. Groundwater Tracing Handbook; Ozark Underground Laboratory: Protem, MO, USA, 2002; Volume 65733, p. 35. [Google Scholar]
- Morris, D.A.; Johnson, A.I. Summary of Hydrologic and Physical Properties of Rock and Soil Materials, as Analyzed by the Hydrologic Laboratory of the U.S. Geological Survey. USA Geol. Surv. 1967, 1839-D, 1948–1960. [Google Scholar]
- Hall, S.H. Single Well Tracer Tests in Aquifer Characterization. Groundw. Monit. Remediat. 1993, 13, 118–124. [Google Scholar] [CrossRef]
- Piccinini, L.; Fabbri, P.; Pola, M. Point dilution tests to calculate groundwater velocity: An example in a porous aquifer in northeast Italy. Hydrol. Sci. J. 2016, 61, 1512–1523. [Google Scholar] [CrossRef]
- Poulsen, D.L.; Cook, P.G.; Simmons, C.T.; McCallum, J.M.; Noorduijn, S.L.; Dogramaci, S. A constant rate salt tracer injection method to quantify pumped flows in long-screened or open borehole wells. J. Hydrol. 2019, 574, 408–420. [Google Scholar] [CrossRef]
- Vienken, T.; Huber, E.; Kreck, M.; Huggenberger, P.; Dietrich, P. How to chase a tracer—Combining conventional salt tracer testing and direct push electrical conductivity profiling for enhanced aquifer characterization. Adv. Water Resour. 2017, 99, 60–66. [Google Scholar] [CrossRef]
- Matsumoto, S.; Machida, I.; Hebig, K.H.; Zeilfelder, S.; Ito, N. Estimation of very slow groundwater movement using a Single-Well Push-Pull test. J. Hydrol. 2020, 591, 125676. [Google Scholar] [CrossRef]
- Labaky, W.; Devlin, J.F.; Gillham, R.W. Field comparison of the point velocity probe with other groundwater velocity measurement methods. Water Resour. Res. 2009, 45, 1–9. [Google Scholar] [CrossRef]
- Mazor, E.; Nativ, R. Hydraulic calculation of groundwater flow velocity and age: Examination of the basic premises. J. Hydrol. 1992, 138, 211–222. [Google Scholar] [CrossRef]
- Abdullah, T.; Ali, S.S.; Al-Ansari, N.; Knutsson, S. Seepage Velocity of Different Groundwater Aquifers in Halabja Saidsadiq Basin—NE of Iraq. In Proceedings of the Environmental Science and Engineering, Virtual, 5–7 June 2021. [Google Scholar]


| Sites | SWL | BH Depth | Saturated Thickness (b) | T (m2/day) | Specific Capacity (Sc) | Effective Porosity (Equation (8)) | |
|---|---|---|---|---|---|---|---|
| Abeshege | Min | 11.17 | 43.5 | 11.61 | 9.5 × 10⁻² | 0.099 | 0.12 |
| Mean | 35.26 | 64.1 | 29.6 | 5.33 × 10³ | 186.8 | 0.18 | |
| Max | 62.16 | 84.3 | 53.3 | 9 × 10² | 845.55 | 0.26 | |
| Ejere | Min | 5.94 | 35.6 | 17.86 | 1.17 | 1.72 | 0.16 |
| Mean | 16.92 | 62.66 | 34.46 | 1.19 × 10² | 68.28 | 0.19 | |
| Max | 32.82 | 50.7 | 47.74 | 4.81 × 10² | 265.49 | 0.24 | |
| Mecha | Min | 2.42 | 21.75 | 11.43 | 8.35 × 10⁻¹ | 1.96 | 0.16 |
| Mean | 10.44 | 44.31 | 33.21 | 4.1 × 10² | 327.17 | 0.21 | |
| Max | 23.06 | 61.34 | 58.92 | 1.61 × 10³ | 1764.71 | 0.28 | |
| Sodo | Min | 10.35 | 18.6 | 3.59 | 9.07 × 10⁻¹ | 1.52 | 0.16 |
| Mean | 25.26 | 46.68 | 21.06 | 7.47 × 101 | 38.65 | 0.19 | |
| Max | 52 | 80 | 47.12 | 3.96 × 10² | 163.04 | 0.23 |
Disclaimer/Publisher’s Note: The statements, opinions and data contained in all publications are solely those of the individual author(s) and contributor(s) and not of MDPI and/or the editor(s). MDPI and/or the editor(s) disclaim responsibility for any injury to people or property resulting from any ideas, methods, instructions or products referred to in the content. |
© 2023 by the authors. Licensee MDPI, Basel, Switzerland. This article is an open access article distributed under the terms and conditions of the Creative Commons Attribution (CC BY) license (https://creativecommons.org/licenses/by/4.0/).
Share and Cite
Shube, H.; Kebede, S.; Azagegn, T.; Nedaw, D.; Haji, M.; Karuppannan, S. Estimating Groundwater Flow Velocity in Shallow Volcanic Aquifers of the Ethiopian Highlands Using a Geospatial Technique. Sustainability 2023, 15, 14490. https://doi.org/10.3390/su151914490
Shube H, Kebede S, Azagegn T, Nedaw D, Haji M, Karuppannan S. Estimating Groundwater Flow Velocity in Shallow Volcanic Aquifers of the Ethiopian Highlands Using a Geospatial Technique. Sustainability. 2023; 15(19):14490. https://doi.org/10.3390/su151914490
Chicago/Turabian StyleShube, Hassen, Seifu Kebede, Tilahun Azagegn, Dessie Nedaw, Muhammed Haji, and Shankar Karuppannan. 2023. "Estimating Groundwater Flow Velocity in Shallow Volcanic Aquifers of the Ethiopian Highlands Using a Geospatial Technique" Sustainability 15, no. 19: 14490. https://doi.org/10.3390/su151914490