Article

A Numerical Study of Vapor–Liquid Equilibrium in Binary Refrigerant Mixtures Based on 2,3,3,3-Tetrafluoroprop-1-ene

1
College of Mechanical and Electrical Engineering, Hohai University, Changzhou 213022, China
2
MagnoTherm Solutions GmbH, Pfungstädter Str. 102, 64297 Darmstadt, Germany
3
Department of Thermal and Fluid Engineering, Faculty of Engineering Technology (ET), University of Twente, 7522 NB Enschede, The Netherlands
*
Author to whom correspondence should be addressed.
Sustainability 2023, 15(19), 14482; https://doi.org/10.3390/su151914482
Submission received: 17 July 2023 / Revised: 22 September 2023 / Accepted: 3 October 2023 / Published: 4 October 2023

Abstract

:
The binary refrigerant mixtures containing 2,3,3,3-Tetrafluoroprop-1-ene are considered as excellent substitutes for traditional refrigerants. Weak hydrogen bonds exist in hydrofluorocarbons and hydrofluoroolefins. However, for several recently published binary refrigerant mixtures, there is no Vapor–Liquid Equilibrium calculation study considering hydrogen-bonding associations. This work presents a calculation work of the saturated properties of nine pure refrigerants using the Cubic-Plus-Association Equation of State, considering the hydrogen-bonding association in refrigerant fluids. The average relative deviations of the saturated vapor pressure, liquid, and vapor density are less than 1.0%, 1.5%, and 3.5%, respectively. The Vapor–Liquid Equilibrium of ten binary refrigerant mixtures containing 2,3,3,3-Tetrafluoroprop-1-ene is also calculated using the Cubic-Plus-Association Equation of State with the van der Waals mixing rule. The average relative deviations of the liquid-phase and vapor-phase mole fractions are less than 1.0% and 2.0%, respectively. Moreover, the Vapor–Liquid Equilibrium data and the model’s adaptability are analyzed and discussed.

1. Introduction

Refrigerants serve as the lifeblood of refrigeration, heat pumps, medium-low-temperature heat utilization, and energy storage systems [1,2,3,4], with their properties significantly influencing thermal cycle performance [5]. The most commonly used refrigerants are hydrocarbon (HC), hydrofluorocarbon (HFC), hydrofluoroolefin (HFO), hydrochlorofluoroolefin (HCFO), perfluorocarbon (PFC), and perfluoroolefin (PFO) [5]. Different types of refrigerants have different characteristics [6].
2,3,3,3-Tetrafluoroprop-1-ene (R1234yf) and 1,1,1,2-tetrafluoroethane (R134a) have similar molecular structures, which means that they contain the same hydrogen and fluorine atoms [1,7,8]. Similar molecular structures will yield similar physical and chemical properties, so R1234yf and R134a have similar physical and chemical properties [1,7,8]. R1234yf is hydrofluoroolefin with double bonds, contains four fluorine atoms, and does not contain chlorine and bromine, so it will not destroy the ozone layer. R1234yf is generally considered a refrigerant with the Ozone Depletion Potential (ODP) equal to zero. Moreover, the C=C bond can react with hydroxyl groups in the atmosphere, so the atmospheric lifetime of R1234yf is only eleven days. Most HFOs are non-flammable or weakly flash and are safer than HCs [1,7,8]. The Global Warming Potential (GWP) of a refrigerant is mainly determined by the chemical bonds and the energy of the chemical bonds; the GWP of R1234yf is less than one [1,7,8]. Based on these excellent environmental characteristics and similar thermodynamic properties to R134a, R1234yf is often considered one of the most suitable working fluids to replace R134a.
The impact of refrigerants on the environment includes two aspects: one is the environmental characteristics of the refrigerant itself, and the other is its working performance when used in thermal cycles. Good thermal properties can reduce energy consumption. R1234yf has excellent environmental characteristics. However, its latent heat of vaporization is low, and the energy efficiency of R1234yf is lower than that of R134a [9].
In thermal cycle systems, pure refrigerants generally struggle to achieve excellent refrigeration performance while being environmentally friendly. However, by selecting and adjusting mixed refrigerants with different ratios, the defects and shortcomings of each component can be overcome, and the complementary advantages and mutual promotion of pure refrigerants can be achieved, resulting in various environmentally friendly refrigerants with excellent thermal performance [8,10]. Therefore, combining R1234yf and other refrigerants with good thermal properties into a mixture for complementary advantages is an excellent solution. A regurgitant mixture improves the thermal performance of R1234yf and retains the environmental characteristics of R1234yf [11,12].
The acquirement of many thermodynamic properties (such as specific volume, specific heat, enthalpy, and entropy) requires Vapor–Liquid Equilibrium (VLE) study. In the thermal cycle design, VLE data need to be applied. In addition, the study of VLE is helpful for selecting an appropriate proportion of mixed refrigerant parameters.
Many calculation works have been published for the VLE of the binary refrigerant mixture [11,12,13,14,15,16]. The Equation of State (EoS) is an essential tool to reveal the thermodynamic properties of fluids and the relationship between different properties. Compared with experimental measurement, the EoS approach does not rely on expensive equipment. The development of EoS is also shorter than experimental approaches.
Some EoS approaches have been applied to study the VLE of binary refrigerant mixtures, including modified Peng–Robinson (PR) EoS [11,16,17,18,19,20], PR + non-random two-liquids model [12,14,21,22,23,24], modified statistical associating fluid theory (SAFT) EoS [25,26], Patel–Teja EoS [13], and Carnahan–Starling–DeSantis EoS [20,27]. Although these calculation works gave good performances, there are few EoS calculation works that consider hydrogen-bonding associations. Weak hydrogen bonds exist in systems containing C-H and C-F covalent bonds (such as HFCs and HFOs) [28].
Hydrogen bonding contributes to the structures and properties of associated fluids [29,30]. Considering the effects of hydrogen bonding is a necessary way to improve the physics and rationality of calculations. The Cubic-Plus-Association (CPA) EoS retains the simple form and adds an association term considering hydrogen-bonding associations [31]. CPA has been successfully applied to pure components containing hydrogen-bonding associations [32,33]. However, the CPA EoS is rarely applied in calculations of the VLE of refrigerants. Kang et al. [34] applied CPA to HFOs, and they used the liquid-phase data to fit the parameters of CPA. Yang et al. [28] applied CPA to fifteen pure refrigerants and forty binary refrigerant mixtures, and they stated that the “weak hydrogen bonds” can affect the thermodynamic properties. By introducing the saturated gas density data into the objective function, the overfitting of CPA to the properties of the liquid phase can be avoided [28].
This work applies the CPA EoS to study the VLE of nine pure refrigerants and ten R1234yf-based binary refrigerant mixtures (published in recent years). This work first introduces the CPA EoS model, then shows the calculation results and discussion of nine pure refrigerants and ten binary refrigerant mixtures, and last proposes the conclusion.
The critical parameters of a pure component are critical in describing phase behaviors, predicting thermodynamic properties, and developing EoS. The critical point is often used as a reference for comparative states in the calculation of the thermophysical properties of fluids. Table 1 lists the critical parameters of the refrigerants studied in this work.

2. Thermodynamic Framework

Weak hydrogen bonds exist in HFCs and HFOs, and accurate VLE calculation requires consideration of the hydrogen-bonding associations [28]. CPA has an association term considering the hydrogen-bonding associations [31], which can improve the calculation accuracy of the VLE of the association systems. This work applies CPA as the thermodynamic model.
In the CPA EoS, the residual Helmholtz energy is given by
A r = A S R K + A A S S O C
The residual Helmholtz energy for the cubic Soave–Redlich–Kwong EoS [40] ( A S R K ) is calculated from
A S R K = n R T ln 1 b v a T b R T ln 1 + b v
where n is the total number of moles, T is the temperature, R is the universal gas constant, v is the molar volume, and b and a T are the co-volume and temperature-dependent energy parameters.
For mixtures, the van der Waals one-fluid mixing rule is used. The co-volume parameter of the mixture is calculated using
b = i j i b i
where b i is the pure co-volume parameter, and j i is the mole fraction of component i . The temperature-dependent energy parameter of the mixture is calculated as
a T = i j x i x j a i T a j T 1 k i j
The temperature-dependent component specific parameter a i T is given by
a i = a 0 i 1 + c 1 i 1 T r i 2
where T r i is the reduced temperature of component i, defined as T r i = T / T c i .
The residual Helmholtz energy for association A A S S O C is similar to SAFT [41], based on the formulation of Wertheim’s association theory [42,43], and can be found from the solution of the constrained optimization problem [44] given by
A A S S O C = R T i n i A i ln X A i 1 2 X A i + 1 2
1 X A i = 1 + j ρ j B i X B j A i B j
In Equations (6) and (7), X A i is the fraction of site A on component i that is not bonded to any other site, ρ j is the density of component j, and A i B j is the association strength, which is calculated from
A i B j = g ρ exp ε A i B j k B T 1 b i j β A i B j
where k B is the Boltzmann constant. The two association parameters are the association volume β A i B j , and the association energy ε A i B j , while bij is given as b i j = ( b i + b j ) / 2 . The simplified radial distribution function is calculated as g ρ = 1 1.9 η 1 , and the packing fraction η is equal to b / 4 v .
The two-site association scheme, as defined by Huang and Radosz [45], has been used for refrigerants in this study. Although the two-site scheme cannot entirely reflect the association mechanism in HFCs and HFOs, combining this scheme can yield reasonable and accurate results [28].
In the parameter regression, the objective function is
F = i N p l i c a l l i e x p l i e x p 2
where N p is the number of data points, l i c a l represents the calculated values (saturated pressure, saturated density, mole fraction), and l i e x p represents the corresponding experimental data.
In regression, the average relative deviations (ARD) are used to evaluate the calculation performance:
A R D % = 1 N p i N p z i c a l z i e x p z i e x p × 100 %
In calculations, z i c a l and z i e x p represent the calculated values and the corresponding experimental values.

3. Calculated Results and Discussion
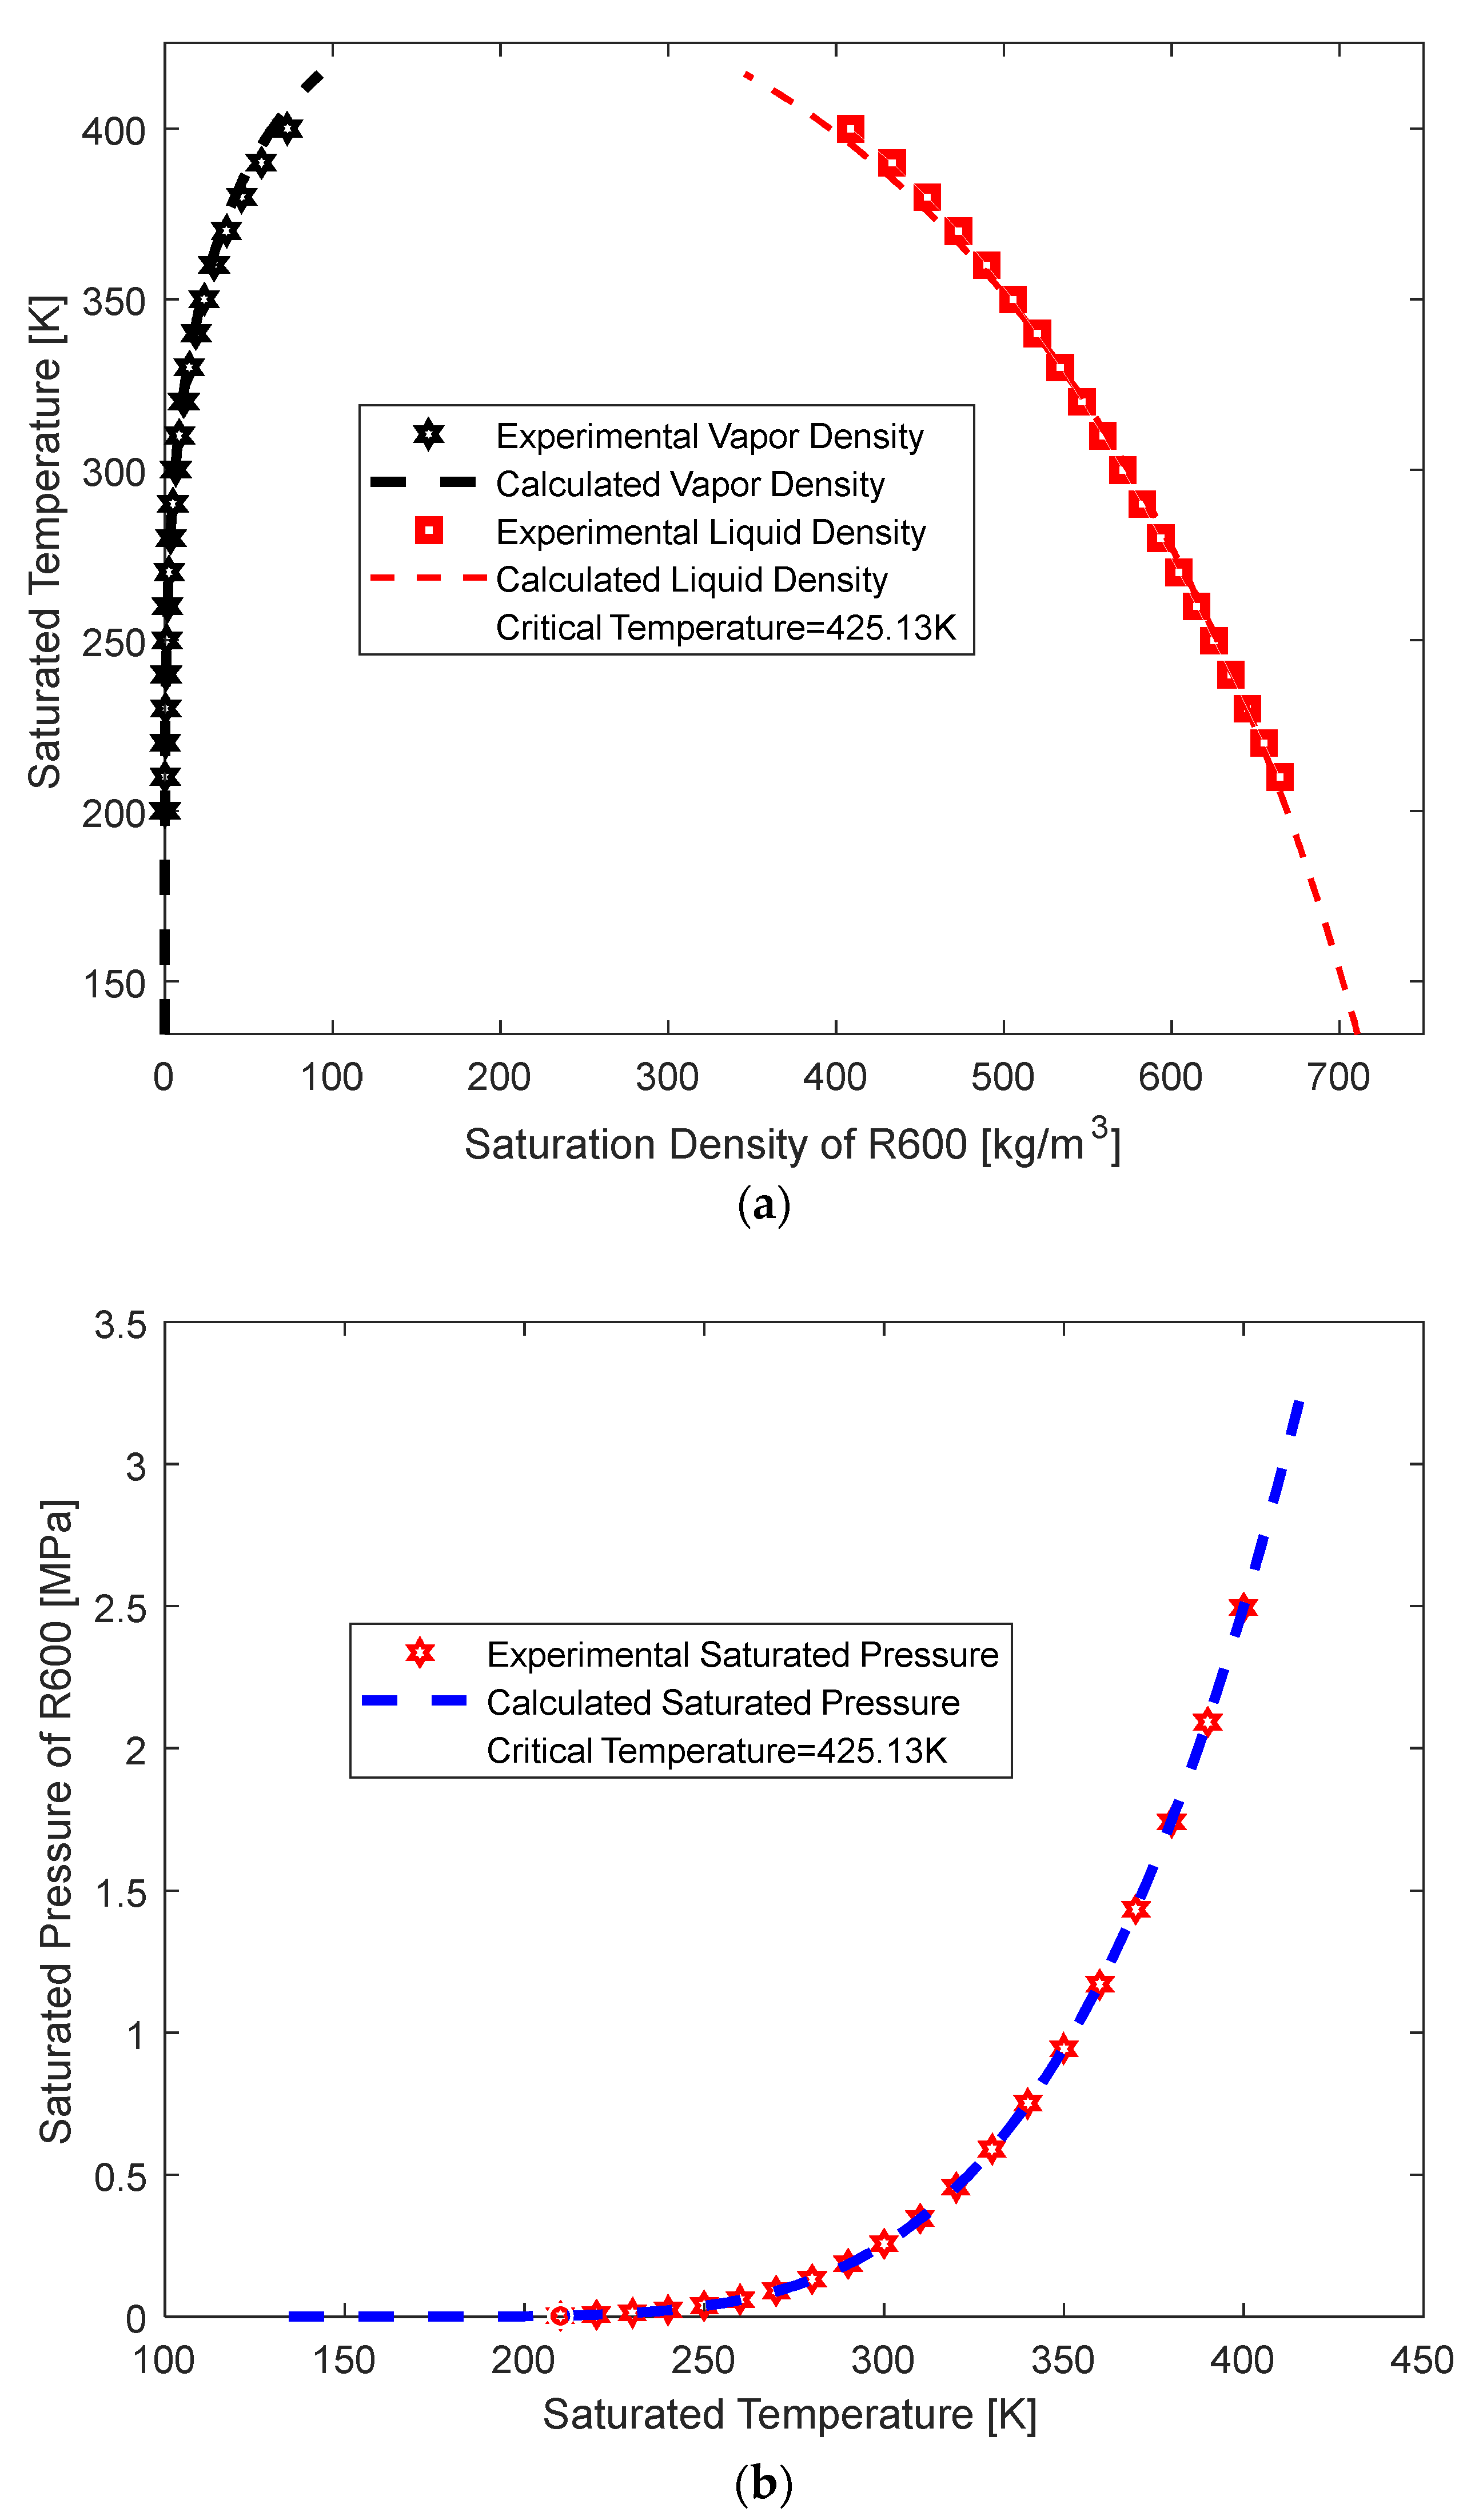
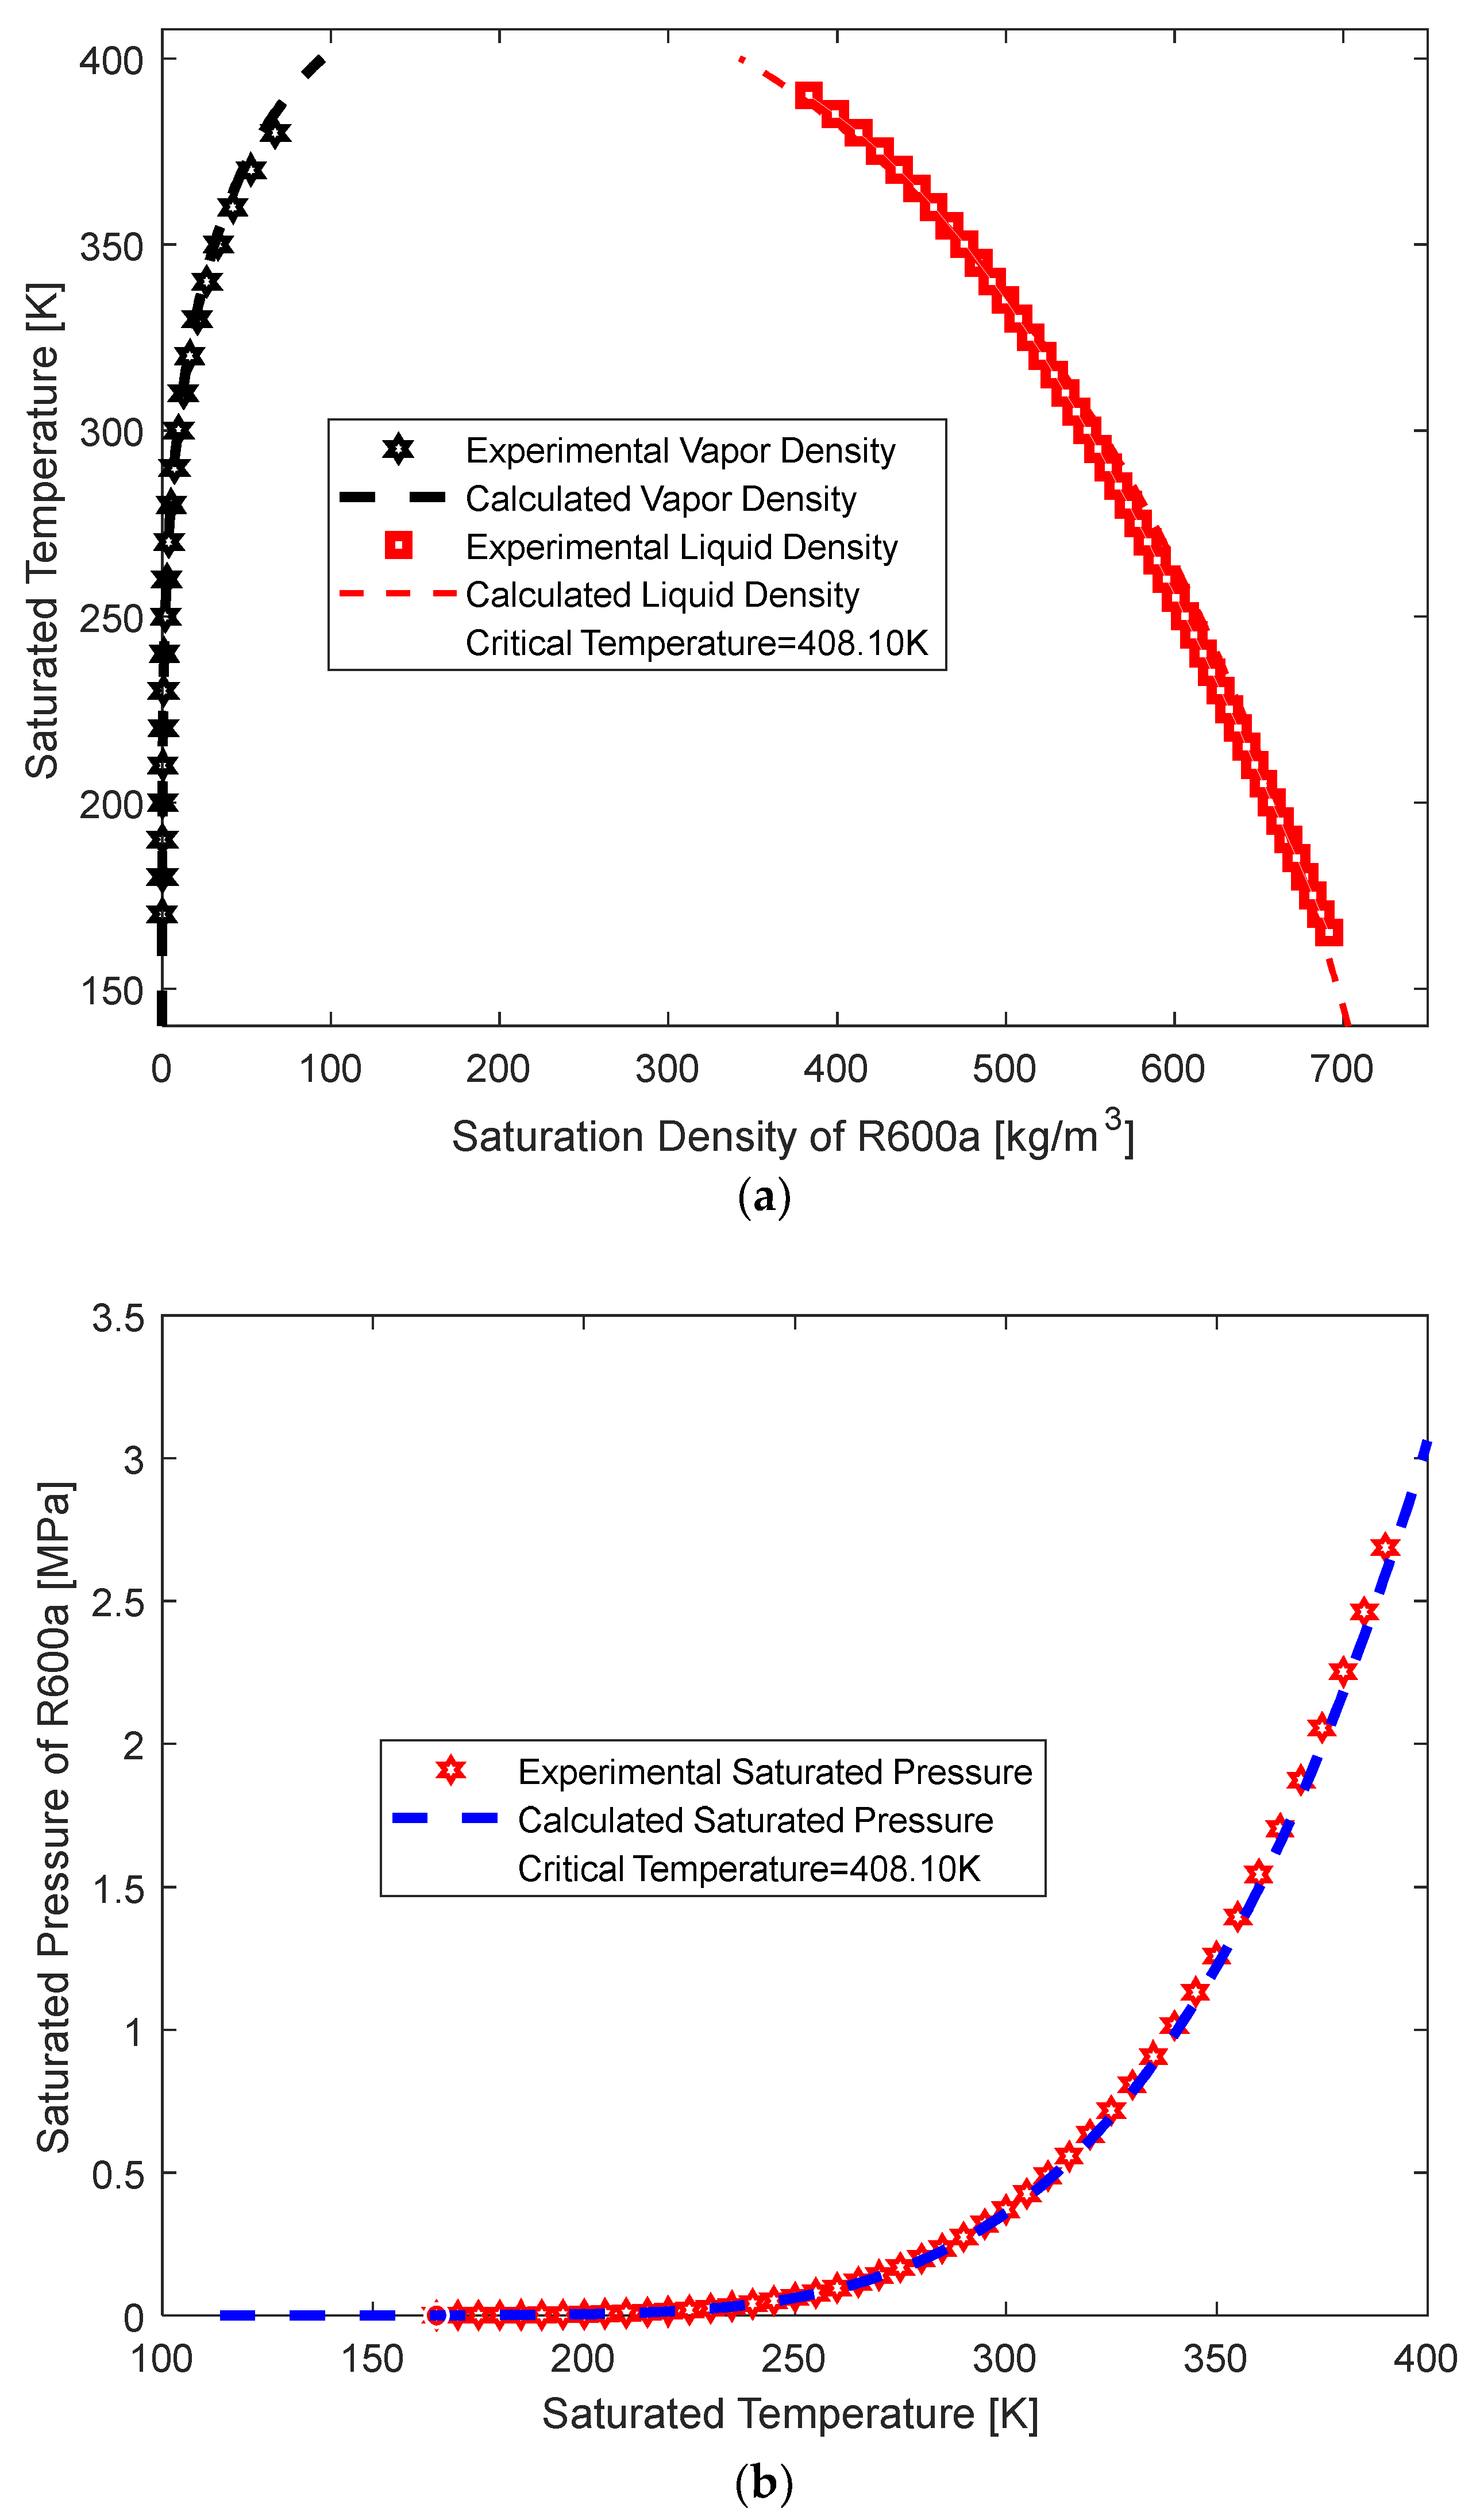
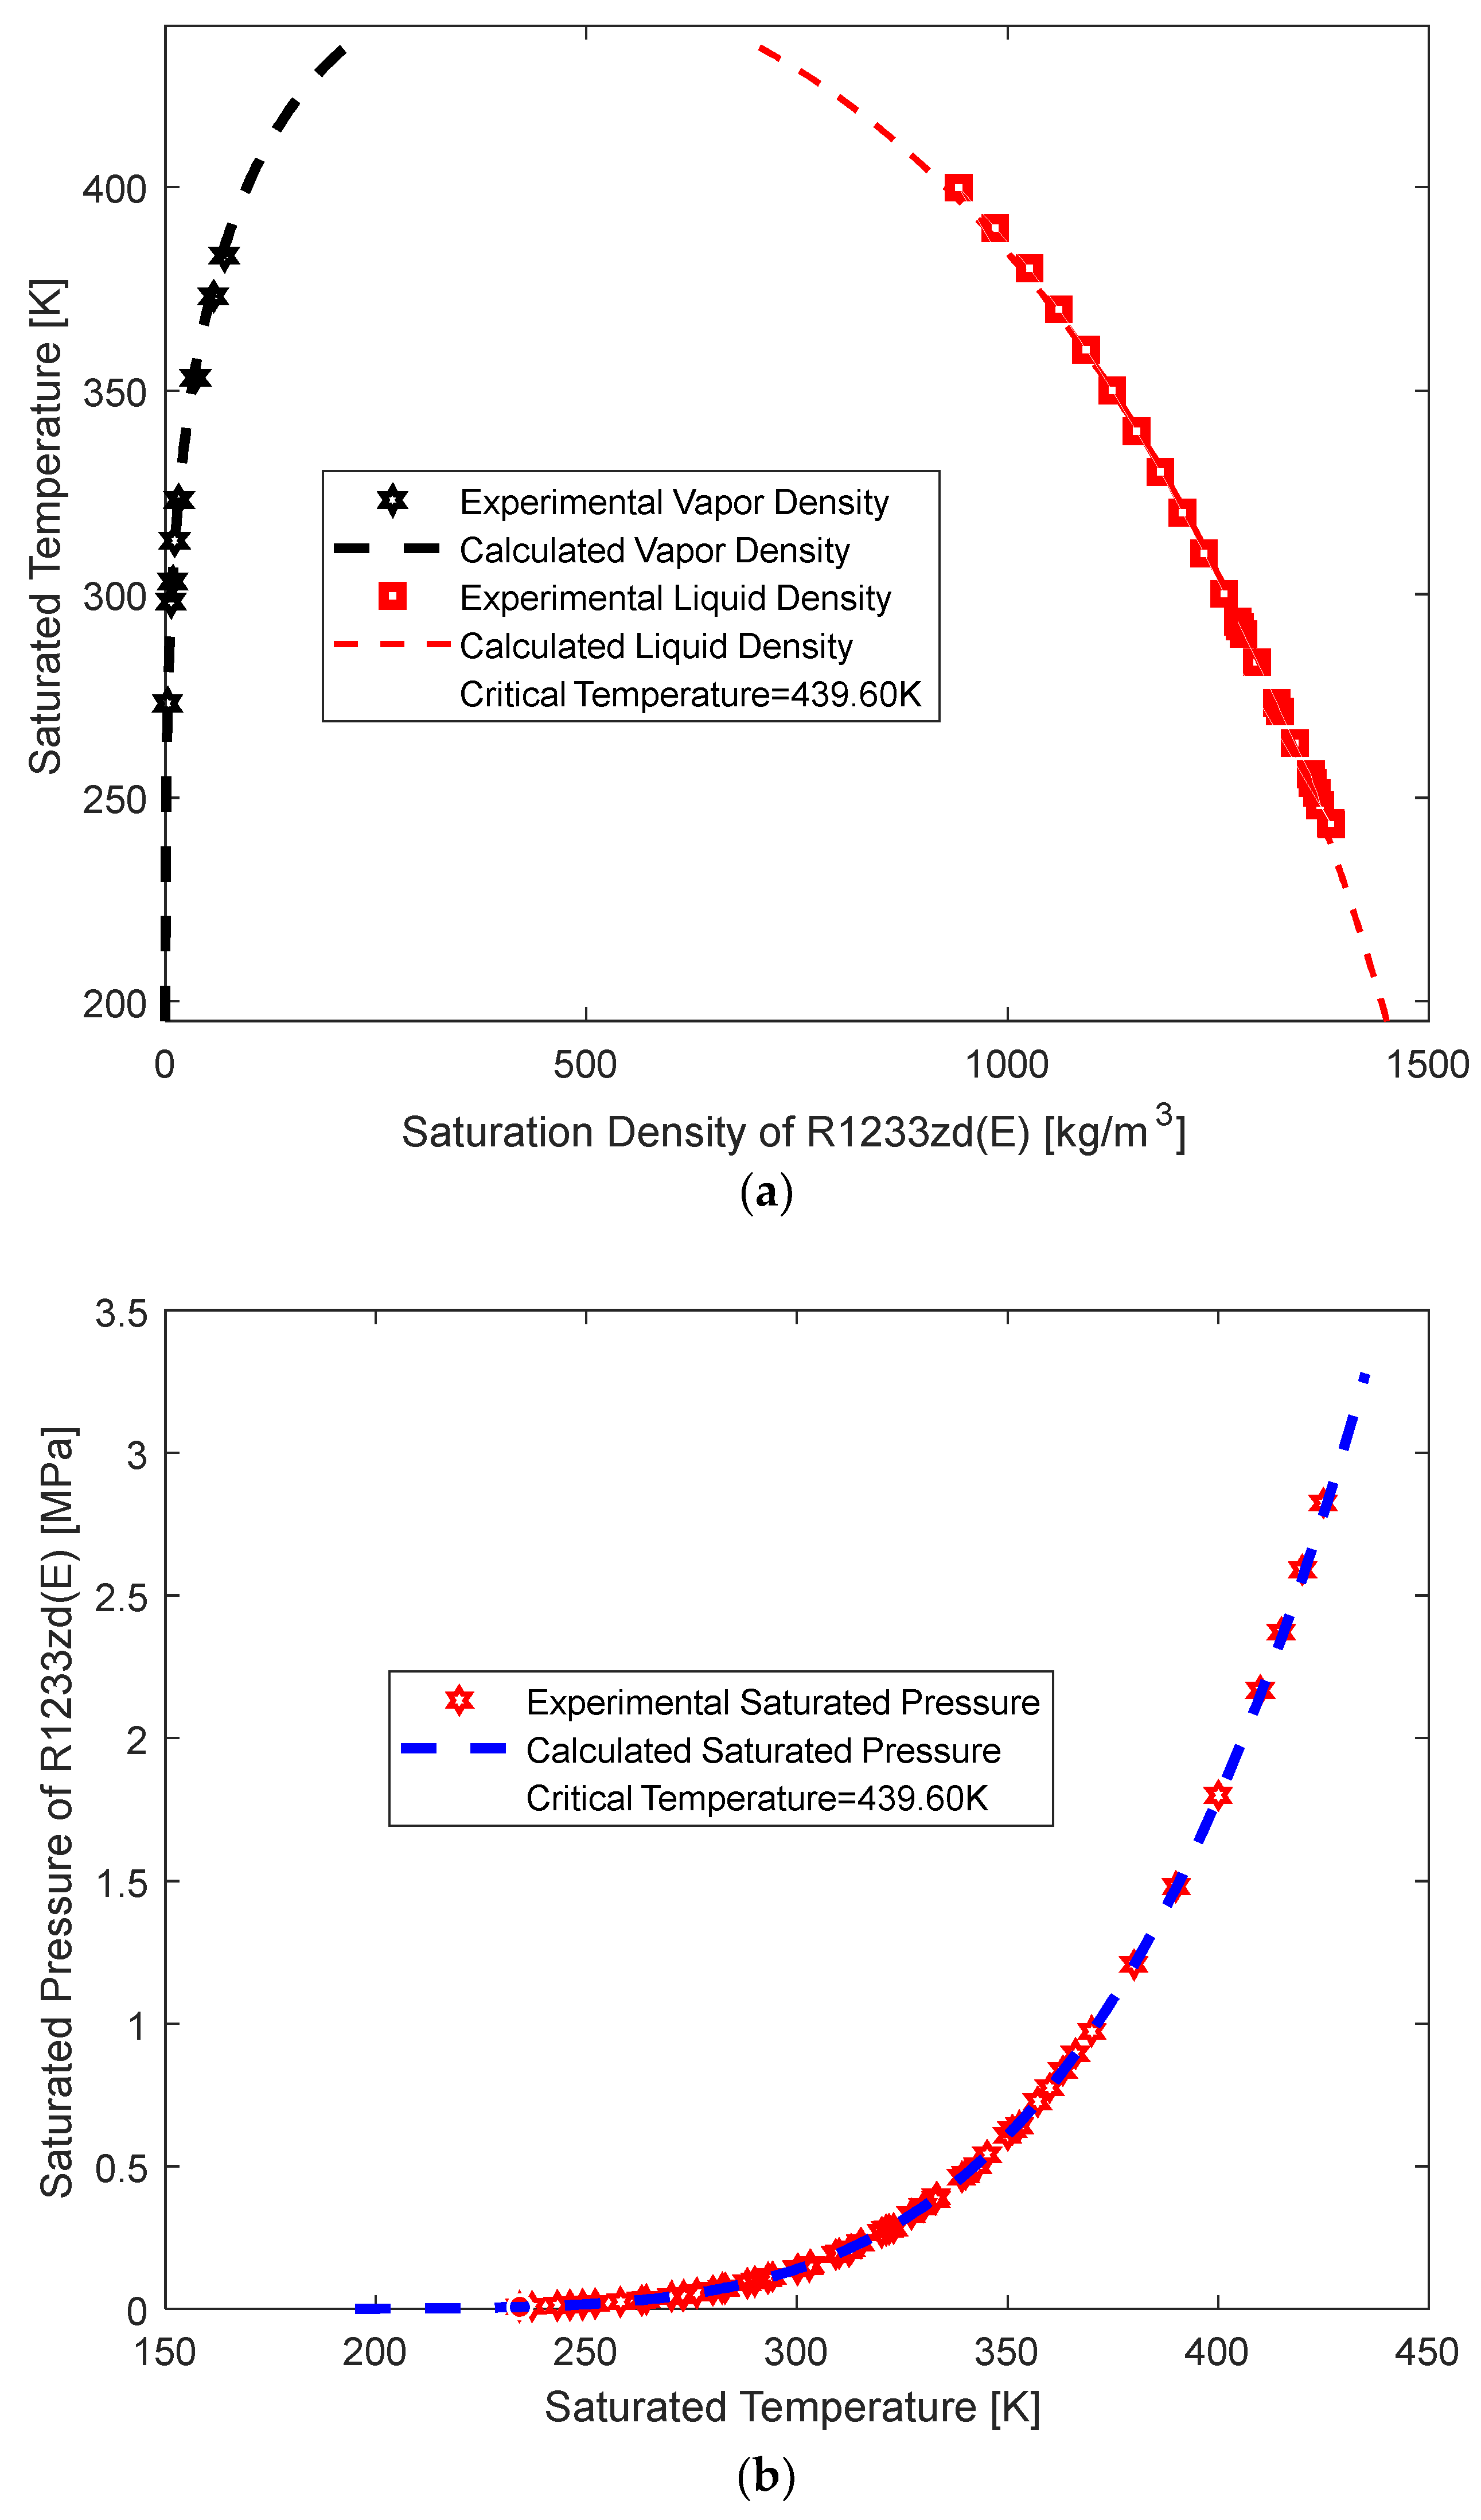
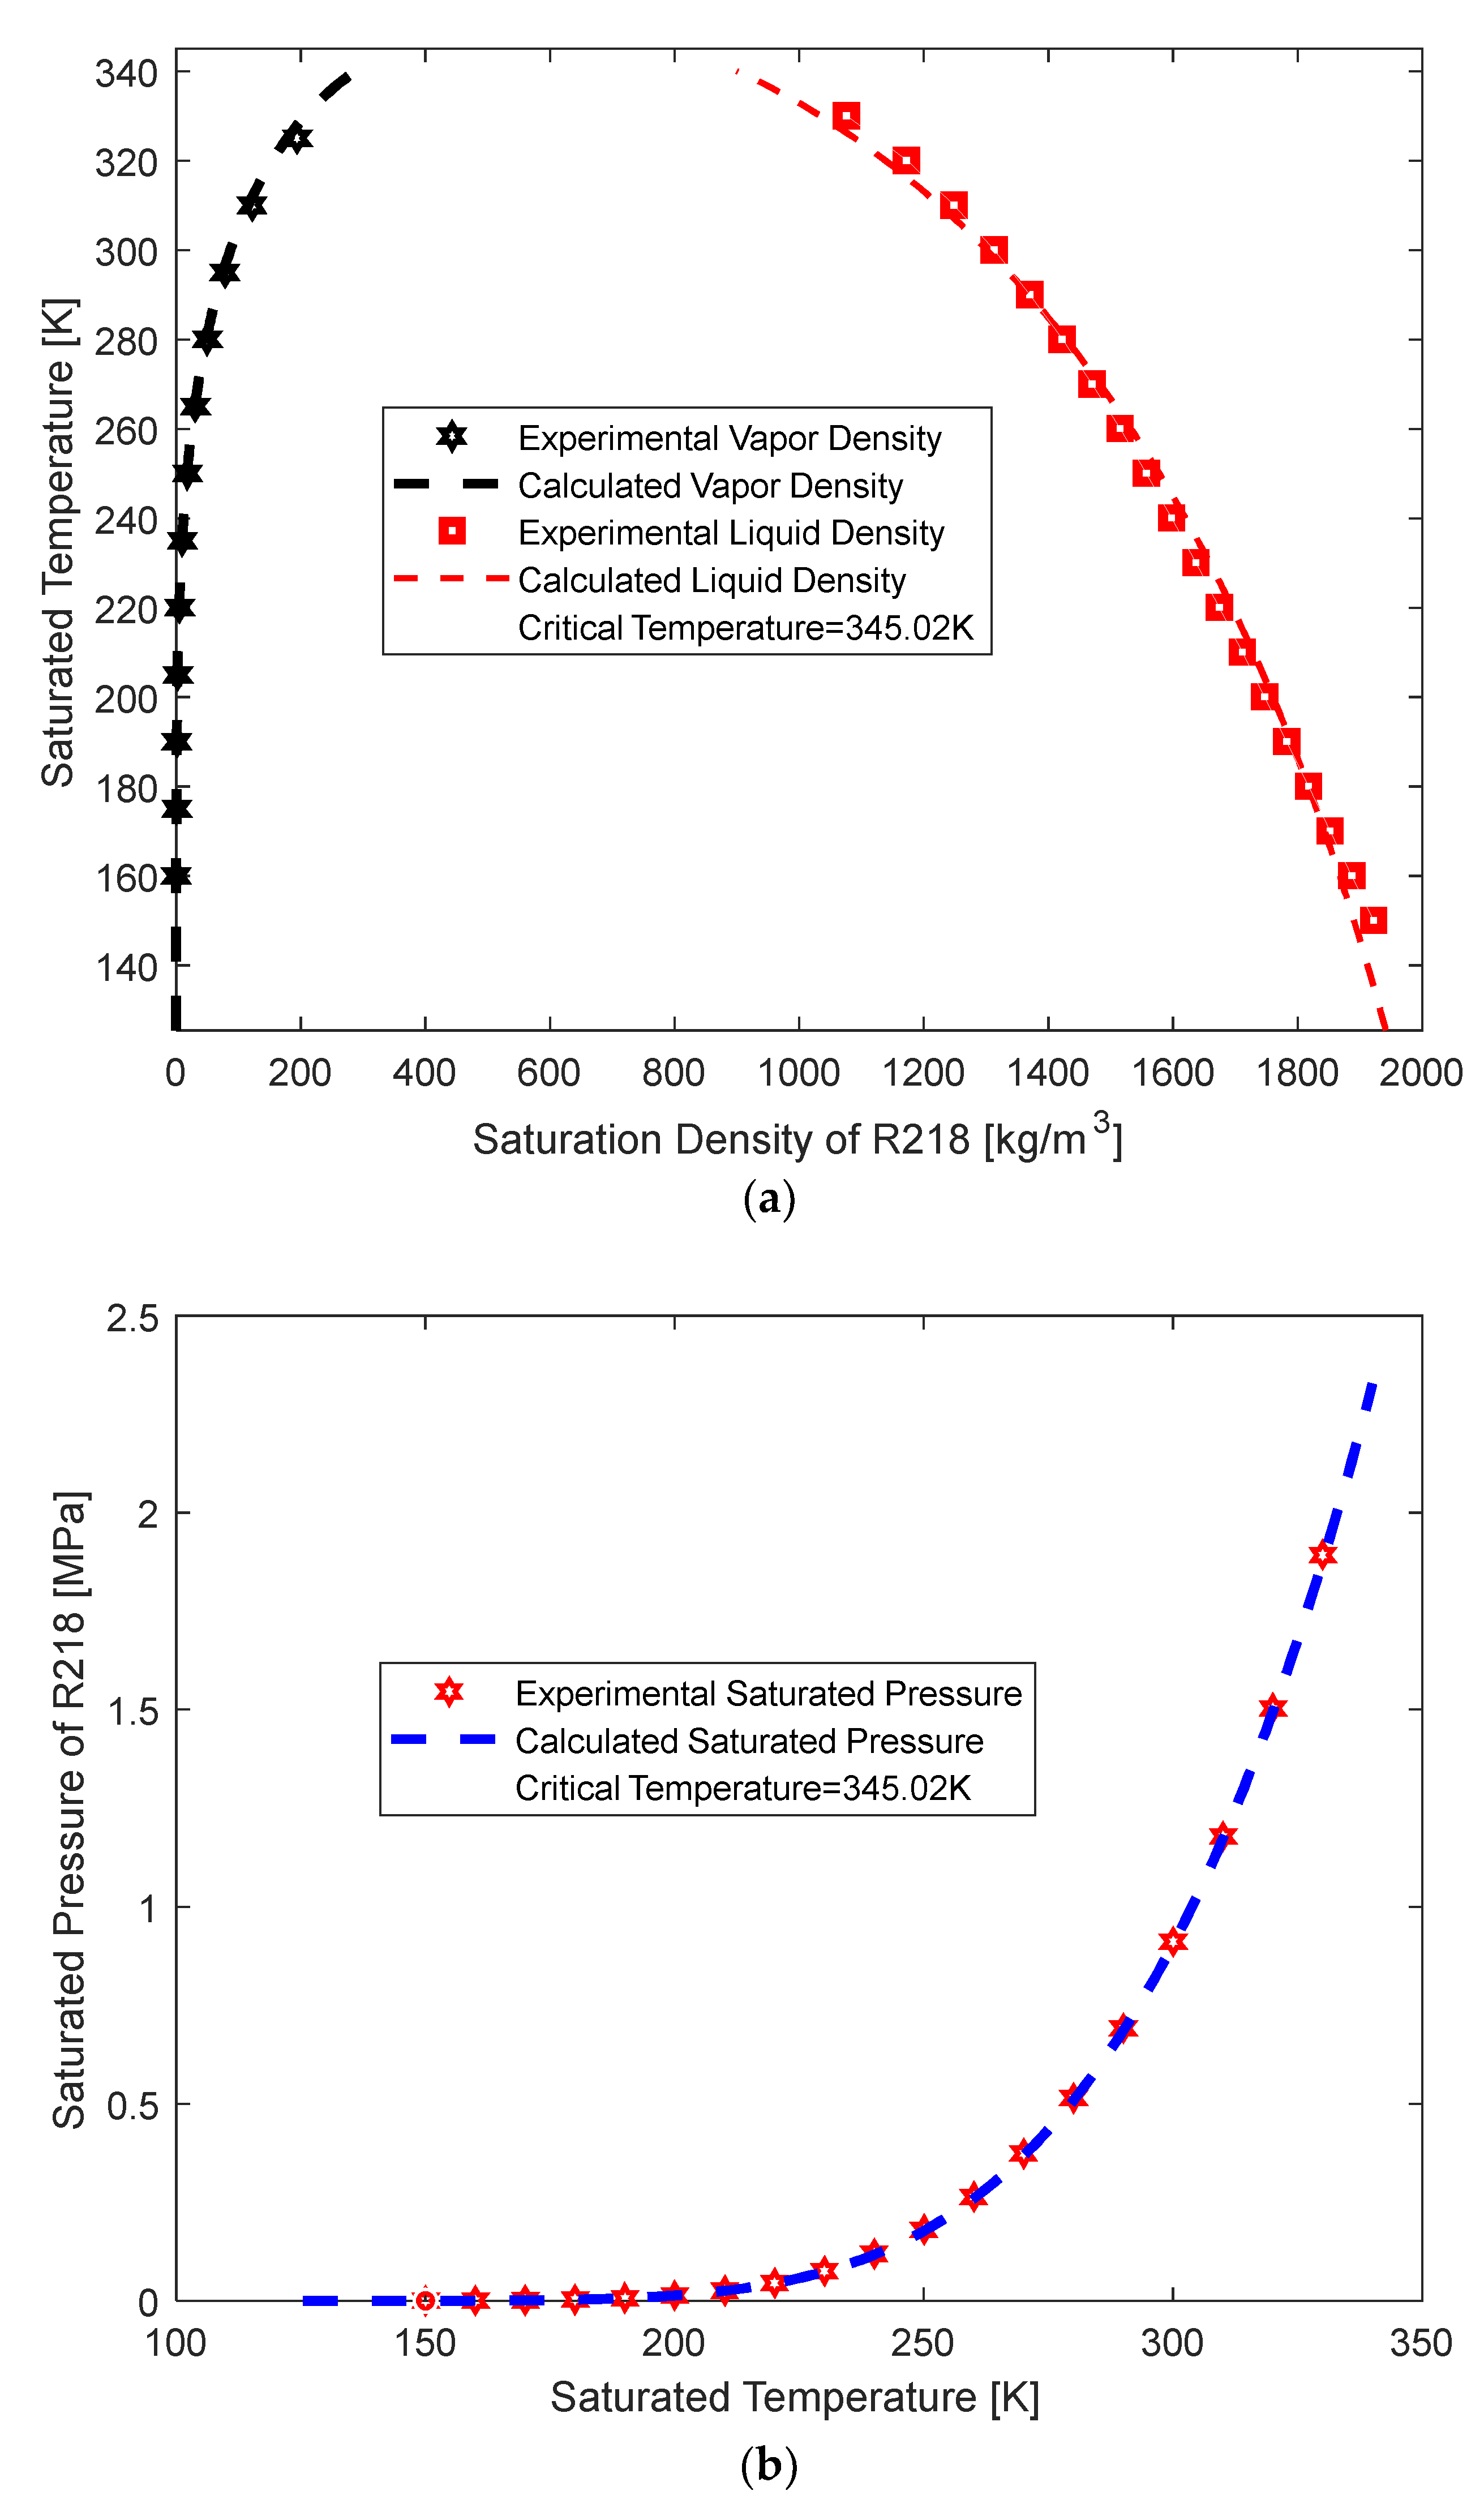
The calculation of VLE is a foundational work for designing and evaluating thermal cycles. When applying CPA to one binary refrigerant mixture, there are three non-association parameters, two association parameters for each pure component, and a binary interaction parameter. This work studies nine pure refrigerants and ten binary refrigerant mixtures. Five CPA parameters of each refrigerant are obtained by regressing the saturated properties of each refrigerant. After obtaining the CPA parameters of pure refrigerants, a binary interaction parameter is obtained by regressing the VLE data of a binary refrigerant mixture. PT-flash is known for its stability and rigor in performing VLE calculations. In this study, we employed a two-phase PT-flash with the successive substitution method [46]. Notably, the feed composition plays a pivotal role in PT-flash calculations. In this work, we consider the experimental feed composition at a specific temperature and pressure as the reference.

3.1. Pure Component

The saturated vapor pressure is an essential physical property for refrigerants. Equipment design also needs accurate models to predict the saturated vapor pressure of the fluid over wide temperature/pressure ranges.
In CPA calculations for pure components, the saturated vapor pressure and the saturated liquid density are included in the parameter regression. In this work, the saturated vapor density is introduced into the objective regression function. The aim is to avoid the deterioration of vapor properties and overfitting of liquid properties [28].
Some components’ data are available in NIST; for these components, the data are sourced from the NIST database [35] by default. In the region very close to the critical points, the performances of CPA are worse and unstable, so we chose data points that avoid the critical point.
The data points very close to the critical points in Table 2 are excluded, because in those regions, CPA’s performance becomes unstable. The upper limit of the data points in Table 2 corresponds to the upper limit of CPA’s stable performance.
Table 2 shows the regression parameters and calculation performance of saturated properties for nine pure refrigerants. The parameters of R1234ze(E) and R1234yf were taken from the literature [28].
From the results in Table 2, CPA gives good agreements with experimental data over wide temperature ranges; the ARD of the saturated vapor pressure, saturated liquid density, and saturated vapor density are less than 1.0%, 1.5%, and 3.5%, respectively. Overall, the calculation performance of saturated vapor pressure is better than that of liquid phase density, and the performance of liquid phase density is better than that of vapor phase density.
Some refrigerants have similar structures and properties, so the fitted non-association parameters are similar. From Table 2, it can be seen that R600 and R600a have similar non-association parameters, R1234ze(E) and R1234yf have similar non-association parameters, and R1233zd(E) and R1233xf have similar non-association parameters. However, the association parameters are significantly different. The difference in association parameters means there are still significant differences in hydrogen-bonding effects on thermodynamic properties. Here, representative calculation results of five pure components are selected to be displayed.
Figure 1, Figure 2, Figure 3, Figure 4 and Figure 5 show the calculated details of five pure refrigerants. From the figures, it can be seen intuitively that the calculation performance of saturated vapor pressure is slightly better than that of saturated density.
CPA’s calculation performance deteriorates near the critical point, where it cannot effectively connect the liquid phase density line with the vapor phase density line. In theory, the properties of the vapor and liquid phases should be the same at the critical point. However, obtaining the data of such a phenomenon in many experiments is challenging. When the calculated temperature exceeds the critical temperature, the refrigerant will not be able to maintain the normal phase change process, thus affecting the performance and efficiency of thermal cycles.
Data very close to the critical point are not included in the regression because CPA cannot describe the peculiar phase behaviors well, which is also a problem faced by most EoS models [61]. The range of data points we listed in Table 2 is the limit of this regression. In our attempted calculations, the calculation deviations will increase sharply when the maximum temperature is exceeded.
CPA can give good regression performances for other data not very close to critical points. The reason is that CPA retains the concise form of SRK and adds an association term that considers hydrogen-bonding associations, improving the calculation accuracy. In published works [28], SRK without an association term can also give an ARD of about 3.0%.

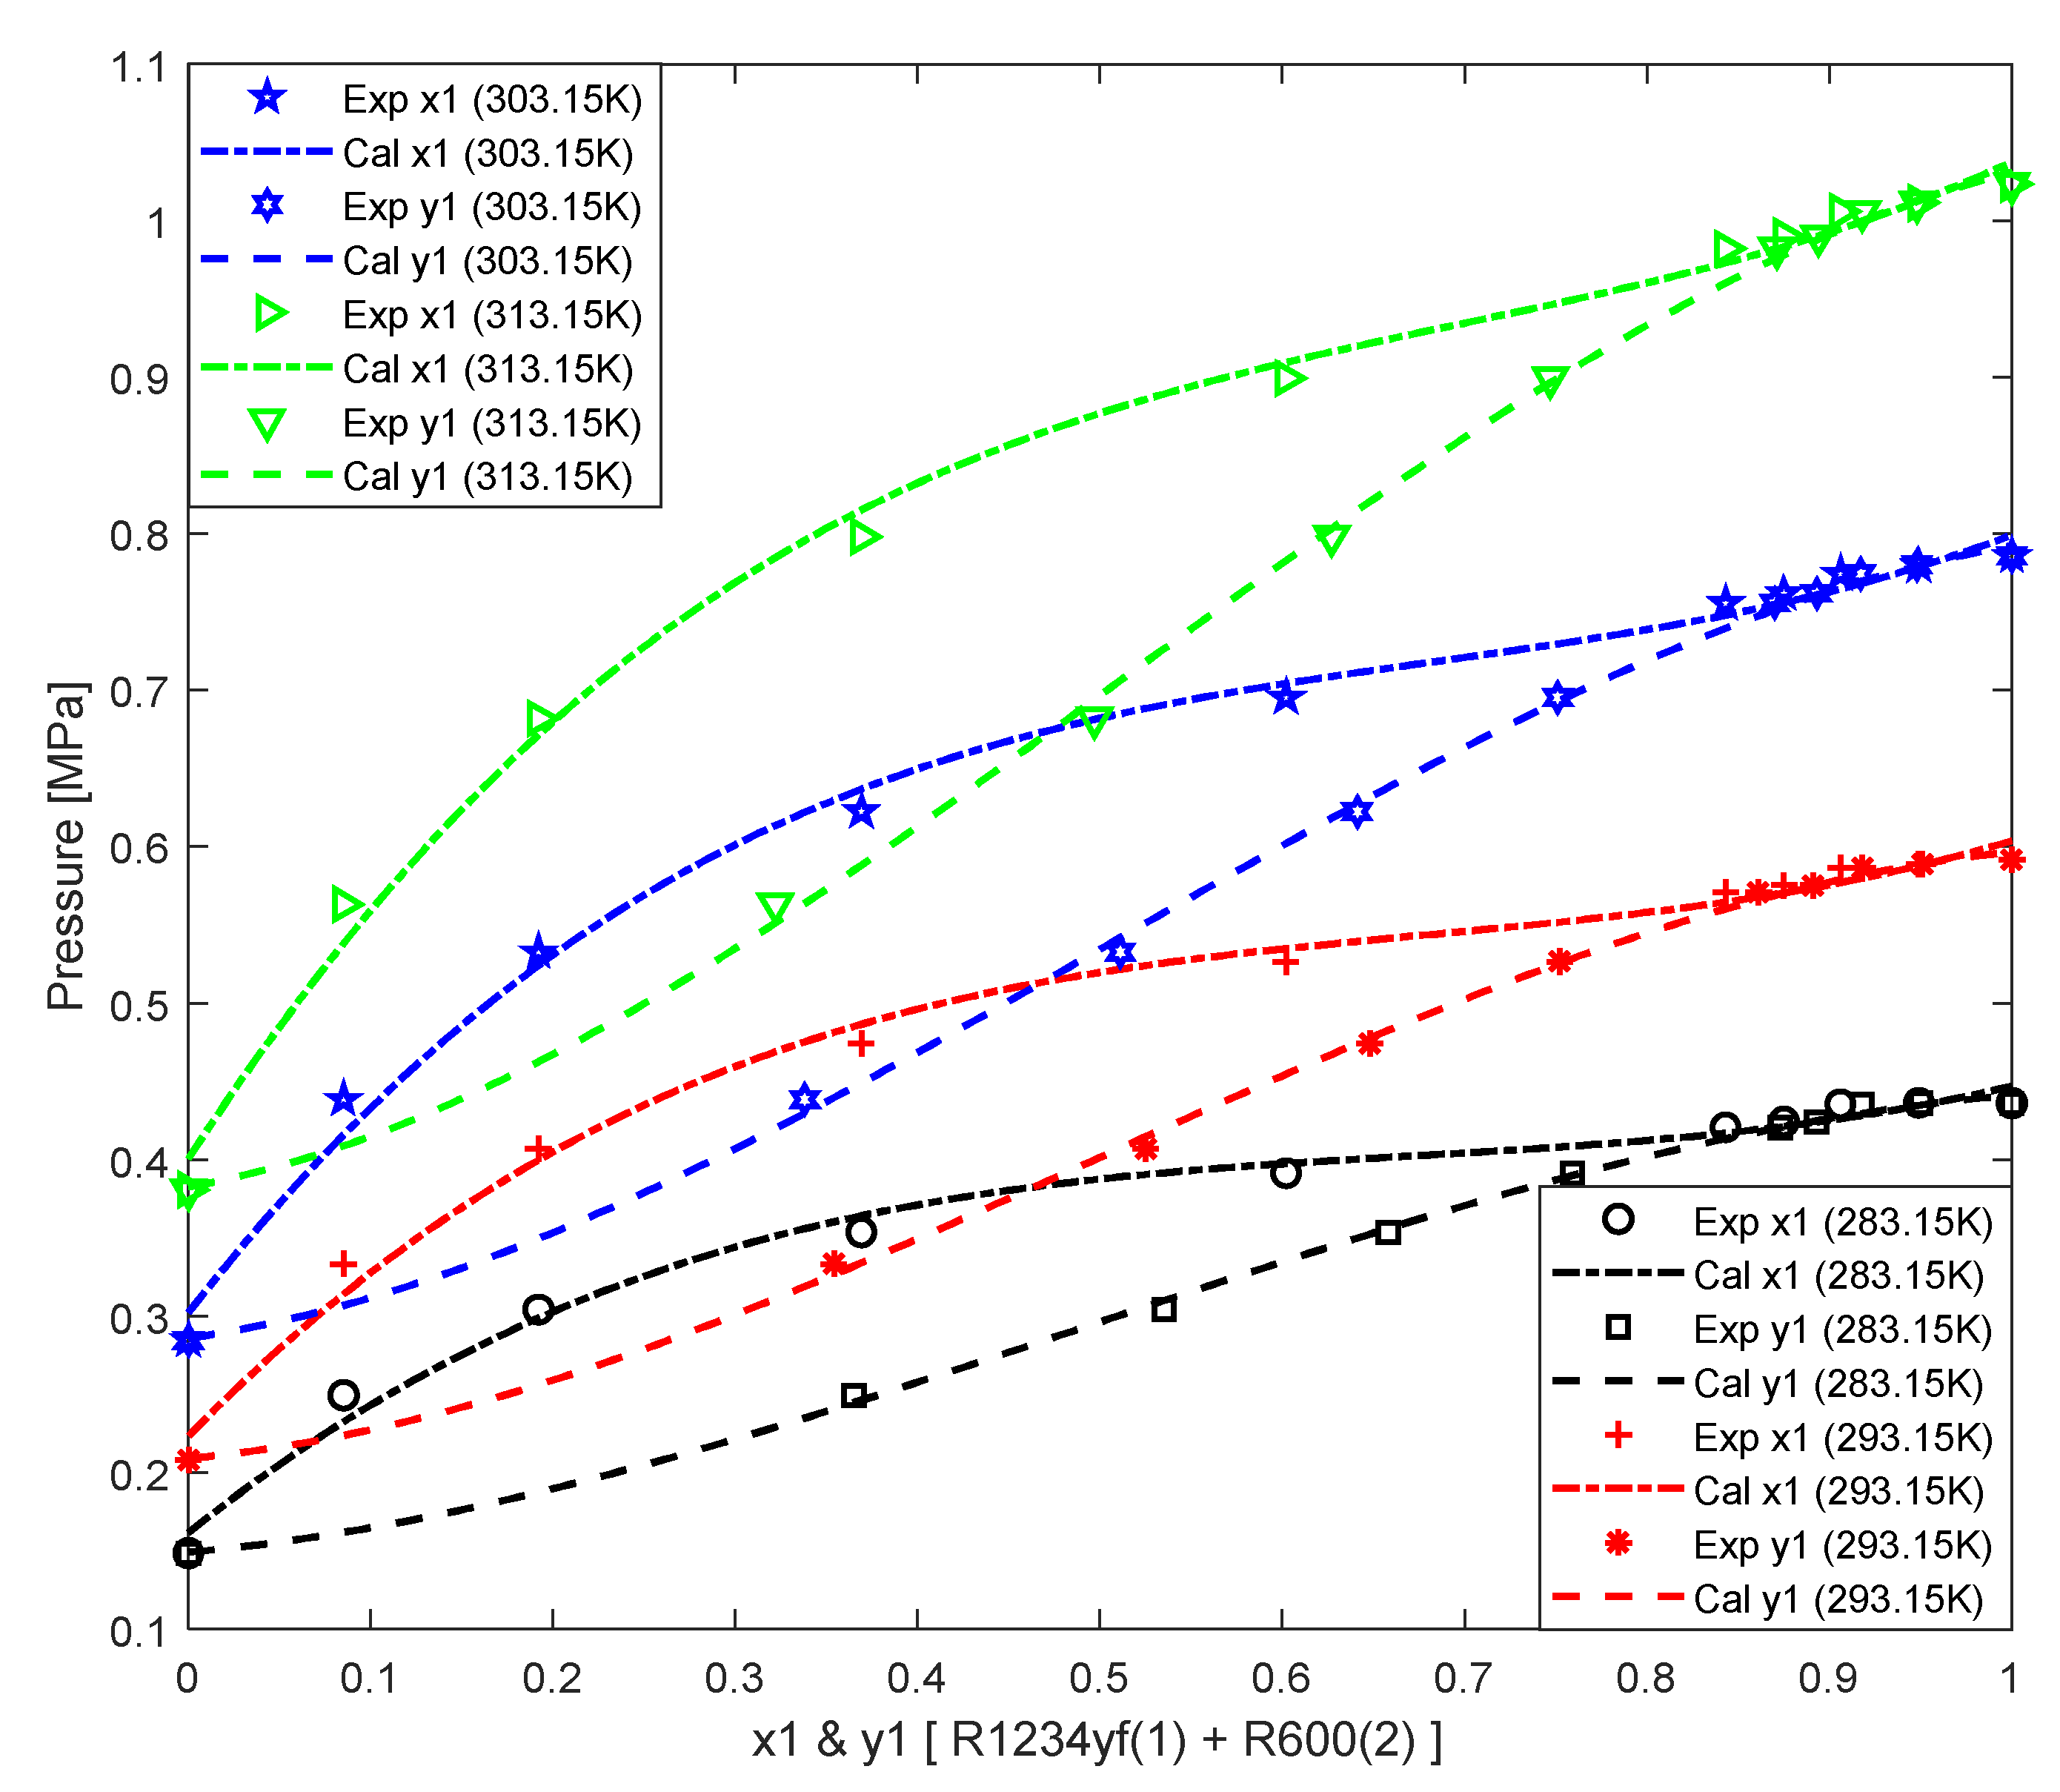
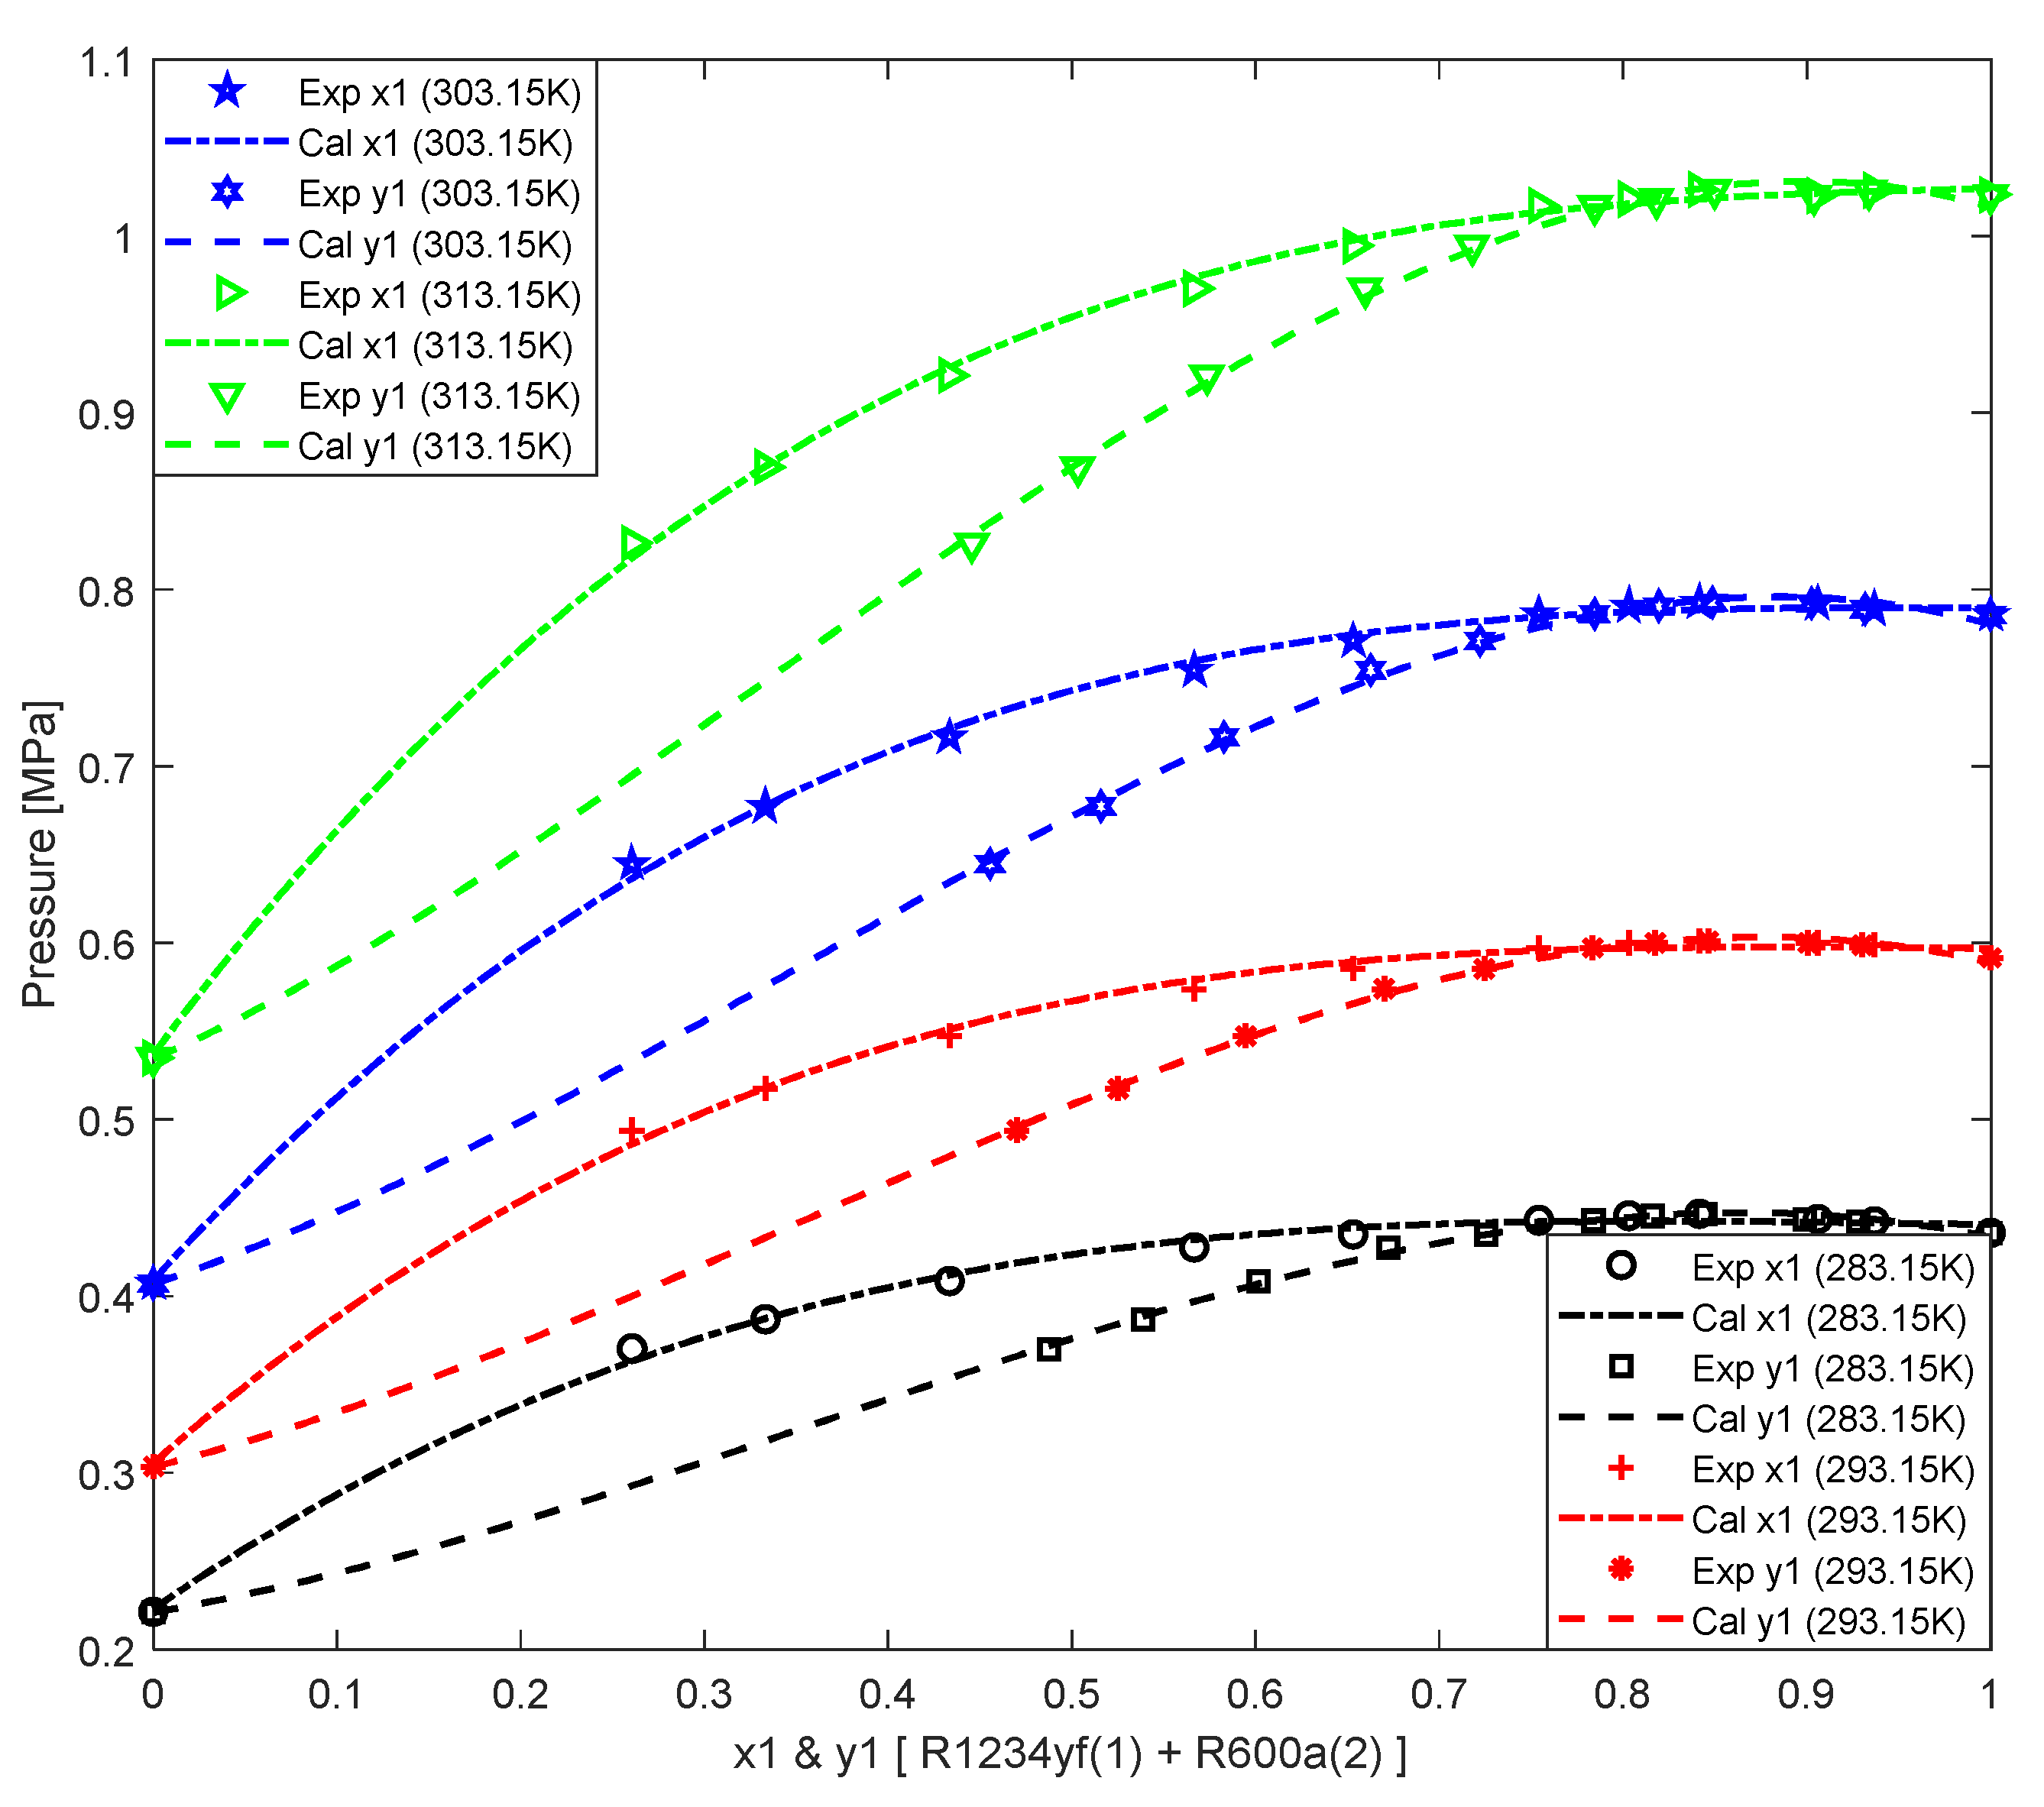
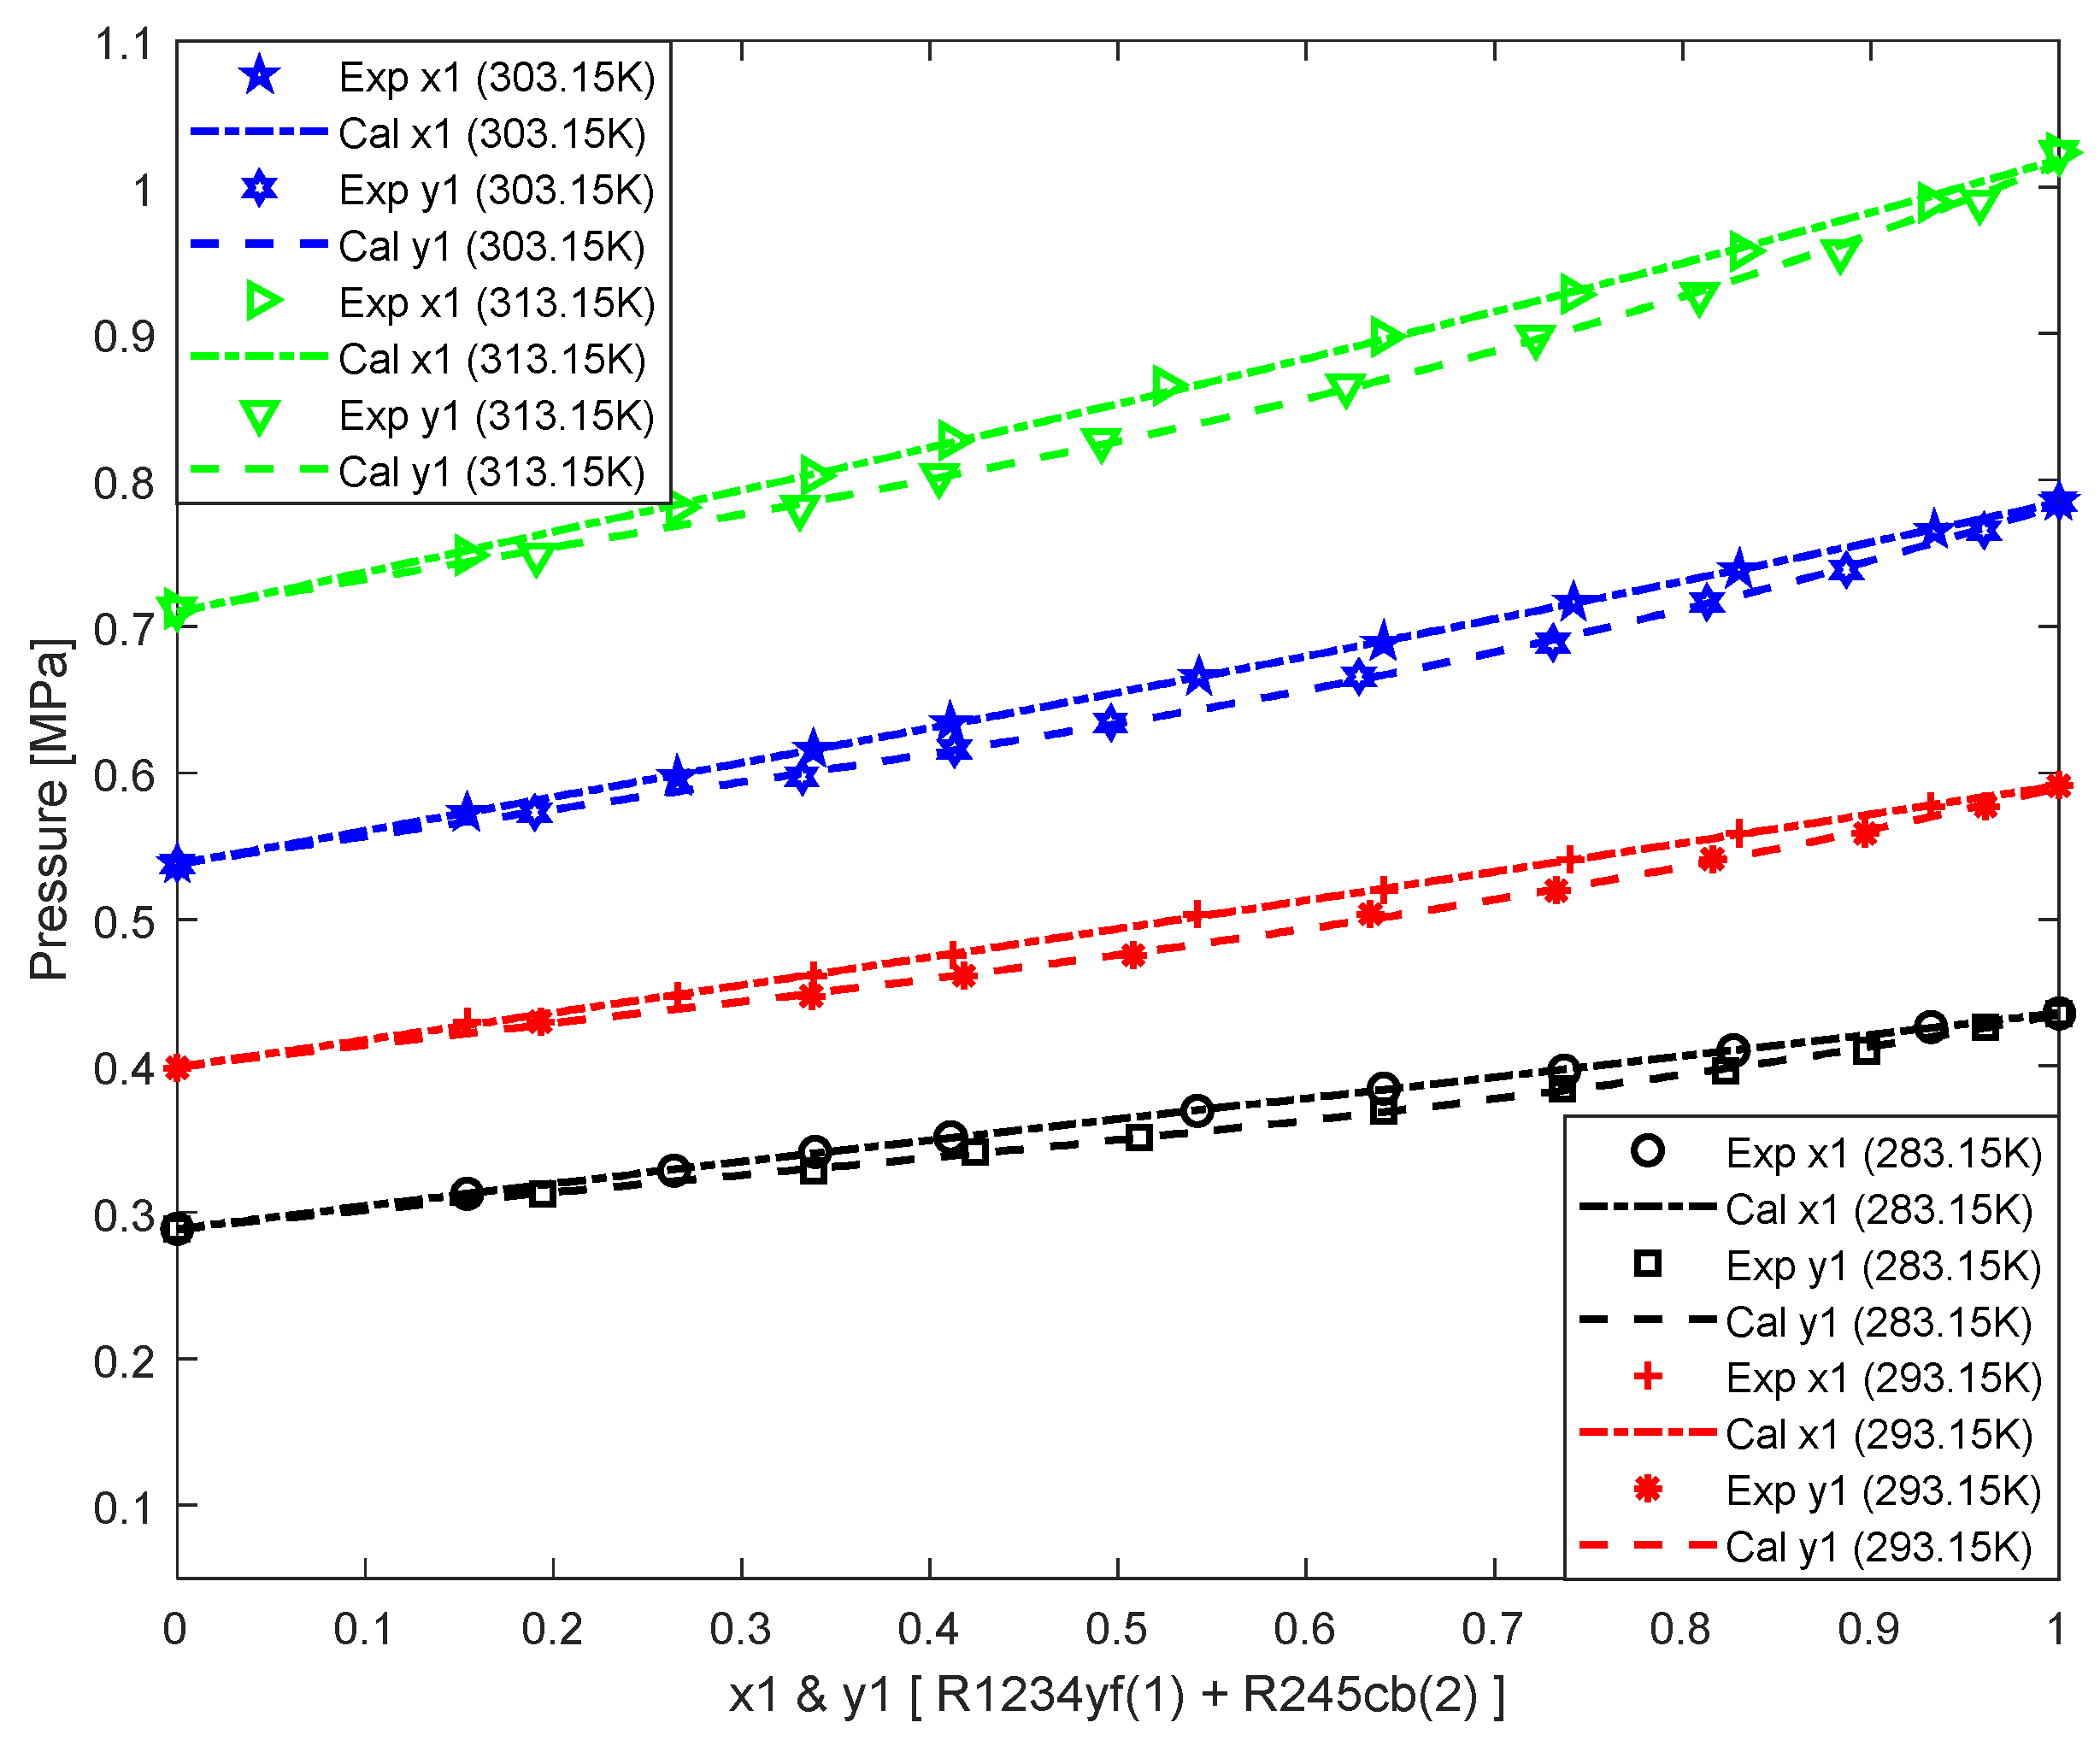
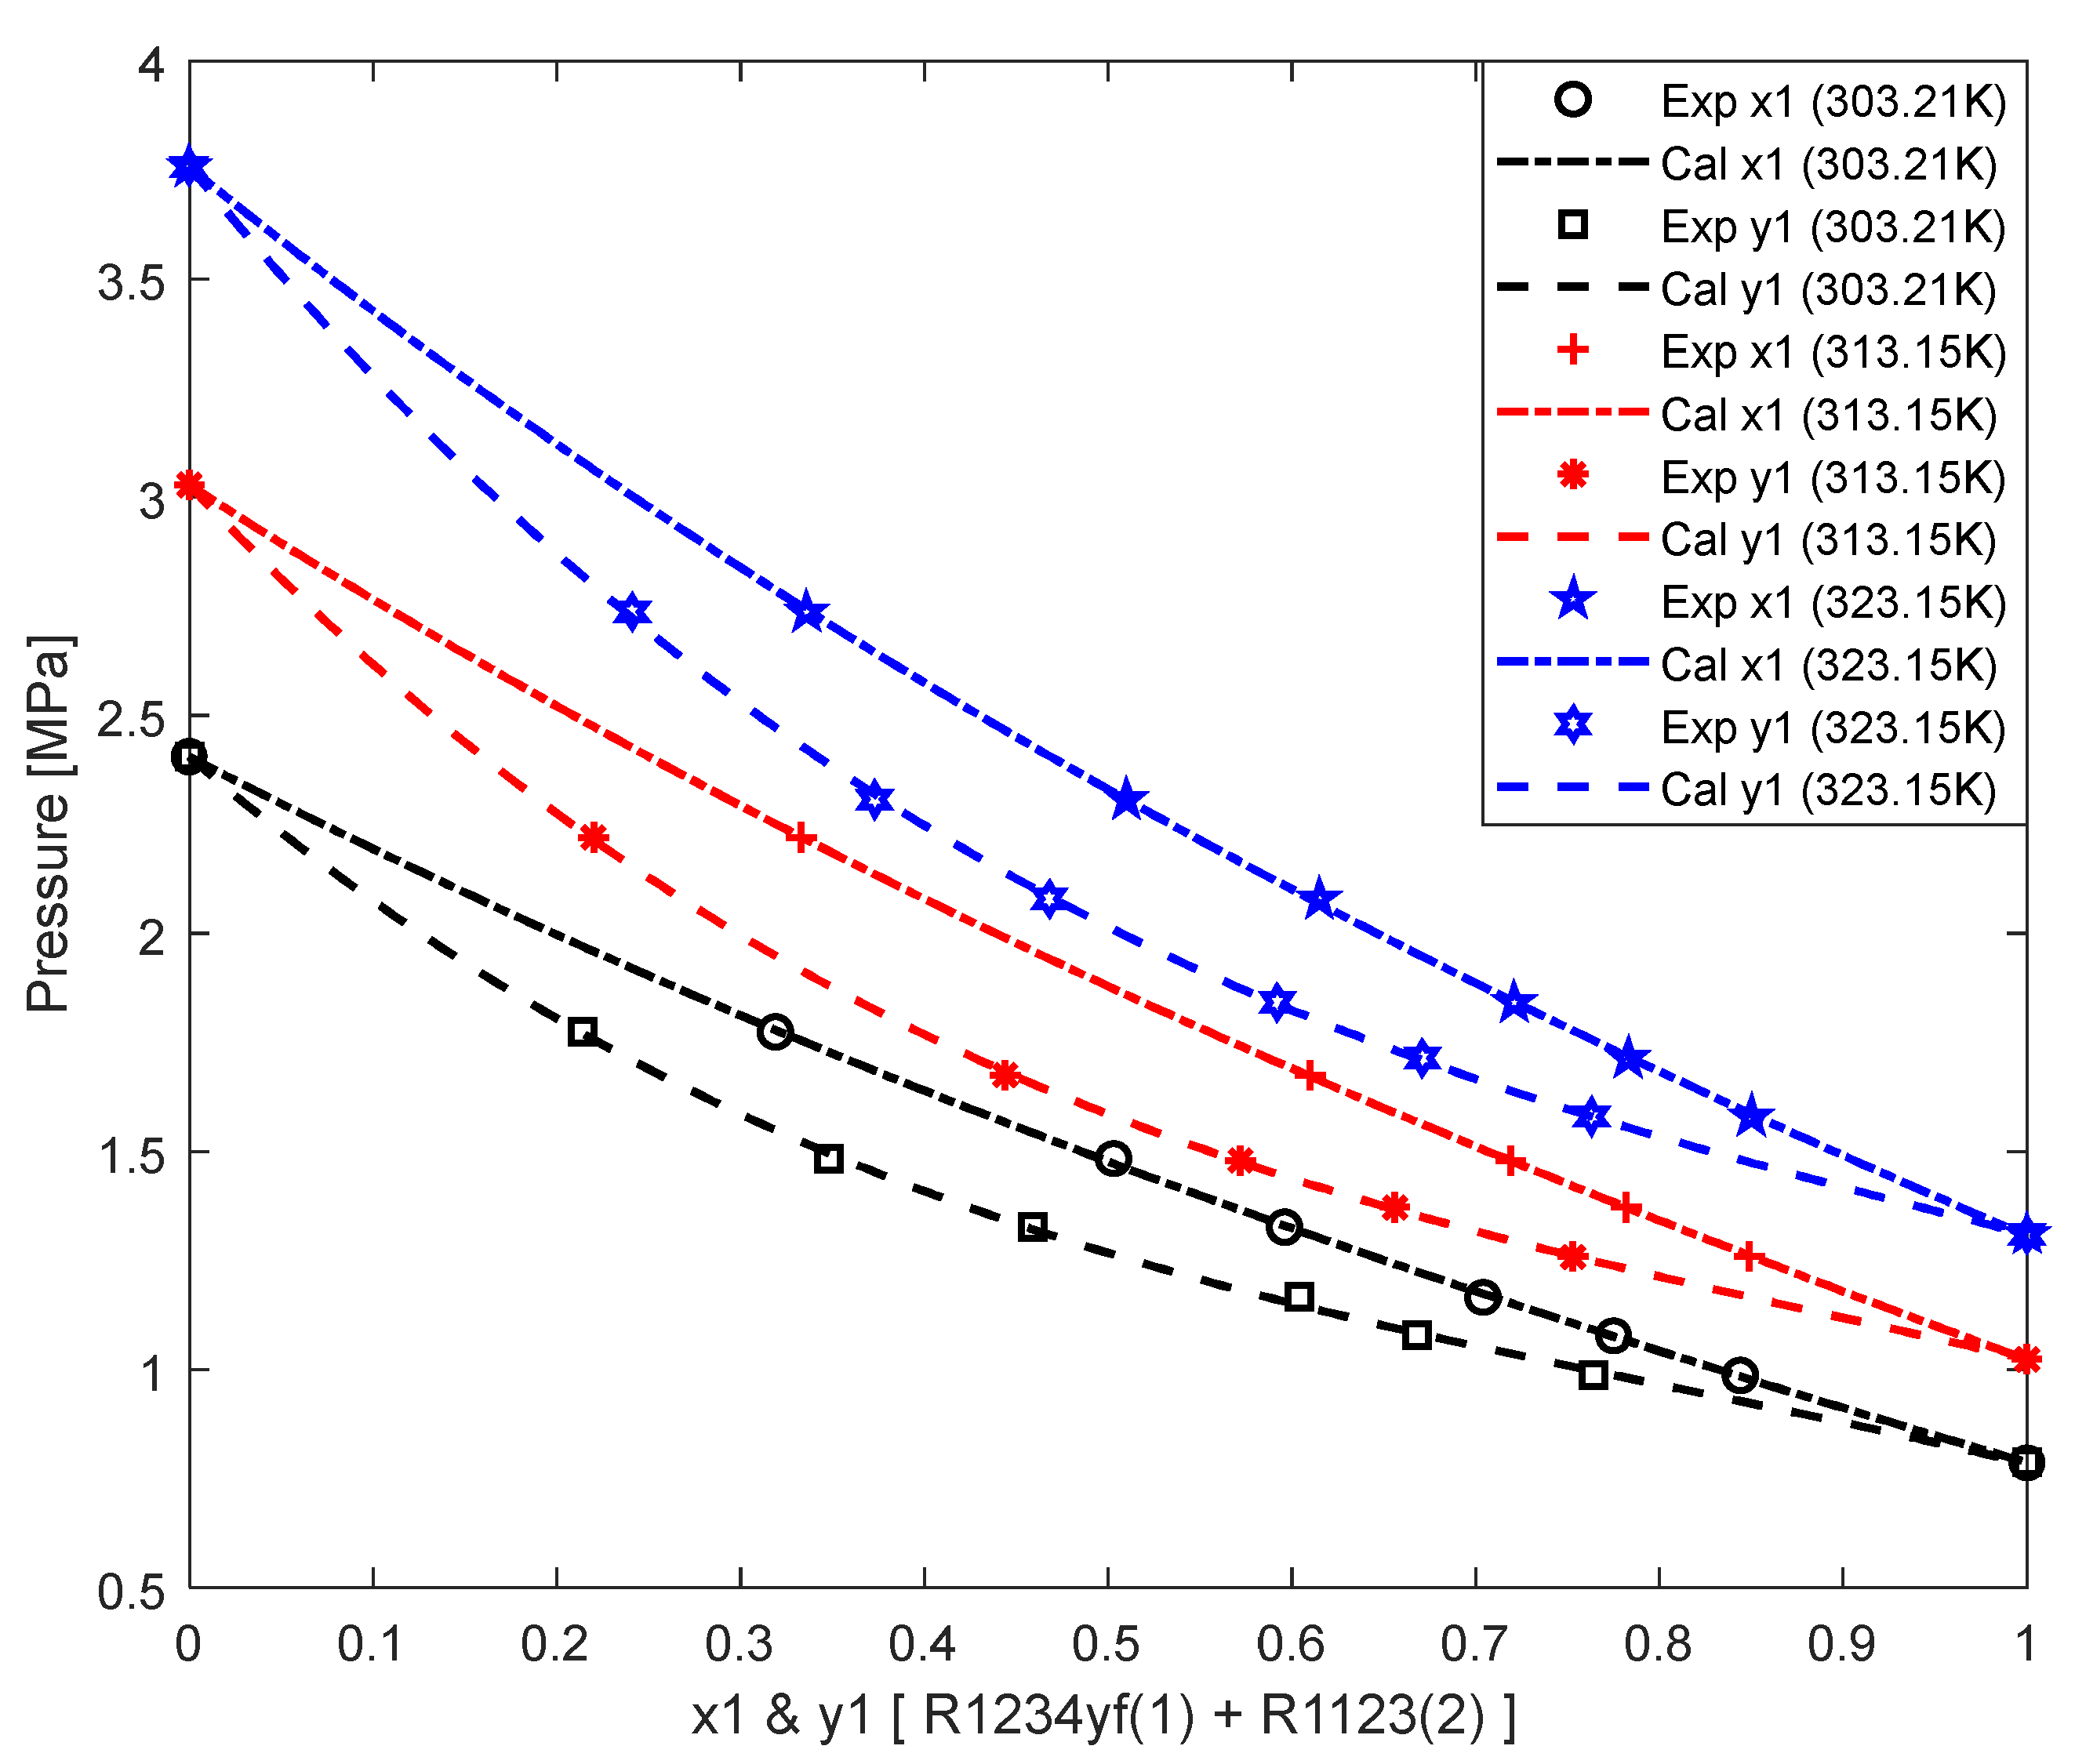
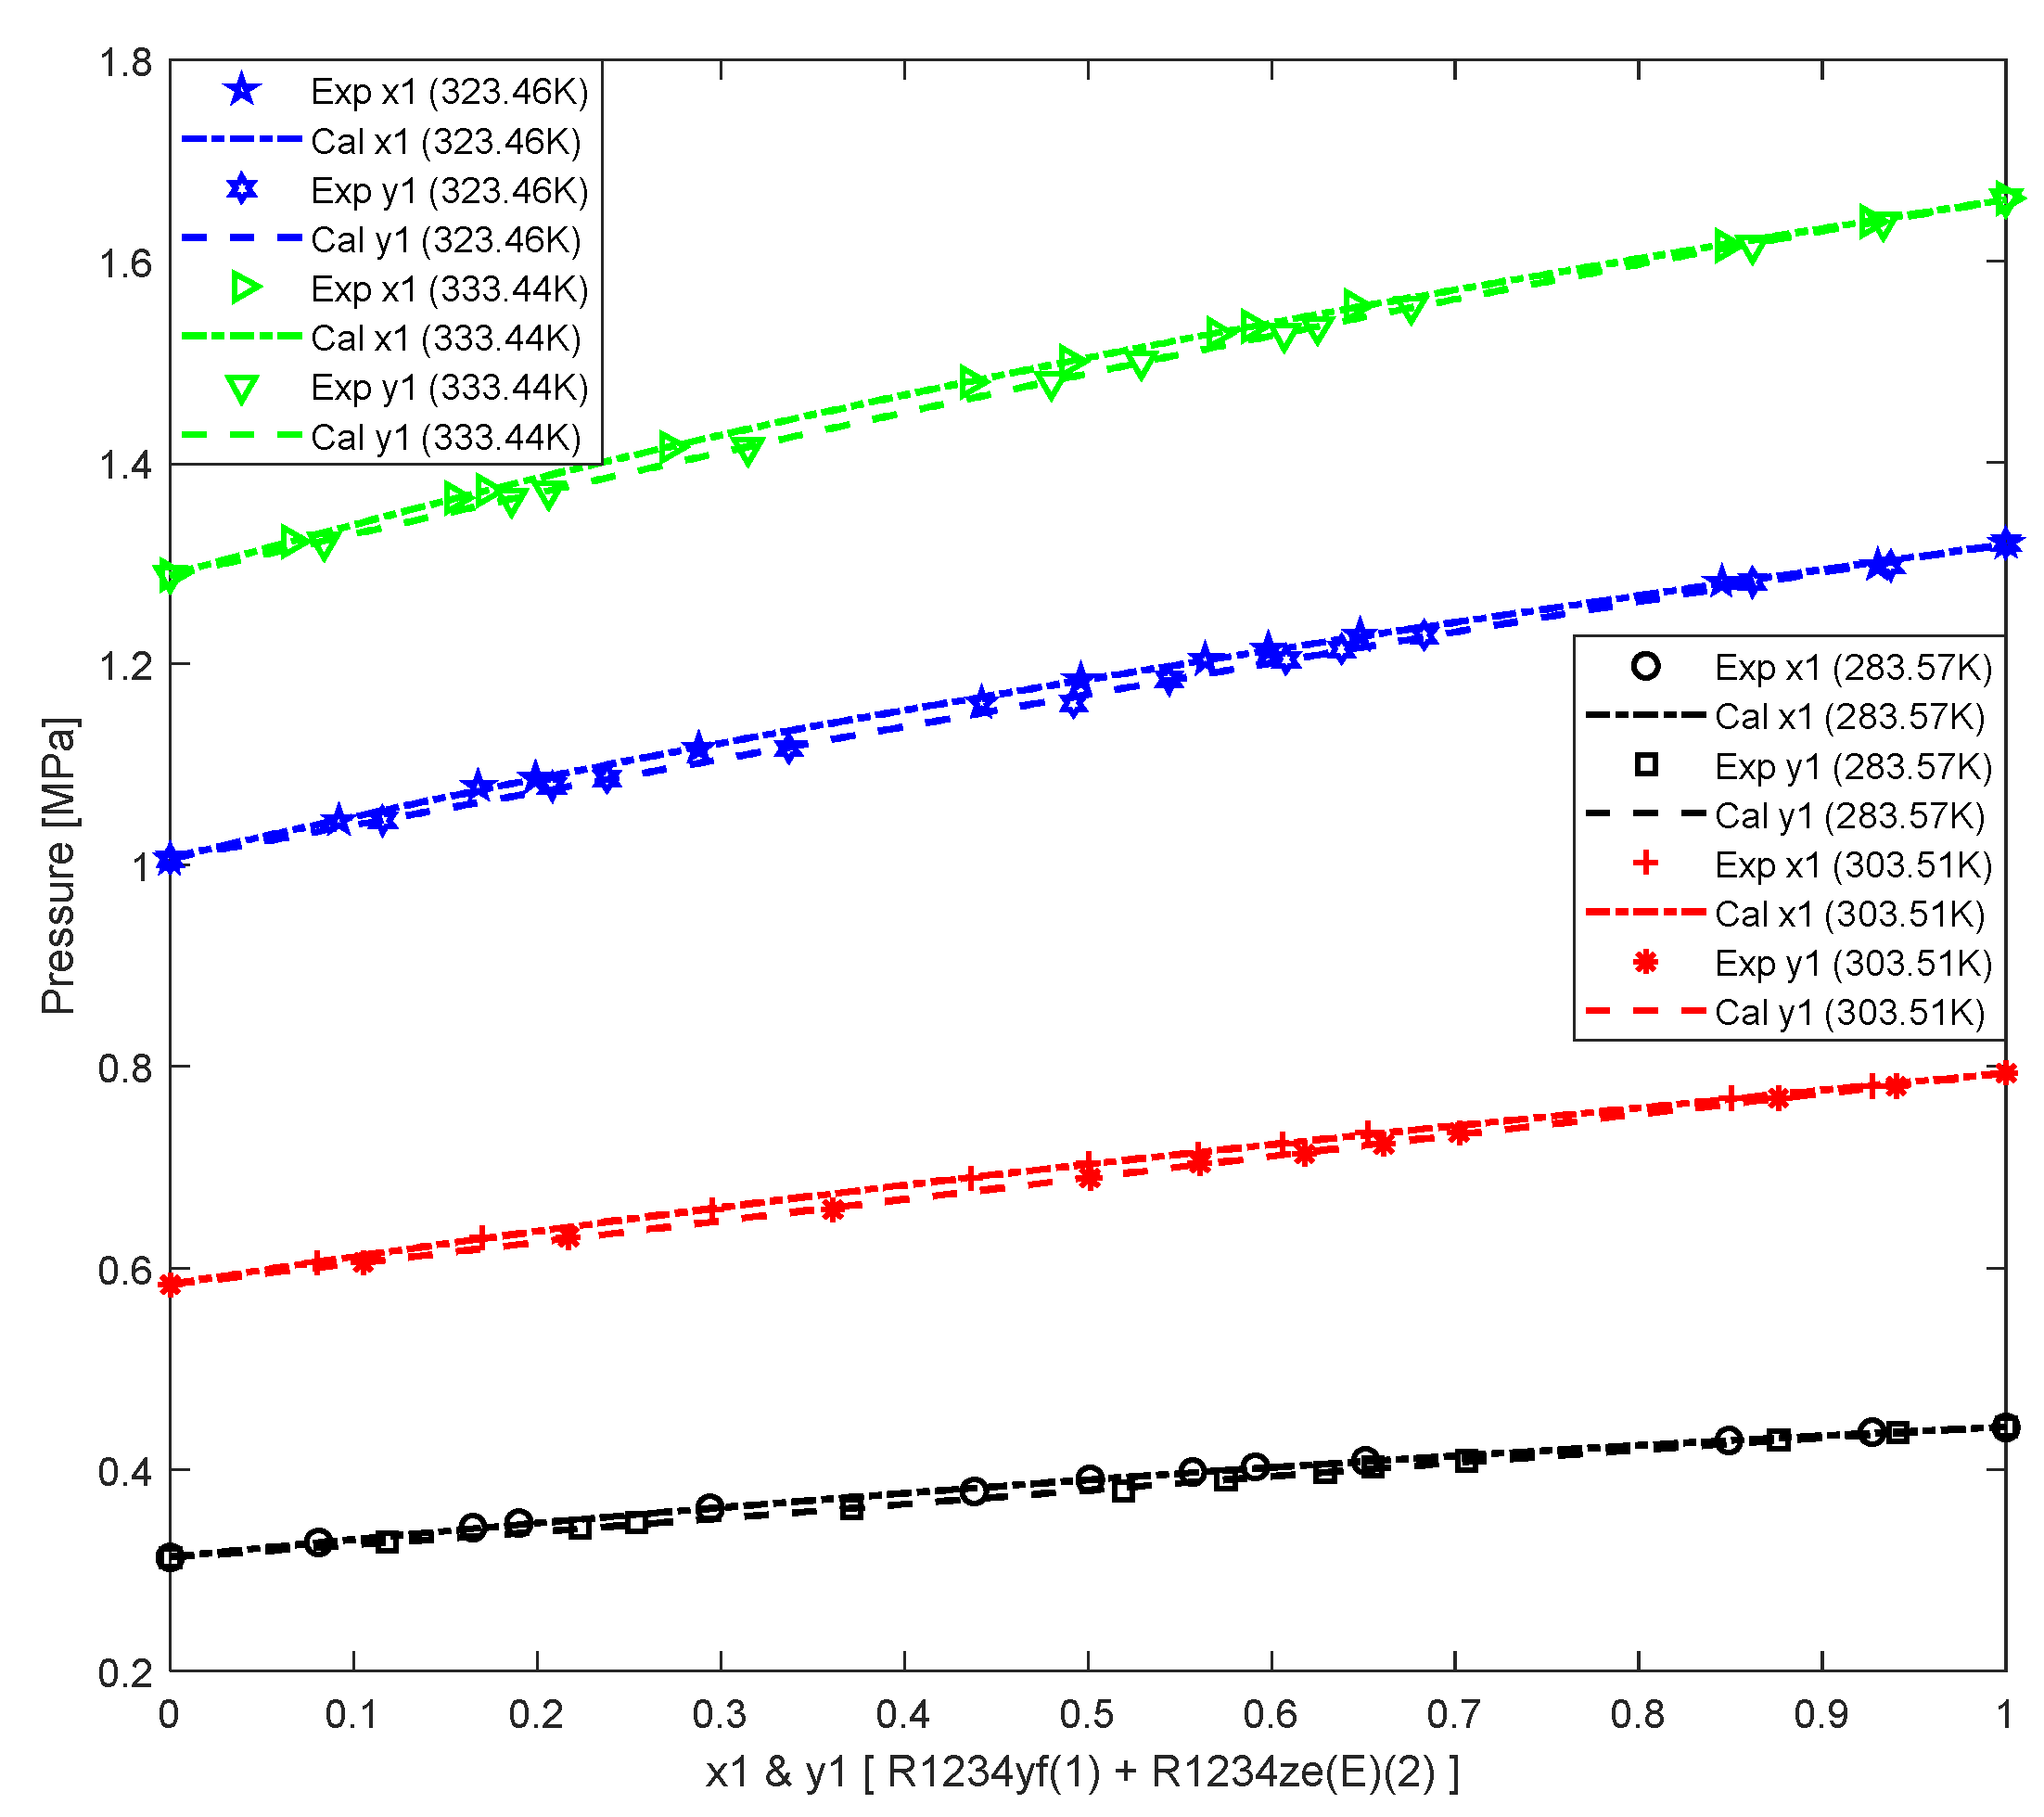
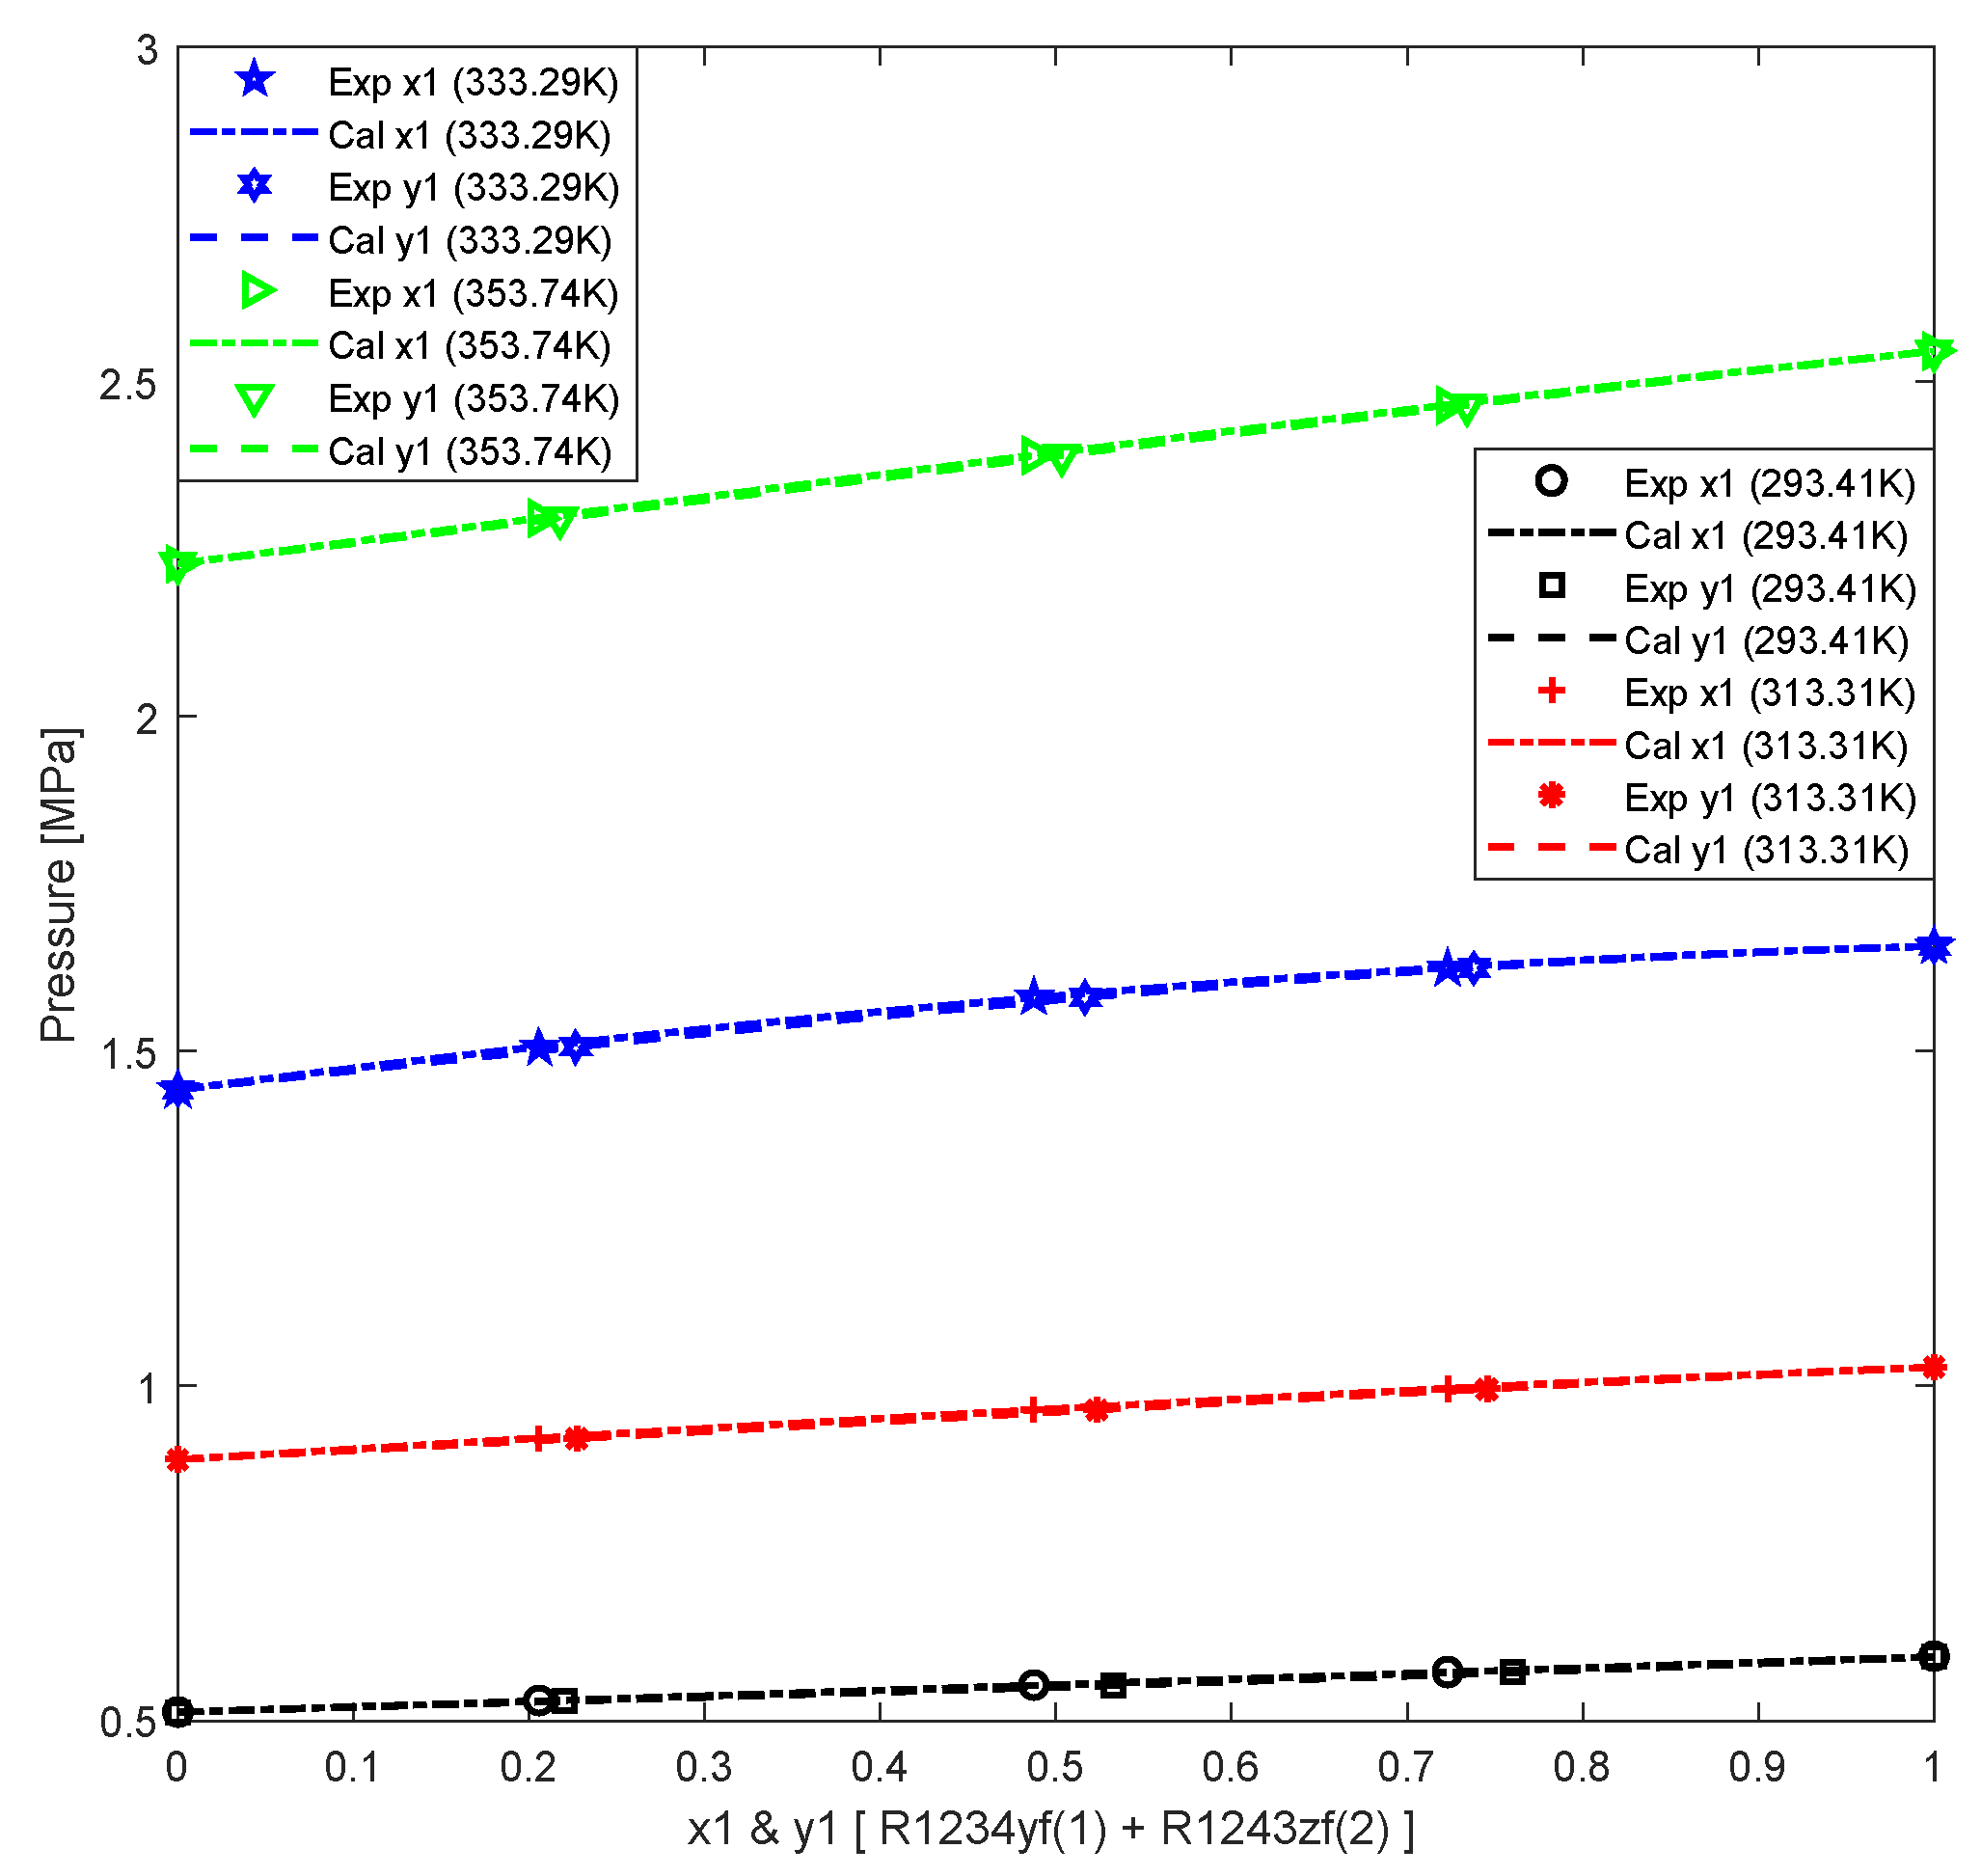
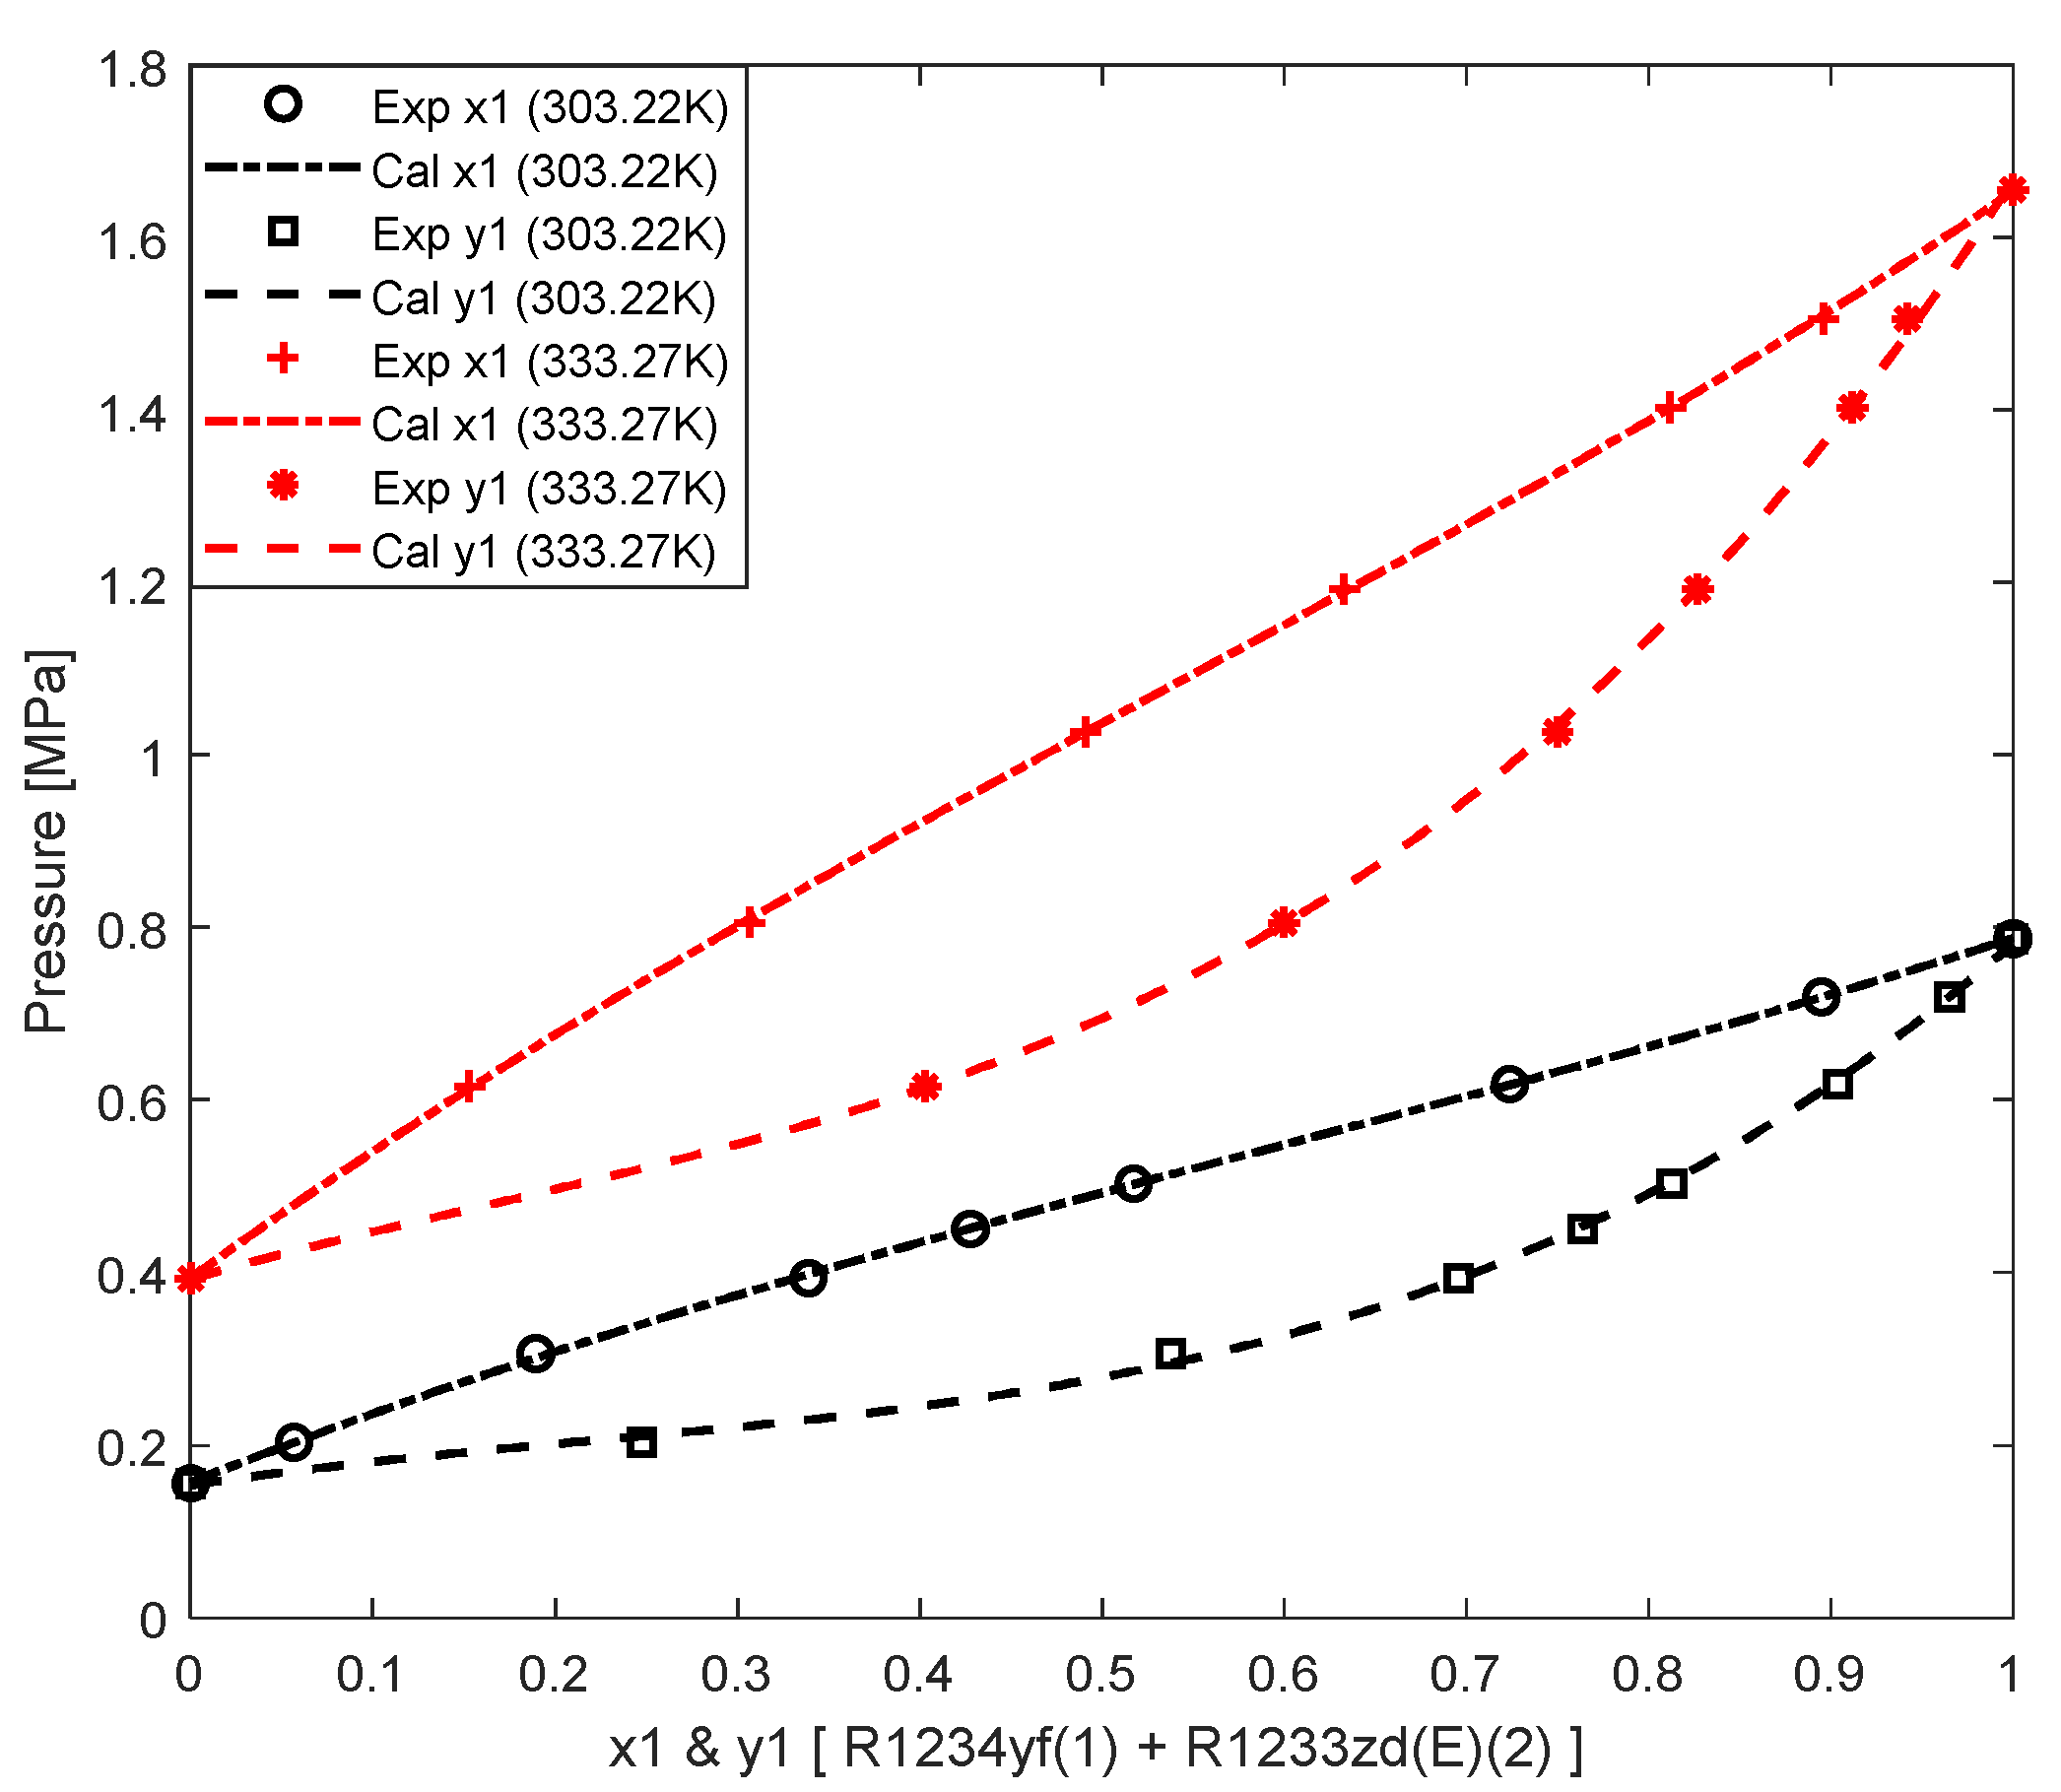
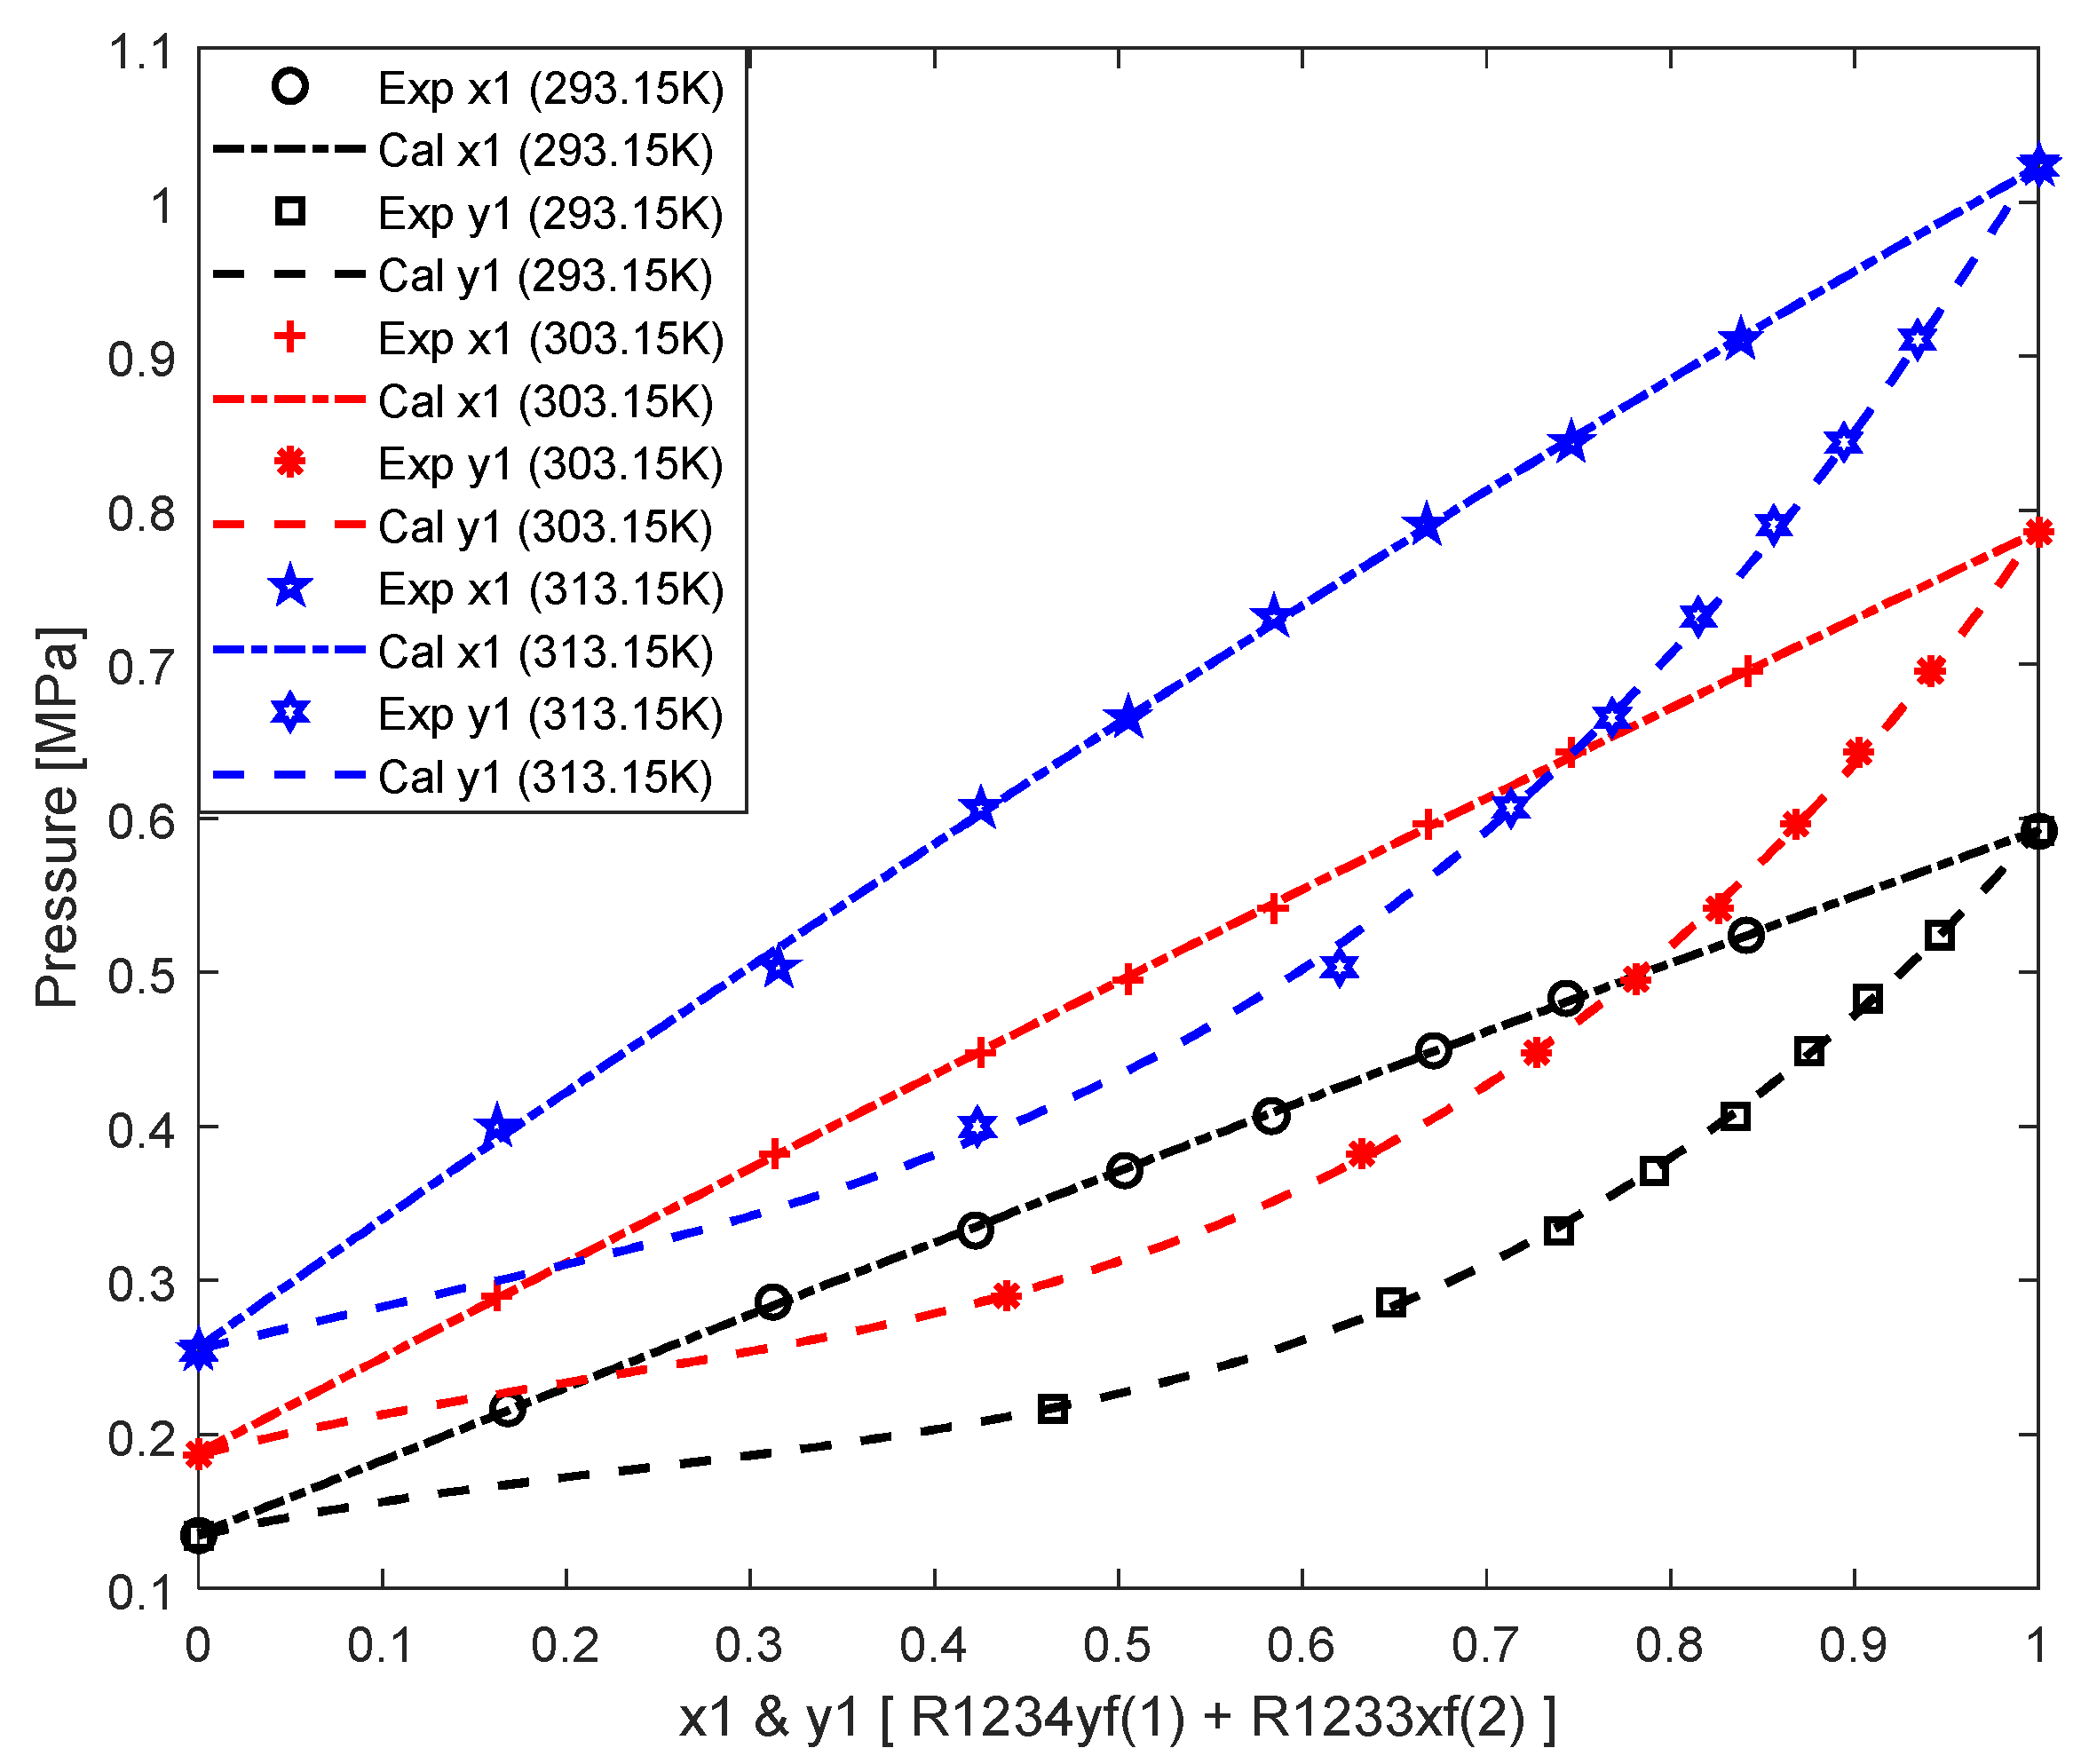
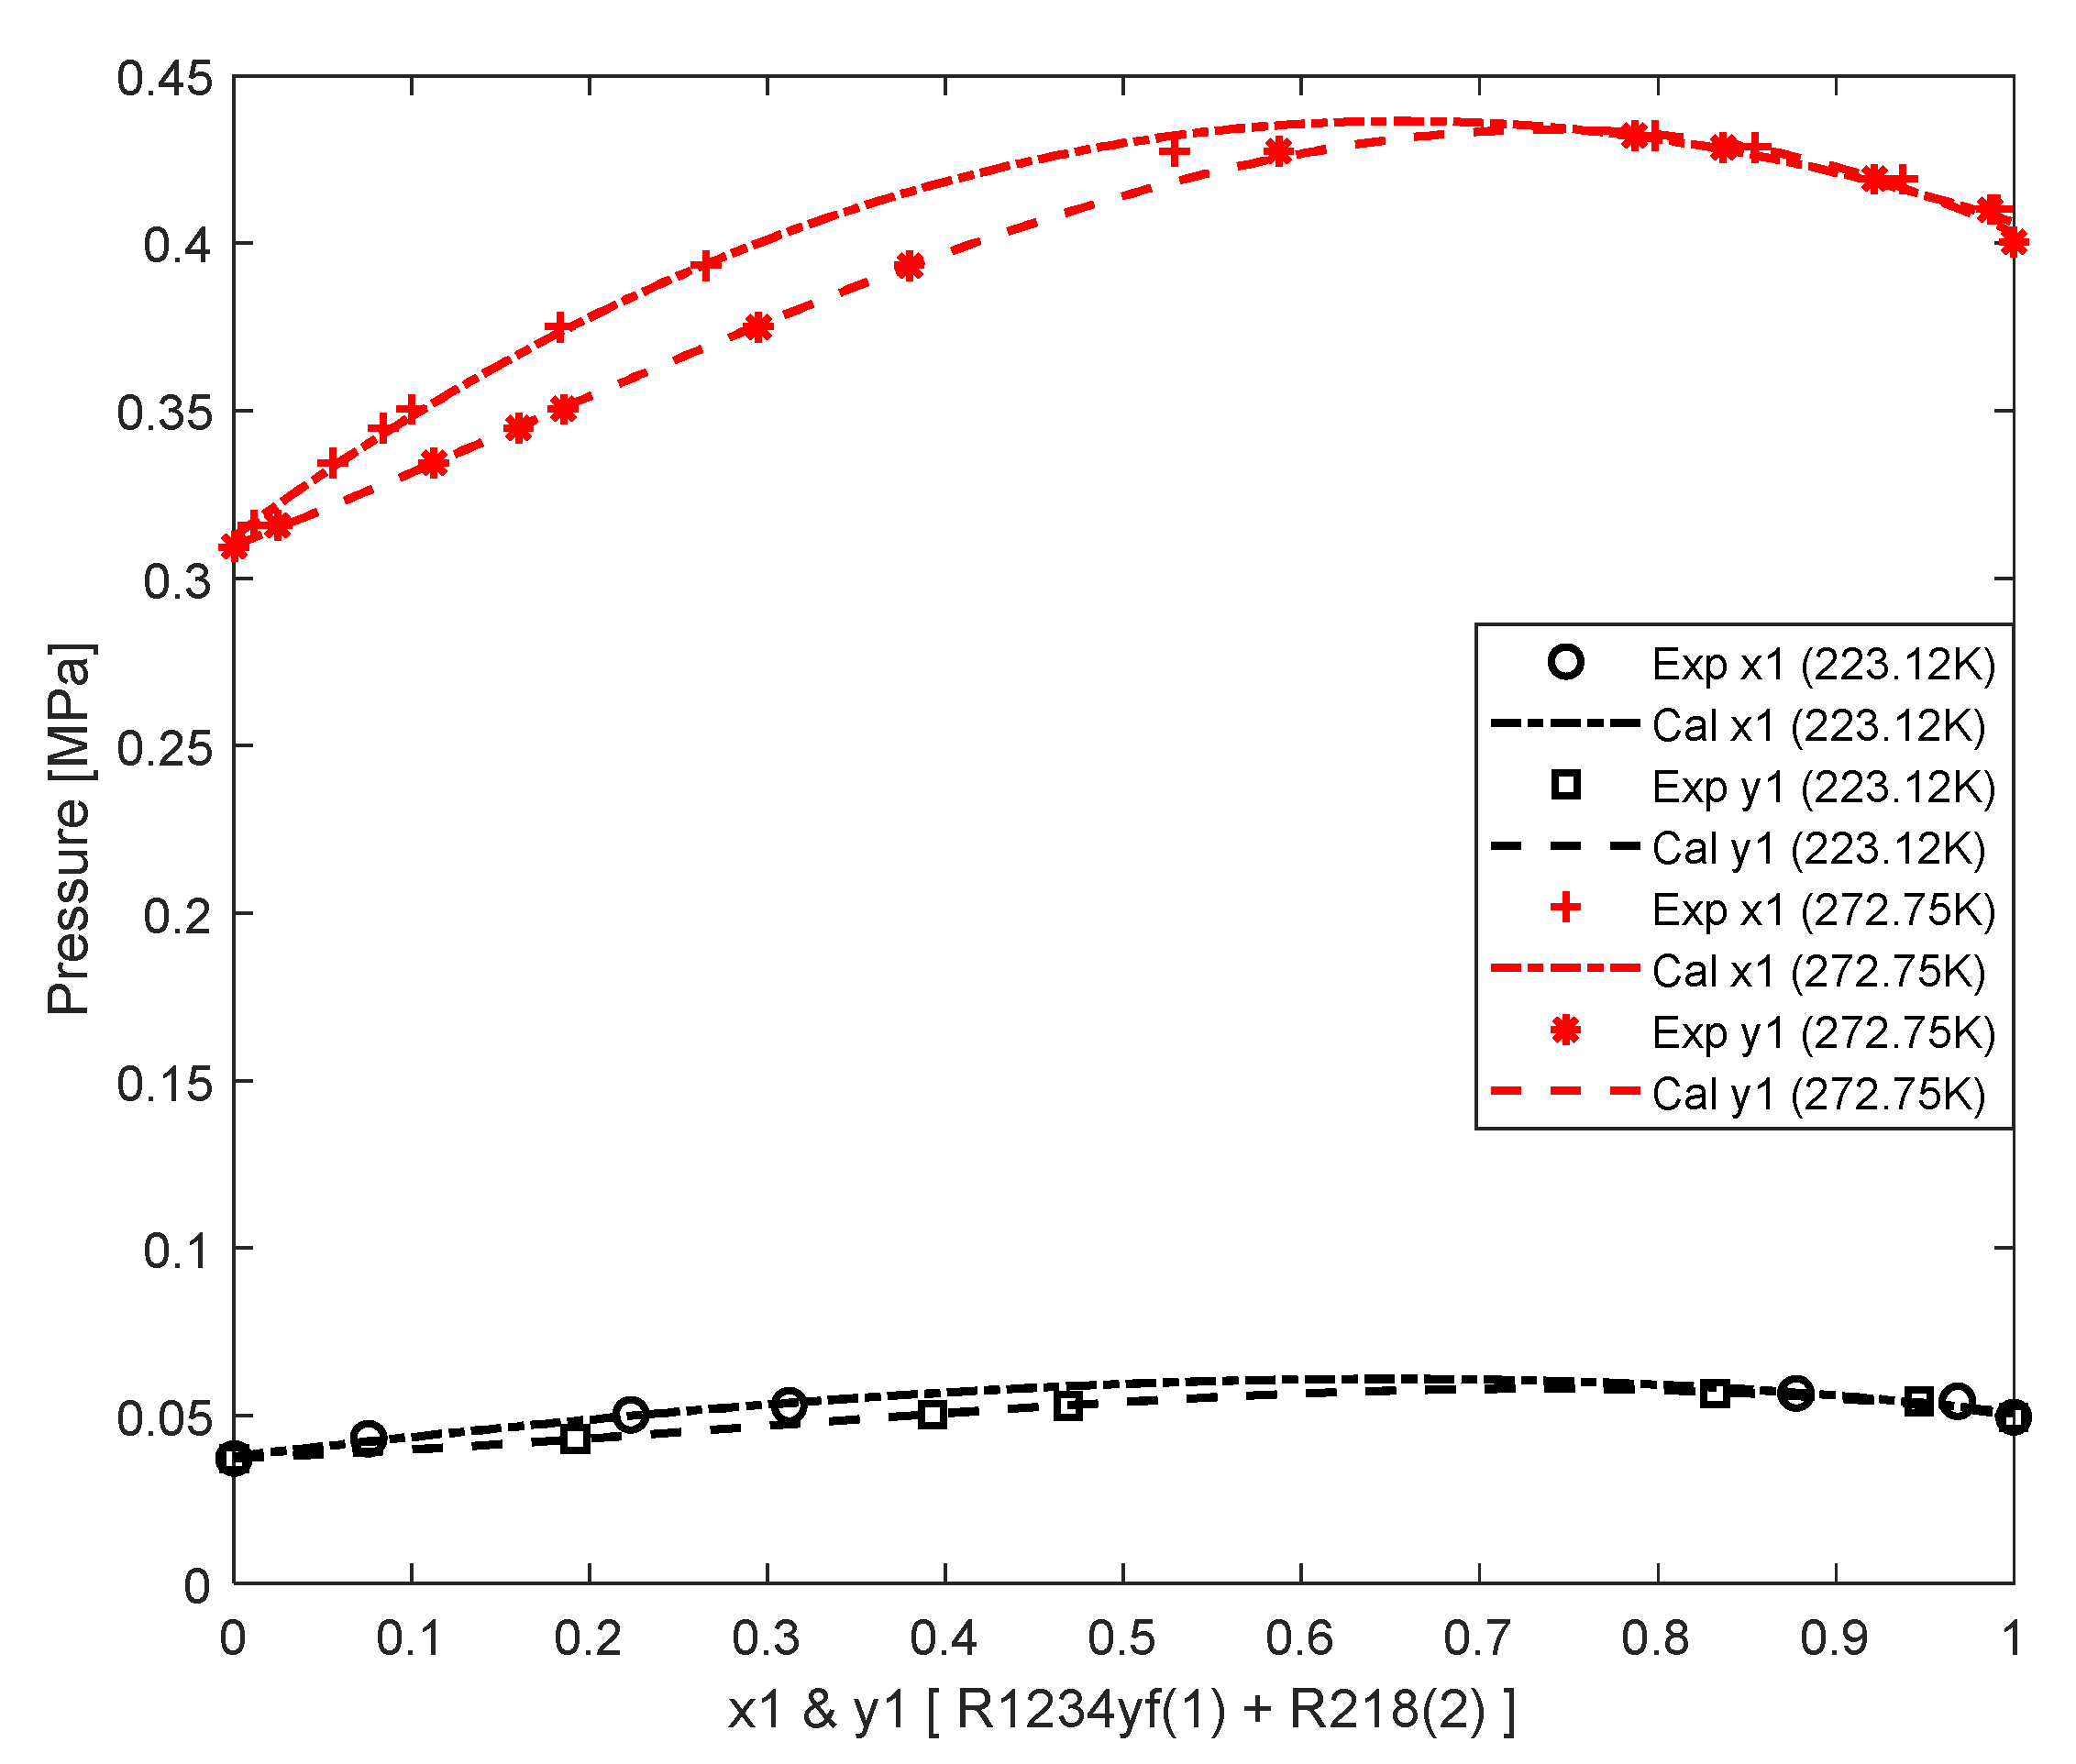
3.2. Binary Refrigerant Mixtures

Some thermodynamic properties (such as enthalpy and entropy) can be obtained from VLE based on the universal thermodynamic relationship. VLE prediction is crucial for designing and improving thermal cycles, and VLE prediction can also guide experimental research.
During a specific pressure phase transition process, the temperature slip of the azeotropic point is zero, and the composition of both the vapor and liquid phases remains constant. Near-azeotropic refrigerant mixtures refer to non-azeotropic mixtures with similar bubble point lines and dew point lines (typically, temperature differences are less than 3.0K). The phase transition of non-azeotropic mixtures exhibits significant temperature slips and is widely used in matching variable temperature heat sources to achieve energy conservation.
From the point of view of the microscopic mechanism, the azeotropic point in one binary refrigerant mixture is mainly determined by the chemical properties and interactions of the components. If the two pure refrigerants’ chemical properties and the molecule interactions are similar, an azeotropic mixture may be formed in a particular concertation situation [62,63,64,65]. On the contrary, if the two components’ chemical properties and molecular interactions are significantly different, forming a zeotropic or near-azeotropic system is not easy.
The difference in saturated pressure between the two pure components is also a key factor affecting the formation of the zeotropic point. If the pressure difference is significant, then during the boiling process of the binary mixture, the more volatile components will spill out faster causing changes in the composition structure of the mixture, and thus are unable to form an azeotropic point [64,65].
A tangent point exists between the bubble and dew points in both P-x-y (pressure–mole fraction diagram) and T-x-y (temperature–mole fraction diagram) diagrams of azeotropic systems. The bubble and dew lines are close in both P-x-y and T-x-y diagrams of near-azeotropic systems. Due to the limit of experimental data at specific temperatures, the results are all displayed as P-x-y diagrams. However, the azeotropic and near-azeotropic characteristics can also be displayed. The processes for identifying azeotropic, near-azeotropic, and non-azeotropic are as follows: first obtain the CPA parameters from experimental data, and then calculate the bubble point and dew point under specific pressures.
It can be seen from Table 3 that the temperature ranges of VLE data are far from the critical point of pure refrigerants. The calculated results (mole fraction of R1234yf in liquid and vapor phases) agree well with the experimental data. Moreover, the calculation performances of the liquid phase are better than those of the vapor phase. Due to the relatively narrow temperature ranges of the VLE data, the temperature dependence of binary interaction parameters is not considered. The absolute values of the binary interaction parameters are all small and have no regularity.
The results in Table 3 show that the calculation results of the liquid-phase composition are significantly better than those of the vapor-phase composition, which is consistent with the density calculation performance of pure components. Figure 6, Figure 7, Figure 8, Figure 9, Figure 10, Figure 11, Figure 12, Figure 13, Figure 14 and Figure 15 are the calculation details of the binary refrigerant mixtures.
Figure 6. Calculation performance of VLE for R1234yf(1) + R600(2) system.
Sustainability 15 14482 g006
For the R1234yf + R600 system, the calculation performance of the liquid-phase composition is slightly worse than that of the vapor phase. Due to the increasing gap between the saturated vapor pressures of R1234yf and R600, the P-x-y phase envelope becomes steeper with increasing temperature. As the temperature decreases, the P-x-y phase envelope becomes narrower, and this is because the gap between the saturated vapor pressures of R1234yf and R600 increases with increasing temperature. In other words, as the temperature increases, the pressure differences between the bubble point lines and the dew point lines increase. The azeotropic phenomenon can be observed at high R1234yf concentrations in all four temperature situations. That is to say, there is a significant difference in vapor–liquid compositions, resulting in a relatively large slip temperature.
There is a significant difference in the molecular structures between R1234yf and R600. R1234yf is a halogenated component of propylene. It contains three carbon atoms and four fluorine atoms, while R600 is a hydrocarbon containing four carbon atoms.
The difference in molecular structures leads to the difference in properties between the two pure refrigerants. The significant difference in properties results in significant deviations between the vapor phase lines and the liquid phase lines, which means a relatively large slip temperature.
Figure 7. Calculation performance of VLE for R1234yf(1) + R600a(2) system.
Sustainability 15 14482 g007
Similar to R600a, R600 is also a hydrocarbon containing four carbon atoms. Due to the similar properties between R600a and R600, the shape and trend of the P-x-y phase envelopes of R1234yf + R600a system are similar to those of R1234yf + R600 system. At a specific temperature, the P-x-y phase envelopes of R1234yf + R600a are narrower than that of R1234yf + R600 system. The calculation performance of R1234yf + R600a are also slightly better than that of R1234yf + R600 system. The differences between the bubble point lines and the dew point lines increase with the temperature increasing. It can be seen that within the non-azeotropic region (low R1234yf concentration region), there are significant differences between the dew point lines and the bubble point lines, indicating that there are significant differences in the vapor–liquid compositions, resulting in a relatively large slip temperature.
Figure 8. Calculation performance of VLE for R1234yf(1) + R245c(2) system.
Sustainability 15 14482 g008
Since the saturated vapor pressures of R245cb are close to those of R1234yf, the P-x-y phase envelopes of R1234yf + R245c are narrow, and there will be a relatively small slip temperature at any ratio. The bubble point lines are very close to the dew point lines. Although the phase envelopes are narrow, it can still be seen that the phase envelope becomes narrower as the temperature decreases. No azeotropic phenomena can be observed in the studied temperature situations.
Figure 9. Calculation performance of VLE for R1234yf(1) + R1123(2) system.
Sustainability 15 14482 g009
Although R1123 contains propylene halides with three carbon atoms and four fluorine atoms, there is a significant difference in the critical temperature and standard boiling point between R1234yf and R1123; R1123 has higher saturated pressure. the P-x-y phase envelope of R1234yf + R1123 system presents a downward trend. That is to say, at the same pressure, the higher the temperature, the higher the concentration of R1234yf. At the same temperature and pressure, the concentration of R1234yf in the liquid phase is higher than that in the vapor phase. It can be seen that there are significant differences between the dew point lines and the bubble point lines of the R1234yf + R1123 system. The pressure difference between the bubble and dew point lines increases as the temperature increases. The significant differences in vapor–liquid compositions indicate a relatively large slip temperature. In the three studied temperature situations, no azeotropic phenomenon is observed.
Figure 10. Calculation performance of VLE for R1234yf(1) + R1234ze(E) system.
Sustainability 15 14482 g010
R1234yf and R1234ze(E) are isomers, with one carbon atom at their edge replaced by three fluorine atoms. The main difference between the molecules is that the fluorine atom of R1234yf is located on the middle carbon atom; in contrast, the fluorine atom of R1234ze is located on the other edge of the carbon atom. The similarity in molecular structure leads to the similarity of thermodynamic properties. The phase envelopes of R1234yf + R1234ze(E) are similar to those of R1234yf + R245cb, and the mole fractions of R1234yf and R1234ze(E) are also relatively close in both liquid and vapor phases. Moreover, the concentrations of R1234yf in the vapor phase are higher than those in the liquid phase. The dew point lines and bubble point lines of the R1234yf + R1234ze system are close, indicating that there will be a relatively small slip temperature at any ratio.
Figure 11. Calculation performance of VLE for R1234yf(1) + R1243zf(2) system.
Sustainability 15 14482 g011
R1243zf and R1234yf belong to the HFOs and have similar standard boiling points but are affected by the small F/H ratio. The saturated vapor pressures of R1234yf and R1243zf are very close. From the experimental data and calculated results, there is almost no difference between the bubble point lines and dew point lines, and this is also because the vapor pressures of R1234yf and R1243zf are close; thus, there will be a relatively small slip temperature at any ratio.
R1234yf + R1243zf can be considered a near-azeotropic system. In this binary refrigerant mixture, the phase equilibrium envelopes are more like a straight line, and as the temperature increases, the absolute value of the slope of the straight line increases.
Figure 12. Calculation performance of VLE for R1234yf(1) + R1233zd(E)(2) system.
Sustainability 15 14482 g012
R1233zd(E) significantly differs in critical temperature to R1234yf, resulting in significant deviations of the dew point lines from the bubble point lines.
Figure 13. Calculation performance of VLE for R1234yf(1) + R1233xf(2) system.
Sustainability 15 14482 g013
There is a significant difference in critical temperature between R1234yf and R1233xf. The shapes and trends of the P-x-y phase envelopes displayed in the two binary refrigerant mixtures are similar. The upward trend of P-x-y phase envelopes is because R1233zd(E) and R1233xf have significantly different saturated vapor pressures to those of R1234yf. Significant differences in compositions imply larger slip temperatures. As the temperature increases, the pressure difference between the bubble and dew point lines increases significantly. No azeotropic phenomena can be observed in the R1234yf + R1233xf system.
Figure 14. Calculation performance of VLE for R1234yf(1) + R218(2) system.
Sustainability 15 14482 g014
For the calculation results of R1234yf + R218, at high temperatures, the gaps between the dew point lines and bubble point lines are more significant than those at low temperatures. Azeotropic phenomena are observed at high R1234yf concentrations at both temperatures.
Figure 15. Calculation performance of VLE for R1234yf(1) + R1216(2) system.
Sustainability 15 14482 g015
The calculation results of the R1234yf + R1216 system are similar to those of the R1234yf + R1243zf system; both systems have near-azeotropic behaviors, and the dew point and bubble point lines almost overlap, indicating that the concentration difference between the vapor phase and liquid phase is slight, so there will be relatively small slip temperatures at any ratio. The saturated vapor pressures of R1216 are slightly higher than those of R1234yf, so the P-x-y phase envelopes are downward. Like the above systems, the lower the temperature, the more the phase equilibrium envelope resembles a straight line.
From the above figures, it can be seen that the phase behaviors of various binary refrigerant mixtures are different. Some binary refrigerant mixtures do not have azeotropic points, while some have near-azeotropic behaviors due to similar physical and chemical properties.
Like other mixtures, refrigerant mixtures have average properties, similar to pure refrigerants. The properties of refrigerant mixtures can be utilized to achieve complementary advantages of various pure refrigerants. Forming refrigerant mixtures provides greater freedom to regulate the properties of refrigerants and expand the selection of refrigerants. For different thermodynamic systems, appropriate refrigerant mixtures should be selected based on the system’s requirements and the refrigerant mixtures’ characteristics.
The molecular structures of R1234yf, R1216, R1243zf, and R1234ze(E) are similar; they are all halogenated propylene components, and their properties have no significant difference. According to Table 1, the critical properties and other physical properties of these four pure refrigerants are relatively similar, especially between R1216 and R1234yf. Therefore, among the three binary systems (R1234yf + R1216, R1234yf + R1243zf, and R1234yf + R1234ze(E)), the bubble and dew point lines are very close over the entire concentration range. In these three near-azeotropic systems, similar interactions between molecules, including evaporation–condensation equilibrium and particular interphase interactions, cause the components to have similar energy changes during the phase change process, thus exhibiting similar boiling points. These three working fluids in the thermal cycles can be approximated as pure refringent analysis within a more extensive range.
Weak hydrogen-bonding associations exist in HFCs and HFOs containing C-H and C-F covalent bonds [30,66]. Considering the hydrogen-bonding associations in HFCs and HFOs is expected to improve the representation in the high-density region [28]. The stretching vibration of the C-H bond involves the hydrogen atom briefly shifting from its position within the molecular group, and returning to its original location during molecular motion. When hydrogen-bonding associations are present, molecules demand more energy for vibration, resulting in a reduced vibrational frequency. In essence, these hydrogen-bonding associations hinder the relative motion of atoms, leading to a lower vibrational frequency [29,66]. The changes in molecular structure will inevitably affect the macroscopic thermodynamic properties. Therefore, the calculation accuracy of the original cubic EoS could be improved by considering the hydrogen-bonding associations.
It can be concluded that CPA considers the hydrogen-bonding associations and can provide accurate VLE performance for pure refrigerants and binary refringent mixtures over a wide temperature range.

4. Conclusions

This work calculates the saturated vapor pressure and saturated density of nine pure refrigerants using CPA with a two-site association scheme. CPA gives good agreements with experimental data. However, the prediction ability for the region very close to the critical point needs to be improved. Based on the fitted pure-refrigerant parameters, the VLE of ten binary refrigerant mixtures is calculated using CPA with van der Waals mixing rules. It can be concluded that CPA can accurately predict the VLE of binary refringent mixtures over wide temperature ranges with a temperature-independent binary interaction parameter. The VLE and azeotropic behaviors of different binary refrigerant mixtures are different; analyzing refrigerants from the microstructure can help us to understand phase behaviors and calculation results. In order to improve the physical meaning, scope of application, and calculation accuracy of calculation work, more in-depth mechanism studies may be required.

Author Contributions

L.S.: Conceptualization, methodology, writing—original draft, data curation. J.L.: Conceptualization, methodology, writing—review and editing. T.Z.: Conceptualization, methodology, writing—review and editing, supervision. All authors have read and agreed to the published version of the manuscript.

Funding

The authors acknowledge support from the College of Mechanical and Electrical Engineering, Hohai University. This work is supported by “the Fundamental Research Funds for the Central Universities” (Hohai University, Grant No. B210201039), the Applied Basic Research Program of Changzhou (Grant No. CJ20210057), and the International Science and Technology Cooperation Research Funds of Changzhou (Grant No. CZ20230021).

Institutional Review Board Statement

Not applicable.

Informed Consent Statement

Not applicable.

Data Availability Statement

The experimental data used in this article are all from publicly published articles, and the titles of these articles are indicated in the text.

Conflicts of Interest

The authors declare no conflict of interest.

Abbreviations

List of Abbreviations
HChydrocarbon
HFChydrofluorocarbon
HFOhydrofluoroolefin
HCFOhydrochlorofluoroolefin
PFCperfluorocarbon
PFOperfluoroolefin
R600n-Butane
R600aiso-butane
R245cb1,1,1,2,2-pentafluoropropane
R1123Trifluoroethene
R1234ze(E)trans-1,3,3,3-tetrafluoropropene
R1243zf3,3,3- Trifluoropropene
R1234yf2,3,3,3-tetrafluoroprop-1-ene
R1233zd(E)trans-1-chloro-3,3,3-trifluoropropene
R1233xf2-chloro-3,3,3-trifluoropropene
R218Octafluoropropane
R12161,1,2,3,3,3-hexafluoro-1-propene
GWPGlobal Warming Potential
ODPOzone Depletion Potential
VLEVapor–Liquid Equilibrium
EoSEquation of State
PRPeng–Robinson
SAFTStatistical Associating Fluid Theory
SRK Soave–Redlich–Kwong
CPACubic-Plus-Association
ARDAverage Relative Deviations
List of Symbols
x i Mole fraction of component i in liquid phase
y i Mole fraction of component i in vapor phase
j i Mole fraction of component i
n total number of moles
Runiversal gas constant
v molar volume
a Soave–Redlich–Kwong temperature-dependent energy parameter
b CPA co-volume
c 1 pure component temperature dependence parameter
k i j binary interaction parameter
N p the number of data points
P pressure
P C critical pressure
P s a t saturated pressure
T temperature
T C critical temperature
T r reduced temperature
T s a t saturated temperature
ρ density
T r a n g e range of temperature
P r a n g e range of pressure
ω acentric factor
A S R K residual Helmholtz energy contribution for the cubic Soave–Redlich–Kwong EoS
A A S S O C residual Helmholtz energy contribution for association
β A i B j association volume between site A on molecule i and site B on molecule j
A i B j association strength (equilibrium constant) betweensite A on molecule i and site B on molecule j
ε A i B j association energy between site A on molecule i and site B on molecule j
g radial distribution
η packing fraction
k B Boltzmann constant

References

  1. Mota-Babiloni, A.; Navarro-Esbrí, J.; Barragán, Á.; Molés, F.; Peris, B. Drop-in energy performance evaluation of R1234yf and R1234ze(E) in a vapor compression system as R134a replacements. Appl. Therm. Eng. 2014, 71, 259–265. [Google Scholar] [CrossRef]
  2. Schilling, J.; Eichler, K.; Pischinger, S.; Bardow, A. Integrated design of ORC process and working fluid for transient waste-heat recovery from heavy-duty vehicles. Comput. Aided Chem. Eng. 2018, 44, 2443–2448. [Google Scholar]
  3. Gautam, K.R.; Andresen, G.B.; Victoria, M. Review and techno-economic analysis of emerging thermo-mechanical energy storage technologies. Energies 2022, 15, 6328. [Google Scholar] [CrossRef]
  4. Li, F.; Huang, X.; Li, Y.; Lu, L.; Meng, X.; Yang, X.; Sundén, B. Application and analysis of flip mechanism in the melting process of a triplex-tube latent heat energy storage unit. Energy Rep. 2023, 9, 3989–4004. [Google Scholar] [CrossRef]
  5. Zhang, G.; Xiao, H.; Zhang, P.; Wang, B.; Li, X.; Shi, W.; Cao, Y. Review on recent developments of variable refrigerant flow systems since 2015. Energy Build. 2019, 198, 444–466. [Google Scholar] [CrossRef]
  6. Mohanraj, M.; Abraham, J.A.P. Environment friendly refrigerant options for automobile air conditioners: A review. J. Therm. Anal. Calorim. 2020, 147, 47–72. [Google Scholar] [CrossRef]
  7. Calm, J.M. The next generation of refrigerants–Historical review, considerations, and outlook. Int. J. Refrig. 2008, 31, 1123–1133. [Google Scholar] [CrossRef]
  8. Shah, S.S.; Shaikh, M.N.; Khan, M.Y.; Alfasane, M.A.; Rahman, M.M.; Aziz, M.A. Present status and future prospects of jute in nanotechnology: A review. Chem. Rec. 2021, 21, 1631–1665. [Google Scholar] [CrossRef]
  9. Tanaka, K.; Higashi, Y. Thermodynamic properties of HFO-1234yf (2,3,3,3-tetrafluoropropene). Int. J. Refrig. 2010, 33, 474–479. [Google Scholar] [CrossRef]
  10. Li, Y.; Yang, J.; Wu, X.; Liu, Y.; Zhuang, Y.; Zhou, P.; Han, X.; Chen, G. Leakage, diffusion and distribution characteristics of refrigerant in a limited space: A comprehensive review. Therm. Sci. Eng. Prog. 2023, 40, 101731. [Google Scholar] [CrossRef]
  11. Valtz, A.; El Abbadi, J.; Coquelet, C.; Houriez, C. Experimental measurements and modelling of vapour-liquid equilibrium of 2,3,3,3-tetrafluoropropene (R1234yf)+1,1,1,2,2-pentafluoropropane (R245cb) system. Int. J. Refrig. 2019, 107, 315–325. [Google Scholar] [CrossRef]
  12. Ye, G.; Fang, Y.; Guo, Z.; Ni, H.; Zhuang, Y.; Han, X.; Chen, G. Experimental Investigation of Vapor–Liquid Equilibrium for 2,3,3,3-Tetrafluoropropene (HFO-1234yf) + trans-1,3,3,3-Tetrafluoropropene (HFO-1234ze(E)) at Temperatures from 284 to 334 K. J. Chem. Eng. Data 2021, 66, 1741–1753. [Google Scholar] [CrossRef]
  13. Zhong, Q.; Dong, X.; Zhang, H.; Li, H.; Gong, M.; Shen, J.; Wu, J. Experimental study on the gaseous pρTx properties for (HFO1234yf+HC290). J. Chem. Thermodyn. 2017, 107, 126–132. [Google Scholar] [CrossRef]
  14. Yao, X.; Ding, L.; Dong, X.; Zhao, Y.; Wang, X.; Shen, J.; Gong, M. Experimental measurement of vapor-liquid equilibrium for 3,3,3-trifluoropropene (R1243zf) + 1,1,1,2-tetrafluoroethane (R134a) at temperatures from 243.150 to 293.150 K. Int. J. Refrig. 2020, 120, 97–103. [Google Scholar] [CrossRef]
  15. Higashi, Y.; Akasaka, R. Measurements of thermodynamic properties for R1123 and R1123+R32 mixture. In Proceedings of the International Refrigeration and Air Conditioning Conference, West Lafayette, IN, USA, 11–14 July 2016; p. 1688. [Google Scholar]
  16. Miyamoto, H.; Nishida, M.; Saito, T. Measurement of the vapour–liquid equilibrium properties of binary mixtures of the low-GWP refrigerants R1123 and R1234yf. J. Chem. Thermodyn. 2021, 158, 106456. [Google Scholar] [CrossRef]
  17. Hu, P.; Chen, L.; Chen, Z. Vapor–liquid equilibria for binary system of 2,3,3,3-tetrafluoroprop-1-ene (HFO-1234yf) + isobutane (HC-600a). Fluid Phase Equilib. 2014, 365, 1–4. [Google Scholar] [CrossRef]
  18. Hu, X.; Yang, T.; Meng, X.; Bi, S.; Wu, J. Vapor liquid equilibrium measurements for difluoromethane (R32)+2,3,3,3-tetrafluoroprop-1-ene (R1234yf) and fluoroethane (R161)+2,3,3,3-tetrafluoroprop-1-ene (R1234yf). Fluid Phase Equilib. 2017, 438, 10–17. [Google Scholar] [CrossRef]
  19. Yang, Z.; Valtz, A.; Coquelet, C.; Wu, J.; Lu, J. Critical properties and vapor-liquid equilibrium of two near-azeotropic mixtures containing HFOs. Int. J. Refrig. 2022, 138, 133–147. [Google Scholar] [CrossRef]
  20. Peng, S.; Wang, E.; Yang, Z.; Duan, Y. Vapor-liquid equilibrium measurements for the binary mixtures of 1, 1-difluoroethane (R152a) with trans-1,3,3,3-tetrafluoropropene (R1234ze(E)) and 3,3,3-trifluoropropene (R1243zf). Fluid Phase Equilib. 2022, 558, 113470. [Google Scholar] [CrossRef]
  21. Llovell Ferret, F.L.; Albà, C.G.; Vega, L.F. A consistent thermodynamic molecular model of n-hydrofluoroolefins and blends for refrigeration applications. Int. J. Refrig. 2020, 113, 145–155. [Google Scholar]
  22. Chen, L.; Hu, P.; Zhu, W.; Jia, L.; Chen, Z. Vapor–liquid equilibria of fluoroethane (HFC-161)+2,3,3,3-tetrafluoroprop-1-ene (HFO-1234yf). Fluid Phase Equilib. 2015, 392, 19–23. [Google Scholar] [CrossRef]
  23. Li, X.; Pang, Q.; Liu, J.; Ning, Q.; He, G. Phase equilibrium for the binary mixture of 1,1,2,3,3,3-hexafluoro-1-propene (R1216)+propane (R290) at temperatures from 283.15 to 313.15 K. J. Chem. Thermodyn. 2022, 167, 106717. [Google Scholar] [CrossRef]
  24. Matsuda, H.; Suga, T.; Tsuji, T.; Tochigi, K.; Kurihara, K.; Nelson, A.K.; McCabe, C. Vapor-liquid equilibria for binary systems carbon dioxide + 1,1,1,2,3,3-hexafluoro-3-(2,2,2-trifluoroethoxy) propane or 1-ethoxy-1,1,2,2,3,3,4,4,4-nonafluorobutane at 303.15–323.15 K. Fluid Phase Equilib. 2020, 524, 112814. [Google Scholar] [CrossRef]
  25. Paricaud, P. Multipolar SAFT-VR Mie Equation of State: Predictions of Phase Equilibria in Refrigerant Systems with No Binary Interaction Parameter. J. Phys. Chem. B 2023, 127, 3052–3070. [Google Scholar] [CrossRef]
  26. Tapiero, D.; Tzabar, N. Vapor-liquid equilibrium of light hydrocarbon multicomponent systems by solving the Rachford-Rice equation. Cryogenics 2023, 129, 103600. [Google Scholar] [CrossRef]
  27. Di Nicola, G.; Di Nicola, C.; Arteconi, A.; Stryjek, R. PVTx measurements of the carbon dioxide + 2,3,3,3-Tetrafluoroprop-1-ene binary system. J. Chem. Eng. Data 2012, 57, 450–455. [Google Scholar] [CrossRef]
  28. Yang, F.; Chu, Q.; Liu, Q.; Duan, Y.; Yang, Z. The cubic-plus-association equation of state for hydrofluorocarbons, hydrofluoroolefins, and their binary mixtures. Chem. Eng. Sci. 2019, 209, 115182. [Google Scholar] [CrossRef]
  29. Saha, S.; Rajput, L.; Joseph, S.; Mishra, M.K.; Ganguly, S.; Desiraju, G.R. IR spectroscopy as a probe for C–H⋯ X hydrogen bonded supramolecular synthons. CrystEngComm 2015, 17, 1273–1290. [Google Scholar] [CrossRef]
  30. Martín Pendás, A.; Blanco, M.; Francisco, E. The nature of the hydrogen bond: A synthesis from the interacting quantum atoms picture. J. Chem. Phys. 2006, 125, 184112. [Google Scholar] [CrossRef]
  31. Kontogeorgis, G.M.; Voutsas, E.C.; Yakoumis, I.V.; Tassios, D.P. An Equation of State for Associating Fluids. Ind. Eng. Chem. Res. 1996, 35, 4310–4318. [Google Scholar] [CrossRef]
  32. Kontogeorgis, G.M.; Michelsen, M.L.; Folas, G.K.; Derawi, S.; Von Solms, N.; Stenby, E.H. Ten years with the CPA (Cubic-Plus-Association) equation of state. Part 1. Pure compounds and self-associating systems. Ind. Eng. Chem. Res. 2006, 45, 4855–4868. [Google Scholar] [CrossRef]
  33. Tsivintzelis, I.; Kontogeorgis, G.M.; Michelsen, M.L.; Stenby, E.H. Modeling phase equilibria for acid gas mixtures using the CPA equation of state. Part II: Binary mixtures with CO2. Fluid Phase Equilib. 2011, 306, 38–56. [Google Scholar] [CrossRef]
  34. Kang, K.; Wang, X.; Kontogeorgis, G.M.; Liang, X. Modeling hydrofluoroolefins with the cubic plus association and Perturbed-Chain Statistical Associating Fluid Theory equations of state. Ind. Eng. Chem. Res. 2018, 57, 17289–17300. [Google Scholar] [CrossRef]
  35. Lemmon, E.W.; Bell, I.H.; Huber, M.; McLinden, M. NIST Standard Reference Database 23: Reference Fluid Thermodynamic and Transport Properties-REFPROP, Version 10.0; National Institute of Standards and Technology, Standard Reference Data Program: Gaithersburg, MD, USA, 2018. [Google Scholar]
  36. El Abbadi, J. Thermodynamic Properties of New Refrigerants. Ph.D. Thesis, Mines ParisTech, Paris, France, 2016. [Google Scholar]
  37. Jiang, S. Measurements of PVT and Vapor-Liquid Equilibrium Properties of Low Global-Warming-Potential Refrigerants. Doctoral Dissertation, Kyushu University, Fukuoka, Japan, 2018. [Google Scholar]
  38. Hulse, R.J.; Basu, R.S.; Singh, R.R.; Thomas, R.H. Physical properties of HCFO-1233zd(E). J. Chem. Eng. Data 2012, 57, 3581–3586. [Google Scholar] [CrossRef]
  39. Shank, R. Thermodynamic properties of 1,1,1,2,2-pentafluoropropane (refrigerant 245). J. Chem. Eng. Data 1967, 12, 474–480. [Google Scholar] [CrossRef]
  40. Soave, G. Equilibrium constants from a modified Redlich-Kwong equation of state. Chem. Eng. Sci. 1972, 27, 1197–1203. [Google Scholar] [CrossRef]
  41. Chapman, W.G.; Gubbins, K.E.; Jackson, G.; Radosz, M. SAFT: Equation-of-state solution model for associating fluids. Fluid Phase Equilib. 1989, 52, 31–38. [Google Scholar] [CrossRef]
  42. Wertheim, M.S. Fluids with highly directional attractive forces. I. Statistical thermodynamics. J. Stat. Phys. 1984, 35, 19–34. [Google Scholar] [CrossRef]
  43. Wertheim, M. Fluids with highly directional attractive forces. IV. Equilibrium polymerization. J. Stat. Phys. 1986, 42, 477–492. [Google Scholar] [CrossRef]
  44. Michelsen, M.L.; Hendriks, E.M. Physical properties from association models. Fluid Phase Equilib. 2001, 180, 165–174. [Google Scholar] [CrossRef]
  45. Huang, S.H.; Radosz, M. Equation of state for small, large, polydisperse, and associating molecules. Ind. Eng. Chem. Res. 1990, 29, 2284–2294. [Google Scholar] [CrossRef]
  46. Liang, X. On the efficiency of PT Flash calculations with equations of state. Comput. Aided Chem. Eng. 2018, 44, 859–864. [Google Scholar]
  47. Weber, L.A.; Defibaugh, D.E. Vapor Pressure of 1,1,1,2,2-Pentafluoropropane. J. Chem. Eng. Data 1996, 41, 762–764. [Google Scholar] [CrossRef]
  48. Defibaugh, D.R.; Moldover, M.R. Compressed and saturated liquid densities for 18 halogenated organic compounds. J. Chem. Eng. Data 1997, 42, 160–168. [Google Scholar] [CrossRef]
  49. Raabe, G. Molecular simulation studies in hydrofluoroolefine (HFO) working fluids and their blends. Sci. Technol. Built Environ. 2016, 22, 1077–1089. [Google Scholar] [CrossRef]
  50. Yin, J.; Zhou, Y.; Zhao, G.; Ma, S. Measurements of vapor pressure and gaseous pvT property for trans-1,3,3,3-tetrafluoropropene (HFO-1234ze(E)). Fluid Phase Equilib. 2018, 460, 69–74. [Google Scholar] [CrossRef]
  51. Higashi, Y.; Tanaka, K.; Ichikawa, T. Critical Parameters and Saturated Densities in the Critical Region for trans-1,3,3,3-Tetrafluoropropene (HFO-1234ze(E)). J. Chem. Eng. Data 2010, 55, 1594–1597. [Google Scholar] [CrossRef]
  52. Brown, J.S.; Di Nicola, G.; Fedele, L.; Bobbo, S.; Zilio, C. Saturated pressure measurements of 3,3,3-trifluoroprop-1-ene (R1243zf) for reduced temperatures ranging from 0.62 to 0.98. Fluid Phase Equilib. 2013, 351, 48–52. [Google Scholar] [CrossRef]
  53. Di Nicola, G.; Brown, J.S.; Fedele, L.; Securo, M.; Bobbo, S.; Zilio, C. Subcooled liquid density measurements and PvT measurements in the vapor phase for 3,3,3-trifluoroprop-1-ene (R1243zf). Int. J. Refrig. 2013, 36, 2209–2215. [Google Scholar] [CrossRef]
  54. Rykov, S.; Kudriavtseva, I.; Sverdlov, A.; Rykov, V. Calculation method of R1234yf phase equilibrium curve within temperature range from 122.6 K to 367.85 K. AIP Conf. Proc. 2020, 2285, 030070. [Google Scholar]
  55. Di Nicola, G.; Fedele, L.; Brown, J.S.; Bobbo, S.; Coccia, G. Saturated Pressure Measurements of trans-1-Chloro-3,3,3-trifluoroprop-1-ene (R1233zd(E)). J. Chem. Eng. Data 2017, 62, 2496–2500. [Google Scholar] [CrossRef]
  56. Tanaka, K. Vapor Pressure and Saturated Liquid Density of HCFO-1233zd(E) and HCFO-1233xf. Trans. Jpn. Soc. Refrig. Air Cond. Eng. 2016, 33, 105–111. [Google Scholar]
  57. Raabe, G. Molecular simulation studies on the vapor–liquid equilibria of the cis-and trans-HCFO-1233zd and the cis-and trans-HFO-1336mzz. J. Chem. Eng. Data 2015, 60, 2412–2419. [Google Scholar] [CrossRef]
  58. Zhang, W.; Yang, Z.; Lu, J.; Lu, J. Vapor pressures of 2-chloro-3,3,3-trifluoropropene (HCFO-1233xf). J. Chem. Eng. Data 2013, 58, 2307–2310. [Google Scholar] [CrossRef]
  59. Fang, Y.; Ye, G.; Ni, H.; Jiang, Q.; Bao, K.; Han, X.; Chen, G. Vapor–Liquid Equilibrium for the Binary Systems 1,1,2,3,3,3-Hexafluoro-1-propene (R1216)+2,3,3,3-Tetrafluoroprop-1-ene (R1234yf) and 1,1,2,3,3,3-Hexafluoro-1-propene (R1216)+trans-1,3,3,3-Tetrafluoropropene (R1234ze(E)). J. Chem. Eng. Data 2020, 65, 4215–4222. [Google Scholar] [CrossRef]
  60. Coquelet, C.; Ramjugernath, D.; Madani, H.; Valtz, A.; Naidoo, P.; Meniai, A.H. Experimental Measurement of Vapor Pressures and Densities of Pure Hexafluoropropylene. J. Chem. Eng. Data 2010, 55, 2093–2099. [Google Scholar] [CrossRef]
  61. Ahmadi, M.H.; Ahmadi, M.A.; Feidt, M. Thermodynamic analysis and evolutionary algorithm based on multi-objective optimization of performance for irreversible four-temperature-level refrigeration. Mech. Ind. 2015, 16, 207. [Google Scholar] [CrossRef]
  62. Yang, Z.; Kou, L.; Han, S.; Li, C.; Hao, Z.; Mao, W.; Zhang, W.; Lu, J. Vapor-liquid equilibria of 2,3,3,3-tetrafluoropropene (HFO-1234yf) + 1,1,1,2,2-pentafluoropropane (HFC-245cb) system. Fluid Phase Equilib. 2016, 427, 390–393. [Google Scholar] [CrossRef]
  63. Yang, Z.; Kou, L.; Lu, J.; Zhang, W.; Mao, W.; Lu, J. Isothermal vapor–liquid equilibria measurements for binary systems of 2,3,3,3-tetrafluoropropene (HFO-1234yf)+2-chloro-3,3,3-trifluoropropene (HCFO-1233xf) and 2-chloro-3,3,3-trifluoropropene (HCFO-1233xf)+2-chloro-1,1,1,2-tetrafluoropropane (HCFC-244bb). Fluid Phase Equilib. 2016, 414, 143–148. [Google Scholar] [CrossRef]
  64. Kochenburger, T.M.; Gomse, D.; Tratschitt, I.; Zimmermann, A.; Grohmann, S. Vapor-liquid and vapor-liquid-liquid equilibrium measurements and correlation of the binary mixtures 2,3,3,3-tetrafluoroprop-1-ene (R1234yf)+(tetrafluoromethane (R14), trifluoromethane (R23), octafluoropropane (R218), nitrogen (R728) and argon (R740)) and ethane (R170)+trifluoromethane (R23). Fluid Phase Equilib. 2017, 450, 13–23. [Google Scholar]
  65. Kang, K.; Gu, Y.; Wang, X. Assessment and development of the viscosity prediction capabilities of entropy scaling method coupled with a modified binary interaction parameter estimation model for refrigerant blends. J. Mol. Liq. 2022, 358, 119184. [Google Scholar] [CrossRef]
  66. Kryachko, E.; Scheiner, S. CH···F Hydrogen Bonds. Dimers of Fluoromethanes. J. Phys. Chem. A 2004, 108, 2527–2535. [Google Scholar] [CrossRef]
Figure 1. Calculation performance of (a) saturated density and (b) pressure of R600.
Sustainability 15 14482 g001
Figure 2. Calculation performance of (a) saturated density and (b) pressure of R600a.
Sustainability 15 14482 g002
Figure 3. Calculation performance of (a) saturated density and (b) pressure of R245cb.
Sustainability 15 14482 g003
Figure 4. Calculation performance of (a) saturated density and (b) pressure of R1233zd(E).
Sustainability 15 14482 g004
Figure 5. Calculation performance of (a) saturated density and (b) pressure of R218.
Sustainability 15 14482 g005
Table 1. Critical properties and acentric factors of pure components [9,35,36,37,38,39].
Component NameCAS No. T C [K] P C [MPa]ωClassification
R600n-Butane106-97-8425.133.7960.201HC
R600aiso-butane75-28-5408.103.6470.184HC
R245cb1,1,1,2,2-pentafluoropropane1814-88-6380.383.14830.297HFC
R1123Trifluoroethene359-11-5331.734.54880.243HFO
R1234ze(E)trans-1,3,3,3-tetrafluoropropene29118-24-9382.513.63490.313HFO
R1243zf3,3,3- Trifluoropropene677-21-4376.933.51820.261HFO
R1234yf2,3,3,3-tetrafluoroprop-1-ene754-12-1367.853.38220.276HFO
R1233zd(E)trans-1-chloro-3,3,3-trifluoropropene102687-65-0439.603.62370.303HCFO
R1233xf2-chloro-3,3,3-trifluoropropene2730-62-3439.983.322010.187HCFO
R218Octafluoropropane76-19-7345.022.640.317PFC
R12161,1,2,3,3,3-hexafluoro-1-propene116-15-4358.903.14950.333PFO
In Table 1, T C is the critical temperature; P C is the critical pressure; ω is the acentric factor.
Table 2. CPA parameters and calculated performance of pure refrigerant.
Component CPA Parameters A R D [%]
b [L/mol] Γ [K] c 1 ε A i B j / R [K] β A i B j . 10 3 Psat [MPa]Trange [K]ρl.sat [kg/m3]Trange [K]ρv.sat [kg/m3]Trange [K]
R60073.195 2093.451 0.736 308.133 141.136 0.75 [35]170.00–410.000.94 [35] 170.00–400.003.02 [35]170.00–400.00
R600a75.820 2006.115 0.705 307.656 140.055 0.38 [35]165.00–390.001.11 [35]165.00–390.001.79 [35]170.00–380.00
R245cb79.880 1872.888 0.854 308.414 141.903 0.75 [47]248.00–326.440.42 [48]245.00–355.002.75 [39]233.15–355.37
R112348.154 1575.907 0.863 563.331 110.946 0.68 [15,49]230.00–334.300.85 [15,49]230.00–334.302.84 [15]322.41–331.65
R1234ze(E) +68.282 1326.183 1.309 1862.510 285.103 0.28 [50]310.00–380.000.91 [51]368.20–381.681.57 [51]368.79–382.51
R1243zf68.088 1863.462 0.801 310.546 147.337 0.45 [52]233.8–372.860.33 [53]270.00–360.00- #
R1234yf +69.537 1232.118 1.333 4655.390 154.045 0.08 [54]122.6–367.850.20 [9]348.05–367.851.43 [9]356.01–367.85
R1233zd(E)80.172 2168.011 0.868 309.074 143.551 0.94 [38,55]234.15–375.150.42 [38,56]243.34–399.851.02 [57]273.15–383.15
R1233xf80.744 2119.423 0.777 564.274 121.831 0.87 [56,58]263.25–400.000.97 [56]300.00–400.00- #
R21889.194 1675.120 0.930 301.795 124.339 1.00 [35]150.00–330.001.12 [35]150.00–330.002.89 [35]160.00–330.00
R121676.028 1726.088 0.926 496.148 132.914 0.96 [59,60]253.26–358.761.33 [60]263.49–358.763.10 [60]263.41–358.16
+ Data from the literature [28]. # Lacking data on saturated vapor density. In Table 2, Psat represents the saturated pressure of the pure refrigerant, ρl.at stands for the saturated liquid density of the pure refrigerant, ρv.sat denotes the saturated vapor density of the pure refrigerant, and Trange indicates the temperature range covered by the experimental data.
Table 3. Binary interaction parameters and calculation performance of binary refrigerant mixtures.
Binary SystemskijARD [%]Trange [K]Tc (1) [K] Tc (2) [K]
x1y1
R1234yf(1) + R600(2)0.120070.971.14283.15–323.15 [24] 367.85425.13
R1234yf(1) + R600a(2)0.099240.721.08283.15–323.15 [17]367.85408.10
R1234yf(1) + R245cb(2)−0.000120.460.98283.15–343.27 [11,62]367.85380.38
R1234yf(1) + R1123(2)0.001510.621.17273.21–328.10 [16,37]367.85331.73
R1234yf(1) + R1234ze(E)(2)0.017500.850.85283.57–333.44 [12]367.85 382.51
R1234yf(1) + R1243zf(2)−0.035650.981.09293.41–353.58 [19]367.85 376.93
R1234yf(1) + R1233zd(E)(2)0.025620.761.75303.22–333.27 [11]367.85 439.60
R1234yf(1) + R1233xf(2)−0.004010.951.77293.15–348.25 [11,63]367.85 439.98
R1234yf(1) + R218(2)0.067030.660.93223.10–272.76 [64]367.85 345.02
R1234yf(1) + R1216(2)0.026600.731.26283.28–323.16 [37]367.85 358.90
In Table 3, kij is the binary interaction parameter; x1 is the mole fraction of R1234yf in the liquid phase; y1 is the mole fraction of R1234yf in the vapor phase.
Disclaimer/Publisher’s Note: The statements, opinions and data contained in all publications are solely those of the individual author(s) and contributor(s) and not of MDPI and/or the editor(s). MDPI and/or the editor(s) disclaim responsibility for any injury to people or property resulting from any ideas, methods, instructions or products referred to in the content.

