
Techno-Economic Study of a Distributed Renewable Power System for a British Winery

Abstract
:1. Introduction
2. Methodology
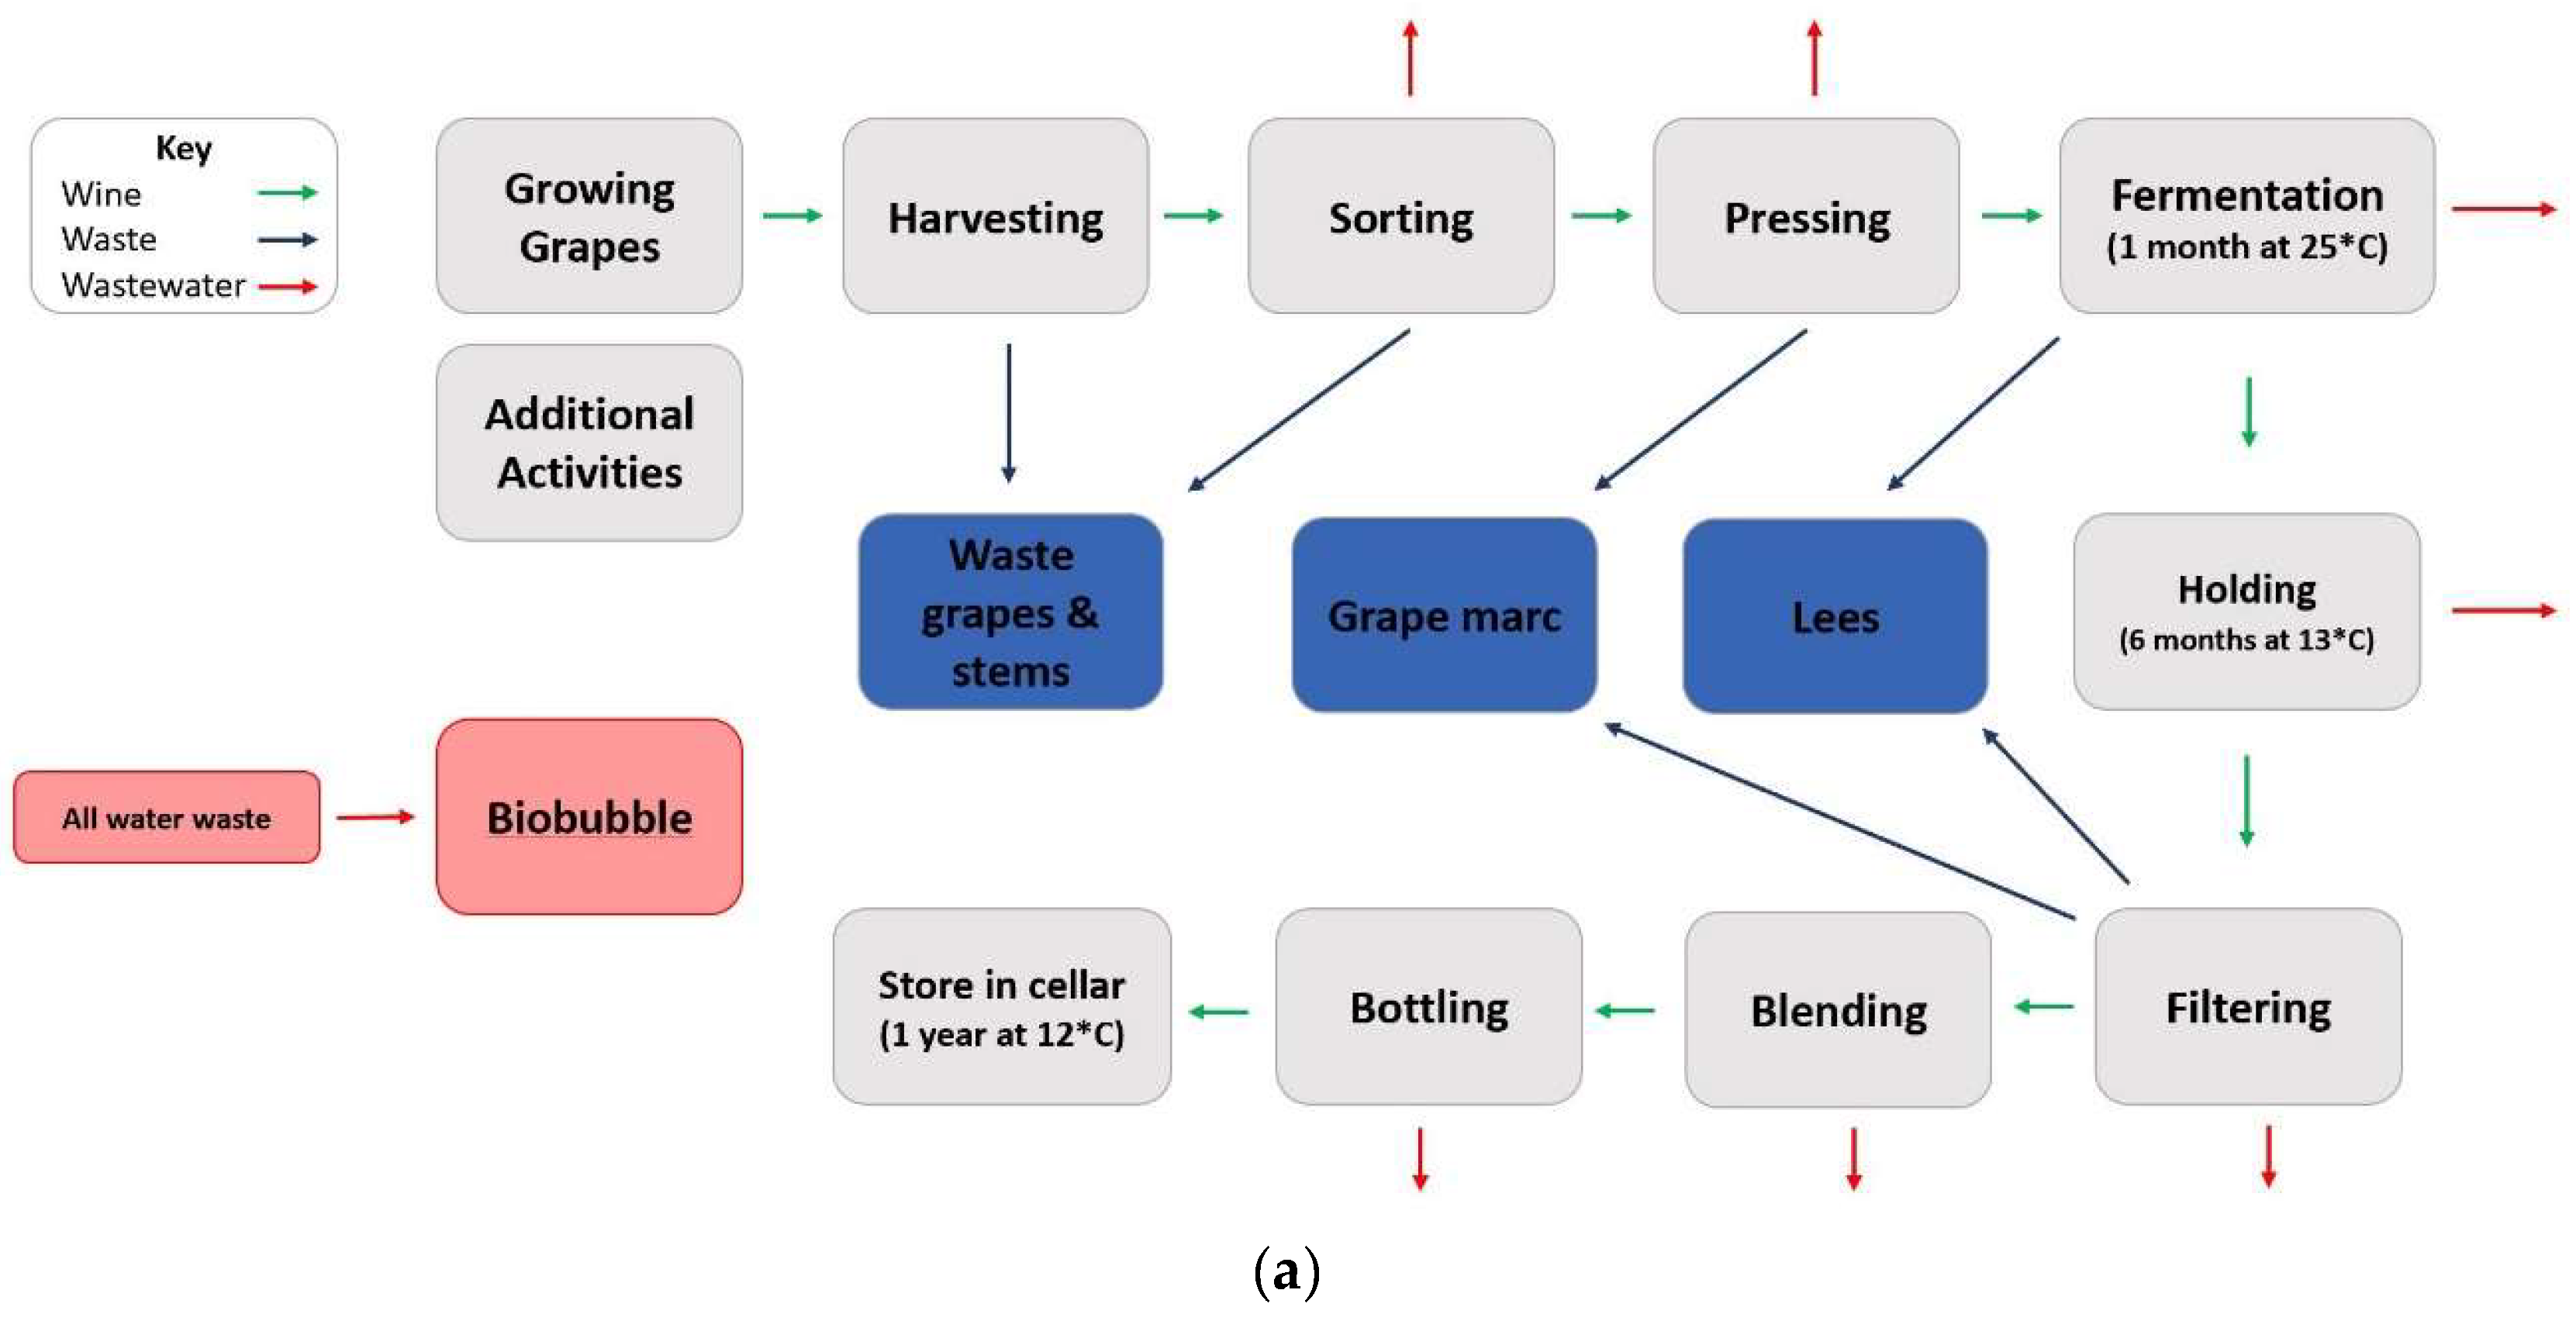
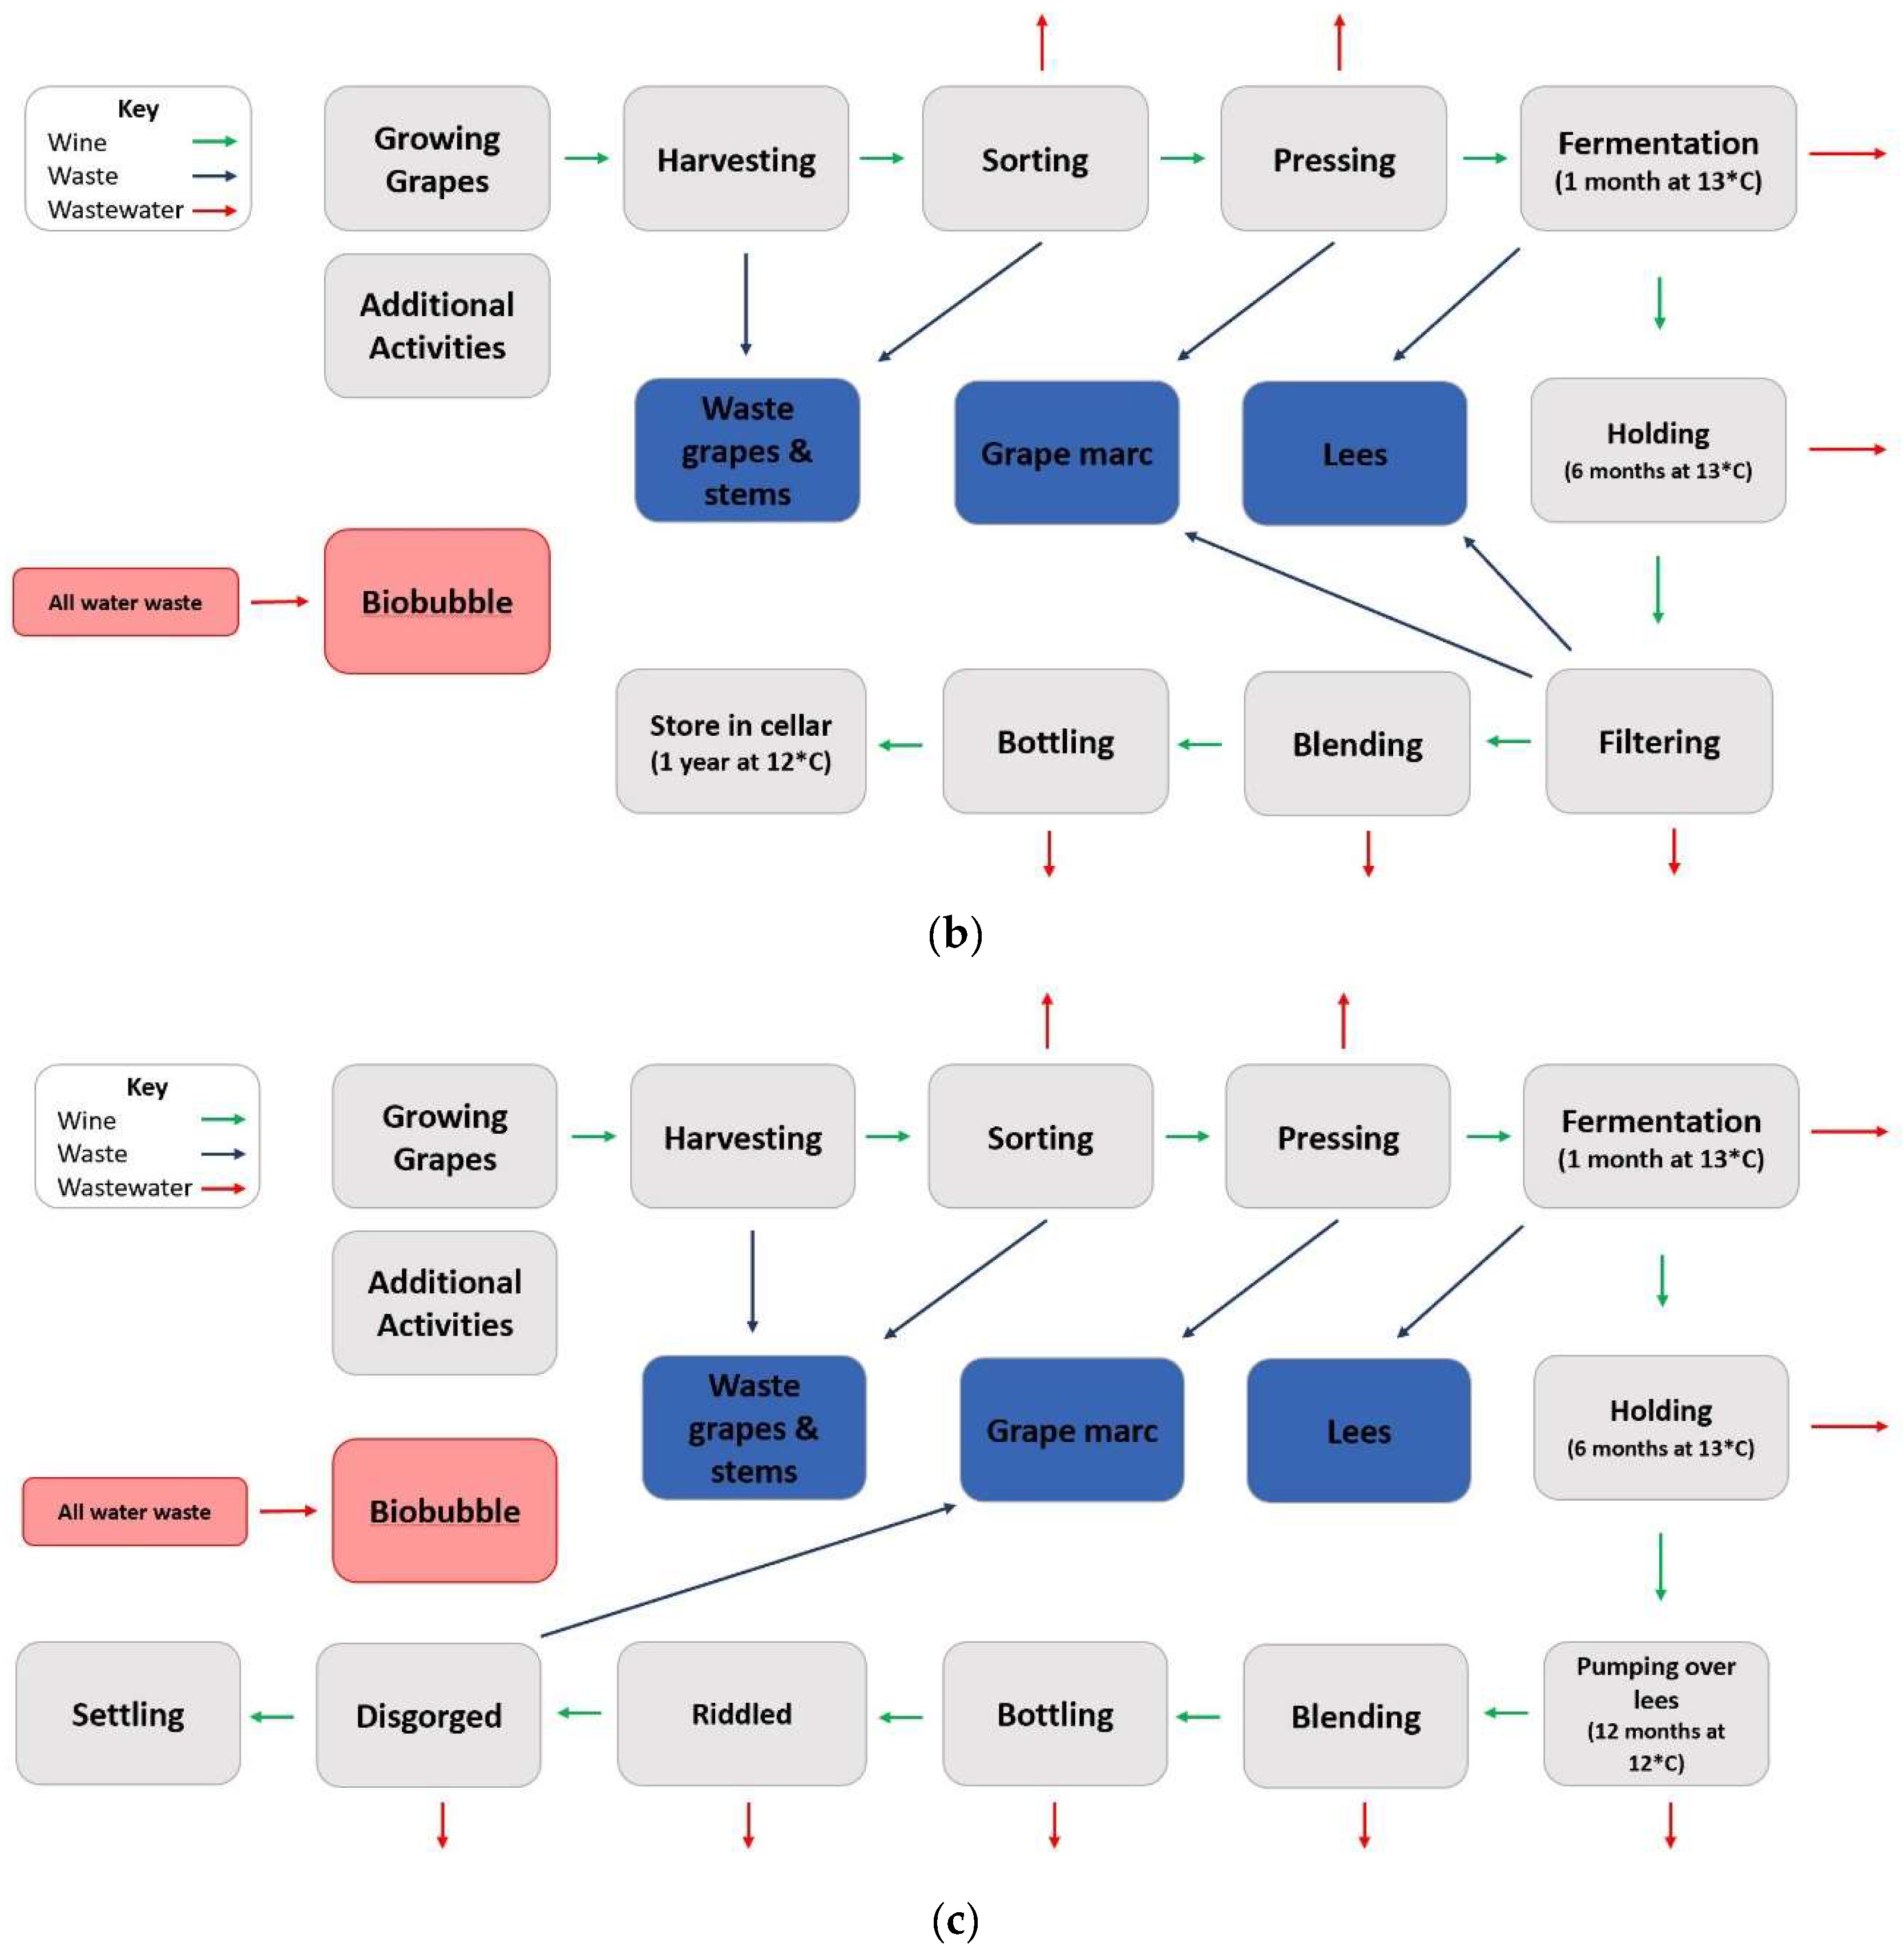
2.1. Carvers Hill Estate Winery
2.2. Energy Consumption
2.2.1. Top-Down Approach
2.2.2. Bottom-Up Approach
2.2.3. Heating
2.2.4. Lighting
2.2.5. Additional Amenities
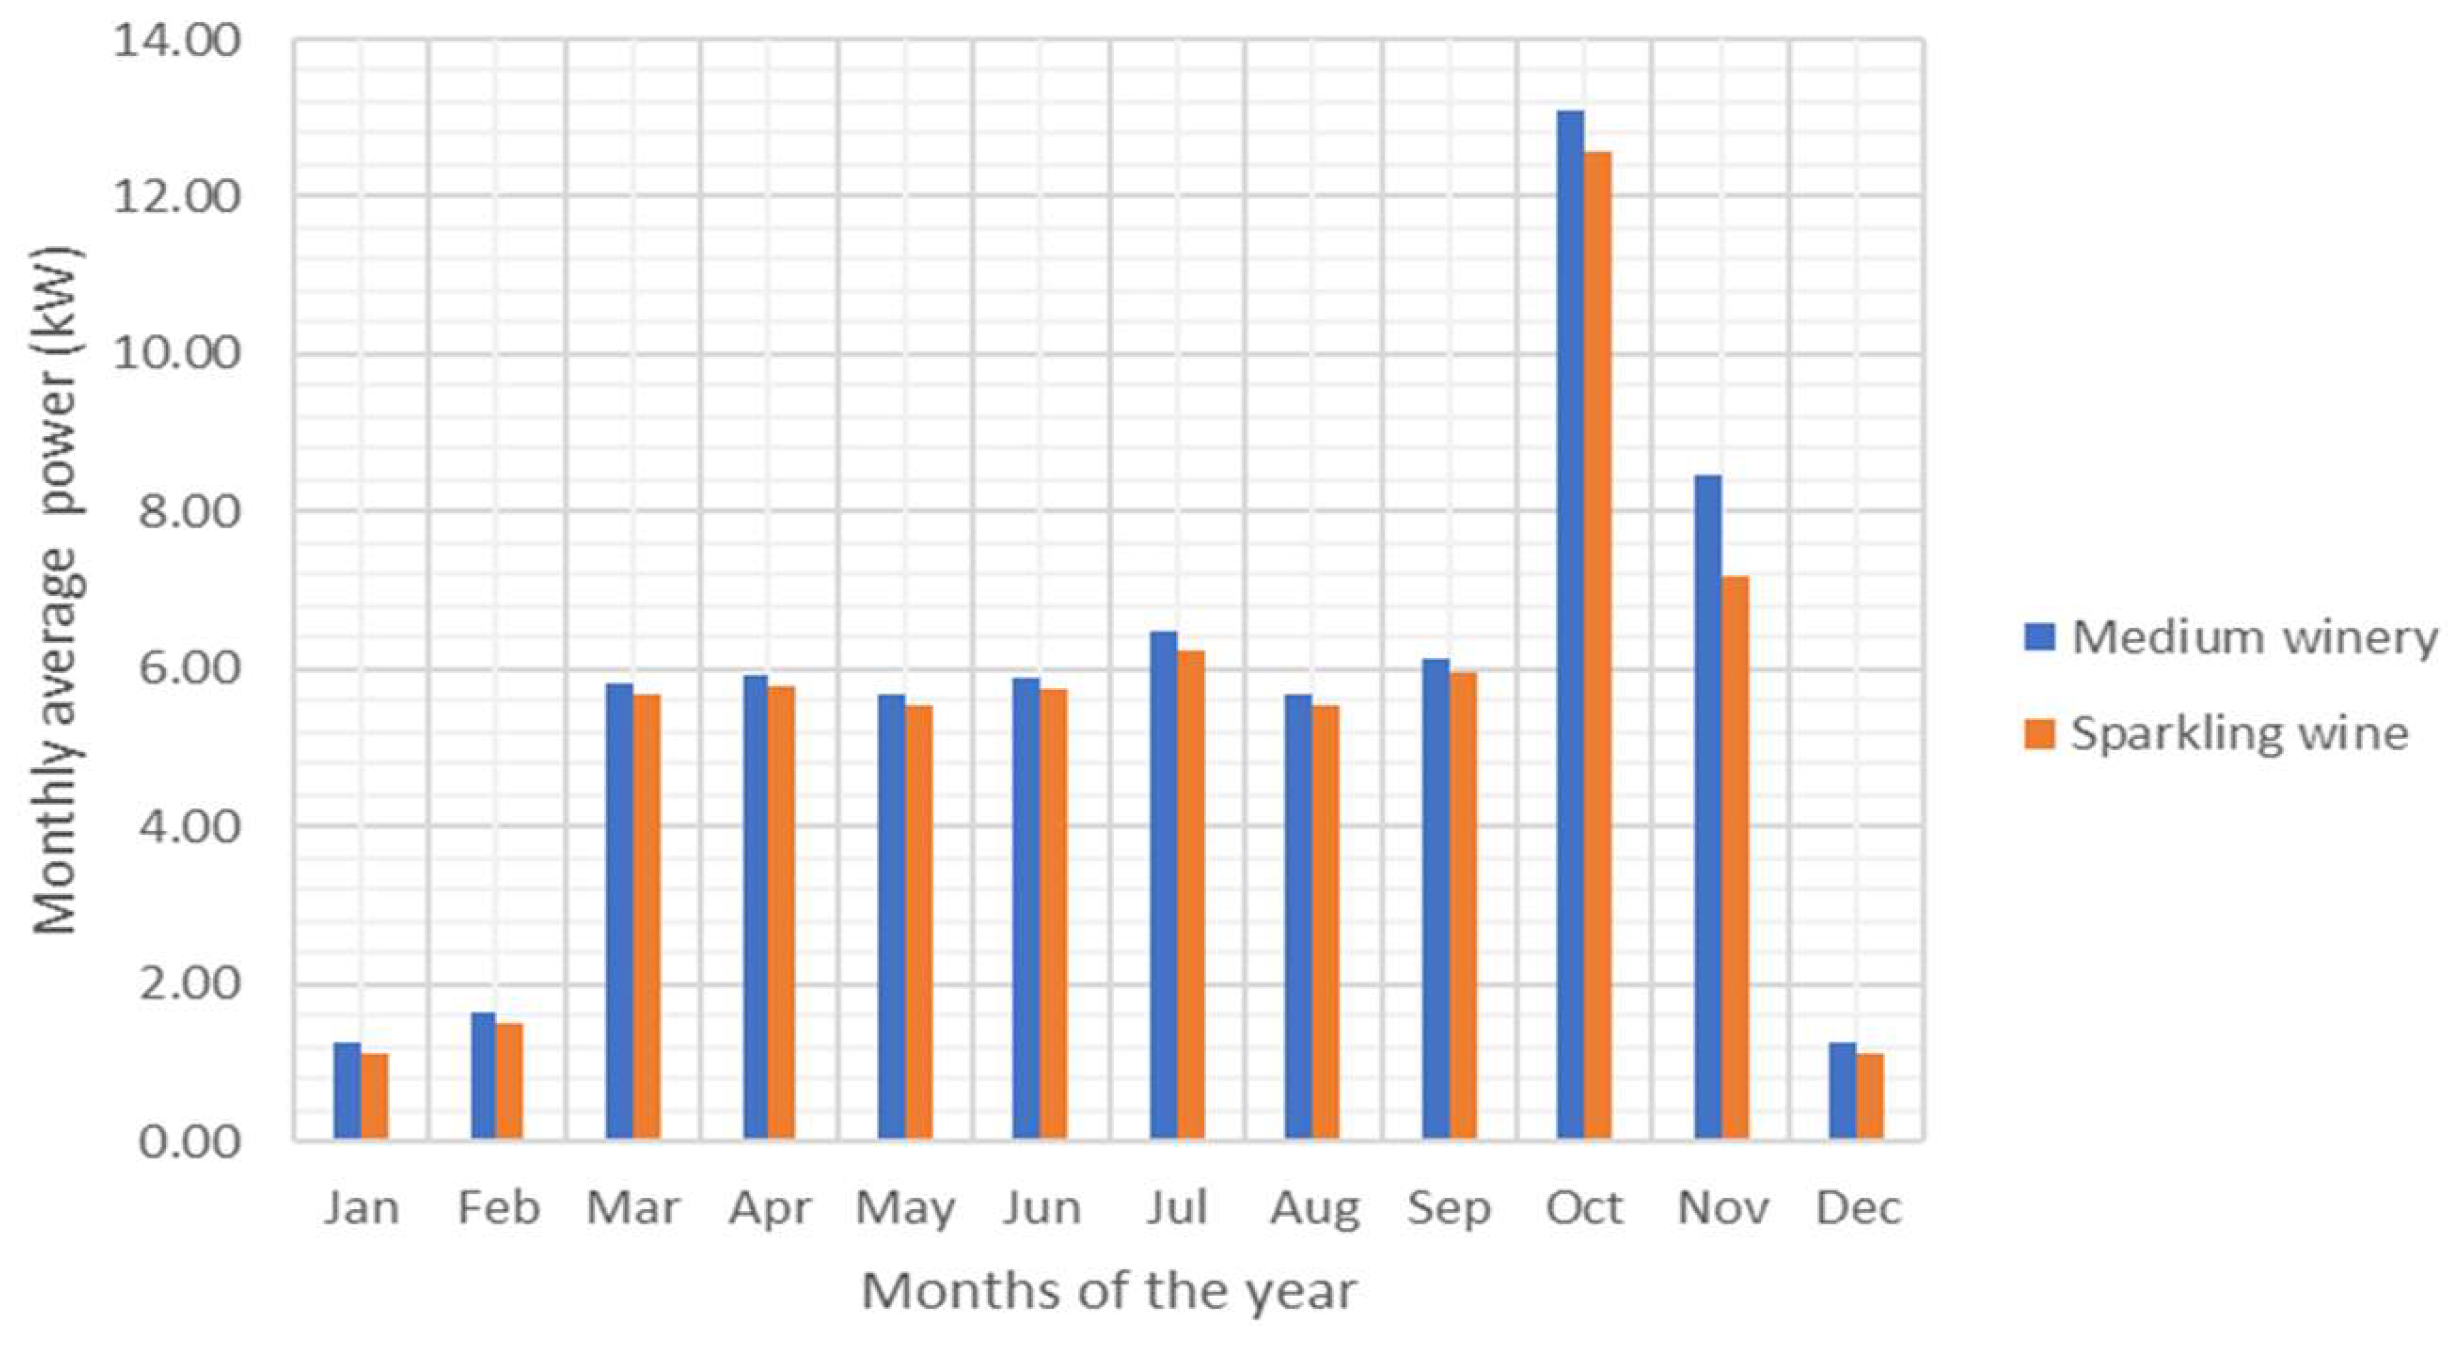
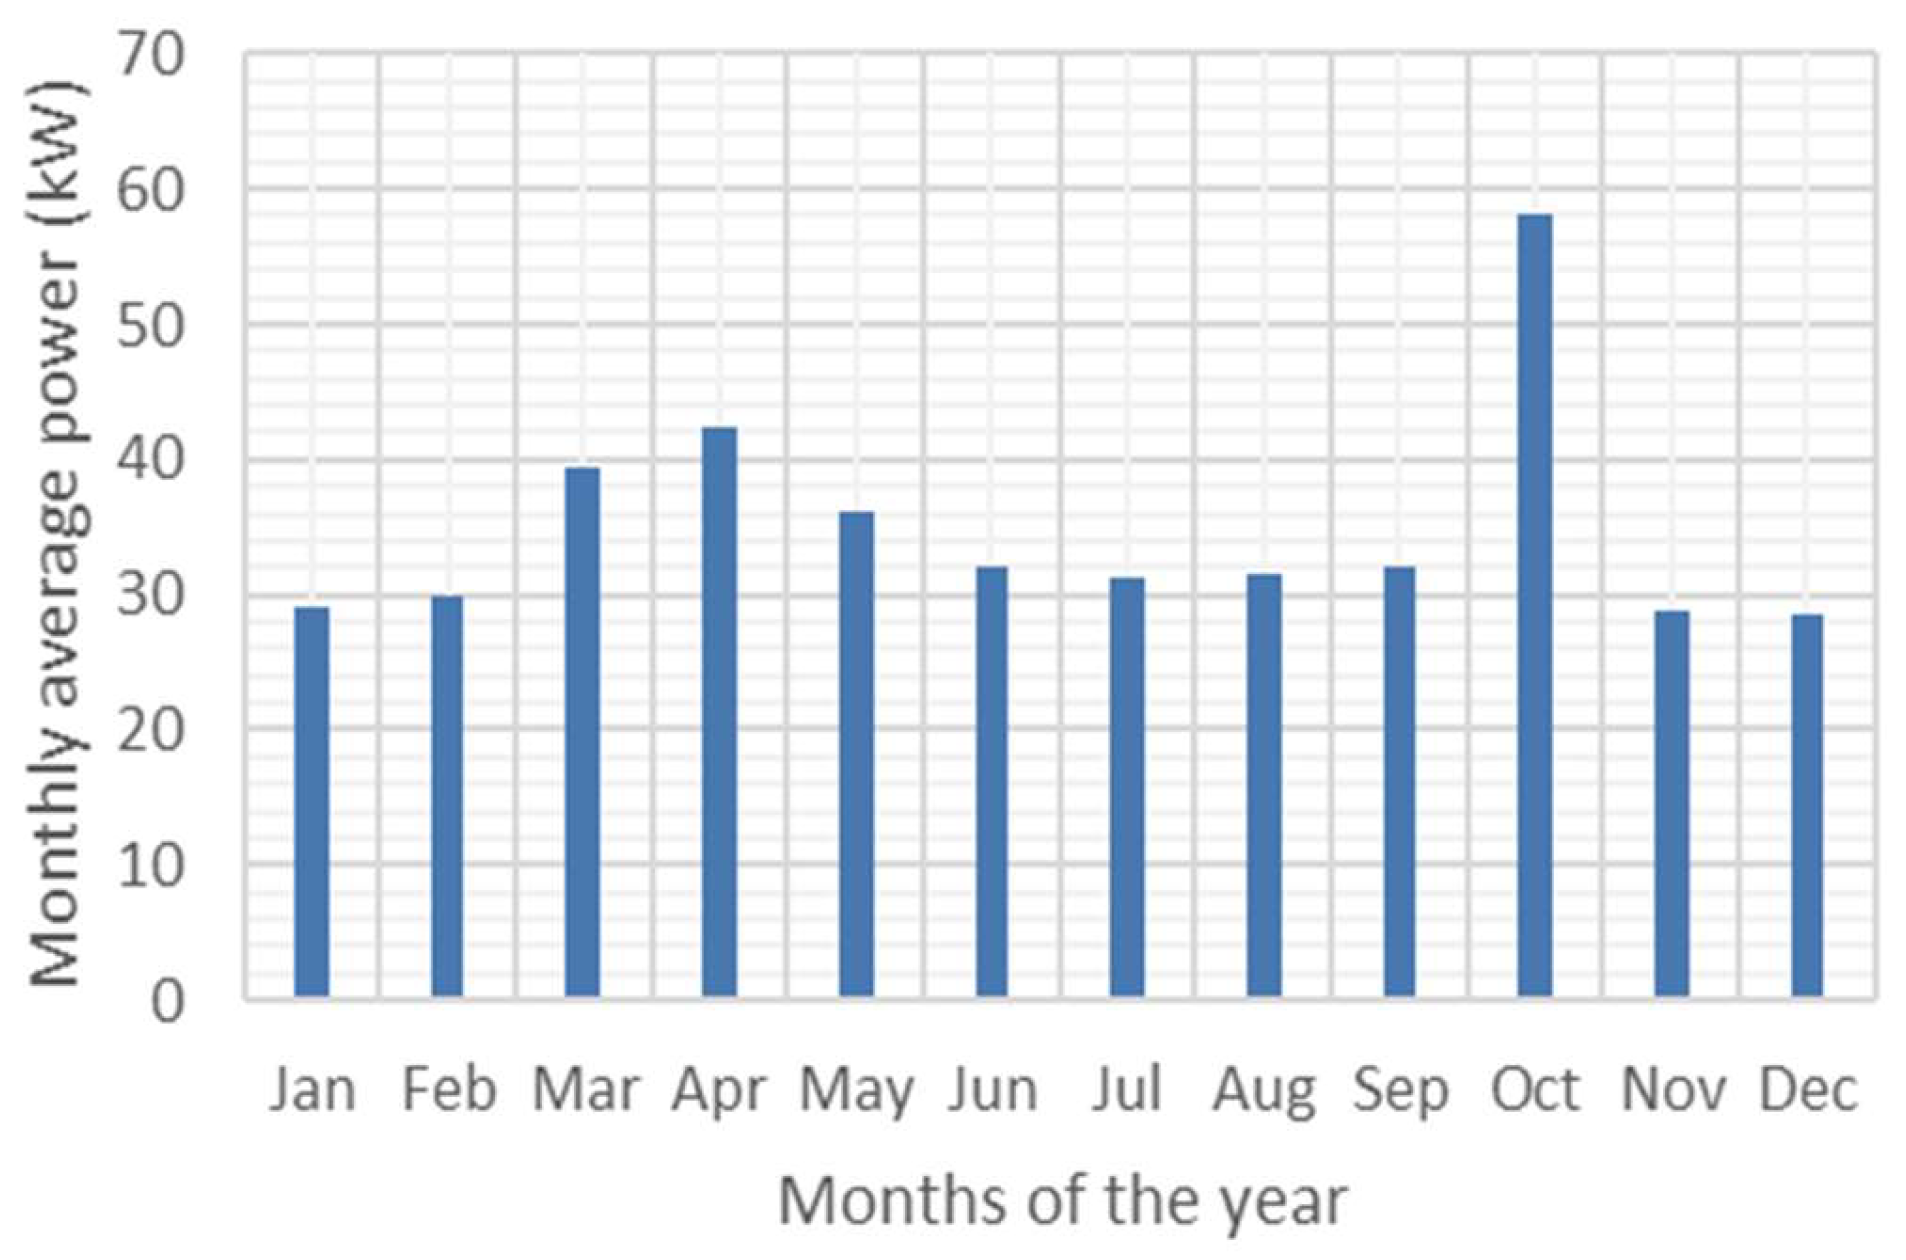
2.2.6. Consumption Results
2.3. Power Generation
2.3.1. Solar
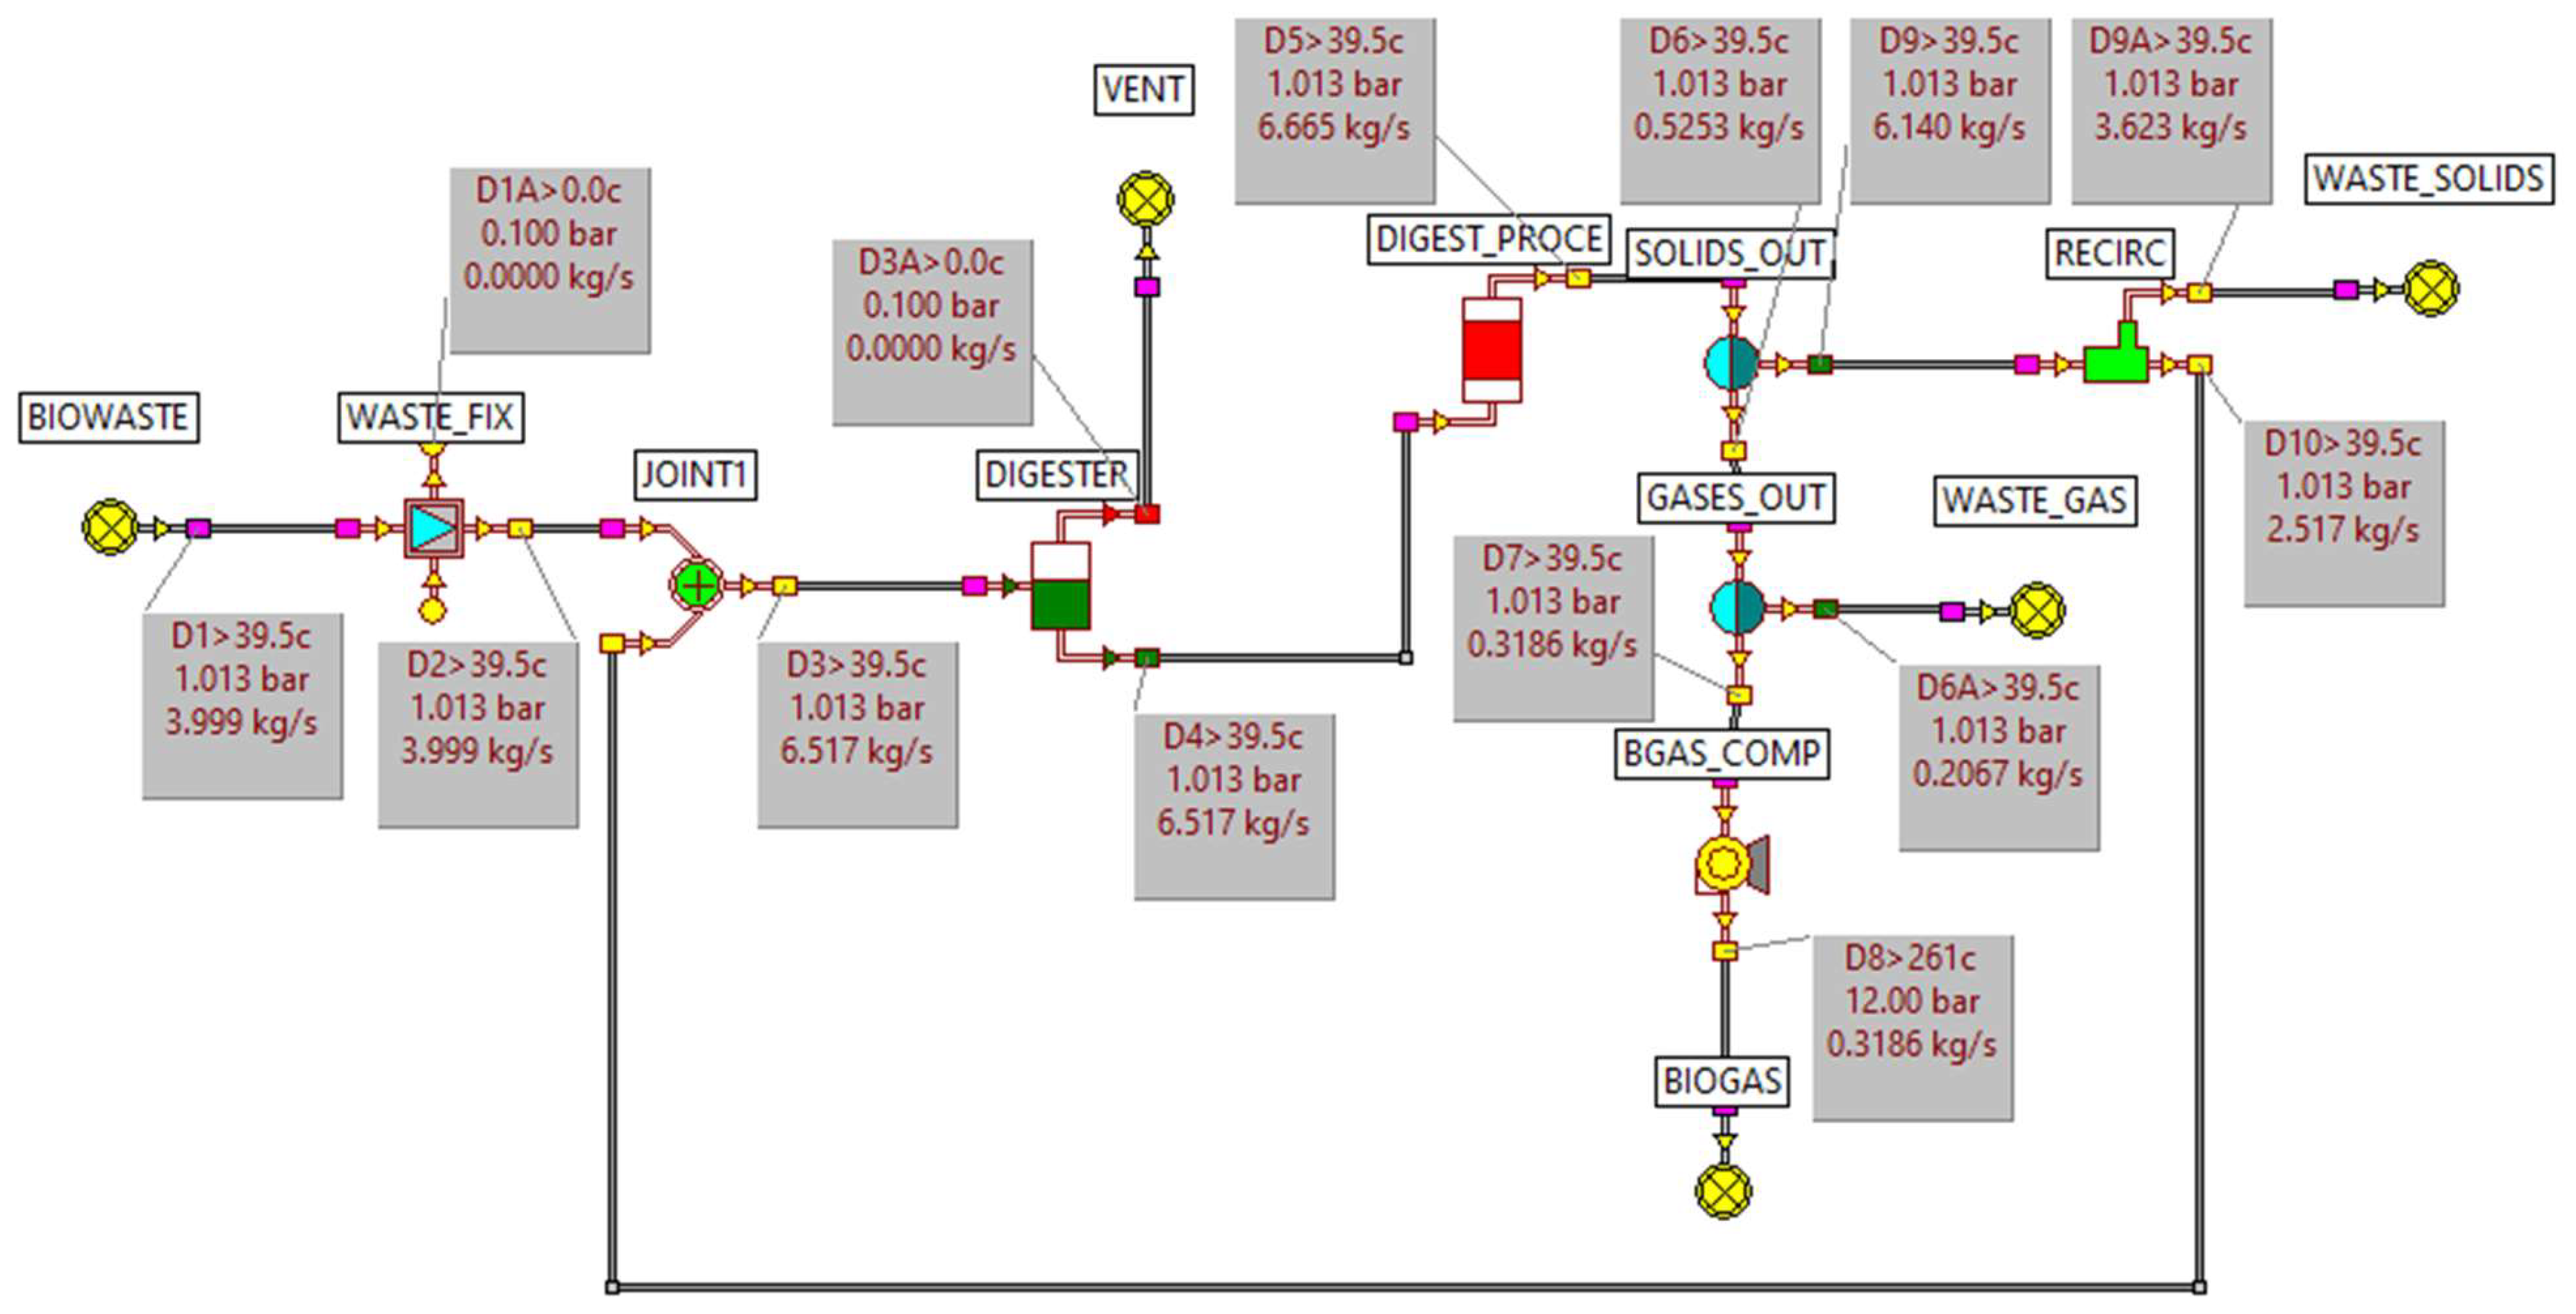
2.3.2. Biogas
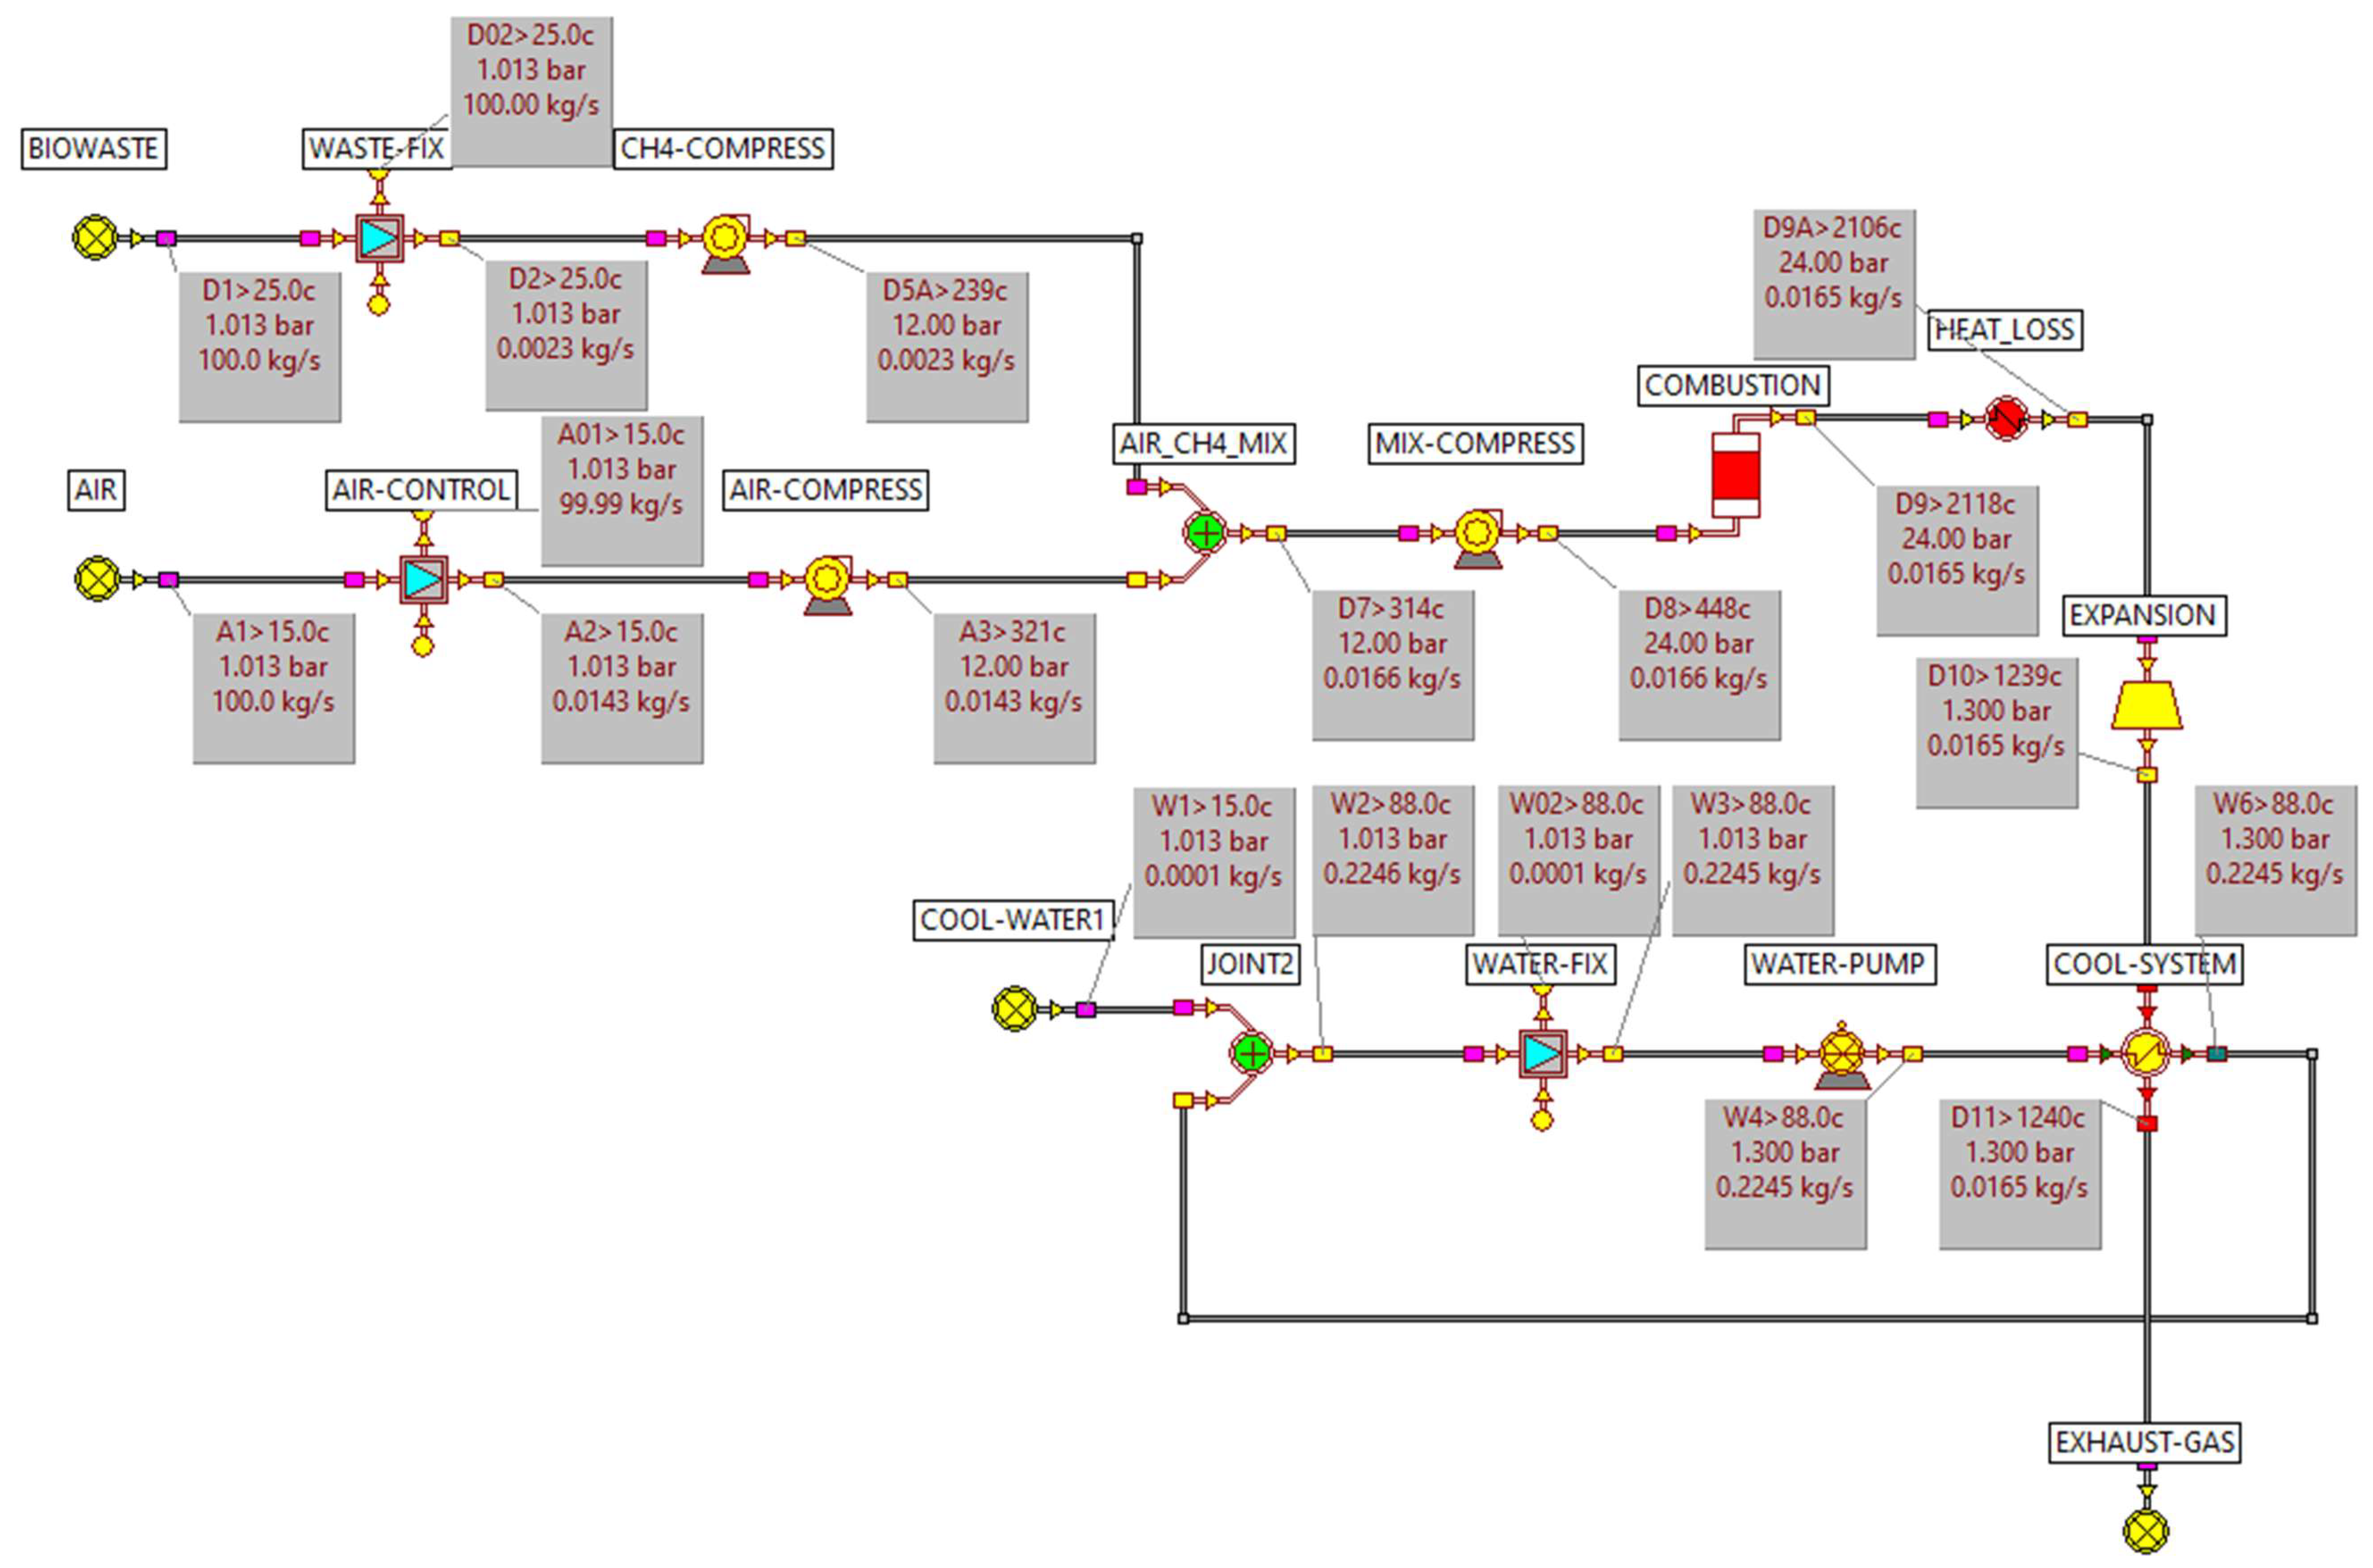
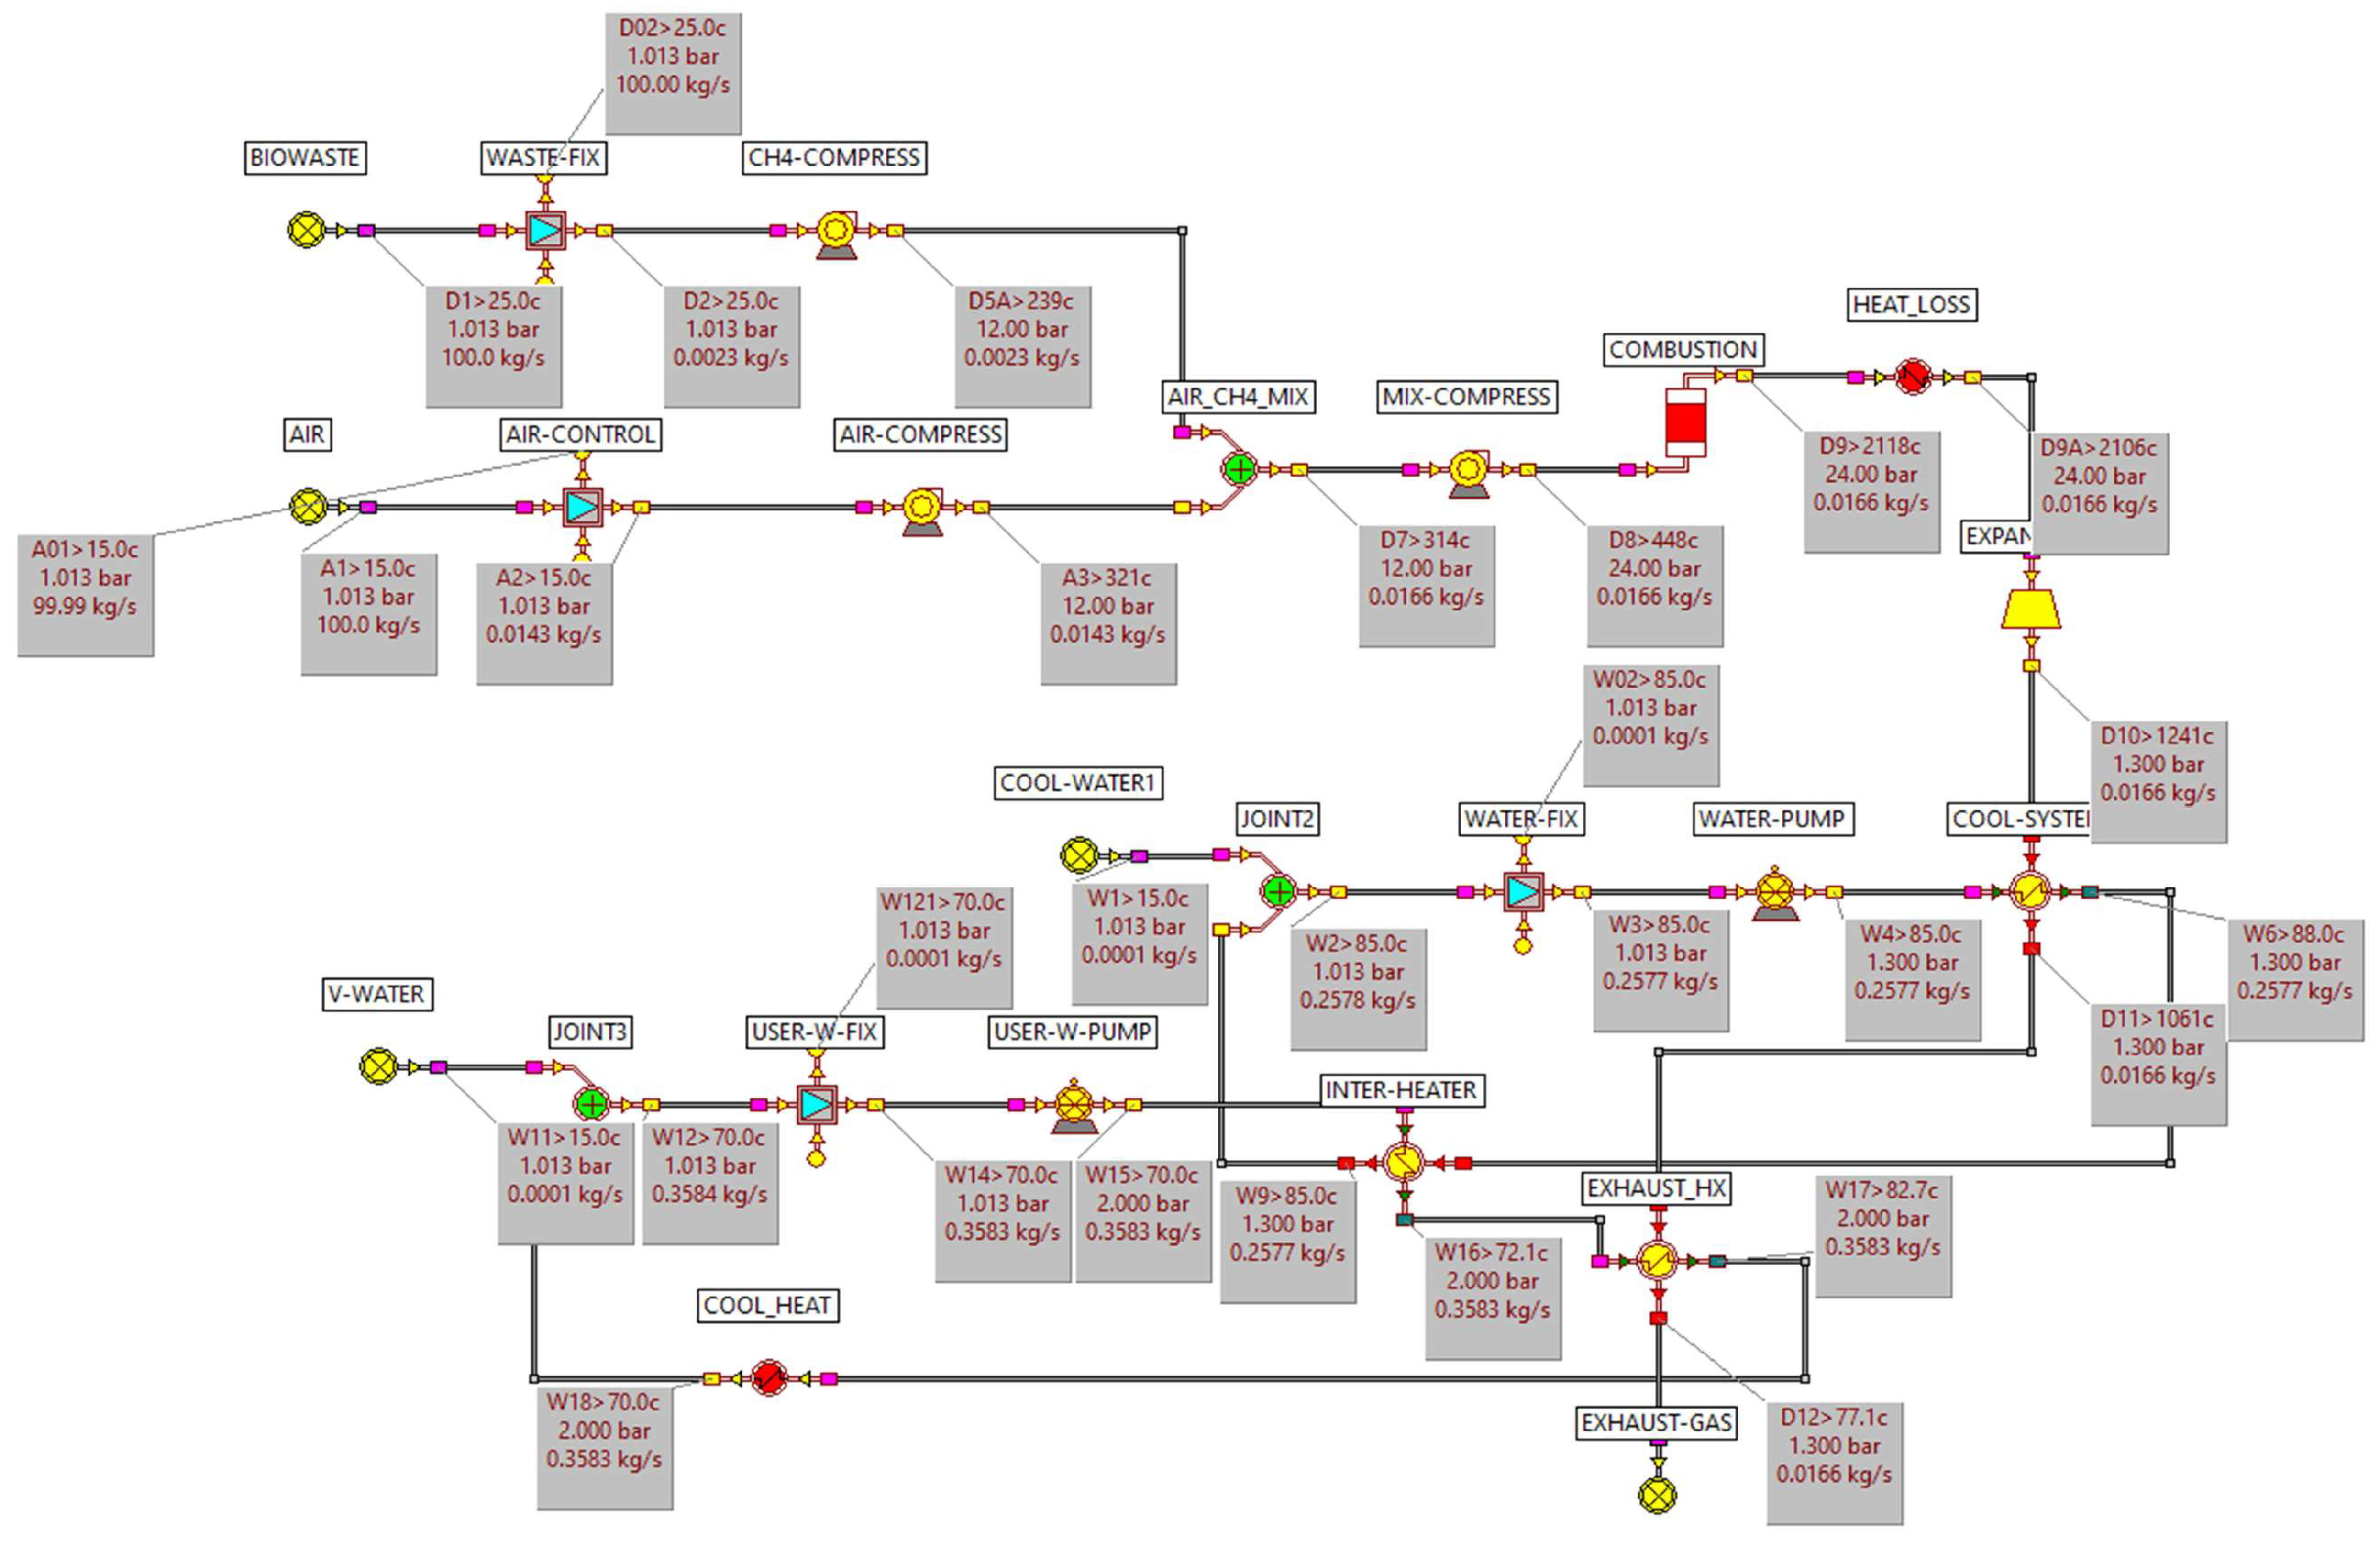
2.4. Modelling and Simulation
3. Results
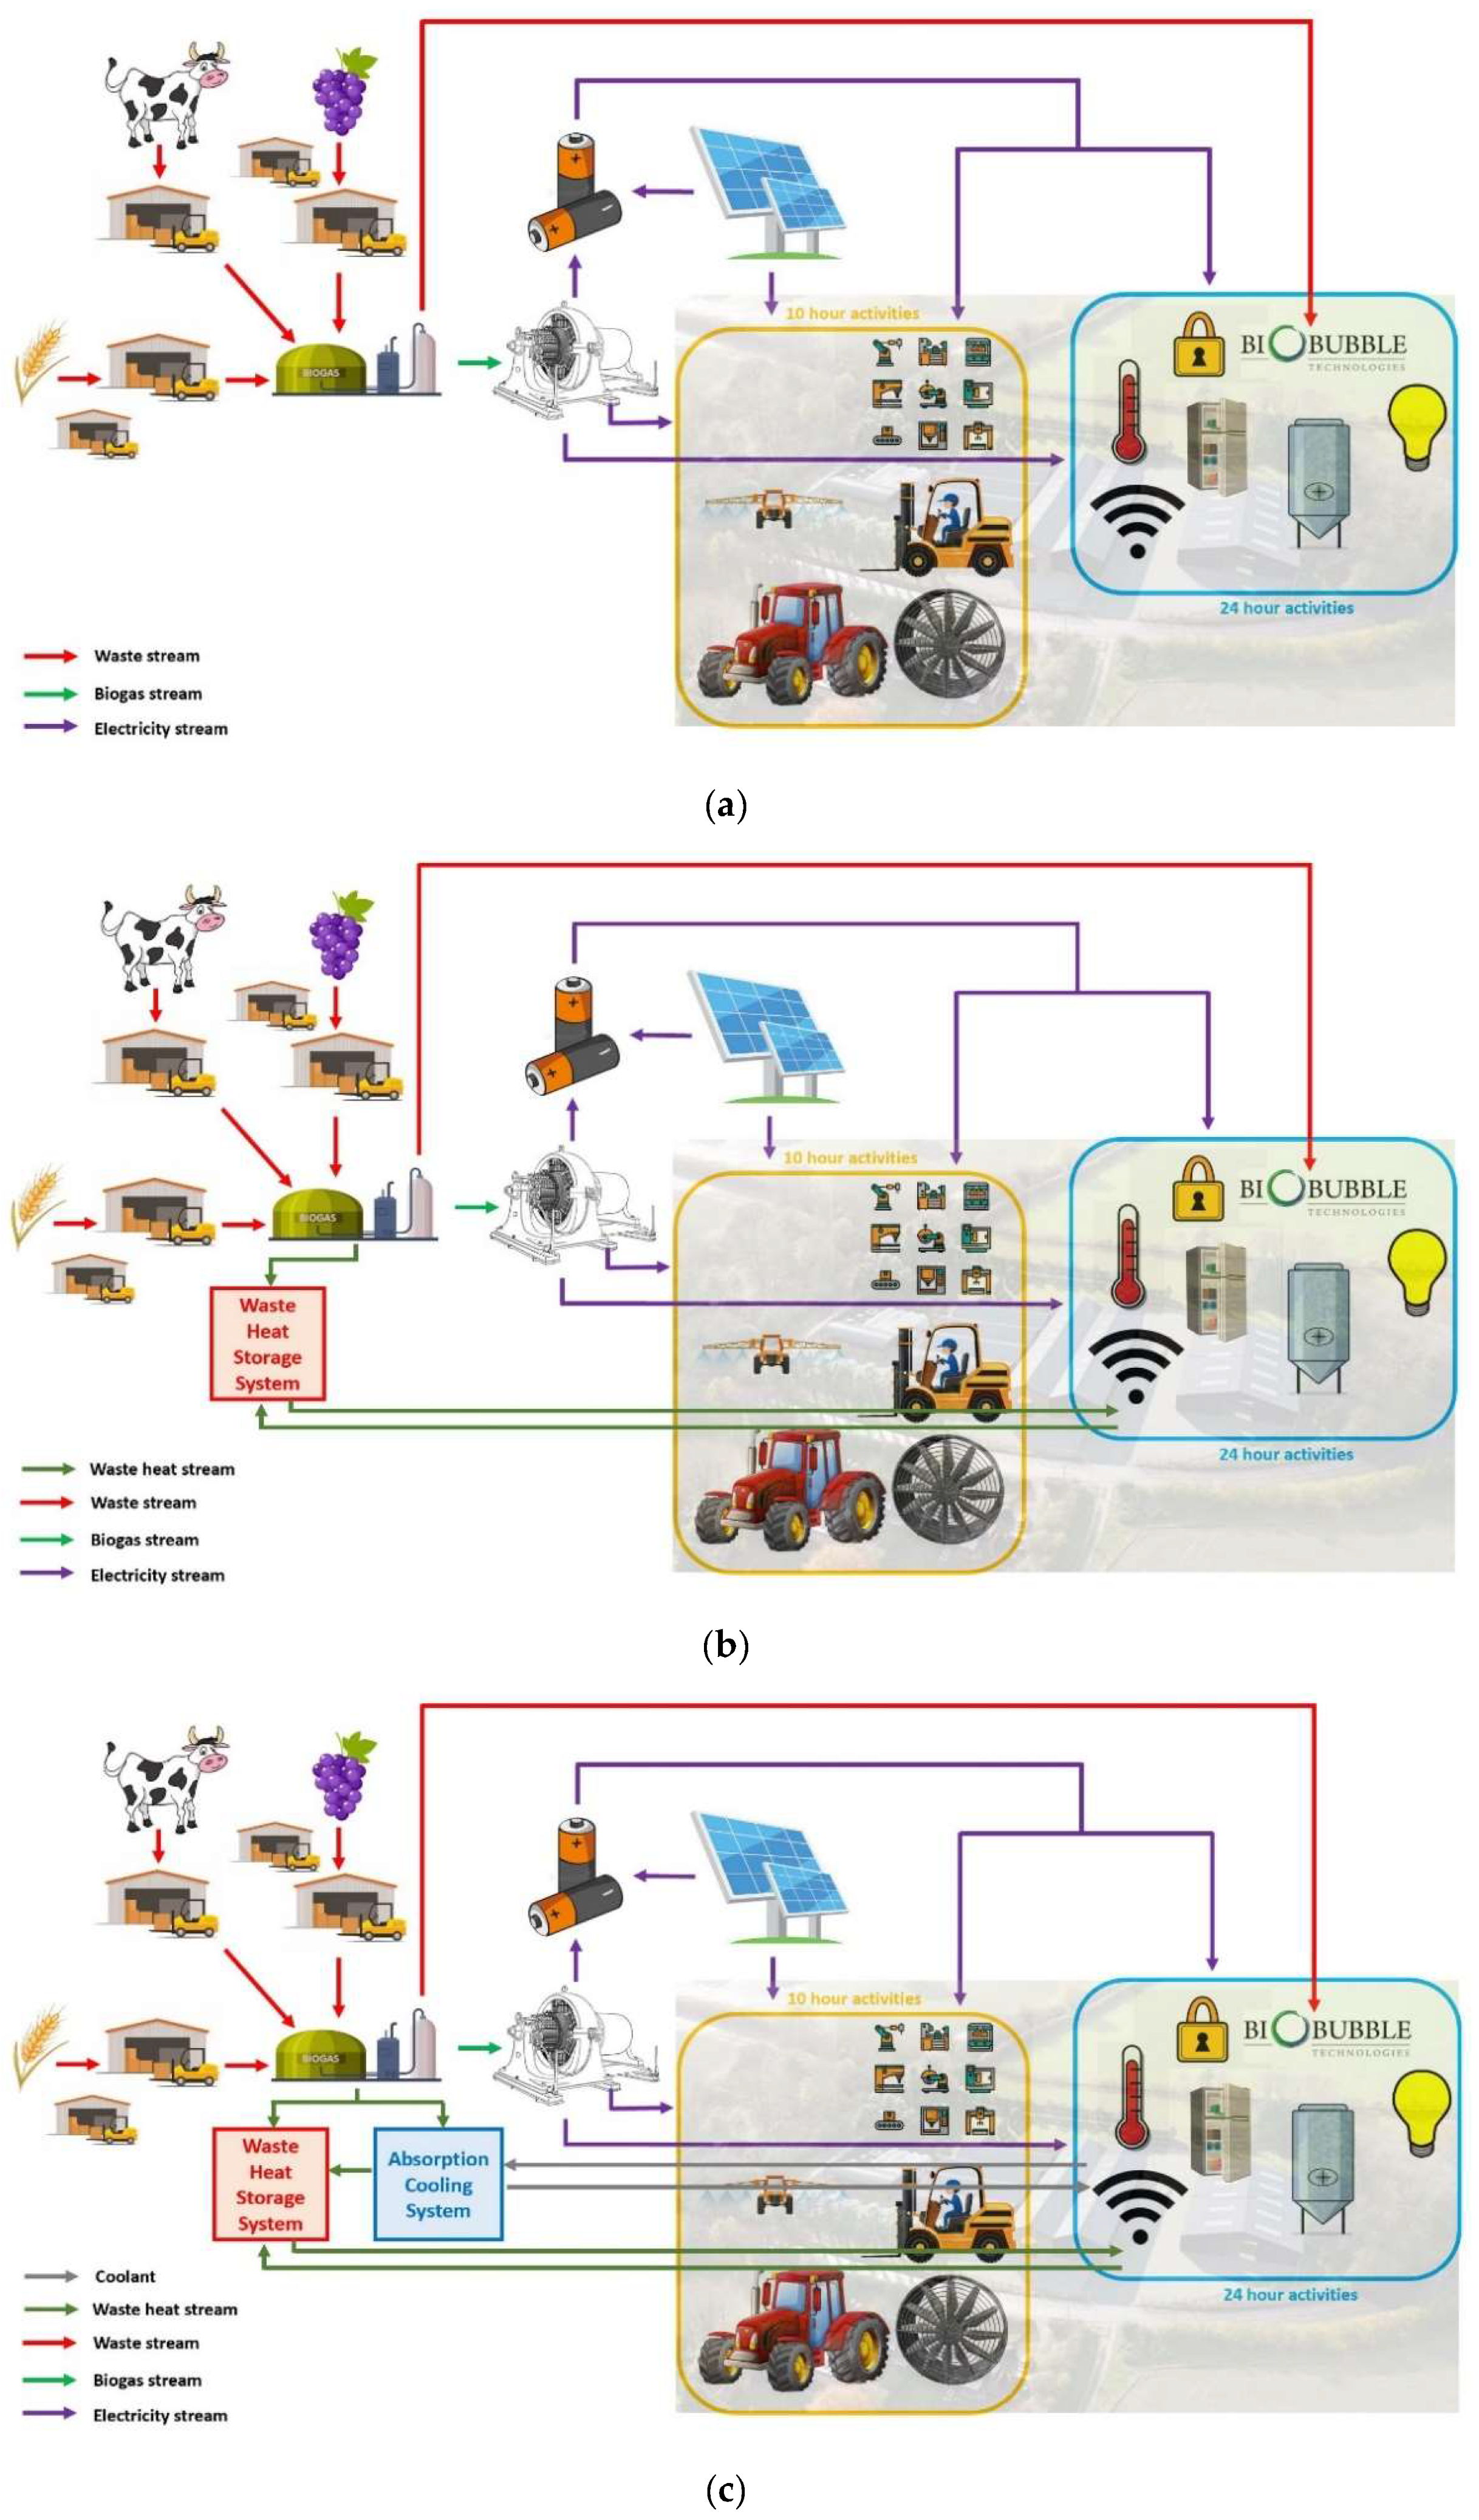
3.1. Option 1
3.2. Option 1a
3.3. Options 2 and 3
3.4. Environmental Impact
3.5. Economic Analysis
4. Discussion
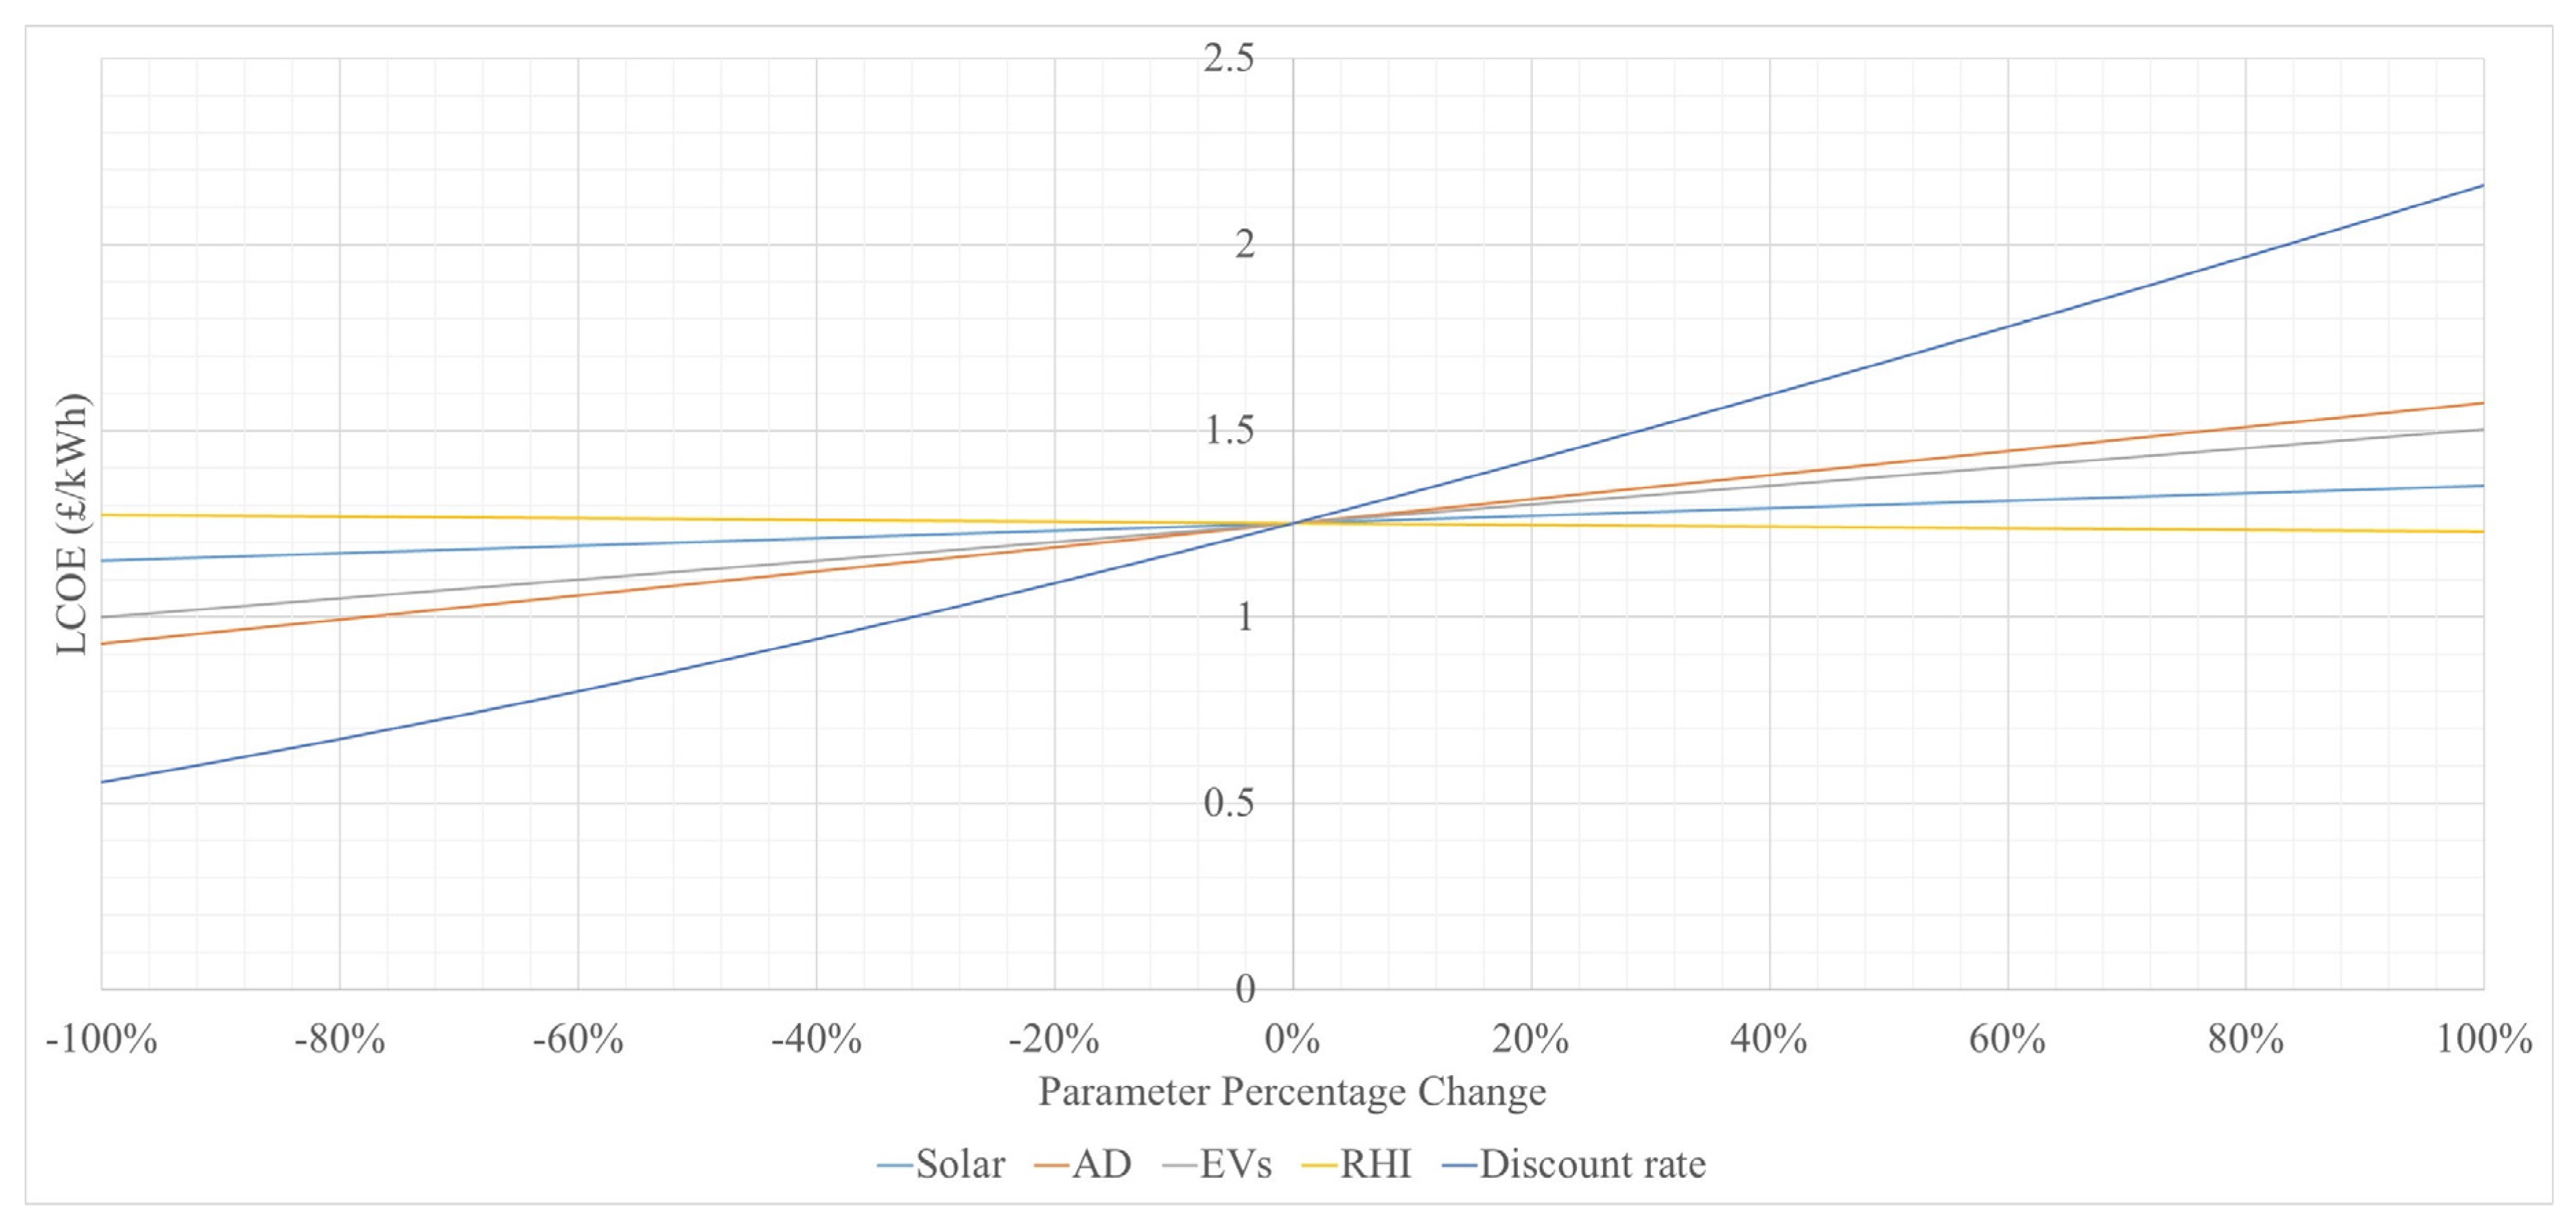
Sensitivity Analysis
5. Conclusions
Author Contributions
Funding
Institutional Review Board Statement
Informed Consent Statement
Data Availability Statement
Acknowledgments
Conflicts of Interest
Nomenclature
| A | Area. |
| AD | Anaerobic digester. |
| CapEx | Capital costs. |
| CCI | Current carbon intensity. |
| CH4 | Methane. |
| CHEW | Carvers Hill Estate Winery. |
| C6H12O6 | Glucose. |
| CHP | Combined heat and power. |
| CO2 | Carbon dioxide. |
| Cp | Specific heat capacity. |
| d | Discount rate. |
| h | Height. |
| H2 | Hydrogen. |
| H2O | Water. |
| LCB | Lignocellulosic biomass. |
| LCOE | Levelized cost of energy. |
| LNG | Liquified natural gas. |
| N | Lifetime of the system. |
| N2 | Nitrogen. |
| O2 | Oxygen. |
| OpEx | Operational costs. |
| PFD | Process flow diagram. |
| PV | Photovoltaic. |
| Q | Annual energy output. |
| Qout | Heat output. |
| RHI | Renewable heat initiative. |
| SEG | Smart export guarantee. |
| SPF | Seasonal performance factor. |
| Tdesired | Desired temperature of room. |
| Toutside | Temperature outside of room. |
| UK | United Kingdom. |
| Win | Energy input. |
| Density. |
References
- United Kingdom Government Property Agency. NET ZERO PROGRAMME: Looking beyond Carbon Emissions. 2022. Available online: https://www.gov.uk/government/case-studies/net-zero-programme-looking-beyond-carbon-emissions (accessed on 11 May 2023).
- Abdullah, M.; Ahmad, M.; Kadir, N.; Nayan, S. Revisiting Energy Consuption and GDP: Evidence from Dynamic Panel Data Analysis. Procedia Econ. Financ. 2013, 7, 42–47. [Google Scholar] [CrossRef]
- GlobalData. United Kingdon (UK) Wine Market Size by Catagories, Distribution Channel, Market Share and Forecast, 2021–2026. 2022. Available online: https://www.globaldata.com/store/report/uk-wine-market-analysis/ (accessed on 7 June 2023).
- Smyth, M.; Nesbitt, A. Energy and English wine production: A review of energy use and benchmarking. Energy Sustain. Dev. 2014, 23, 85–91. [Google Scholar] [CrossRef]
- Wine, G.B. Industry Report 2021–2022. 2022. Available online: https://winegb.co.uk/wp-content/uploads/2022/09/WGB_Industry-Report_2021-2022FINAL.pdf (accessed on 11 May 2023).
- Wine Folly. Top Producing Wine Regions of The World. Available online: https://winefolly.com/lifestyle/top-wine-regions-of-the-world/ (accessed on 23 October 2022).
- European LIFE Programme. LIFE REWIND Project, Intergia. 2017. Available online: https://www.intergia.es/en/life-rewind-2/ (accessed on 7 January 2023).
- Byass, G. 6 Forms of Renewable Energy Driving González Byass Forward. González Byass. 2021. Available online: https://www.gonzalezbyass.com/es-en/news/sustainability/6-forms-renewable-energy-driving-gonzalez-byass-forward (accessed on 9 January 2023).
- Letamendi, J.; Mwabonje, O.; Sevigne-Itoiz, E. Environmental impact analysis of a Chilean organic wine through a life cycle assessment. J. Clean. Prod. 2022, 371, 133368. [Google Scholar] [CrossRef]
- CleanEarth Energy. Avonmouth Wind Turbine ‘A First of Its Kind’ for UK Business, Wadebridge, UK. Available online: https://cleanearthenergy.com/projects/accolade-wines-avonmouth/ (accessed on 9 January 2023).
- Greencroft Estate. Greencroft Two. 2022. Available online: https://www.greencroftbottling.com/greencroft-two/ (accessed on 13 August 2023).
- Indrajeet; Kumar, S.; Rani, J.; Rautela, A. Chapter 4—Biovalorization of winery industry waste to produce value-added products. In Biovalorisation of Wastes to Renewable Chemicals and Biofuels; Elsevier: Amsterdam, The Netherlands, 2020; pp. 63–85. [Google Scholar] [CrossRef]
- Huete, E. Final Report Summary—AD-Wine, Spain. 2015. Available online: https://cordis.europa.eu/project/id/286052/reporting (accessed on 9 January 2023).
- Adetutu, E.; Ball, A.; Makadia, T.; Shahsavaru, E.; Sheppard, P. Effect of anaerobic co-digestion of grape marc and winery wastewater on energy production. Aust. J. Crop Sci. 2016, 10, 57–61. Available online: http://www.cropj.com/sahsavari_10_1_2016_57_61.pdf (accessed on 11 May 2023).
- Fabjanowicz, M.; Kosek, K.; Plotka-Wasylka, J.; Namiesnik, J. Evaluation of the influence of grapevine growing conditions on wine quality. Monatsh. Chem. 2019, 150, 1579–1584. [Google Scholar] [CrossRef]
- WineGB. Carvers Hill Estate. 2022. Available online: https://winegb.co.uk/producers/carvers-hill-estate/ (accessed on 16 October 2022).
- MoreWine. Guide to Red Winemaking. 2008. Available online: https://morewinemaking.com/web_files/intranet.morebeer.com/files/wredw.pdf (accessed on 21 October 2022).
- IMS Heat Pumps. Air Source Heat Pumps & Underfloor Heating: Your Guide. Air Source Heat Pumps. 2019. Available online: https://www.imsheatpumps.co.uk/blog/air-source-heat-pumps-underfloor-heating/ (accessed on 12 November 2022).
- PHAMNews. At What Temperature Does the Heating Go on? Available online: https://www.phamnews.co.uk/at-what-temperature-does-the-heating-go-on/ (accessed on 11 October 2019).
- Virtual Crossing. “SN83NQ 2021-01-01 to 2021-12-31”. 2022. Available online: https://www.visualcrossing.com/weather/weather-data-services (accessed on 14 November 2022).
- Climate Data. Marlborough Climate (United Kingdom). Climate Data for Cities Worldwide. 2022. Available online: https://en.climate-data.org/europe/united-kingdom/england/marlborough-6437/ (accessed on 22 November 2022).
- Princeton University. Mechanics. 2022. Available online: https://www.princeton.edu/~maelabs/hpt/mechanics/mecha_36.htm (accessed on 12 December 2022).
- Evans, P. Properties of Air at Atmospheric Pressure. The Engineering Mindset. 2015. Available online: https://theengineeringmindset.com/properties-of-air-at-atmospheric-pressure/ (accessed on 12 December 2022).
- Meek, C. Heat Pumps and UK’s Decarbonisation: Lessons from an Ofgem Dataset of More than 2000 Domestic Installations. Renewable Energy Consumer Code. 2021. Available online: https://www.recc.org.uk/pdf/performance-data-research-focused.pdf (accessed on 18 November 2022).
- Davies, M. Benchmarking Commercial Building Energy Use Per Square Foot. AltEnergyMag. 2019. Available online: https://www.altenergymag.com/article/2019/07/benchmarking-commercial-building-energy-use-per-square-foot/31381 (accessed on 18 November 2022).
- Marsh, J. How Many Watts Does a Wi-Fi Router Use? Energy Sage. 2022. Available online: https://news.energysage.com/how-many-watts-does-a-wi-fi-router-use/#:~:text=Average%20Wi%2DFi%20routers%20use,is%20to%20install%20solar%20panels (accessed on 15 November 2022).
- Hutson, S. Which Appliances Have the Biggest Impact on My Energy Bills? Compare the Market. 2022. Available online: https://www.comparethemarket.com/energy/content/which-appliances-use-the-most-energy/ (accessed on 5 November 2022).
- Andrei, H.; Diaconu, E.; Enescu, A.; Ion, V. Energy Consumption Analysis of Security Systems for a Residential Consumer. In Proceedings of the 11th International Symposium of Advanced Topics in Electrical Engineering, Bucharest, Romania, 28–30 March 2019. [Google Scholar] [CrossRef]
- Smith, K. A Frosty Start to 2021—Don’t Blame It on the Bougie. Academie du Vin Library. 2021. Available online: https://academieduvinlibrary.com/a-frosty-start-to-2021-dont-blame-it-on-the-bougie/ (accessed on 19 December 2022).
- National Grid. How Has Our Use of Renewables Changed? 2022. Available online: https://www.nationalgrid.com/stories/energy-explained/how-much-uks-energy-renewable (accessed on 19 December 2022).
- Wright, M.M.; Uddin, M.M. Anaerobic digestion fundamentals, challenges, and technological advances. Phys. Sci. Rev. 2022, 8. [Google Scholar] [CrossRef]
- Kell, C.J.K. Anaerobic Co-Digestion of Fruit Juice Industry Wastes with Lignocellulosic Biomass. 2019. Available online: http://hdl.handle.net/10019.1/106145 (accessed on 10 December 2022).
- Amico Gas Power Co., Ltd. Made-in-China. 2023. Available online: https://cnamico.en.made-in-china.com/product/RSKxTMEjIAYm/China-15kw-Biogas-Cogeneration-CHP-.html (accessed on 14 March 2023).
- Qube Renewables. BioQUBE40 System for Food Waste. Personal communication, 2023. [Google Scholar]
- Nesbitt Farms. Welcome to the Farm. 2020. Available online: https://nesbittfarms.co.uk/ (accessed on 24 November 2022).
- Lemon, H. How Do You Like Them Apples? 8 Indie Drinks Brands That Are All About Small Orchard Presses. The Handbook. 2021. Available online: https://www.thehandbook.com/how-do-you-like-them-apples-8-indie-drinks-brands-that-are-all-about-small-orchard-presses/ (accessed on 10 January 2023).
- A Geographical Profile of Livestock Manure Production in Canada. 2006. Available online: https://www150.statcan.gc.ca/n1/pub/16-002-x/2008004/article/10751-eng.htm (accessed on 14 March 2023).
- Biogas. The Official Information Portal on Anaerobic Digestion. 2022. Available online: https://www.biogas-info.co.uk/about/biogas/ (accessed on 17 December 2022).
- Department for Environment Food & Rural Affairs. Farm Energy Use: Results from the Farm Business Survey: England 2011/12. 2013. Available online: https://assets.publishing.service.gov.uk/government/uploads/system/uploads/attachment_data/file/230090/fbs-energyuse-statsnotice-16aug13.pdf (accessed on 12 March 2023).
- The University of Ulster. ECLIPSE Process Simulator; Energy Research Centre: Jordanstown, Northern Ireland, 1992. [Google Scholar]
- Wadley, R. Anaerobic Digestion. Department of Environment and Conservation. Available online: https://www.tn.gov/environment/program-areas/sw-mm-organics/anaerobic-digestion.html (accessed on 21 March 2023).
- Devlin, G. Biomas-to-Energy Systems: A Review of the Potential Role of the Irish Agri-Food Sector; Research Report by Bioresources Re-search Centre, University College Dublin, Earlsfort Terrace, Dublin, Ireland. 2007, p. 146. Available online: https://www.researchgate.net/publication/265421407_Biomass-to-Energy_Systems_A_Review_of_the_Potential_Role_of_the_Irish_Agri-_Food_Sector (accessed on 11 May 2023).
- Saepudin, A.; Wresta, A. Analysis of Product and Temperature of Biogas Combustion. Indones. J. Chem. 2018, 18, 211–221. Available online: https://www.researchgate.net/publication/325521159_Analysis_of_Product_and_Temperature_of_Biogas_Combustion_in_Various_Air_Biogas_Equivalence_Ratio_and_Methane_Content/fulltext/5b11f083a6fdcc4611dbee3d/Analysis-of-Product-and-Temperature-of-Biogas-Combust (accessed on 11 May 2023).
- Bayless, D.; Urieli, I. Chapter 11: Combustion. 2021. Available online: https://www.ohio.edu/mechanical/thermo/Applied/Chapt.7_11/Chapter11.html (accessed on 21 March 2023).
- Qube Renewables. Outline Costings & Modelling. Personal communication, 2023. [Google Scholar]
- Carroquino, J.; Garcia-Casarejos, N.; Gargallo, P. Introducing renewable energy in vineyards and agricultural machinery: A way to reduce emissions and provide sustainability. Wine Stud. 2017, 6, 5–9. [Google Scholar] [CrossRef]
- The AD Centre. Mesophilic and Thermophilic Systems. 2023. Available online: https://www.walesadcentre.org.uk/ad-information/technologies/mesophilic-and-thermophilic-systems/ (accessed on 15 March 2023).
- Profil.fi. El.power 15 kW + HeatPower 30 kW NG Generator. 2022. Available online: https://profil.fi/generators-and-chp-ng-and-lpg-generators/el-power-15kw-heatpower-30-kw-ng-generator?language=en (accessed on 7 January 2023).
- Huang, Y.; Purdy, A.; Parthare, P.B.; Roskilly, A.; Wang, Y. Towards sustainable farming: Feasibility study into energy recovery from bio-waste on a small-scale dairy farm. J. Clean. Prod. 2018, 174, 899–904. [Google Scholar] [CrossRef]
- Alibaba. Transfer Waste into Energy and Electricity Generation Biogas Digester for Farm 20FT Container Integrated Bio Gas Plant System, Shenzhen Puxin Technology Co., Ltd. 2023. Available online: https://www.alibaba.com/product-detail/Transfer-Waste-into-Energy-and-Electricity_62397825824.html?spm=a2700.7735675.0.0.7ae45eb5sX5g0a (accessed on 3 March 2023).
- Environment Agency. Material Comparators for End-of-Waste Decisions, Environment Agency, Bristol. 2016. Available online: https://assets.publishing.service.gov.uk/government/uploads/system/uploads/attachment_data/file/545567/Material_comparators_for_fuels_-_natural_gas.pdf (accessed on 11 May 2023).
- International Energy Agency (IEA). Global Status Report for Buildings and Construction 2019. 2019. Available online: https://www.iea.org/reports/global-status-report-for-buildings-and-construction-2019 (accessed on 19 March 2023).
- Department for Environment Food & Rural Affairs. Waste Management Plan for England. Crown, London. 2021. Available online: https://assets.publishing.service.gov.uk/media/60103f71d3bf7f05bc42d294/waste-management-plan-for-england-2021.pdf (accessed on 11 May 2023).
- Holt, T.; Packey, D.; Short, W. A Manual for the Economic Evaluation of Energy Efficiency and Renewable Energy Technologies; US Department of Energy: Golden, CO, USA, 1995. Available online: https://www.nrel.gov/docs/legosti/old/5173.pdf (accessed on 11 May 2023).
- Oxera Consulting. Discount Rates for Low-Carbon and Renewable Generation Technologies, Belgium. 2011. Available online: https://www.oxera.com/wp-content/uploads/2018/03/Oxera-report-on-low-carbon-discount-rates.pdf (accessed on 15 March 2023).
- Ofgem. About the Smart Export Guarantee (SEG). 2022. Available online: https://www.ofgem.gov.uk/environmental-and-social-schemes/smart-export-guarantee-seg (accessed on 15 March 2023).
- Dimaratos, A.; Doulgeris, S.; Kontses, A.; Samaras, Z.; Toumasatos, Z.; Triantafyllopoulos, G. Assessment of CO2 and NOx Emissions of One Diesel and ONe Bi-Fuel Gasoline/CNG Euro 6 Vehicles During Real-World Driving and Laboratory Testing. Front. Mech. Eng. 2019, 5, 62. [Google Scholar] [CrossRef]
- Alvine, K.; Goraya, B.; Jubault, M.; Oberbeck, L. IPVF/s PV technology vision for 2030. Prog. Photovolt. Res. Appl. 2022, 28, 1207–1214. [Google Scholar] [CrossRef]
- Solar Energy Technologies Office. 2030 Solar Cost Targets. 2021. Available online: https://www.energy.gov/eere/solar/articles/2030-solar-cost-targets (accessed on 17 March 2023).
- Birman, J.; Burdloff, J.; De Peufeilhoux, H.; Erbs, G.; Feniou, M.; Luicille, P. Geographical Analysis of Biomethane Potential and Costs in Europe in 2050; Engie: La Défense, France, 2021; Available online: https://www.engie.com/sites/default/files/assets/documents/2021-07/ENGIE_20210618_Biogas_potential_and_costs_in_2050_report_1.pdf (accessed on 11 May 2023).
- Barlett, J.; Ehimen, E.; Lyons, G.; Piillai, S.; Power, N.; O’Connor, S. An Investigation of the Potential Adoption of Anaerobic Digestion for Energy Production in Irish Farms. Environments 2021, 8, 8. [Google Scholar] [CrossRef]
- Schmidt, B. One Out of Three Used Cars in UK Will Be Electric by 2030. The Driven. 2022. Available online: https://thedriven.io/2022/07/15/one-out-of-three-used-cars-in-uk-will-be-electric-by-2030/#:~:text=Electric%20cars%20will%20take%20up,Manufacturers%20and%20Trader%20(SMMT) (accessed on 12 March 2023).
- Partridge, J. Electric Cars ‘Will Be Cheaper to Produce than Fossil Fuel Vehicles by 2027′. The Guardian. 2021. Available online: https://www.theguardian.com/business/2021/may/09/electric-cars-will-be-cheaper-to-produce-than-fossil-fuel-vehicles-by-2027 (accessed on 12 March 2023).
- U.S. Energy Information Administration. Annual Energy Outlook. 2021. Available online: https://www.eia.gov/outlooks/aeo/pdf/appa.pdf (accessed on 11 May 2023).
- Grantham Institute. Impacts of a Carbon Tax on Different Household Types in the UK in 2030. 2022. Available online: https://www.lse.ac.uk/granthaminstitute/wp-content/uploads/2020/03/Report-1-Infographic_distributional-impacts-of-carbon-tax-in-UK-by-household-type.pdf (accessed on 11 May 2023).
- International Energy Agency (IEA). Renewable Electricity. 2022. Available online: https://www.iea.org/reports/renewable-electricity (accessed on 12 March 2023).
- Ofgem. Smart Export Guarantee (SEG) Annual Report 2020–2021. 2021. Available online: https://www.ofgem.gov.uk/sites/default/files/2021-09/SEG%202020-21%20Annual%20Report.pdf (accessed on 11 May 2023).


| Waste | Literature on Waste Amount | Prediction on Waste for CHEW (Tonnes per Year) | Amount of Biogas Produced (m3/tonne of Waste) | Total Amount of Biogas (m3) |
|---|---|---|---|---|
| Grape stalks | 5 tonnes per hectare per year (7.5% of solid waste) | 27.5 | 25.42 | 700 |
| Grape pomace | 45% of solid waste so 30 tonnes per hectare | 165 | 27.68 | 3110 |
| Grape seeds | 6% of solid waste so 4 tonnes per hectare | 22 | 110.11 | 950 |
| Vine pruning | Linear relationship based on vine planting densities | 10 | 25.42 | 250 |
| Lees | 31,000 tonnes for 1,605,846 tonnes of fruit crushed | 0.29 | 25.72 | 10 |
| Wastewater | 6 litres per litre of wine produced | 90 | 0.17 | 20 |
| Carbon | Hydrogen | Oxygen | Nitrogen | Sulphur | Sodium | |
|---|---|---|---|---|---|---|
| Option 1 | 50.01 | 6.17 | 39.39 | 2.75 | 0.98 | 0.70 |
| Option 1a | 42.33 | 6 | 49.12 | 2.55 | - | - |
| Option 2 | 71.90 | 23.86 | 0.57 | 3.67 | 0.00 | 0.00 |
| Option 1 | Option 1a | Option 2a | Option 2b | Option 3 | |
|---|---|---|---|---|---|
| Feedstock | Biogas (Winery Waste) | Biogas (Cow) | Natural Gas (Pipe) | Natural Gas (LNG) | Grid/Diesel |
| Technical results | |||||
| Feedstock input, kg/s | 0.03999 | 0.03999 | - | - | - |
| Bio/Natural gas input, kg/s | 0.00235 | 0.00235 | 0.00101 | 0.00101 | - |
| Total energy input (kW) | 51 | 44 | 49 | 49 | |
| Electrical output, kWe (CHP mode) | 14 | 14 | 15 | 15 | - |
| Heat output, kWthermal (CHP mode) | 22 | 22 | 30 | 30 | - |
| Electrical efficiency, % | 31.82% | 31.82% | 28.7% | 28.7% | - |
| Overall CHP efficiency, % | 71.29% | 81.82% | 91.80% | 91.80% | |
| Heat/electricity ratio (CHP) | 1.57 | 1.57 | 2.00 | 2.00 | - |
| CO2 emissions, kg/year | 145,066 | 145,066 | 97,131 | 97,131 | 41,063 |
| Reduction in CO2 emissions, kg/year | 41,063 | 41,063 | 0 | 0 | 56,068 |
| Economic results | |||||
| Lifetime | 25 | 25 | 25 | 25 | 25 |
| Feedstock price, £/year | £0.00 | £12,184.62 | £29,925.65 | £121,149.83 | £60,791.26 |
| Capital costs (£) | £674,777.46 | £545,108.60 | £600,524.74 | £200,024.74 | £216,241.52 |
| Operational costs (£) | £64,634.17 | £62,354.38 | £75,516.03 | £138,705.21 | £79,481.81 |
| Total operational cost over lifetime (£) | £1,615,854.28 | £1,558,859.57 | £1,887,900.75 | £3,467,630.25 | £1,987,045.25 |
| LCOE | £1.27 | £1.18 | £1.38 | £1.98 | £1.23 |
| Economic results (Incentivised) | |||||
| Capital costs (£) | £674,777.46 | £545,108.60 | £600,524.74 | £200,024.74 | £216,241.52 |
| Operational costs (£) | £64,634.17 | £62,354.38 | £83,580.81 | £146,769.99 | £79,618.98 |
| Total operational cost over lifetime (£) | £1,615,854.28 | £1,558,859.57 | £1,887,900.75 | £3,669,249.76 | £1,990,474.43 |
| LCOE (£/kWh) | £1.25 | £1.16 | £1.48 | £2.08 | £1.23 |
Disclaimer/Publisher’s Note: The statements, opinions and data contained in all publications are solely those of the individual author(s) and contributor(s) and not of MDPI and/or the editor(s). MDPI and/or the editor(s) disclaim responsibility for any injury to people or property resulting from any ideas, methods, instructions or products referred to in the content. |
© 2023 by the authors. Licensee MDPI, Basel, Switzerland. This article is an open access article distributed under the terms and conditions of the Creative Commons Attribution (CC BY) license (https://creativecommons.org/licenses/by/4.0/).
Share and Cite
Hall-Smith, S.; Wang, Y.; Huang, Y. Techno-Economic Study of a Distributed Renewable Power System for a British Winery. Sustainability 2023, 15, 14410. https://doi.org/10.3390/su151914410
Hall-Smith S, Wang Y, Huang Y. Techno-Economic Study of a Distributed Renewable Power System for a British Winery. Sustainability. 2023; 15(19):14410. https://doi.org/10.3390/su151914410
Chicago/Turabian StyleHall-Smith, Sophie, Yaodong Wang, and Ye Huang. 2023. "Techno-Economic Study of a Distributed Renewable Power System for a British Winery" Sustainability 15, no. 19: 14410. https://doi.org/10.3390/su151914410