Article

Stochastic Optimization Model of Capacity Configuration for Integrated Energy Production System Considering Source-Load Uncertainty

1
College of Energy and Electrical Engineering, Hohai University, Nanjing 211100, China
2
Smart Grid Research Institute, Nanjing Institute of Technology, Nanjing 211167, China
*
Author to whom correspondence should be addressed.
Sustainability 2023, 15(19), 14247; https://doi.org/10.3390/su151914247
Submission received: 23 August 2023 / Revised: 11 September 2023 / Accepted: 22 September 2023 / Published: 26 September 2023

Abstract

:
China’s carbon neutrality strategy has expedited a transition towards greener and lower-carbon integrated energy systems. Faced with the problem that the central position of thermal power cannot be transformed quickly, utilizing traditional thermal power units in a low-carbon and efficient manner is the premise to guarantee green energy development. This study focuses on the integrated energy production system (IEPS) and a stochastic optimization model for capacity configuration that integrates carbon capture storage and power-to-gas while considering source-load uncertainty. Firstly, carbon capture storage and power-to-gas technologies are introduced, and the architecture and models of the IEPS are established. The carbon and hydrogen storage equipment configuration enhances the system’s flexibility. Also, source-load uncertainty is considered, and a deterministic transformation is applied using the simultaneous backward reduction algorithm combined with K-means clustering. The paper simulates the optimal capacity configuration of the IEPS in a park energy system in Suzhou, China. Furthermore, the research performs a sensitivity analysis on coal, natural gas, and carbon tax prices. Case studies verified that IEPS can realize the recycling of electricity, gas, hydrogen, and carbon, with remarkable characteristics of low-carbon, flexibility, and economical. Stochastic optimized capacity allocation results considering source-load uncertainty are more realistic. Sensitivity intervals for energy prices can reference pricing mechanisms in energy markets. This study can provide ideas for the transition of China’s energy structure and offer directions to the low-carbon sustainable development of the energy system.

1. Introduction

1.1. Motivations

The energy crisis and climate change have become vital issues that restrict the healthy development of economic society [1,2]. To mitigate climate change and reduce environmental pollution, the energy technology revolution and low-carbon development have become a global consensus [3,4]. The energy system needs to transition from dependence on fossil fuels to clean energy [5]. In September 2020, China put forward the strategic goal of carbon peaking and neutrality [6]. The country has also taken a series of energy conversation and carbon reduction measures, such as vigorously developing new energy [7], the cleaner upgraded of traditional coal-fired power plants [8] and establishing the carbon trading market [9]. In recent years, clean energy, mainly wind and solar power, has developed remarkably. By the end of 2022, China’s total installed wind and photovoltaic (PV) power capacity reached 758 GW, representing 29.6% of the country’s total installed capacity. The full installed thermal power capacity is 1.332 TW, meaning 52% of the total installed capacity. Furthermore, in 2022, the proportion of thermal power generation to entire power generation is below 70% for the first time. China’s low-carbon energy system transformation is progressing rapidly, but it still faces two main difficulties. In the short term, thermal power will remain China’s primary electricity source. Therefore, the main challenge in China’s electricity development is the clean utilization and gradual retirement of many thermal power units. In addition, with the rapid construction of new energy, mainly wind power and photovoltaic, large-scale new energy generation and grid interconnection problems are highlighted, and the accommodation and large-scale utilization of high penetration of renewable clean energy are still facing development difficulties. In 2022, China’s thermal power generation accounted for 69.8% of the total. The scale of thermal power units in operation accounted for about half of the world, and the average service time was only 12 years, far from retirement. Therefore, studying how to promote and coordinate renewable energy development and the clean and efficient use and gradual decommissioning of traditional thermal power is the main challenge in encouraging the energy system’s low-carbon transformation and sustainable development.
The integrated energy system (IES) can realize the complementary coordination and gradient utilization of multiple heterogeneous energy systems, which is conducive to improving the efficiency of energy utilization, promoting the consumption of clean energy, and supporting the low-carbon sustainable development of the energy system, and provides new ideas and methods for solving the above problems [10,11]. However, the uncertainty of renewable energy output and load may make it difficult for IES planning and operation schemes to achieve the expected effect. It is urgent to study how to overcome the impact of uncertainty on IES system planning and operation. Carbon capture and storage (CCS), power-to-gas (P2G), vehicle-to-grid (V2G), and energy storage technologies are crucial to realizing the low-carbon potential of IES and facilitating the transition as new technologies to reduce carbon emissions from fossil energy combustion and improve the accommodation of renewable energy [12,13]. By integrating CCS equipment, traditional thermal power plants can be upgraded to carbon capture power plants. The equipment captures and stores carbon dioxide emissions from the power generation process, making it convenient to seal and utilize, consequently minimizing the carbon emissions of thermal power plants [14]. The P2G technology uses abundant clean and renewable energy (such as wind and PV) to electrolyze water to produce hydrogen [15,16]. The produced hydrogen is combined with CO2 captured by CCS as a raw production material to produce methane. The thermal power plants coupling with CCS and P2G can realize the recycling of system resources while creating natural gas resources, reducing carbon dioxide emissions, and promoting clean energy accommodation [17,18]. With the large-scale new energy fed into the grid and the reduction of source-side flexibility resources, energy storage systems (ESS), electric vehicles (EV), and V2G have gradually become effective means to enhance the flexibility of IES [19]. Therefore, the main challenges faced by current energy development lie in effectively considering multiple uncertainty factors, integrating diverse clean and efficient energy utilization technologies, establishing an IES planning and operation model that aligns with green and sustainable energy development goals, as well as harnessing the inherent advantages of IES including flexibility, reliability, safety, efficiency, and environmental friendliness.

1.2. Literature Review

For the uncertainty of IES, existing studies mainly focus on the uncertainty of new energy output and load. The commonly used optimization methods for uncertainty treatment mainly include stochastic optimization [20], robust optimization [21], and fuzzy optimization [22]. Stochastic optimization is mainly based on probability theory analysis methods, relying on the probability distribution information of uncertain quantities. Fuzzy optimization uses the membership function to describe uncertainty, which has intense subjectivity. The robust optimization method makes decisions based on the worst-case scenario, and the results are relatively conservative. Stochastic optimization methods based on scenario analysis are gaining more and more attention in the planning and operation of IES. However, the current challenge is ensuring that a large number of stochastic scenarios reduced to a set of typical scenarios can better characterize the original scenarios.
For the flexibility improvement of IES, the existing research mainly focuses on the technologies and measures with ESS and EV. Ref. [23] proposed an interactive control framework of ESS for energy community services and verified the flexibility of ESS through real-life scenarios. Ref. [24] proposed an optimal control technology for power flow control of renewable energy systems to equip wind power and PV units with ESS. In addition to the ESS, EVs, vehicle-to-building, and vehicle-to-home to achieve energy transfer can also effectively improve the flexibility of the IES [19,25]. With the rapid development of new energy, more flexible resources will be needed to meet the flexible economic scheduling of the IES.
For the low-carbon sustainable development technology of IES, the existing research mainly explores CCS and P2G. Ref. [26] investigated the low-carbon economic dispatch of thermal power plants with integrated CCS systems. It verified that applying CCS to conventional thermal power plants can notably decrease carbon emissions. Ref. [27] considers CCS technology as the basic to low-carbon development in the electricity department, analyzes the influence of the CCS technology on the cost of electricity generation and power system dispatch, and performs a sensitivity analysis of carbon capture efficiency and type of fuel by establishing an evaluation index system. In [28], the idea of the IEPS with integrated CCS was proposed, and the operation mechanism of the IEPS was elucidated, but the uncertainty of the source and load sides output needed to be considered for the capacity configuration process. Hydrogen is a green secondary energy source with high calorific value and high utilization efficiency. Hydrogen gas, as a fuel for gas turbines, has technological feasibility, economic benefits, and environmental friendliness [29]. As a significant component of the low-carbon transformation, green hydrogen energy is produced using abundant renewable energy electrolytic water, which can promote renewable energy accommodation and provide raw materials for hydrogen energy and methane for the energy system. [30,31] verified that a suitable allocation of the P2G system in the IEPS, including hydrogen production, compression, and storage equipment, can recover more than 70% of excess wind power by using extra wind power for hydrogen production. Given the future integrated energy system with a high penetration of clean energy, [32] utilized the advantages of convenient storage and transportation of green hydrogen energy to construct planning and configuration methods for an electricity-hydrogen IES considering P2G technology. Then, it adopted the robust optimization method to optimize the uncertainty of the load. Ref. [33] proposed recycling the heat generated during the mechanization process of P2G to improve the system’s overall efficiency. Ref. [34] integrated three types of energy, electricity, hydrogen, and natural gas, through P2G and established a construction configuration model for a P2G plant from both technical and market perspectives to increase the proportion rate of clean energy sources.
In summary, existing studies are exploring the application of CCS and P2G technologies in the IES, but few studies have considered both the carbon reduction role and flexibility of CCS and P2G in the IEPS. It cannot fully use various resources in the IES to recycle electricity, hydrogen, natural gas, and CO2 in the system and diversify services outside it. There are few studies on capacity optimization allocation of the IES to configure carbon and hydrogen storage equipment for CCS and P2G to improve the economy and flexibility of the IES. For the multiple uncertainties in the IES, it is also necessary to explore more reasonable and accurate optimization methods based on the actual planning and operation needs.

1.3. Contributions and Paper Organization

To address the abovementioned problems, this study takes an integrated energy production system (IEPS) as the research object. It establishes a stochastic optimal allocation model for the IEPS integrating CCS, P2G, carbon storage, and hydrogen storage, considering the uncertainty of source-load sides. This study employs the IEPS as a platform, integrating advanced technologies such as CCS and P2G, to promote PV accommodation while mitigating carbon emissions from the system. Carbon and hydrogen storage devices are also incorporated into the IEPS to enhance system flexibility and economic viability, enabling time-shifted energy utilization and recycling of carbon dioxide and hydrogen. Furthermore, an improved stochastic optimization method is employed to address source-load uncertainties effectively, thereby eliminating their impact on the system while enhancing the validity and accuracy of the IEPS model. Considering China’s current energy structure predominantly relies on thermal power and cannot be rapidly transformed, this study proposes a stochastic optimal allocation model for IEPS. The model considers the uncertainty of energy sources and demand while integrating CCS, P2G, and multi-dimensional energy storage technologies. This approach effectively ensures the low-carbon and high-efficiency utilization of thermal power, facilitates the accommodation of renewable energies, supports China’s energy transition goals towards carbon neutrality, and enables the recycling of multiple energy sources such as electricity, gas, hydrogen, and carbon dioxide. Furthermore, it enhances overall energy utilization efficiency while providing valuable insights for the green and sustainable development of the energy system.
The main contributions are as follows:
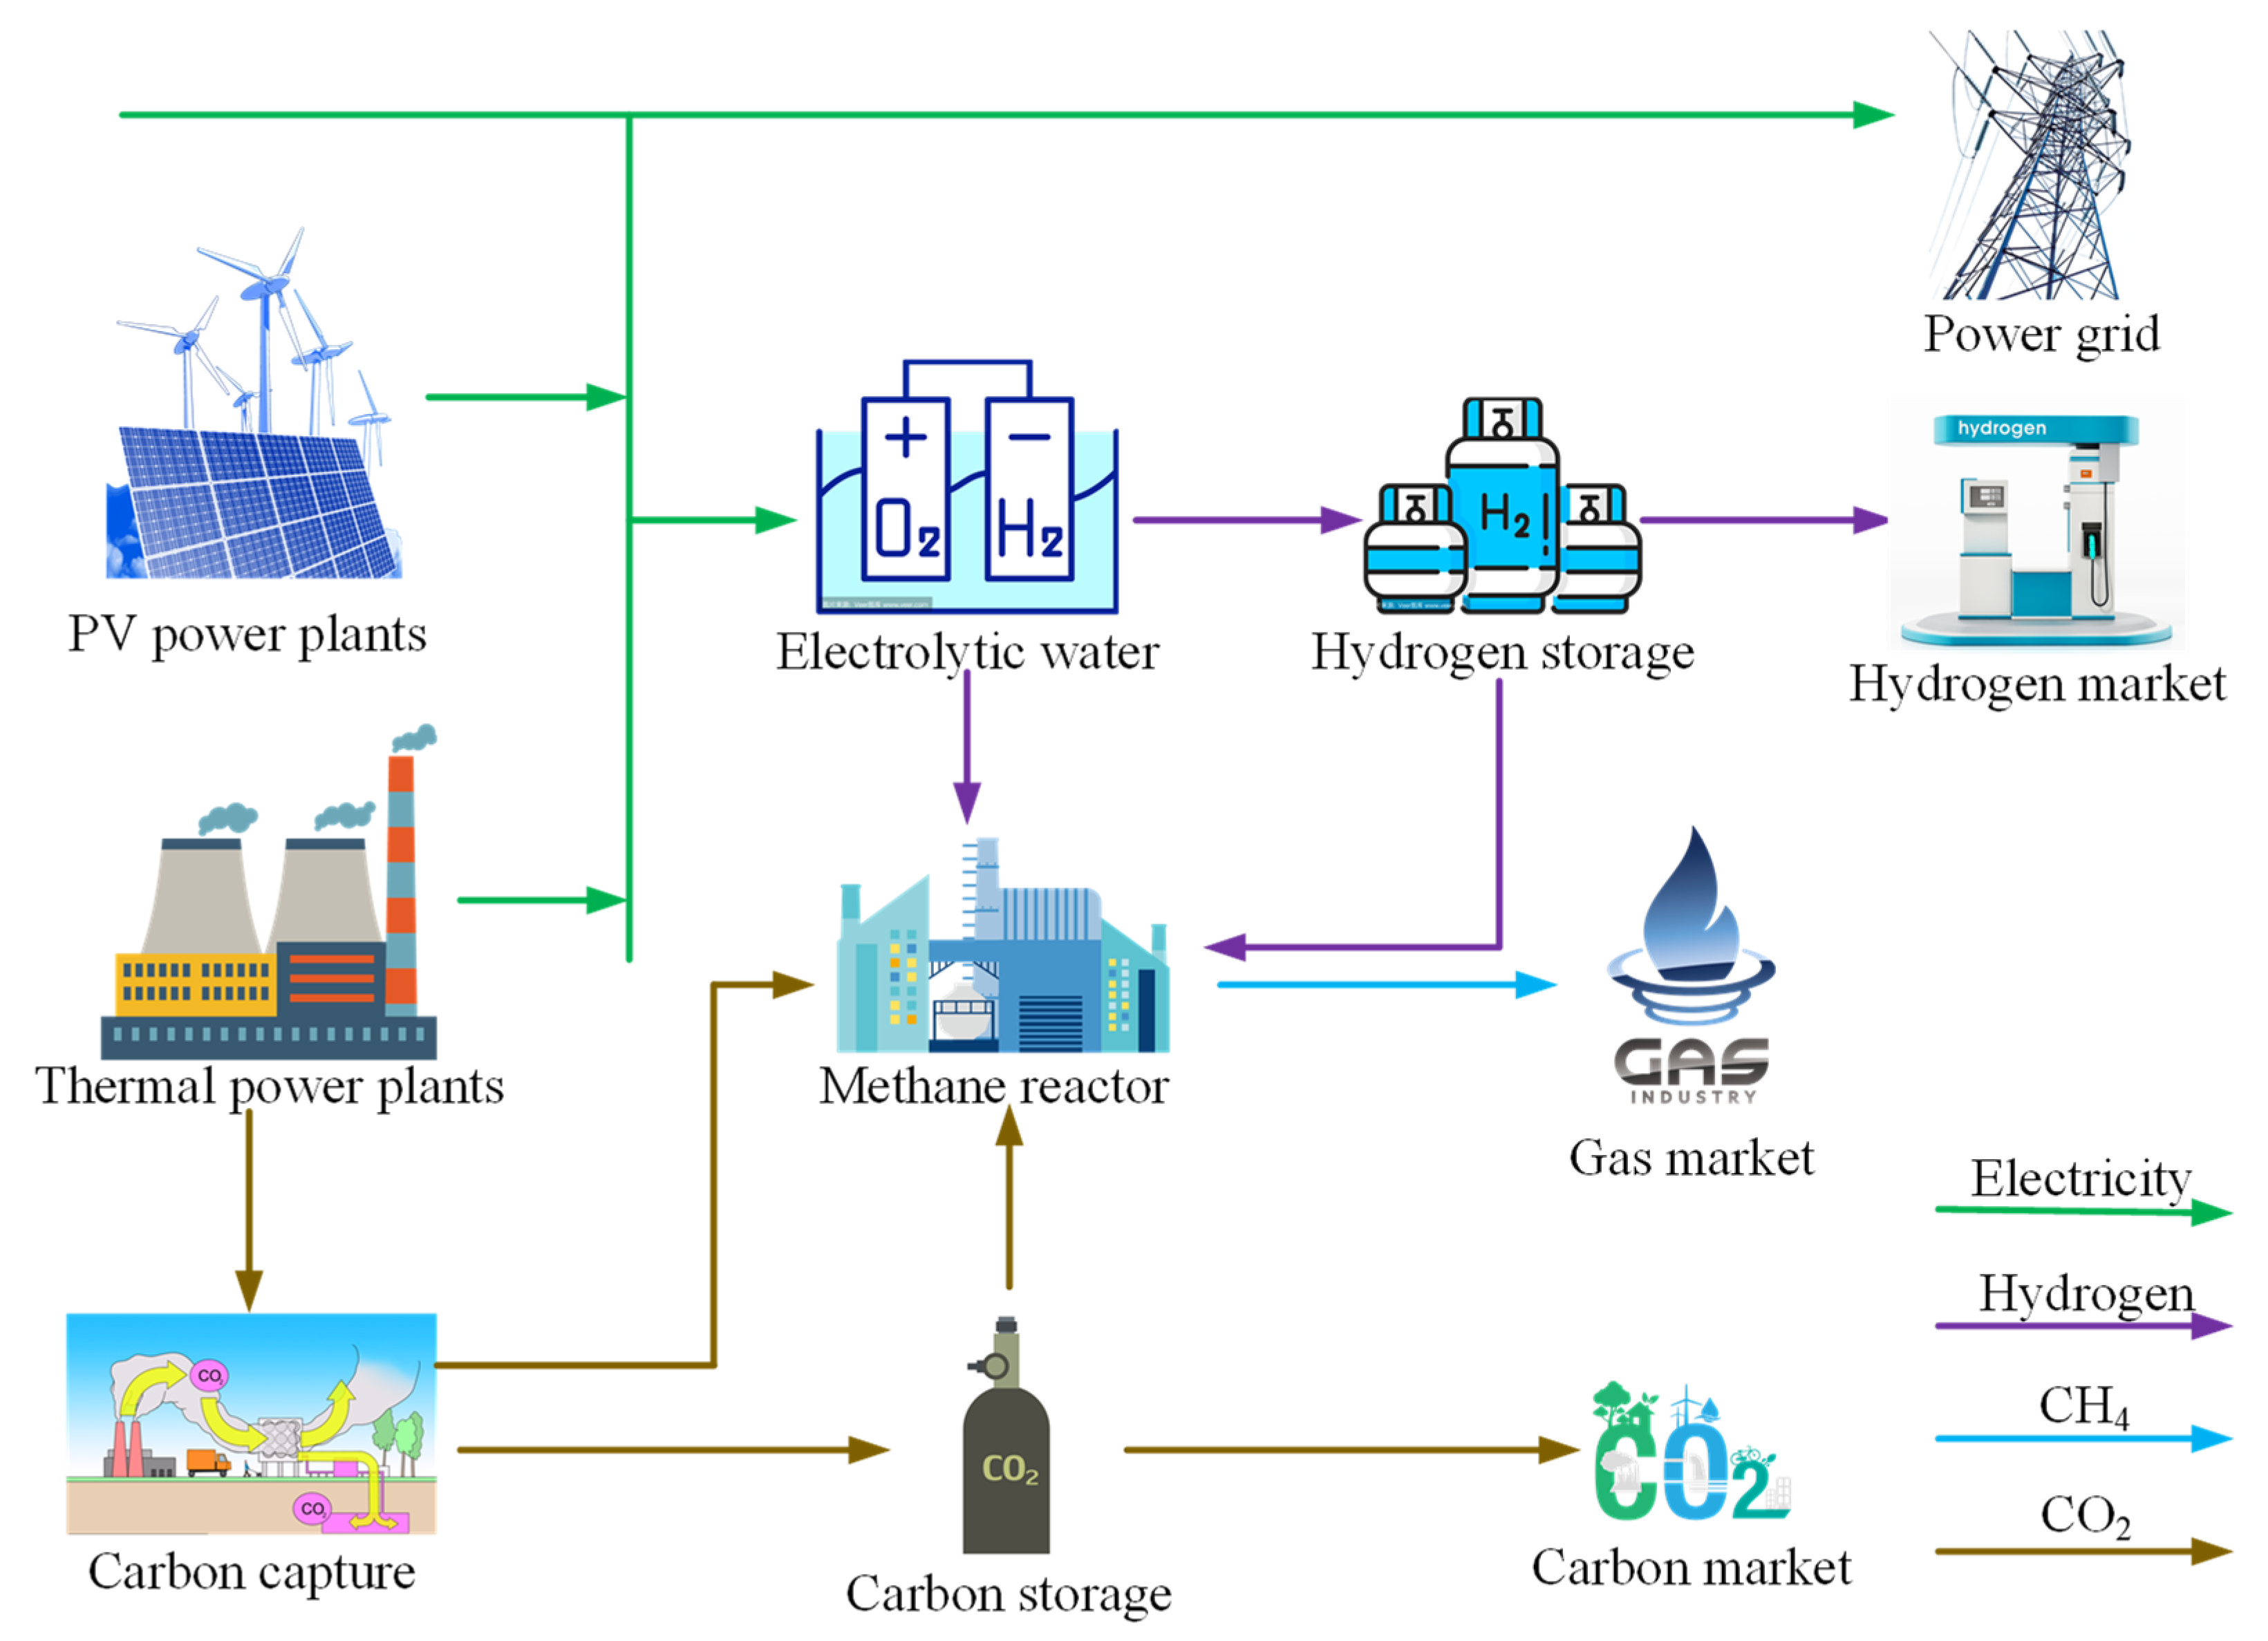
  • An IEPS model integrating CCS, P2G, carbon storage, and hydrogen storage equipment is established to realize the recycling and energy output of multiple types of energy, including electricity, hydrogen, natural gas, and carbon dioxide.
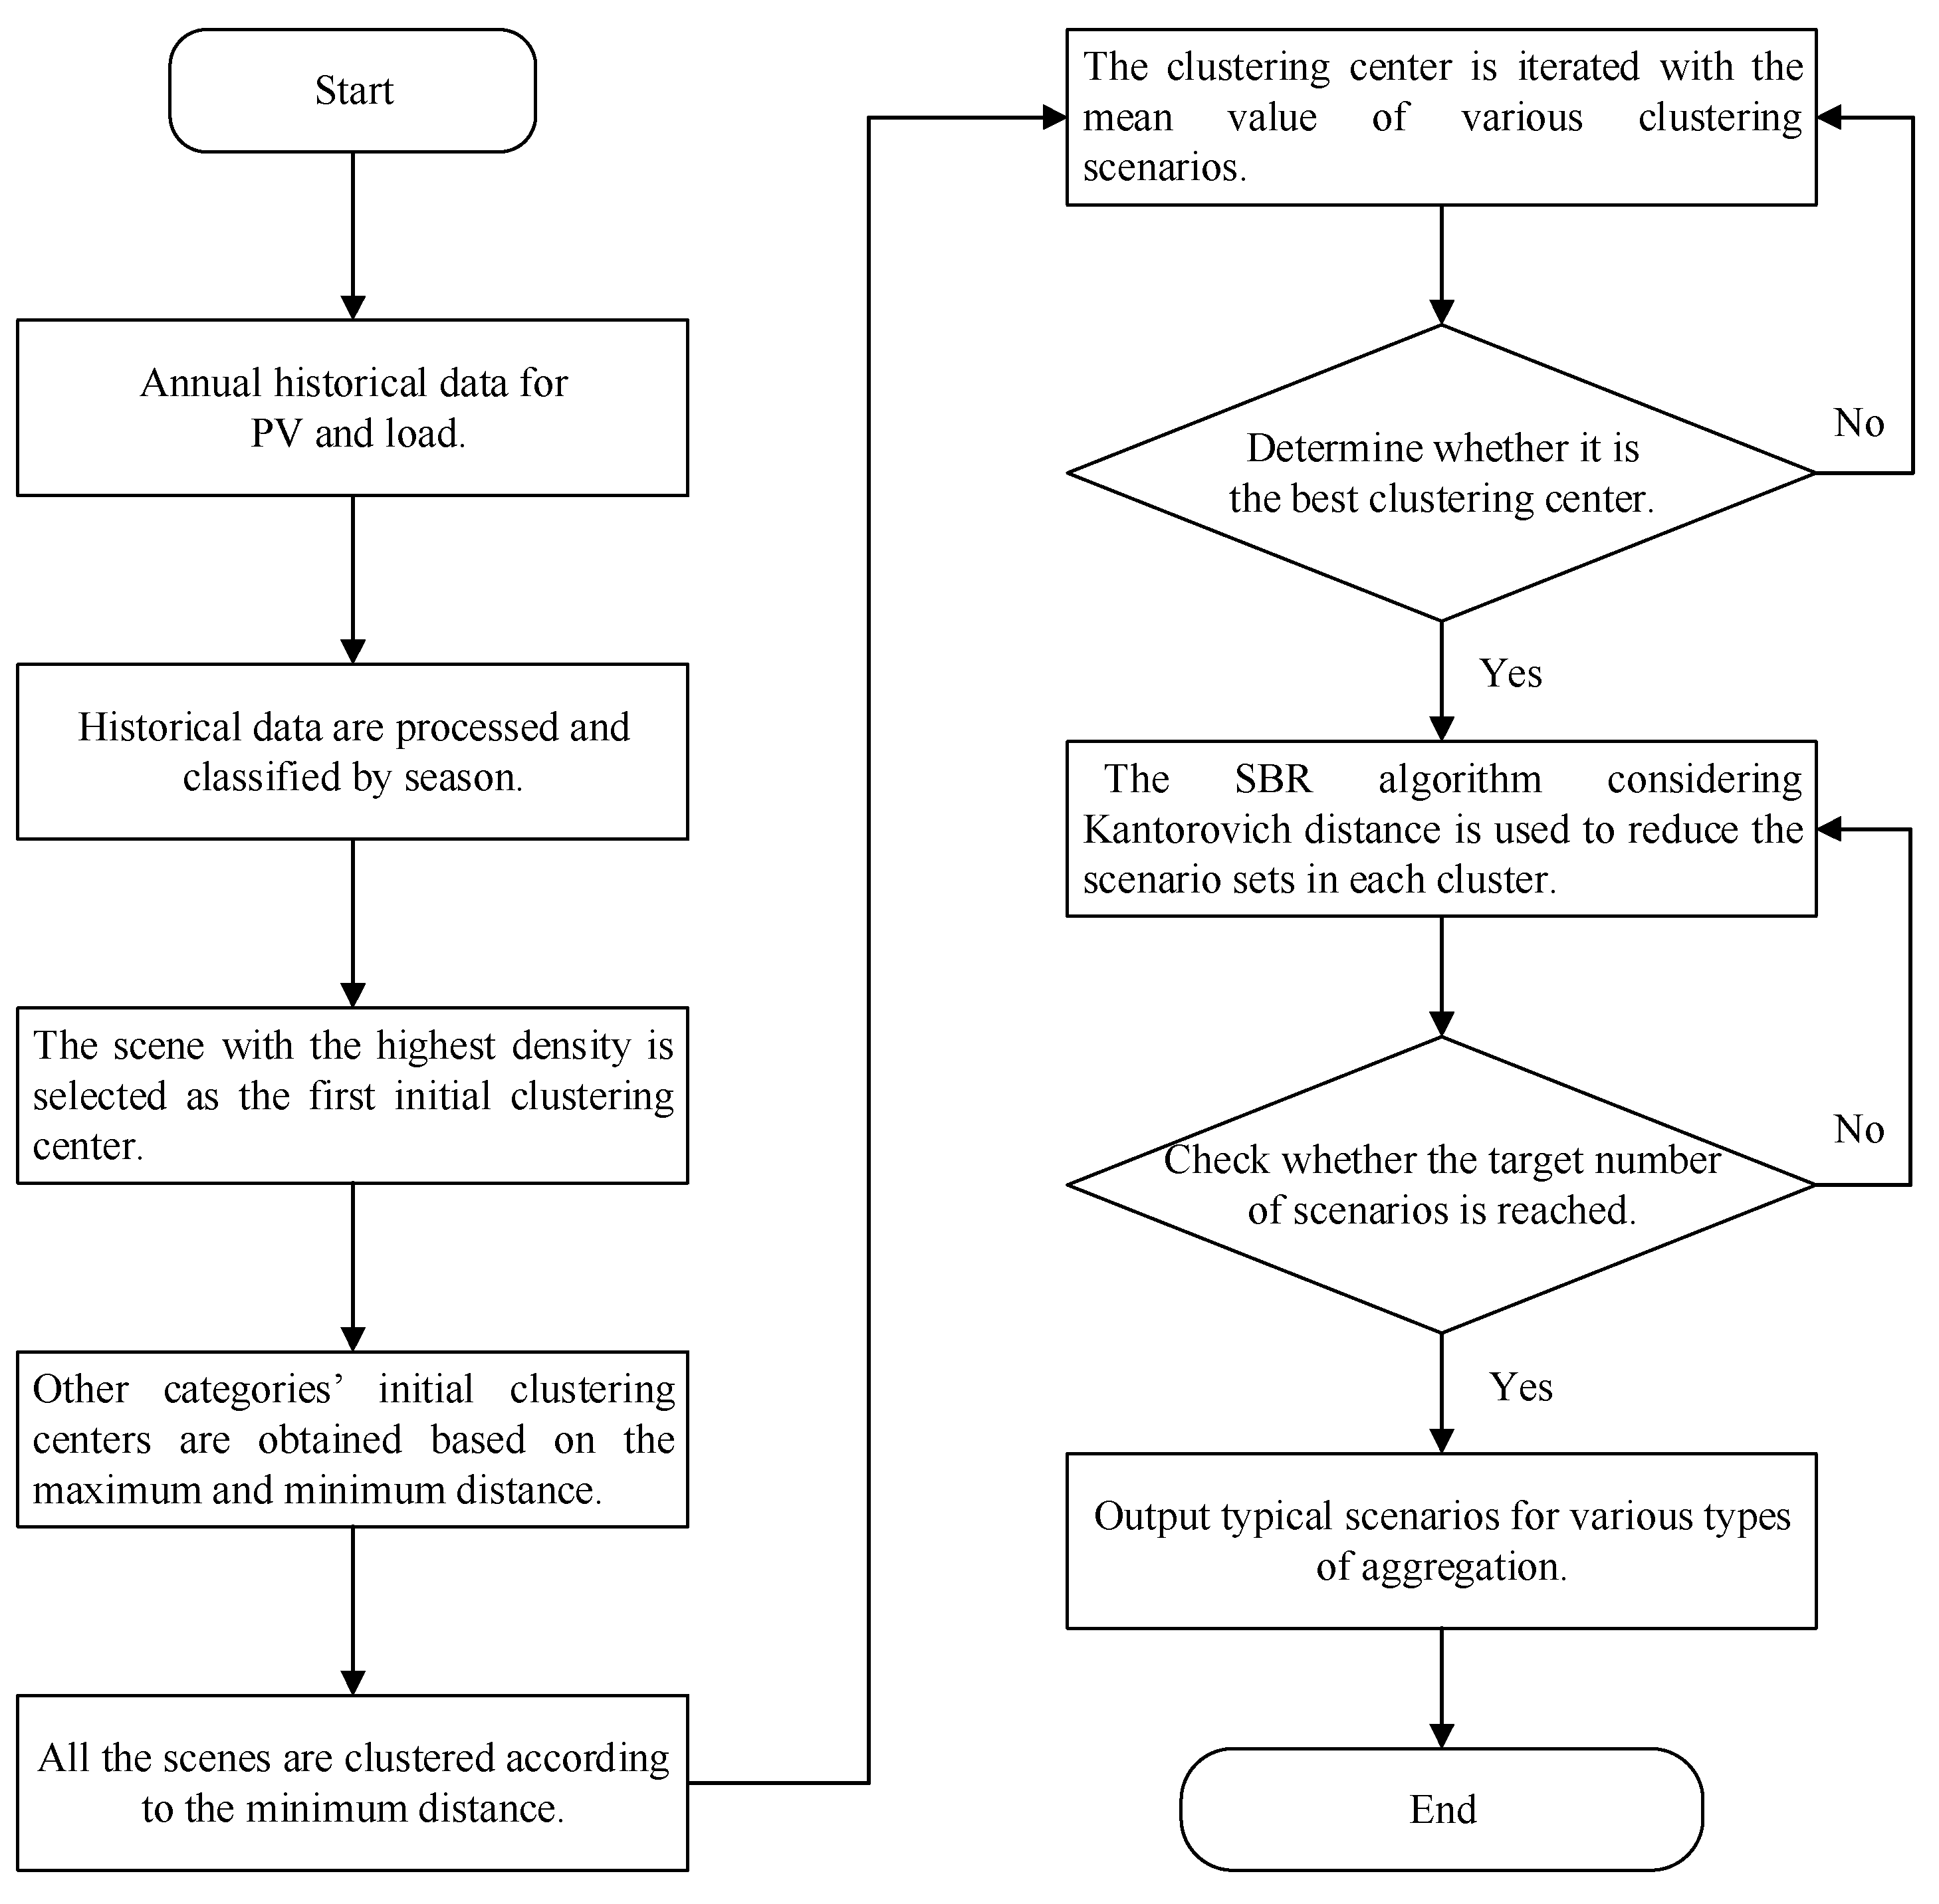
  • A scenario-based stochastic optimization approach deals with the uncertainty of PV output and load in the IEPS. A combination of the SBR algorithm and an improved K-means clustering method is used for scenario reduction and stochastic optimization deterministic transformation.
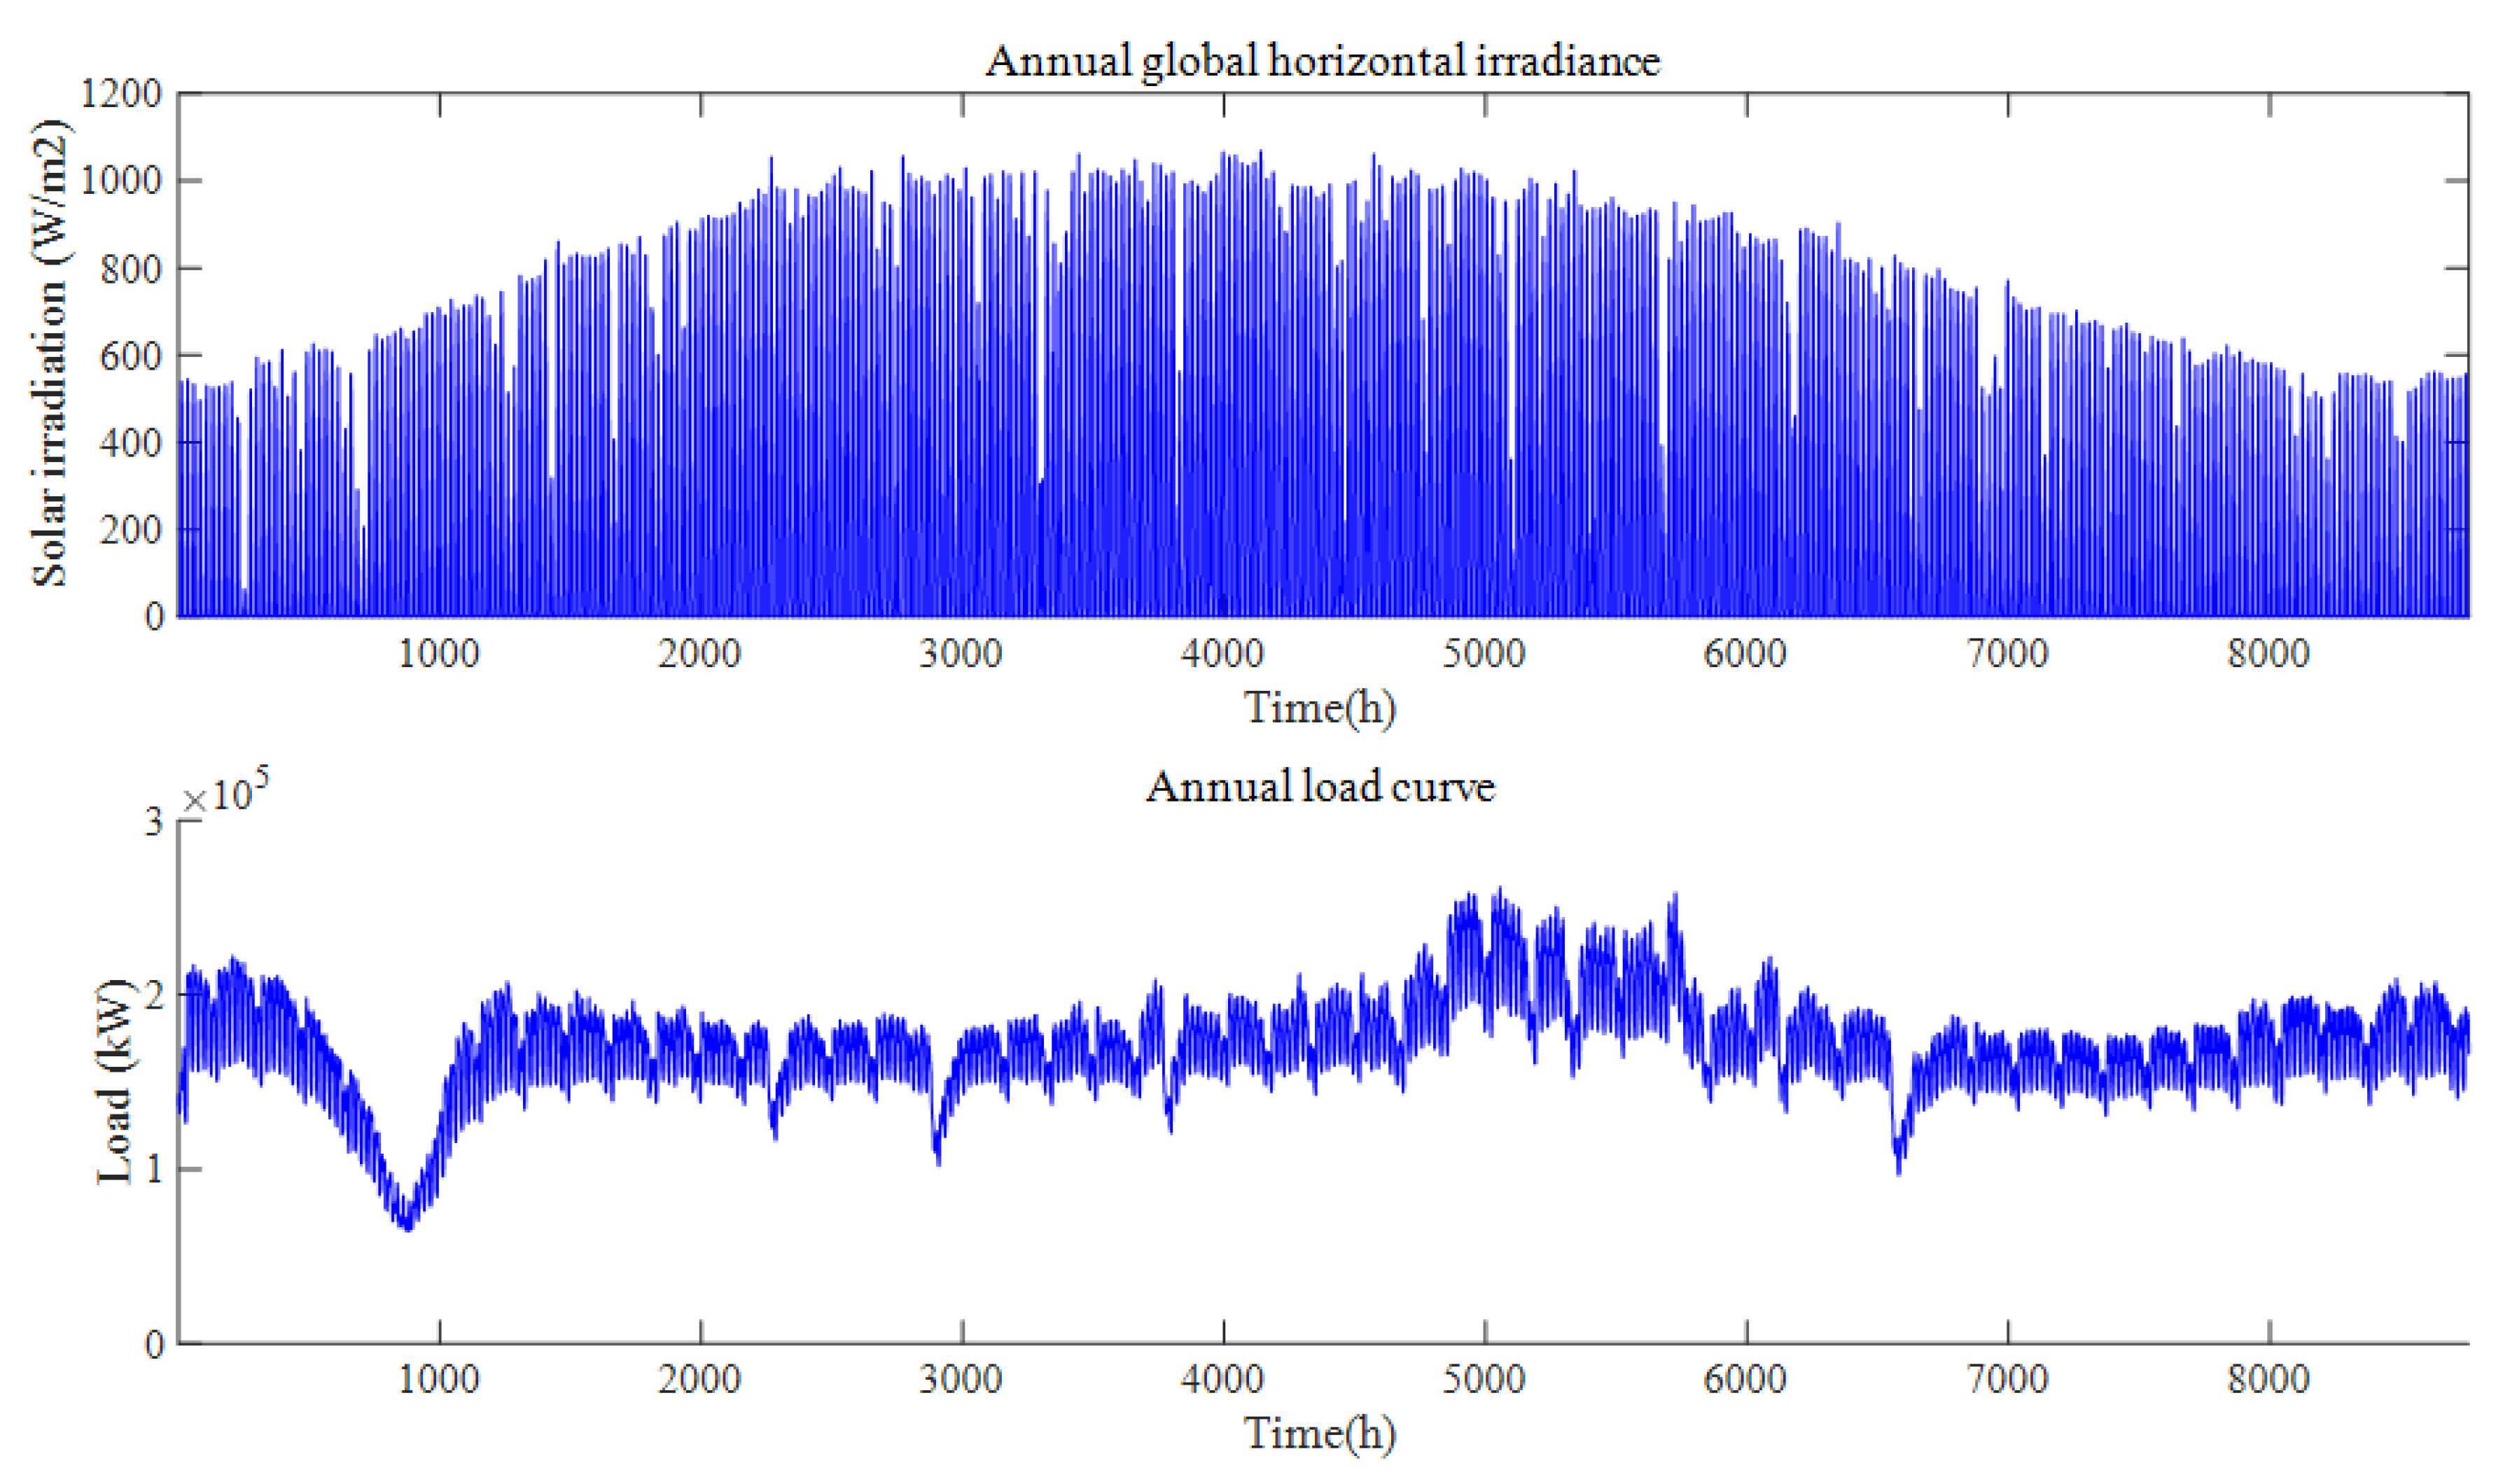
  • Based on the actual data of an industrial park, the validity and accuracy of the proposed model are verified by capacity configuration and operation optimization simulation.
  • Considering the close coupling relationship between the IEPS and the coal, natural gas, and carbon trading markets, the sensitivity analysis of the energy system’s coal, natural gas, and carbon tax prices is carried out.
The remainder of this paper is organized as follows. The IEPS architecture and critical equipment model are established in Section 2. The stochastic optimization scenario reduction method combining the SBR algorithm with the K-means clustering is proposed in Section 3. Section 4 presents the basic optimal allocation model for the IEPS. The case study simulation, comparison, and analysis are in Section 5. Finally, the conclusions are presented in Section 6.

2. IEPS Architecture and Model

The architecture of the IEPS integrating the CCS and P2G is shown in Figure 1. The system structure mainly consists of thermal power units with integrated carbon capture equipment, PV generation units, electrolytic cells (EC), methane reactors (MR), hydrogen storage (HS), and carbon storage (CS). In the established IEPS, PV and thermal power units are the primary energy sources for electricity generation. Abundant PV power is utilized for hydrogen production through water electrolysis, while carbon capture units are employed to capture CO2 emissions from coal combustion. The produced hydrogen and captured carbon dioxide are subsequently synthesized into methane within a dedicated reactor. Hydrogen and carbon storage tanks facilitate the storage of hydrogen and carbon dioxide within the system. Ultimately, the IEPS provides diverse energy products, including electricity, hydrogen, methane, and carbon dioxide. As an energy production unit, the IEPS with CCS and P2G can convert electricity, hydrogen, carbon dioxide, and methane within the system and deliver the traditional fossil energy resources input to the system including electricity, hydrogen, methane, and carbon dioxide to the corresponding energy network or energy market for trading, and gain revenue to meet different conditions of energy demand in the energy market.

2.1. Carbon Capture Model

The construction of carbon capture power plants with decarbonization is an inevitable trend for the traditional thermal power plants’ green and healthy development. The output of the coal-fired power generation units in a carbon capture plant includes two parts: one part of the power is directly input into the power network, and the other part of the power is consumed for capturing carbon dioxide. The model of thermal power units containing carbon capture can be described as (1)–(7). The CO2 emission of thermal power units relates to the whole power output and carbon emission intensity (1). The CCS equipment captures a portion of the CO2 emitted from the units’ power generation, and another part is emitted directly into the air (2). The efficiency of carbon capture determines the amount of carbon captured (3). Some of the CO2 the CCS captures is used to synthesize methane; the other part is stored in carbon storage tanks (4). The CCS energy consumption includes operational and fixed energy consumption (5), (6), and the operational power consumption is related to the amount of carbon captured and the functional energy factor (7).
E CO 2 , t TU = e TU P A , t TU
E CO 2 , t TU = E CO 2 , t CCS + E CO 2 , t Air
E CO 2 , t CCS η CCS P CO 2 , t TU
E CO 2 , t CCS = E CCS , t MR + P ch , t CS
P A , t TU = P O , t CCS + P F , t CCS + P N , t TU
P O , t CCS + P F , t CCS P max , t CCS
P O , t CCS = α CCS E CO 2 , t CCS
where, E CO 2 , t TU implies the carbon emission of thermal power units at time t; e TU is the emission intensity of thermal power units; P A , t TU and P N , t TU are the total power generation of the thermal units and the net power input to the network at time t, respectively; E CO 2 , t CCS and E CO 2 , t Air indicate the amount of carbon captured and carbon dioxide emitted directly into the air at time t, respectively; η CCS denotes the carbon capture efficiency of the CCS; E C CS , t MR implies the amount of CO2 absorbed by the methane reactor at time t; P O , t CCS , P F , t CCS and P max , t CCS indicate the operational power consumption, fixed energy consumption and maximum energy consumption allowed for the CCS equipment, respectively; α CCS denotes the operational power demand coefficient of the carbon capture equipment.

2.2. Power to Gas Model

The P2G technology mainly includes two types of power-to-hydrogen and power-to-methane [35]. The former is to generate hydrogen and oxygen directly from electrolyzed water. The generated hydrogen is generally pressurized by the compressor, injected into the hydrogen storage tank, and then transported to the hydrogen station by tank car for use as the fuel of hydrogen-fueled vehicles. The hydrogen generated by the electrolysis of water is used as raw material to chemically react with CO2 captured by the CCS to produce methane and water, and the methane generated can be transported to the natural gas market through pipelines or tankers for market trading. The model of P2G is as follows (8)–(15):
P t EC = α EC E H 2 , t EC
P t MR = α MR E CH 4 , t MR
E CH 4 , t MR = ω CO 2 MR ( E CCS , t MR + E CS , t MR )
E CH 4 , t MR = ω H 2 MR ( E EC , t MR + E HS , t MR )
P min , t EC P t EC P max , t EC
Δ P min , t EC P t EC P t 1 EC Δ P max , t EC
P min , t MR P t MR P max , t MR
Δ P min , t MR P t MR P t 1 MR Δ P max , t MR
where, P t EC and P t MR denote the power consumption of the electrolytic cell and methane reactor, respectively; coefficients α EC and α MR represent the specific electricity consumption of electrolytic cell and methanation reactors, respectively; E H 2 , t EC and E CH 4 , t MR respectively represent the amount of hydrogen produced in the electrolytic cell and methane synthesized in the methane reactor; ω CO 2 MR and ω H 2 MR are the equilibrium coefficients for synthesizing methane using hydrogen and carbon dioxide;  E CCS , t MR and E CS , t MR denote the amount of CO2 delivered to the methane reactor from the CCS and the carbon storage device, respectively; P min , t EC , P max , t EC , P min , t MR and P max , t MR indicate the lower and upper limits of power consumption for the electrolytic cell and methane reactor, respectively; Δ P min , t EC , Δ P max , t EC , Δ P min , t MR and Δ P max , t MR represent the minimum and maximum constraints of climbing power for the electrolytic cell and methane reactor, respectively.

2.3. Carbon Storage Model

The carbon storage capacity E CO 2 , t CS of the carbon storage equipment at time t is related to the filling and deflating power at the current moment and the carbon storage capacity at the last moment (16)–(19), and the carbon storage device can only maintain one storage state at the exact moment (20).
E CO 2 , t CS = E CO 2 , t 1 CS + η ch , t CS P ch , t CS P dis , t CS η dis , t CS
0 E CO 2 , t CS E max CS
0 P ch , t CS μ ch , t CS P ch , max CS
0 P dis , t CS μ dis , t CS P dis , max CS
μ ch , t CS + μ dis , t CS 1
where P ch , t CS and P dis , t CS represent the injecting and releasing the power of the carbon storage equipment at time t, respectively; η ch , t CS and η dis , t CS are the injecting and releasing efficiency at time t, respectively; E max CS indicates the rated storage capacity of the carbon storage facility; P ch , max CS and P dis , max CS denote the total inflation and deflation power allowed by the carbon storage equipment at the moment t, respectively; μ ch , t CS and μ dis , t CS are binary variables that indicate the inflation and deflation states of the carbon storage equipment.

2.4. Hydrogen Storage Model

The hydrogen storage capacity at the time t of the hydrogen storage system is related to the charging and discharging power at the current moment and the hydrogen storage volume at the last moment (21)–(24). A hydrogen storage tank can only maintain one storage state at the exact moment (25).
E H 2 , t HS = E H 2 , t 1 HS + η ch , t HS P ch , t HS P dis , t H S η dis , t H S
0 E H 2 , t HS E max HS
0 P ch , t HS μ ch , t HS P ch , max HS
0 P dis , t HS μ dis , t HS P dis , max HS
μ ch , t HS + μ dis , t HS 1
where P ch , t HS and P dis , t HS denote the injecting and releasing hydrogen power of the hydrogen storage tank, respectively; η ch , t HS and η dis , t HS denote the injecting and releasing efficiencies at time t, respectively; E max HS indicates the rated storage capacity of the hydrogen storage tank; P ch , max HS and P dis , max HS denote the top filling and deflating power allowed in the hydrogen storage tank at moment t, respectively; μ ch , t HS and μ dis , t HS are binary variables that indicate the injecting and releasing states of the hydrogen storage tank.

2.5. Photovoltaic Generation Model

Photovoltaic power generation is influenced by various factors, including the surface area of the installed photovoltaic panels, their efficiency, and the intensity of solar irradiance ((26)–(28)). It is important to note that the power generated by photovoltaic systems may exceed the capacity for accommodating it (29). Additionally, the configuration of PV equipment is constrained by the available installation area (30). The photovoltaic power generation model is as follows:
P T , t PV = A PV η PV I t PV
P r PV = A PV α PV
P T , t PV = P R PV η P V α P V I t PV
P T , t PV = P t PV + P c u r , t PV
0 P R PV P max PV
where, P T , t PV denotes the total power generation of photovoltaic equipment at time t, and P r PV indicates its rated power; A PV represents the total installation area of photovoltaic panels, η PV is the corresponding efficiency, I t PV denotes the global horizontal irradiance at time t, and α PV represents the power conversion coefficient per unit area per unit irradiance; P t PV and P c u r , t PV denote the actual power and power curtailment of photovoltaic generation at time t, respectively; P max PV indicates the maximum installed capacity of the photovoltaic device.

3. Stochastic Optimization Deals with Source-Load Uncertainty

Photovoltaic output and load are uncertain and have a time-series relationship. Bilateral uncertainties in both photovoltaic outputs and load must be considered when optimizing capacity allocation for IEPS. The stochastic optimization scenario method is crucial for effectively adapting to the optimal scheduling of energy systems with a high proportion of renewable energy. As the key of the scenario analysis approach, scenario reduction aims to capture numerous complex scenario features by utilizing a limited number of representative typical systems, thereby reducing computational complexity. Consequently, this study employs a scenario-based stochastic optimization technique to address the source-load uncertainty in IEPS. Firstly, the historical PV and load data are screened and processed, unreasonable data are eliminated, and the historical data are obtained as the basis of the stochastic scenario. Historical data is challenging to get or lack cases, based on the data to find the probability distribution function, using Monte Carlo simulation or Latin hypercube r methods to generate enough scenario data. Then, the obtained random scenarios are reduced using the clustering method, and a small number of typical scenarios are utilized to replace the complex and numerous random and uncertain scenarios. Finally, the selected stochastic typical scenes of different seasons are used to simulate the planning and operation of the IEPS.
The continuous time series scenario extraction data is relatively large in photovoltaic output and load stochastic scenario extraction. The optimization efficiency is low, while the extreme scenario extraction, on the other hand, does not consider the time-series correlation between photovoltaic power generation and load, and the extracted scenarios may not exist in practice, resulting in conservative optimization results; therefore, to solve the problem, the typical scenario set obtained from the reduction of existing algorithms cannot characterize the original scenes well. In this paper, the SBR algorithm based on Kantorovich distance combined with improved K-means clustering algorithm clusters reduces the actual scenarios of photovoltaic output and load to obtain the typical photovoltaic output and load scenarios. The original scenarios are quickly categorized based on the improved K-means clustering algorithm. Then, the scenario sets in each class of clusters are reduced using the SBR algorithm based on the Kantorovich distance. This method can improve the computational efficiency of scenario collection reduction for a larger scale while ensuring computational accuracy, and it can better characterize the initial scenarios. The flow of the scenario reduction method combining K-means clustering and the SBR algorithm is shown in Figure 2.
The specific steps of scenario reduction are as follows:
Step 1: Select the initial clustering centers. The scene with the highest density from the original scenarios is screened out as the first initial clustering centroid S1. The density information of the scenarios is characterized as the maximum value of the distance between each scenario and its nearest m scenarios. The Euclidean distances of different scenarios are given in Equation (31):
d ( s i , s j ) = k ( s i k s j k ) 2
where, s i is the i scenario and s i k is the k element of the scenario i.
Step 2: Select the rest of the initial clustering centers. The scenario with the most considerable Euclidean distance from S1 is screened out as the second initial clustering centroid S2. The Euclidean distances of the other scenarios from S1 and S2 are calculated. The maximum value of the smallest distance Li from S1 and S2 is found, and the corresponding scenario is the third initial clustering center S3.
L i = max { min ( d ( s i , s 1 ) , d ( s j , s 2 ) ) }
Step 3: Determine the new clustering centers. Select the required number of initial clustering centers according to step 2 and assign all scenes in the collection to each clustering center based on the Euclidean distance minimization principle to complete the initial clustering. Calculate the mean value for each clustered scene as the new clustering center Si.
S i = 1 N i s i C i s i
Ni and Ci denote the number and set of the i clustered scenario, respectively.
Step 4: Filter the new set of scenarios. Choose the scenario with the least distance from the other scenarios in set Ci of scenes according to the Kantorovich distance metric and add it to the new scenario set Di. Mi is the number of scenarios contained in the set Di.
D k ( C i , D i ) = min { s u C i , s v D i d ( s u , s v ) γ ( s u , s v ) γ ( s u , s v ) 0 , s u C i , s v D i ;                                                                                 s v D i γ ( s u , s v ) = p s u , s u C i ;     s u C i γ ( s u , s v ) = p s v , s v D i ; }      
where su and sv are scenarios in the sets Ci and Di, respectively; p s u and p s v are the probabilities of su and sv in the sets Ci and Di, respectively; the likelihood of p s u is 1/Ni, the probability of p s v is 1/Mi; d ( s u , s v ) denotes the Euclidean distance of scenarios su and sv; γ ( s u , s v ) indicates the probability product of su and sv.
Step 5: Iterate until the scenario requirements are met. Choose a scenario that fulfills Equation (35) from scenario set Ci, and append it to Di. Reiterate this process and promptly update the probability of each scenario in Di until the count of scenarios in Ci meets the set quantity requirement.
D k ( C i , D i ) = min { u = 1 N i p s u p s v d ( s u , s v ) }

4. Problem Formulation

4.1. Objective Function

For the integrated energy production system that combines CCS, P2G, carbon storage, and hydrogen storage facilities built in this study. To consider the environmental and economic benefits of the IEPS, the capacity is used as the decision variable, and the total annual cost is minimized as the objective function to establish the stochastic optimization model of capacity configuration for the IEPS. The total annual cost includes the yearly value of installation investment costs, annual operation and maintenance fees, annual energy and fuel costs, and carbon emission costs.
F = min { C inv + C op + C tra + C tax }
C inv = j c inv , j E j i ( 1 + i ) n ( 1 + i ) n 1
C op = j c op , j E j
C tra = t ( c t fuel M t fuel c t ele P t Load c t gas E CH 4 , t GM c t H 2 E H 2 , t H M c t C O 2 E CO 2 , t C M )
C tax = t c tax C O 2 E CO 2 , t Air
where F is the total annual cost (or net profit) C inv and C op denotes the annual cost of the investment and the operation cost of all equipment, respectively; C tra indicates the cost of acquiring raw materials for the system and the profit from the sale of produced energy, including mainly the cost of purchasing coal, the proceeds from the sale of electricity, natural gas, hydrogen and CO2; C tax represents the carbon tax cost of CO2 that the system cannot capture and has to emit; c inv , j and c op , j denote the investment cost, operating and maintenance costs per unit capacity of j equipment, respectively; Ej denotes the configured capacity of device j; i denotes the annual interest rate; c t fuel , c t ele , c t gas , c t H 2 and c t C O 2 represent the prices of fuel, electricity, natural gas, hydrogen and carbon dioxide, respectively; M t f u e l and P t L o a d denote the fuel and power demand; E CH 4 , t GM , E H 2 , t HM and E CO 2 , t CM represent the amounts of natural gas, hydrogen and carbon dioxide sold; c tax C O 2 represent the price of the carbon tax.

4.2. Constraints

4.2.1. Power System Balance Constraint

In the IEPS, the leading equipment for producing electricity are thermal power and renewable energy generation units, and this study mainly considers photovoltaic generating units. The electrical energy consumption is primarily for CCS equipment, electrolytic cell equipment, methane reactor equipment, and load demand. The compressor electricity consumption of carbon storage equipment and hydrogen storage tank is relatively small, so this part of electricity consumption is considered together with the efficiency of storage equipment in this paper and is not calculated separately.
P A , t TU + P t PV = P O , t CCS + P F , t CCS + P t EC + P t MR + P t Load
P min , t TU P A , t TU P max , t TU
Δ P min , t TU P A , t TU P A , t 1 TU Δ P max , t TU
where, P t PV denotes the photovoltaic output, P min , t TU , and P max , t TU represent the maximum and minimum limits of the thermal unit output, Δ P min , t TU and Δ P max , t TU denote the maximum and minimum constraints of the climbing power, respectively.

4.2.2. Carbon Balance Constraint

In the IEPS, the amount of CO2 captured by the CCS, the amount of carbon dioxide consumed to synthesize methane, and the amount of carbon dioxide injected and released from the carbon storage tank have the following equilibrium in addition to the equilibrium relationships in (4) and (10):
P dis , t CS = E CS , t MR + E CO 2 , t CM

4.2.3. Hydrogen Balance Constraint

In the IEPS, the hydrogen generated in the electrolytic cell, the hydrogen consumed to synthesize methane, and the hydrogen injected and released from the carbon storage tank have the Equation (11) and the following balance relationship:
E H 2 , t EC = E EC , t MR + P ch , t HS
P dis , t HS = E HS , t MR + E H 2 , t HM

4.2.4. Natural Gas Balance Constraints

In the IEPS, the production of natural gas is mainly influenced by hydrogen and carbon dioxide, and the primary equilibrium relations, in addition to Equations (10) and (11), include:
E C H 4 , t GM = ( 1 ρ loss ) E C H 4 , t MR
where ρ l o s s represents the transmission loss in selling the methane synthesized from electricity to gas to the natural gas market.

5. Case Studies

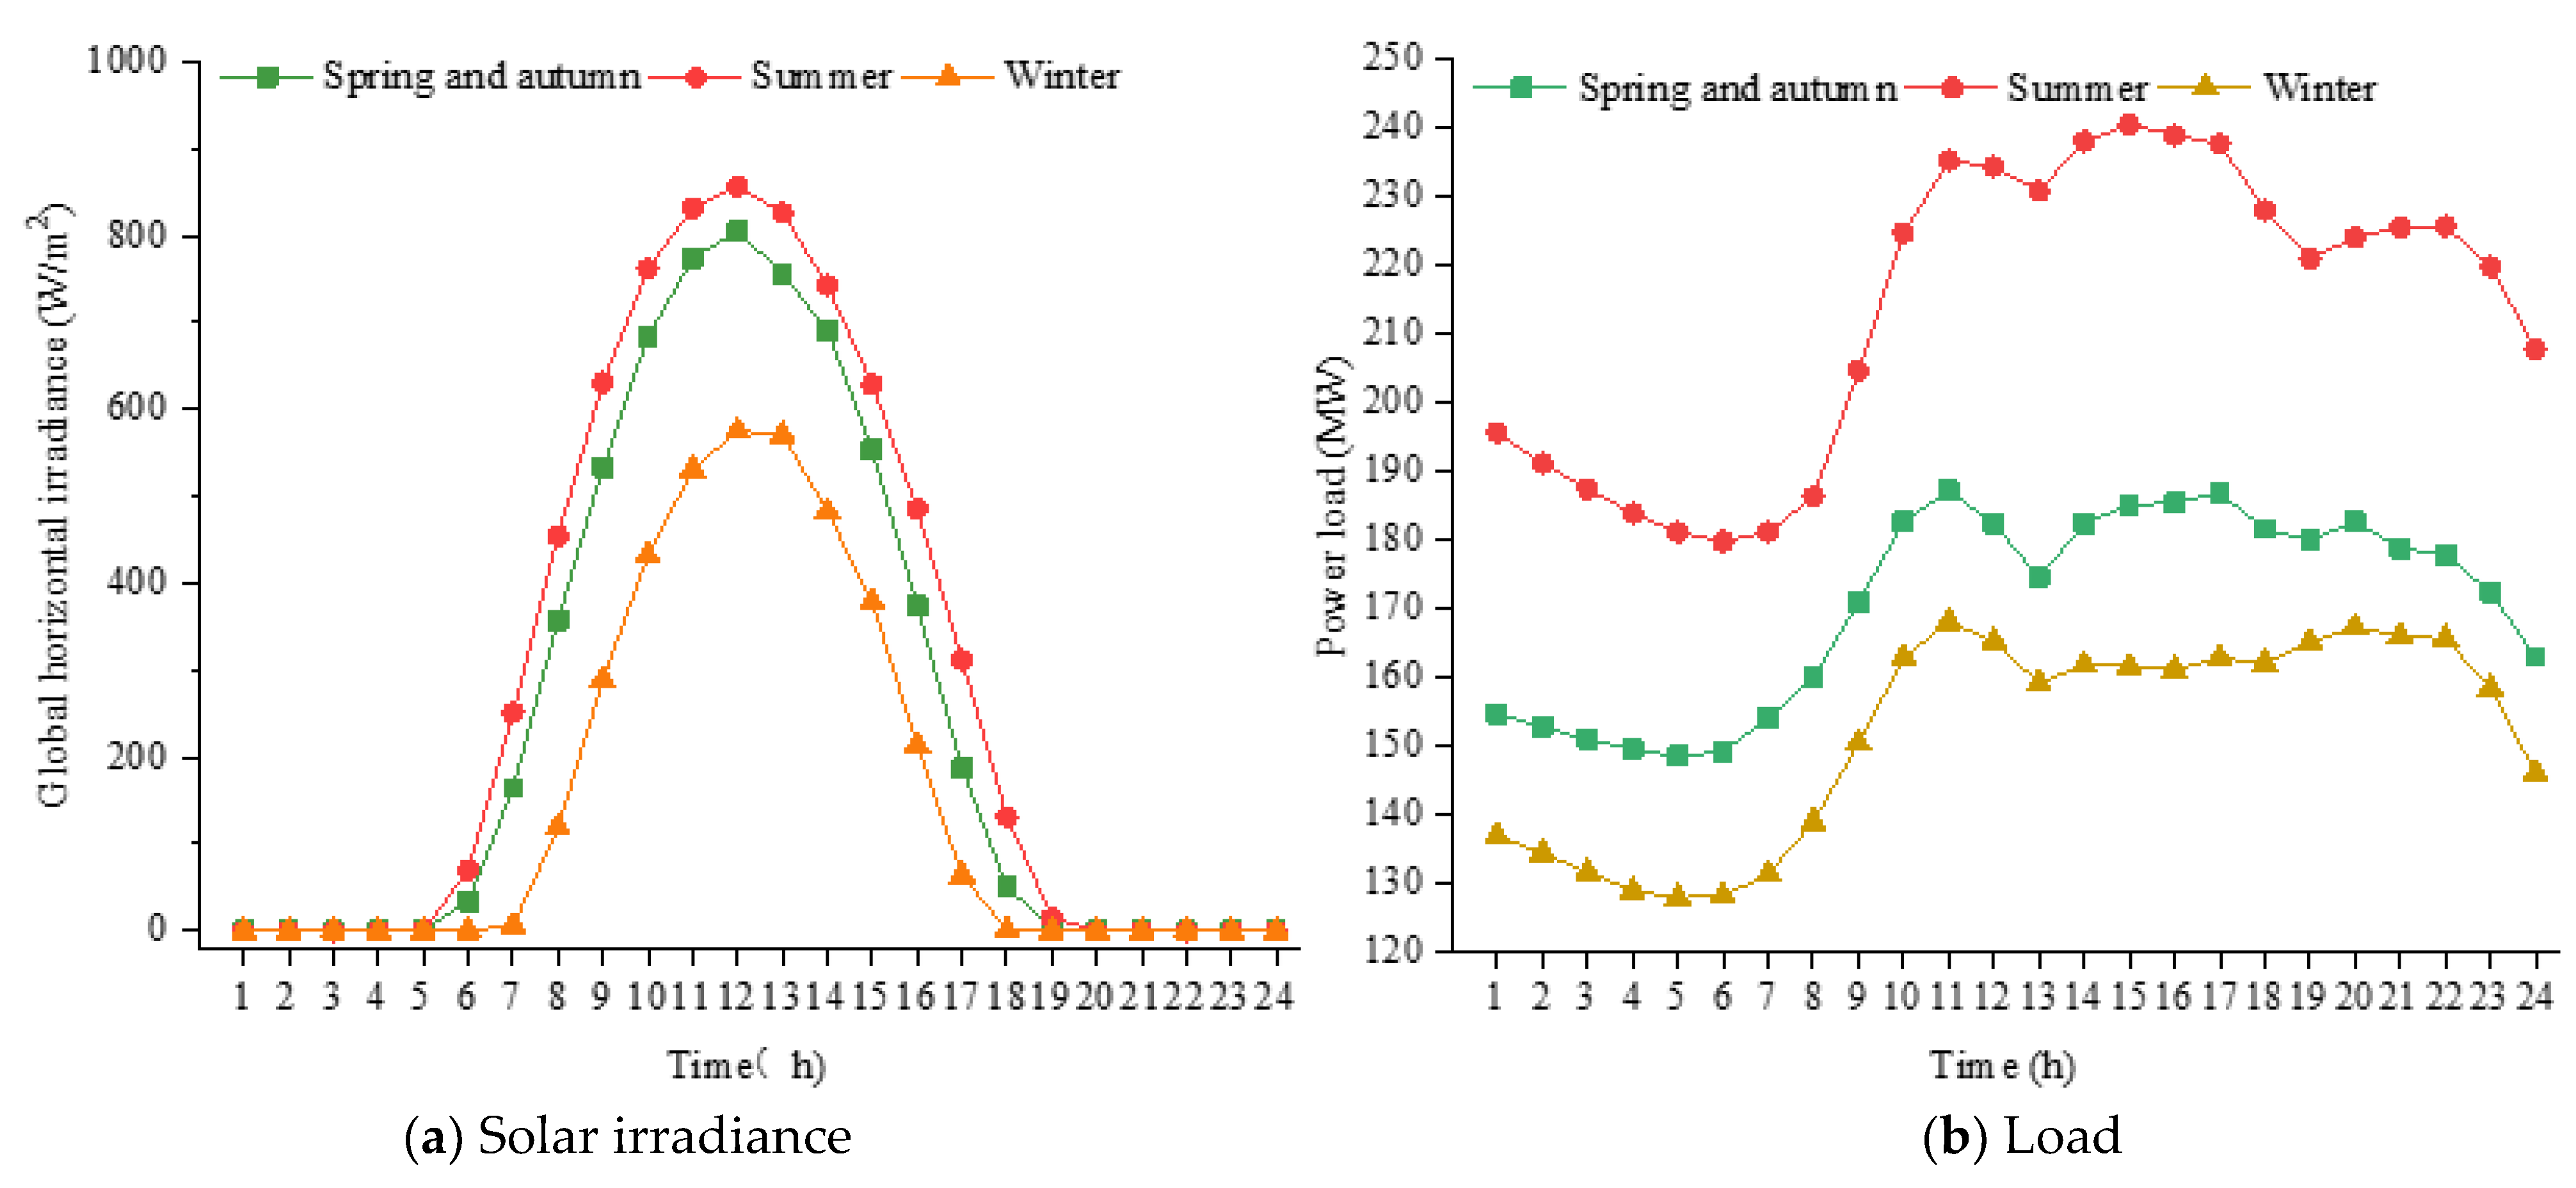
5.1. Parameter and Scenario Settings

The stochastic optimal configuration model of the IEPS established is a mixed-integer linear programming model with many integer variables in this study. The simulation is done in a computing environment with 32 GB of memory and Intel(R) Xeon(R) CPU, using MATLAB R2018b with the Gurobi solver. The photovoltaic output and load data of a specific area in Suzhou, Jiangsu Province, China, are selected as the simulation basis of the IEPS. The load data adopts the actual load data of the region, and the global horizontal irradiance data is obtained based on the average annual total global horizontal radiation level and the actual photovoltaic output characteristic curve of the region. The global horizontal irradiance and load characteristic curves of this region in 2019 are shown in Figure 3. The technical and economic parameters of CCS and P2G are shown in Table 1 and Table 2. Parameter data are mainly referenced in [8,28,33].
Since the seasonal differences in photovoltaic output and load are more pronounced, to characterize the planning and operation of the energy system, this paper divides the year more accurately into three seasons for simulation analysis: spring and autumn (March–May, September–November), summer (Jun–August) and winter (January–February, December). To compare and analyze the impact of photovoltaic and load uncertainty and the flexibility of carbon and hydrogen storage devices on the IEPS, the following four scenarios with significant differences were set up in this study. Among them, the typical daily predicted values of solar irradiance and load in different seasons in scenarios 1 and 2 under the deterministic model are shown in Figure 4.
Scenario 1: Consider optimization and configuration models for integrated energy production systems using CCS and P2G.
Scenario 2: Consider the optimal configuration of carbon and hydrogen storage tanks based on scenario 1.
Scenario 3: Considering photovoltaic output and load uncertainty based on scenario 1.
Scenario 4: Consider the uncertainty of photovoltaic output and load based on scenario 2.

5.2. Optimized Configuration Results and Analysis

5.2.1. Low Carbon Characteristics Analysis

Table 3 shows the capacity optimization configuration and operation results of each scenario. This paper selects nine typical days for three seasons to represent the annual operation. For 365 scenarios throughout the year, the clustering method can obtain the frequency corresponding to each typical day scenario while obtaining typical day scenarios. Multiplying each typical day scenario by the corresponding frequency and accumulating them can represent the annual operation situation. The optimal power dispatch of scenario 1 is shown in Figure 5. IEPS’s power is generated from coal and photovoltaic power, with an installed capacity of 300 MW and 290.4 MW of thermal and photovoltaic power, respectively, and annual utilization hours of 4527 h and 1849 h, respectively. The energy consumption of IEPS is mainly for load demand and electrolytic cell equipment.
In contrast, the power consumption of carbon capture and methane reactors is relatively low, related to the corresponding equipment’s configuration capacity and energy consumption level. From Figure 5, the power consumption curve of the electrolytic cell equipment has a similar trend to the output curve of photovoltaic power generation. As an adjustable flexible load, the power consumption of the electrolytic cell is higher during the day when the photovoltaic output is more elevated. However, when relying entirely on thermal power generation at night, its power consumption is stable at a lower level. Compared to photovoltaic power generation, which has low cost and zero carbon emissions, thermal power generation requires additional payments for coal fuel costs and carbon emissions fees. The IEPS system will prioritize using renewable energy to reduce the outputs of thermal power generation units. Table 3 illustrates that the carbon capture device deployed in scenario 1 captures 39,977 tons of carbon dioxide annually for methane synthesis. This process results in a notable reduction of carbon emissions in the system. Therefore, the IEPS integrating CCS and P2G devices can effectively enhance the accommodation of clean and renewable energy, promote the carbon emission reduction of the energy system, and realize the internal recycling of carbon dioxide and hydrogen resources in the IEPS, which is instrumental in the green economy, safe and efficient development of the energy system.

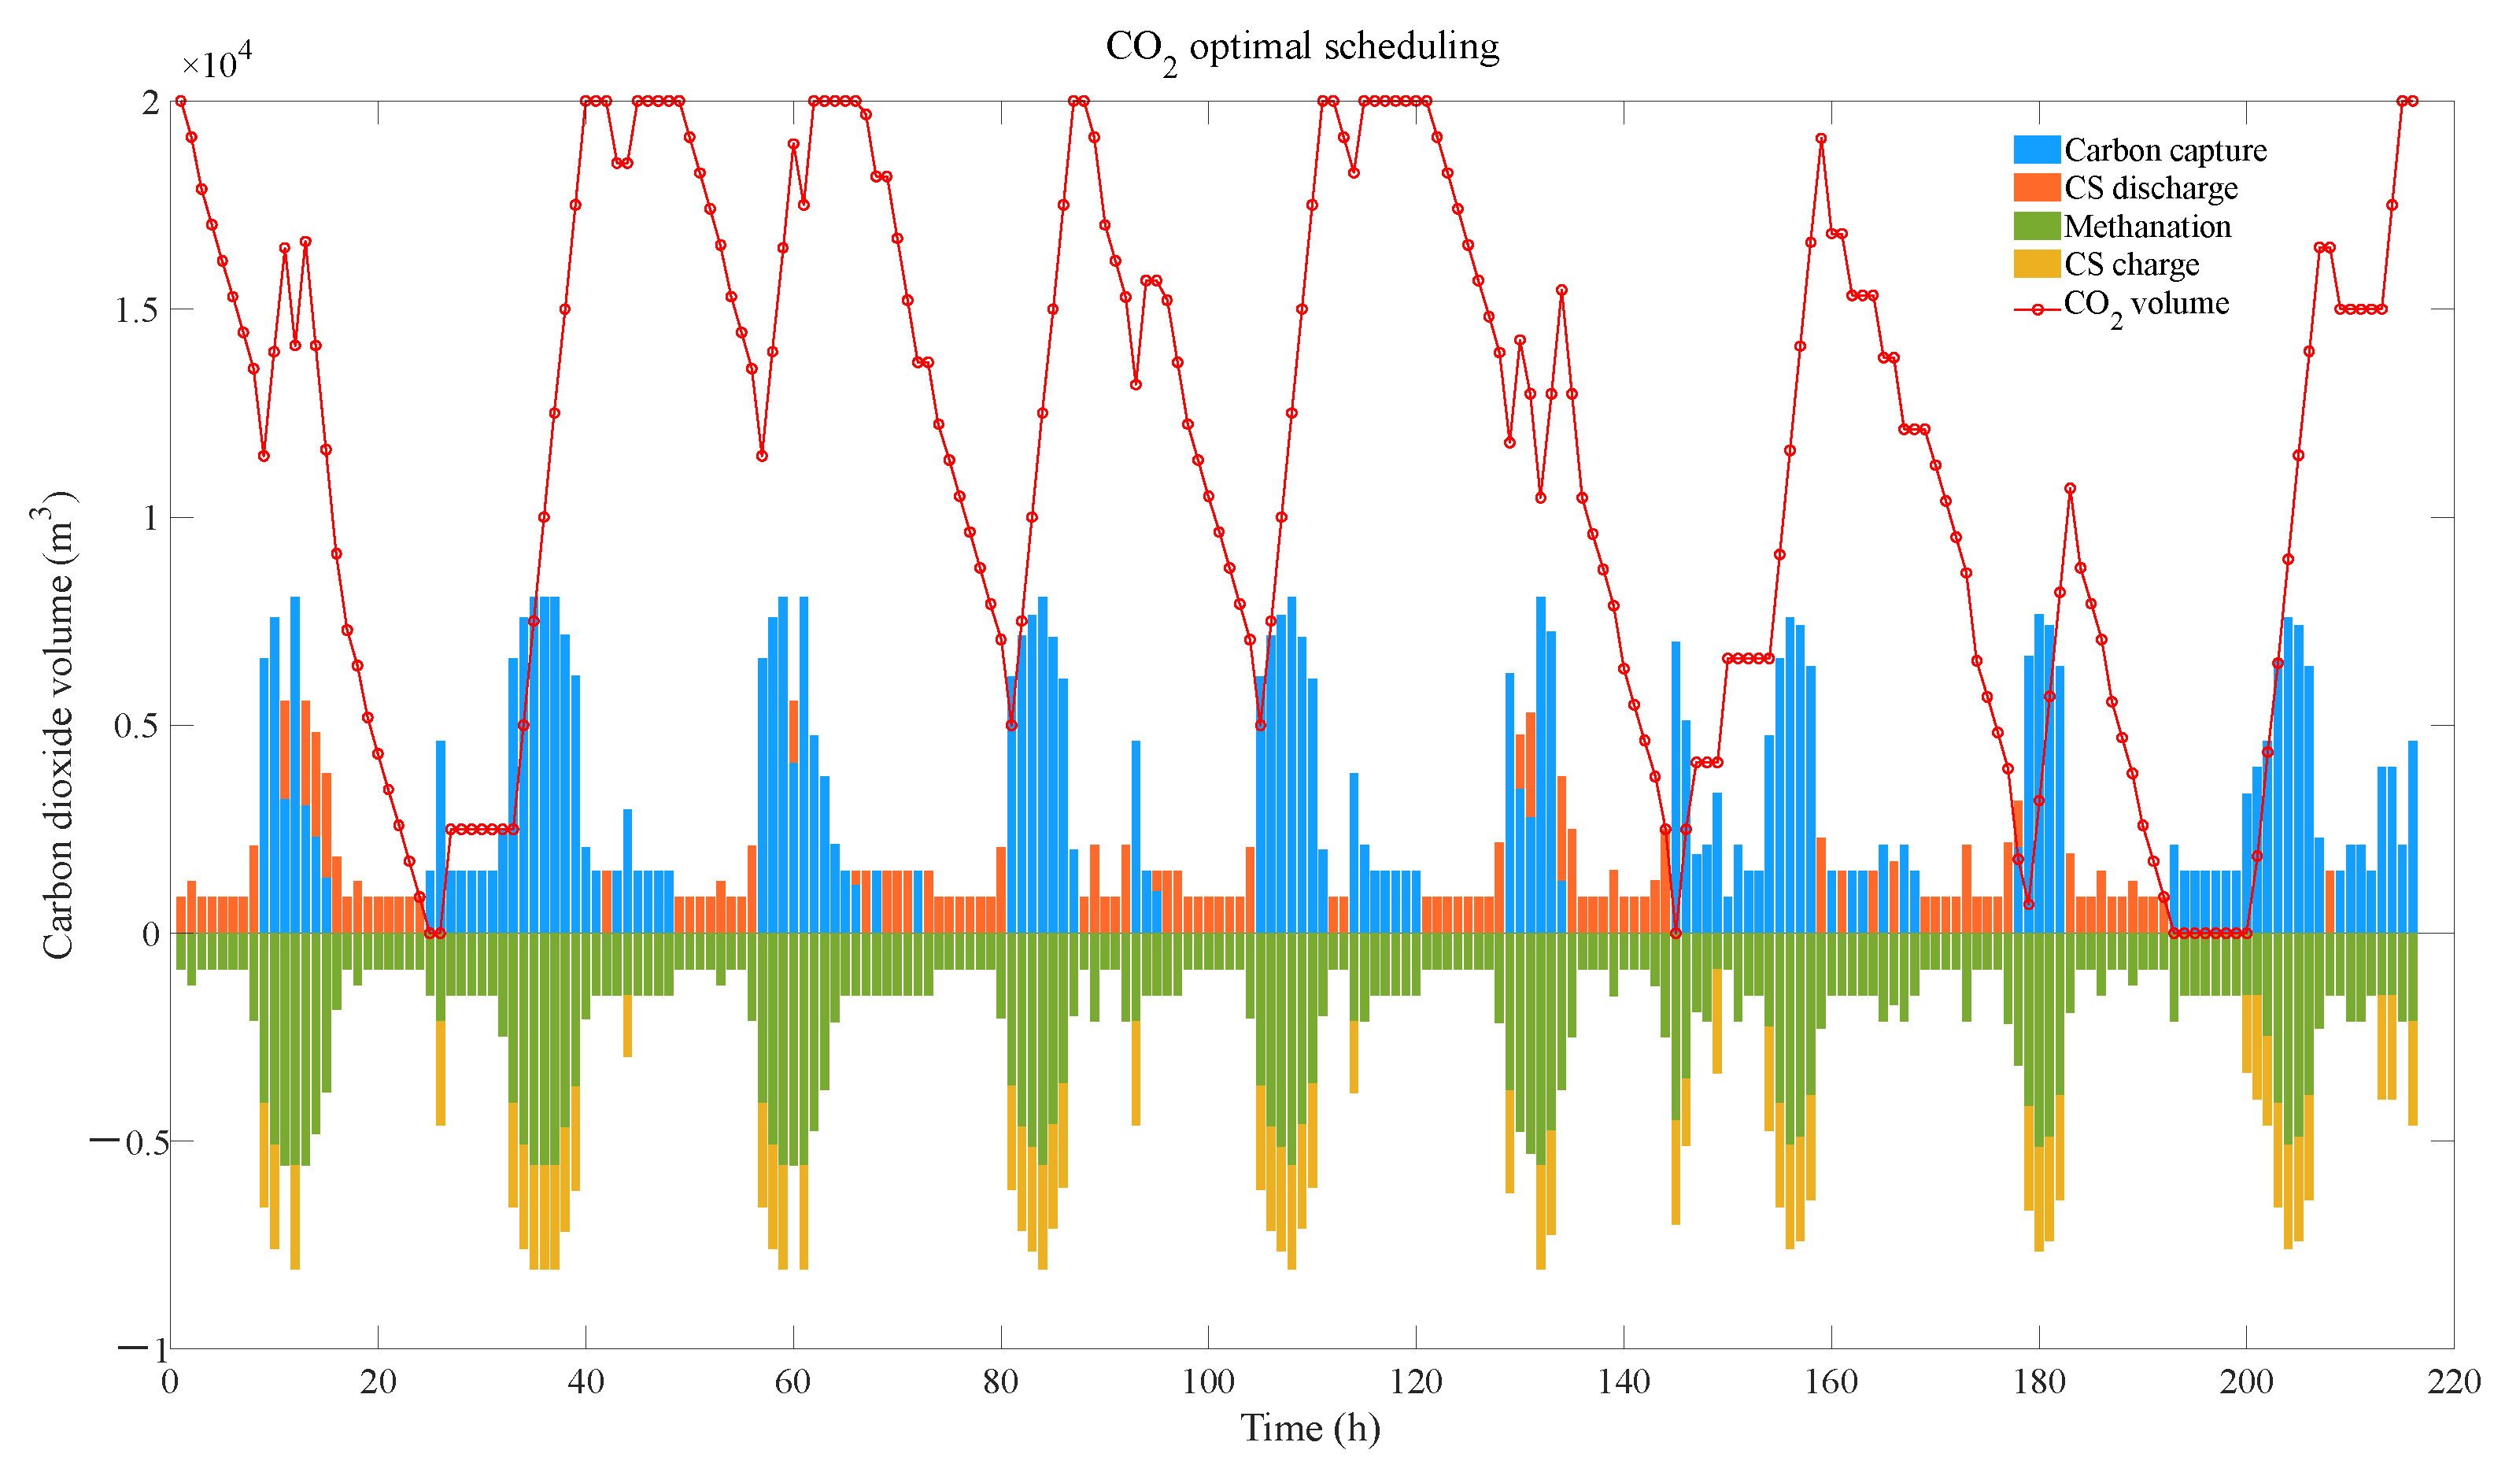
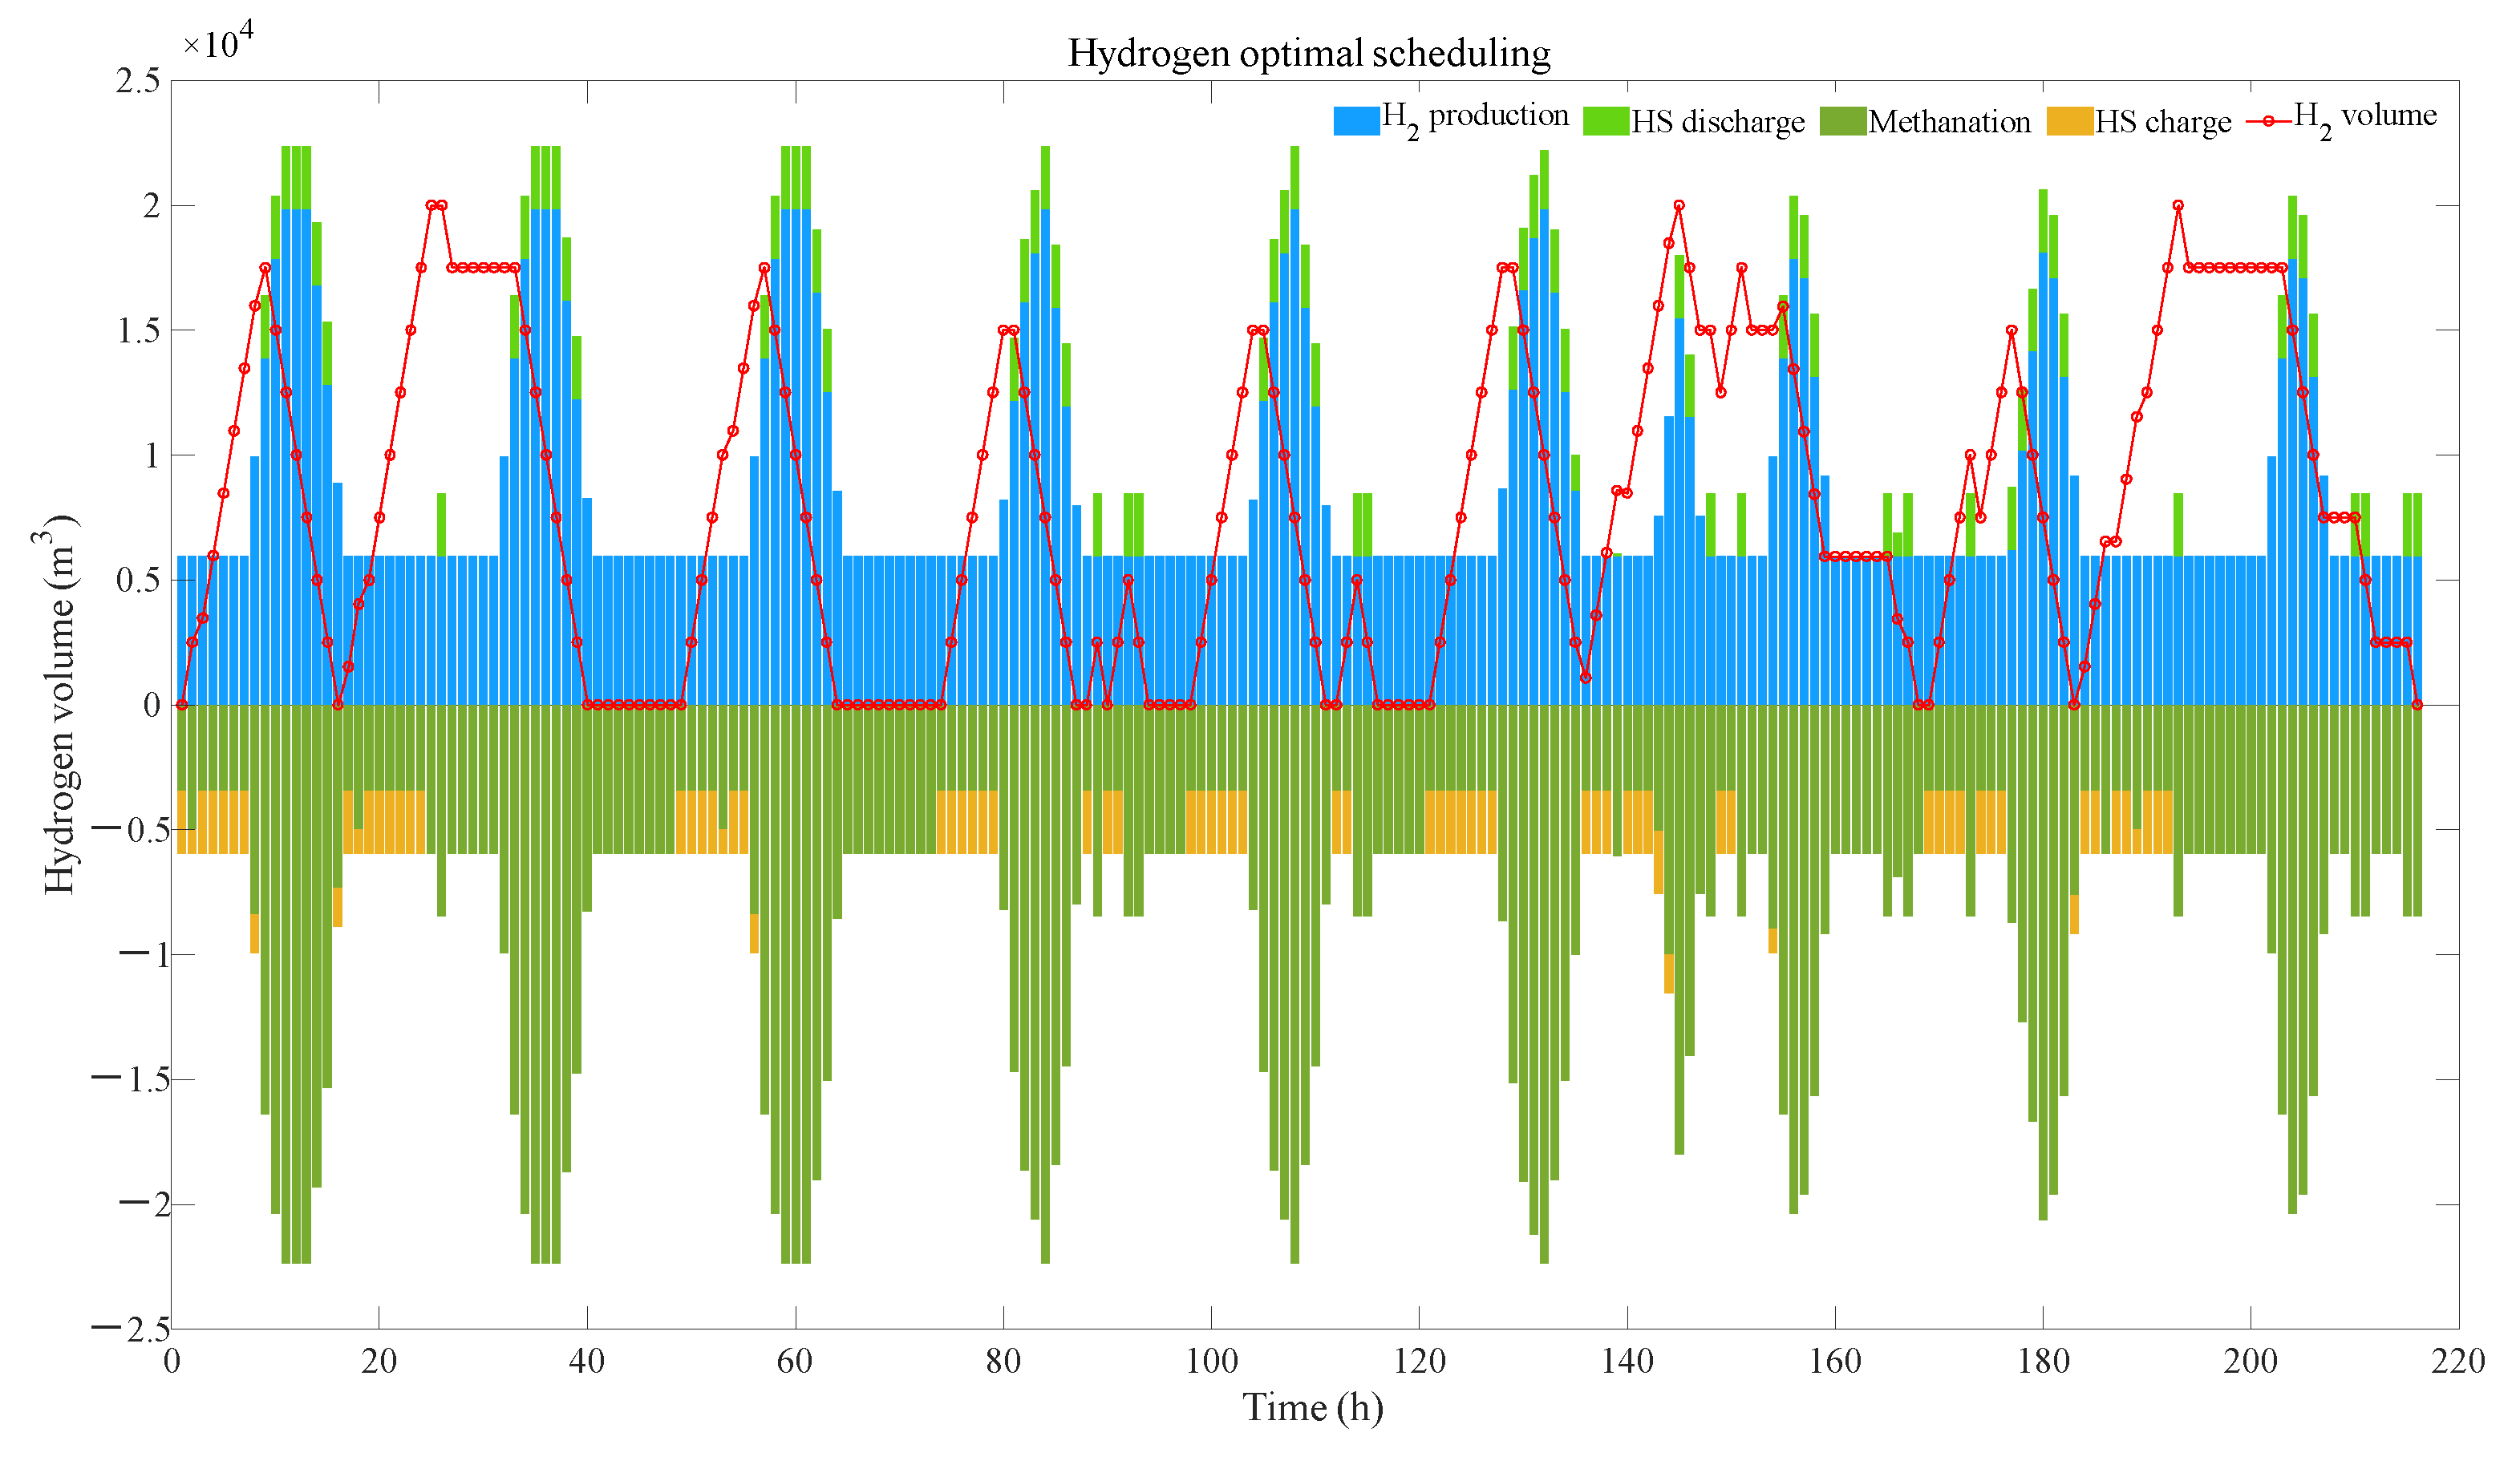
5.2.2. Analysis of Energy Storage Flexibility

Compared to Scenario 1, Scenario 2 has carbon and hydrogen storage tanks. As seen from Table 3, although Scenario 2 is equipped with various energy storage devices, such as carbon and hydrogen storage tanks, the total equipment investment cost is significantly reduced. This is mainly because energy storage devices enhance the flexible operation of the IEPS, reduce the configuration capacity of photovoltaic and electrolytic cells, and cut the total system cost under the premise of achieving economic and stable system operation. The optimal scheduling of CO2 and hydrogen in the system for Scenario 2 is shown in Figure 6 and Figure 7, where the carbon capture captures CO2, and the electrolytic cell produces hydrogen in higher amounts during the day when the photovoltaic output is more elevated. In addition to the hydrogen produced by the electrolytic cell to synthesize methane with the CO2 captured by the CCS, the rest of the hydrogen can be stored in storage tanks and used to synthesize methane when H2 production is insufficient and CO2 production is high. The configuration of carbon and hydrogen storage tanks allows for the capture and utilization of more carbon dioxide, increasing the efficiency of hydrogen and methane production.
Compared with Scenario 1, in Scenario 2, due to the configuration of carbon storage tanks and hydrogen storage tanks, the IEPS investment total cost is reduced by 10.5%, the net income is increased by 5.5%, the total photovoltaic output is increased by 1.1%, and the carbon emission is reduced by 27,596 tones. Scenarios 3 and 4 consider the uncertainty of photovoltaic output and load, and Scenario 4 adds the optimal configuration of carbon and hydrogen storage equipment based on Scenario 3. Compared to Scenarios 3 and 4, the presence of carbon and hydrogen storage tanks results in a 12.2% decrease in IEPS investment costs, a 5.3% increase in net benefits, a 1.2% increase in the total output share of photovoltaic, and the 24,510 tones reduction in carbon emissions. The comparison of Scenarios 1 and 2 and Scenarios 3 and 4 illustrate that the configuration of energy storage devices significantly improves the capacity of clean and renewable energy, reduces the carbon emission reduction of the energy system, and dramatically enhances the economics of IEPS energy production.

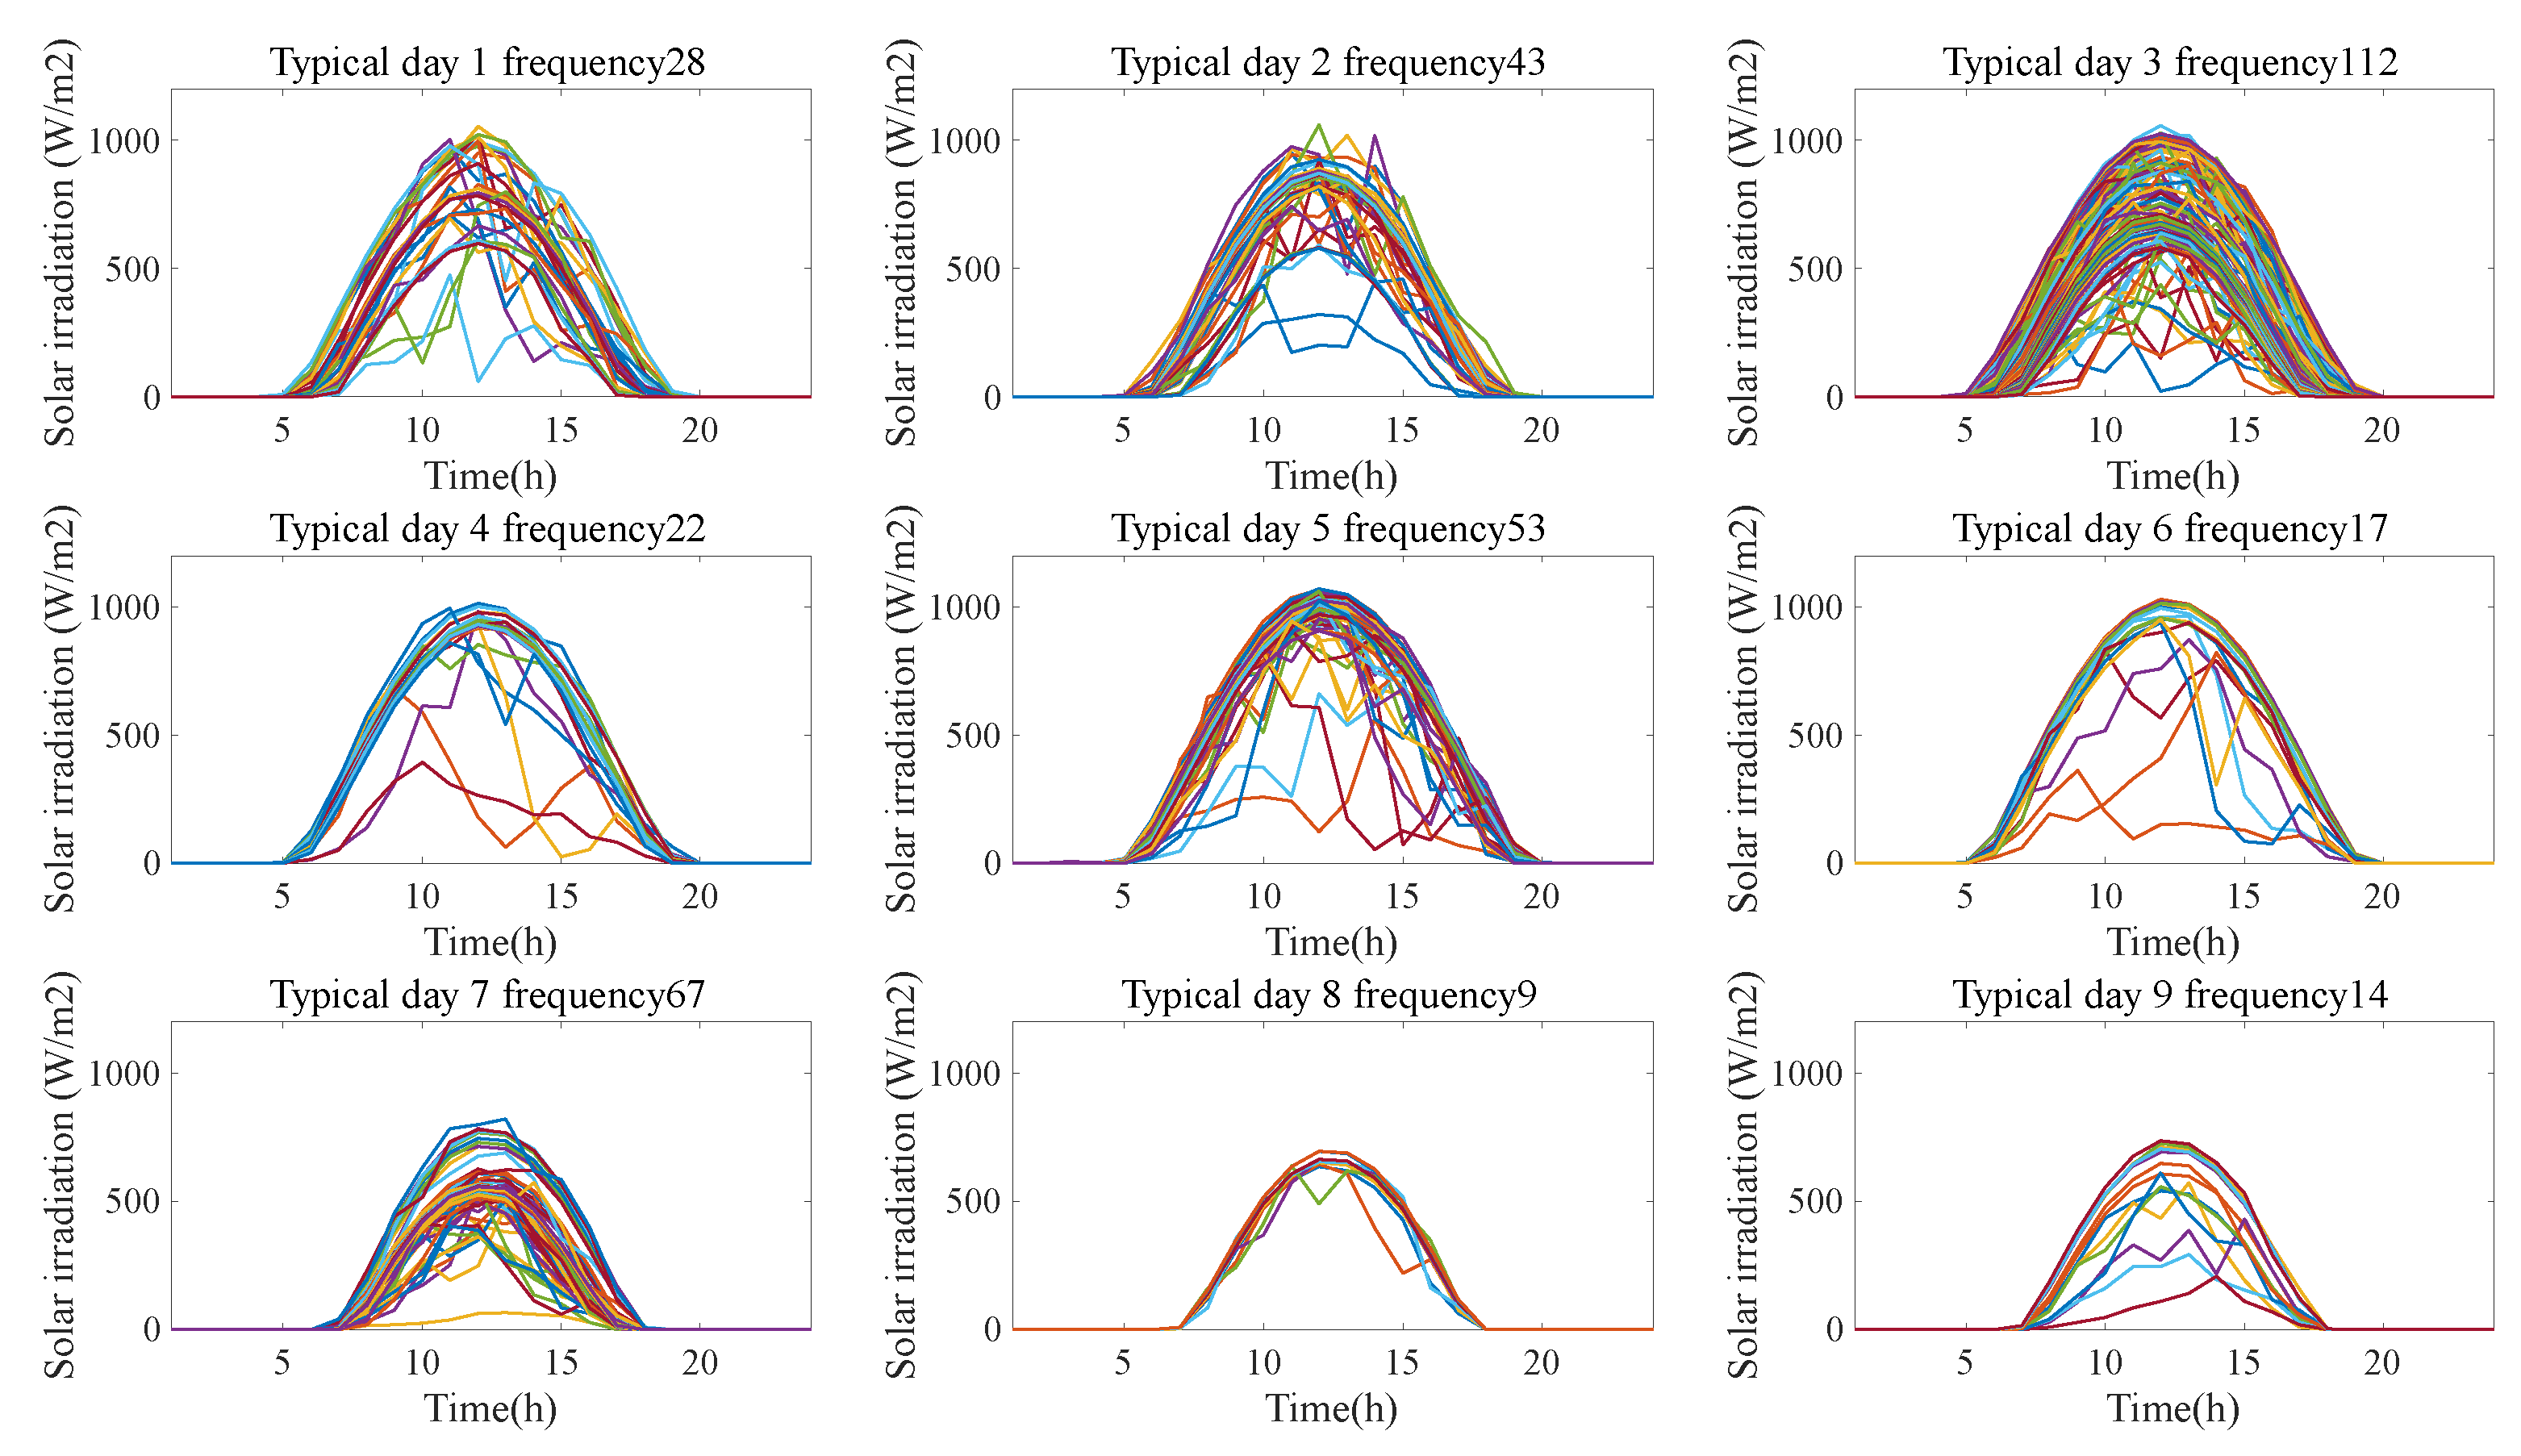
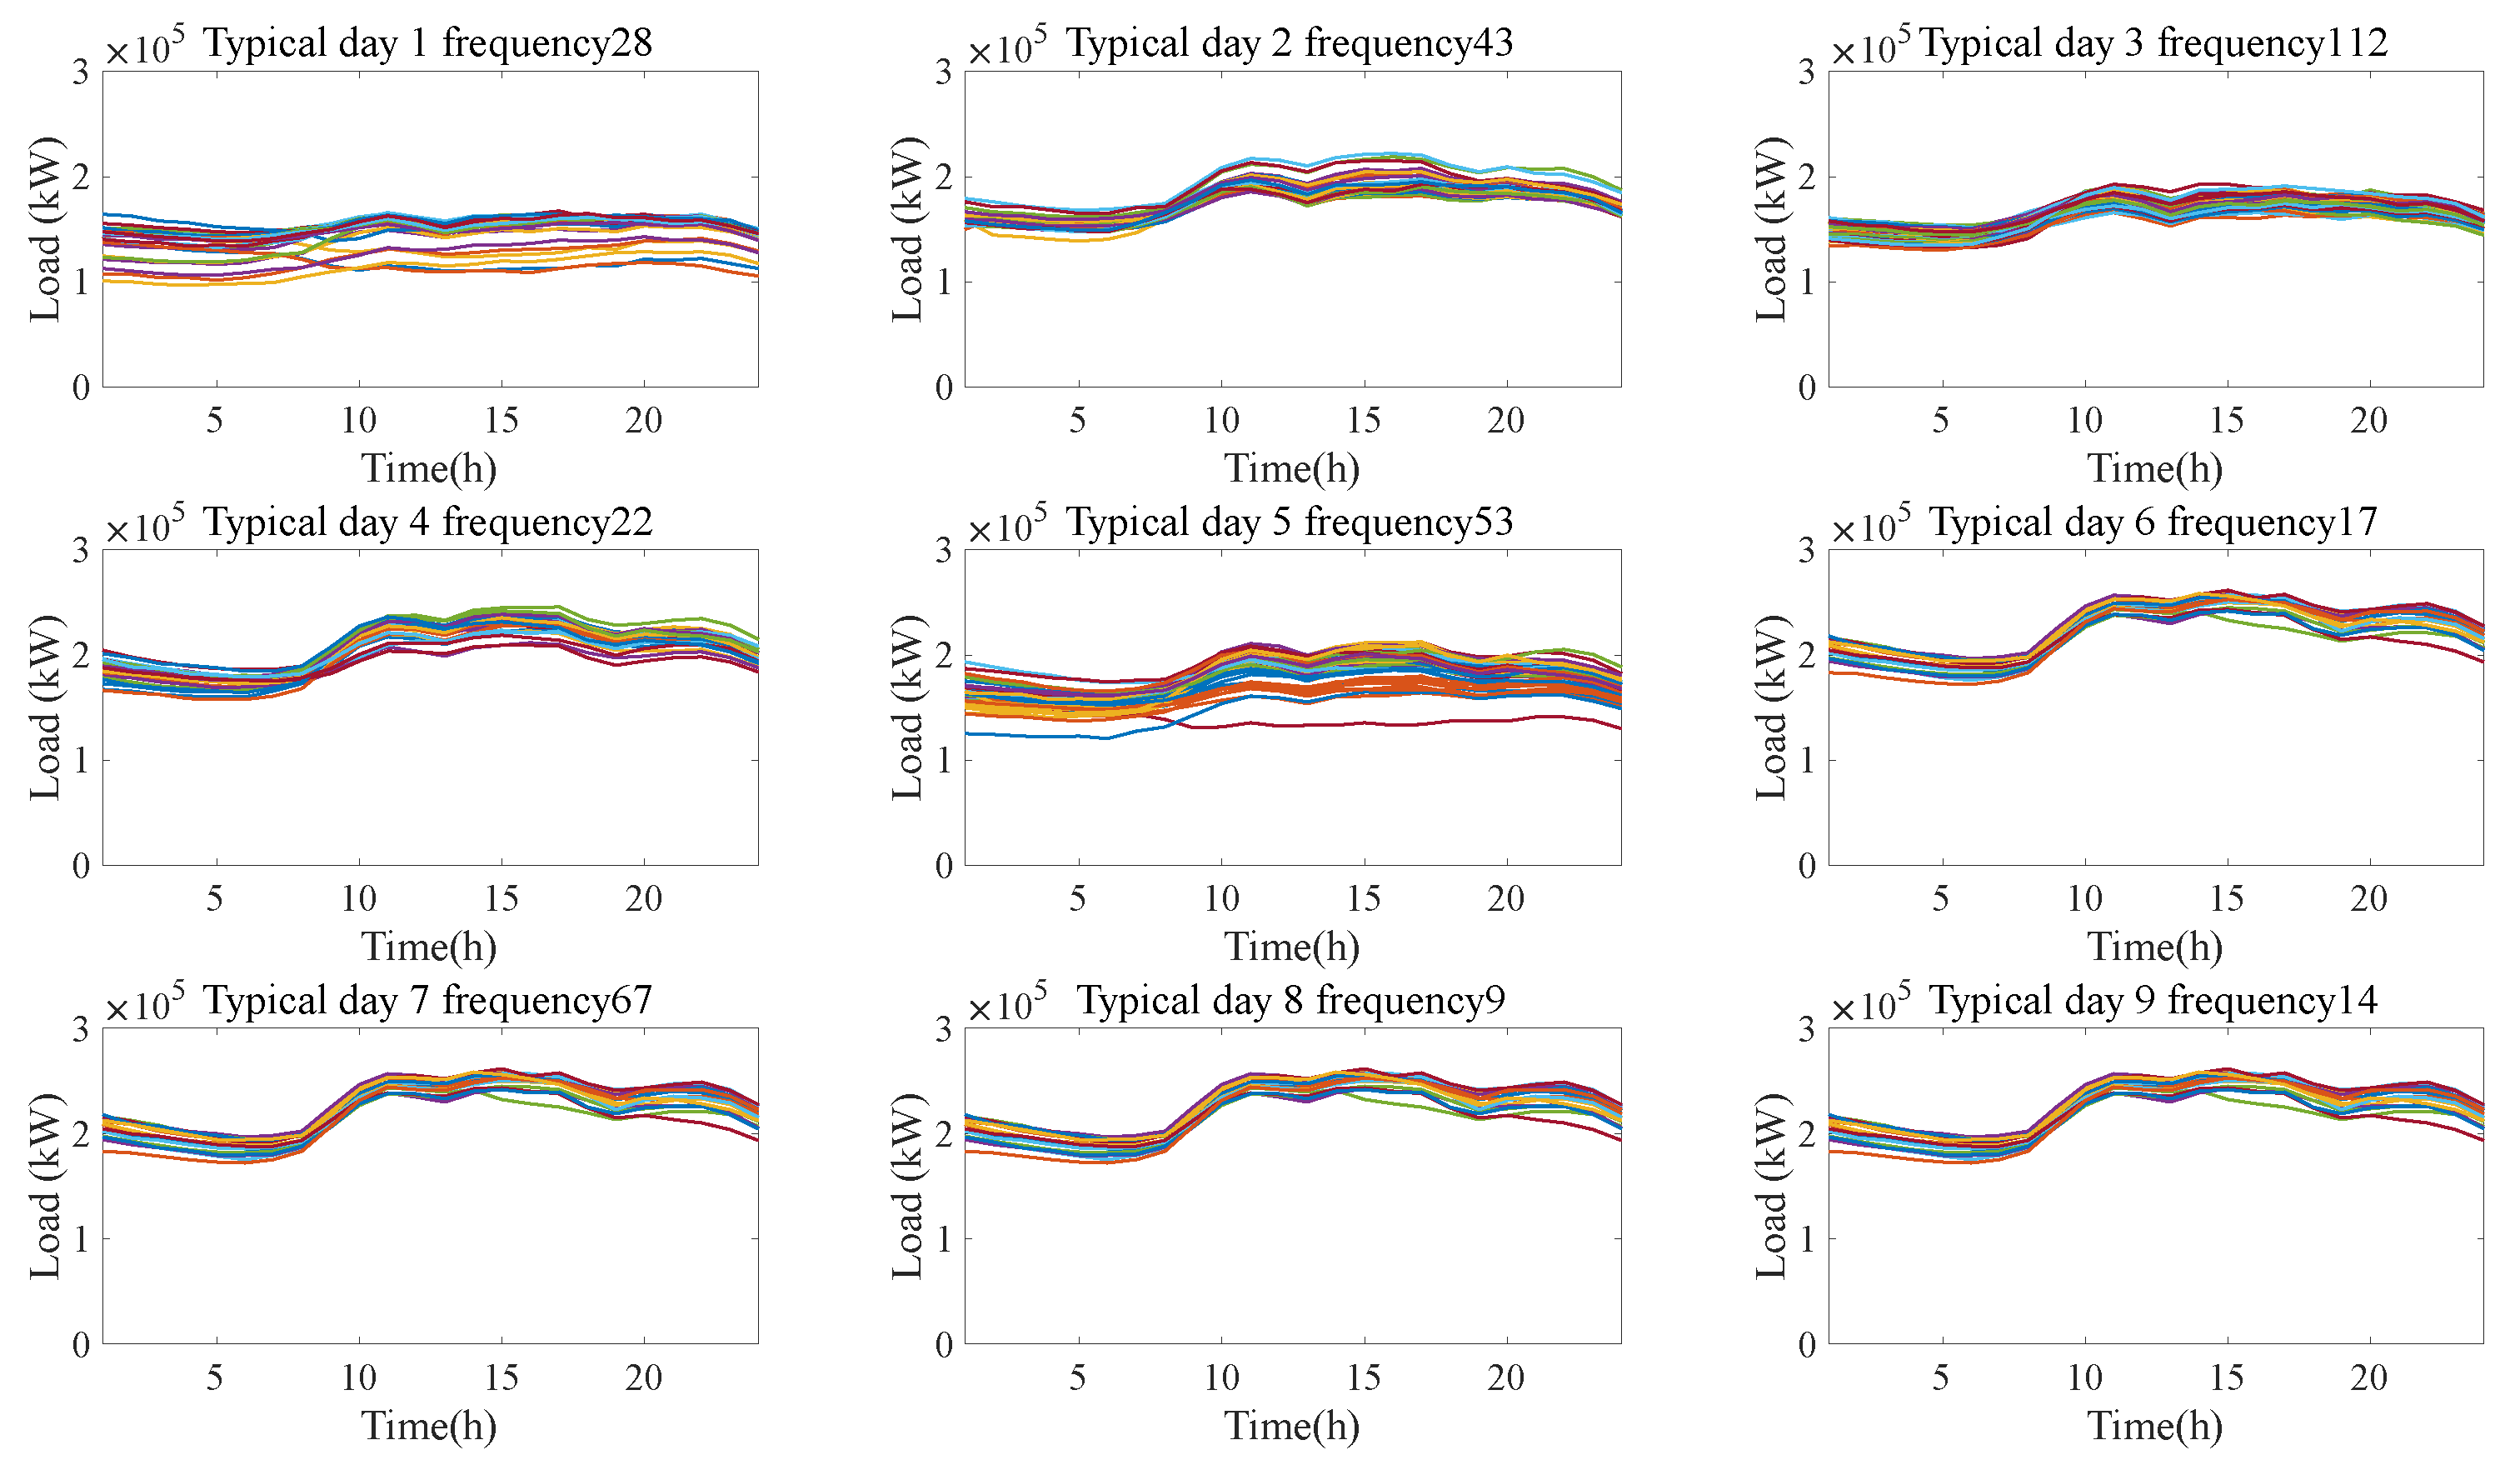
5.2.3. Uncertainty Analysis

In this study, for Scenario 1 and Scenario 2, one typical day of each season is selected as the simulation basis for optimal allocation and annual operation. For Scenarios 3 and 4, the SBR algorithm based on Kantorovich distance combined with the improved K-means clustering algorithm is applied to reduce and extract the photovoltaic and load stochastic scenarios, transforming the uncertain photovoltaic and load stochastic scenarios into deterministic multiple typical daily scenarios for simulation solutions. The initial clustering and scenarios reduction of solar irradiance and load for Scenarios 3 and 4 are shown in Figure 8 and Figure 9.
Scenarios 3 and 4 consider the photovoltaic output and load uncertainty based on Scenarios 1 and 2, respectively. The comparative analysis in Table 3 shows that for the case without carbon and hydrogen storage equipment, there is an 11.8–19.7% error in the equipment capacity configuration between the deterministic model and the stochastic optimization model considering uncertainty. For the case of configuring carbon and hydrogen storage equipment, the deterministic model and the stochastic optimization model have an error of 12.0–24.4% in the equipment capacity configuration. In particular, for photovoltaic capacity configuration and annual total power demand, the stochastic optimization model increased the photovoltaic capacity configuration by 11.8% and 12.0% compared to the deterministic model in the two cases, respectively, and the annual total photovoltaic output increased by 17.0% and 16.2%. Under the influence of uncertainty factors, the yearly power demand increases by about 22.2% compared with the deterministic model. The accurate description of source-load uncertainty significantly impacts the planning and optimal operation of the energy system. Therefore, considering the source-load uncertainty in the capacity configuration and operational optimization of IEPS is crucial for accurately characterizing the system model. Electrolytic cells, methane reactors, carbon storage, and hydrogen storage equipment serve as flexible and adjustable resources in the IEPS system, which is highly important in improving the system’s flexibility, coping with source load uncertainties, and reducing system errors.

5.3. Sensitivity Analysis

For the IEPS established in this paper, the total cost is not only influenced by the investment cost and operation and maintenance cost but also closely related to the fuel acquisition cost and the profit from the sales of produced energy. The fluctuation of the energy market price factor will affect the system’s optimal allocation and operation scheduling. Therefore, based on the simulation results of the case study, this paper further analyzes several energy prices in the coal, natural gas, and carbon trading markets and studies the impact of price factors on the optimal allocation of the IEPS system capacity.

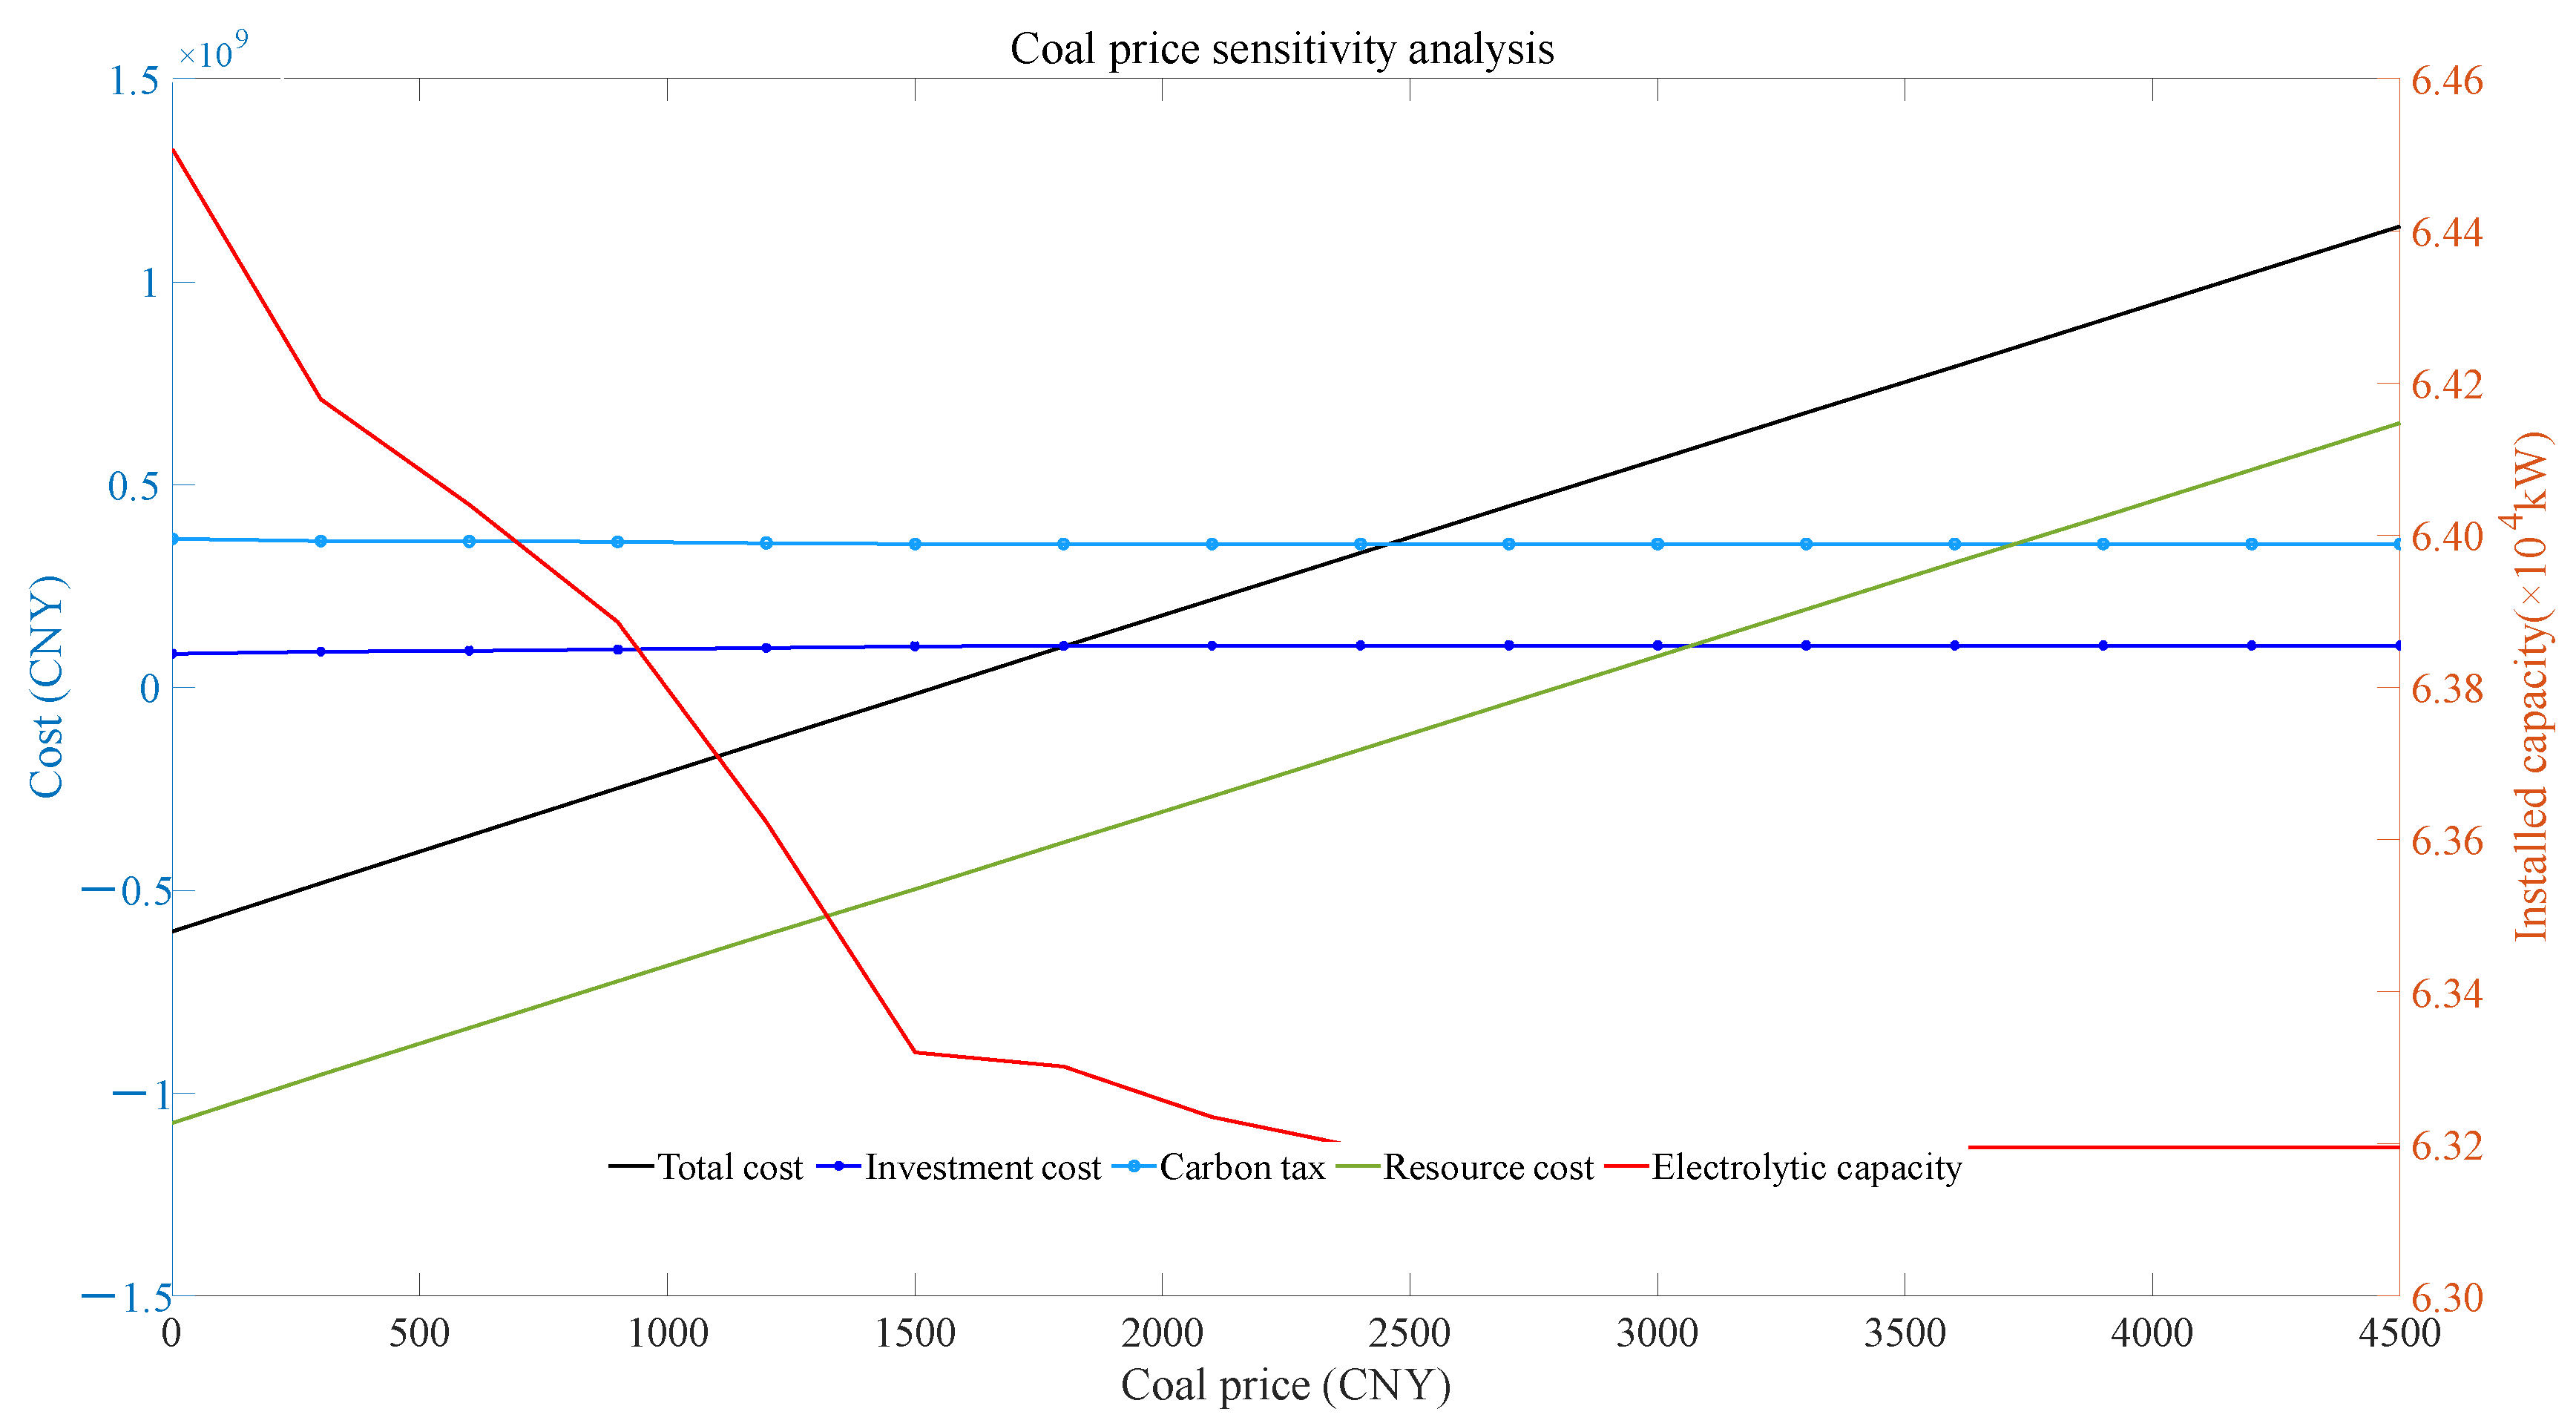
5.3.1. Coal Price Sensitivity Analysis

From Figure 10, the IEPS total cost and the raw material acquisition cost also rise significantly with the coal price increase and are linearly related to the coal price. The investment and carbon cost of the system remain stable while the configured capacity of the electrolytic cell first decreases and then remains the same. As the coal price gradually increased to 2400 CNY/tce (ton of standard coal equivalent, tce), the rising cost of coal raw materials resulted in higher carbon capture and methane synthesis expenses. To optimize the overall investment and operational costs of the energy system, the configured capacity of the electrolyzer and methanation equipment showed a slow downward trend. Consequently, the amount of carbon capture and methane synthesis was reduced. The investment cost of the system offers a slow-down trend. Compared with the coal price 0, when the coal price increases to 2400 CNY/tce, the investment cost decreases by 24.4%. When coal prices are more excellent than 2400 CNY/tce, it is too costly to synthesize methane from CO2 captured by system CCS and H2 generated by P2G. The electrolytic cell capacity is mainly influenced by the minimum operating constraint of the thermal unit, which needs to be configured with the minimum power and maintain the minimum functional level. Therefore, when the price of coal is lower than 2400 CNY, the lower the cost of coal, the more economical the thermal power and PV power generation capacity used for the electrolysis of water to produce hydrogen, and the greater the installed capacity of the electrolytic cell. The higher the price of coal, the higher the cost of thermal power, the lower the consumption of coal and the PV power generation capacity is mainly used to satisfy the demand of the loads. The cost of using it to produce hydrogen rises, and the capacity demand of the electrolytic cell decreases.

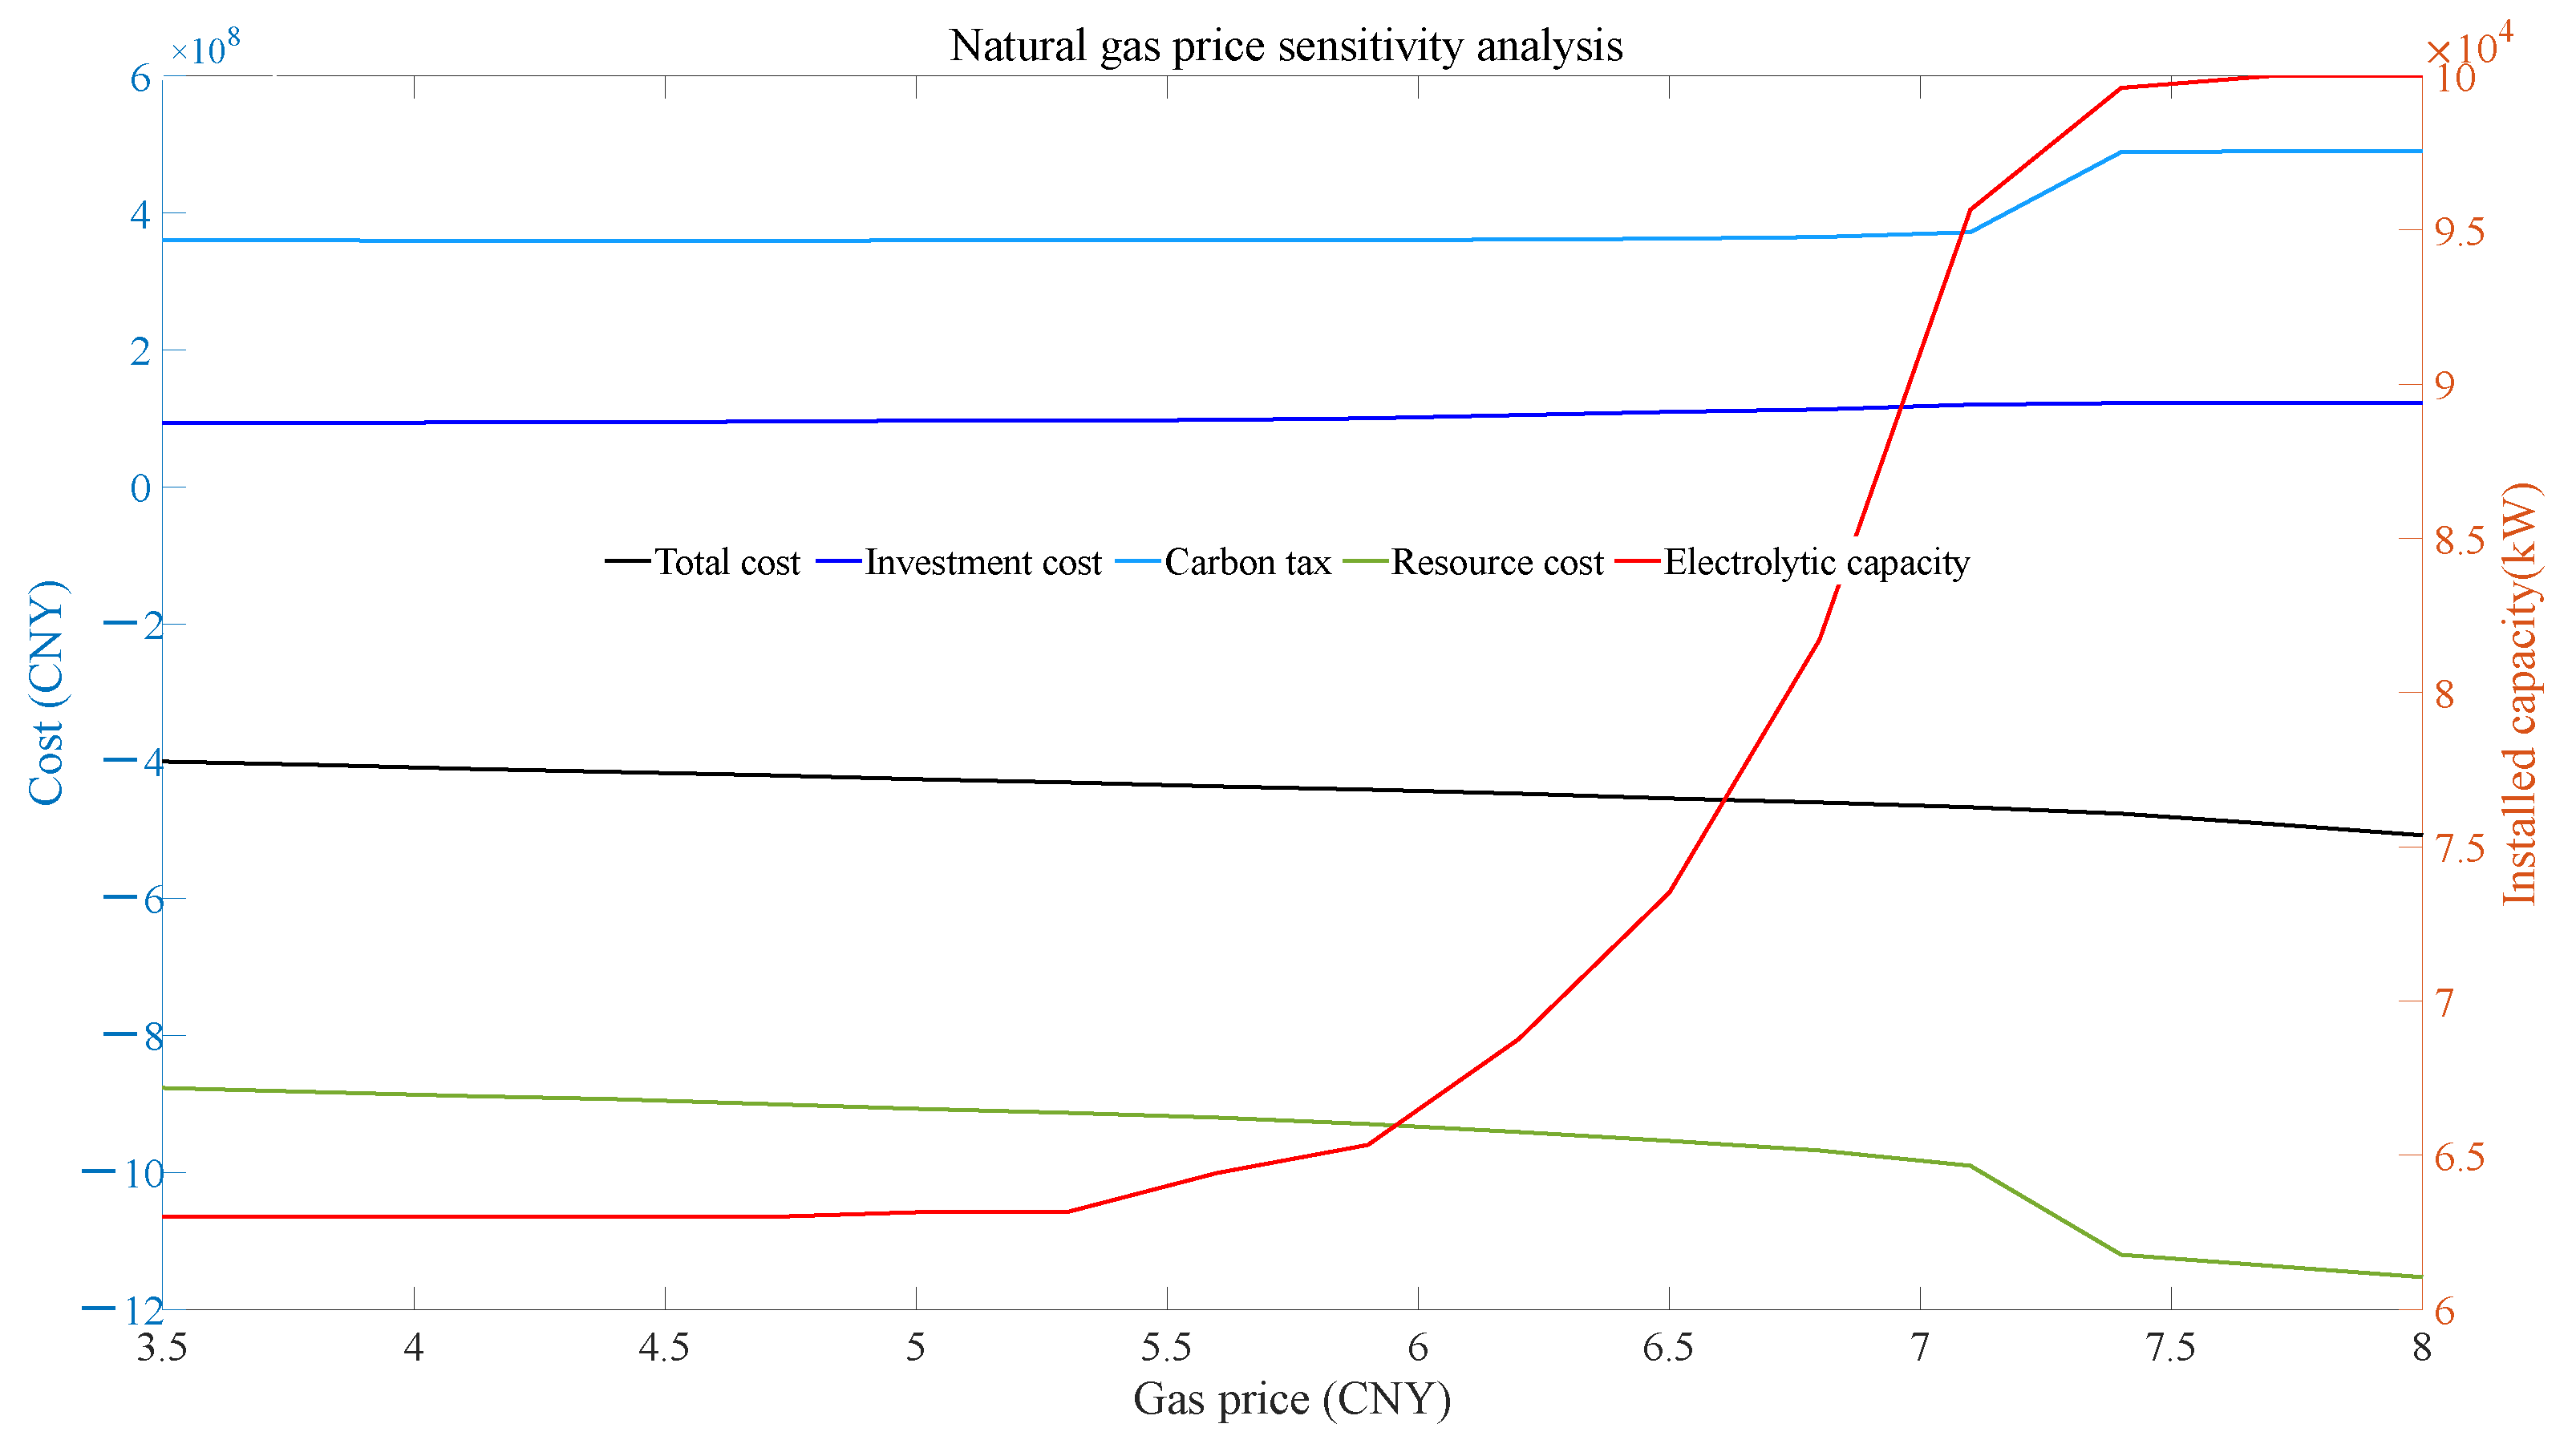
5.3.2. Natural Gas Price Sensitivity Analysis

When natural gas prices vary in the range of 3.5 to 8 CNY/m3, the various cost and capacity configurations of IEPS are shown in Figure 11. With the gradual increase in natural gas prices, the configuration capacity of the electrolytic cell as a whole showed a slowly rising trend and experienced three stages of maintaining the same, slowly rising and stabilizing. The system’s overall cost and raw material procurement cost have slowly declined. The IEPS’s investment and carbon tax costs have remained relatively stable. When the price of natural gas is more incredible than 7.7 CNY, the decrease in raw material acquisition cost shows an accelerated process, and the carbon tax cost remains stable after a short increase process. When the natural gas prices vary from 3.5~5.3 CNY/m3, it is not economically efficient to use CO2 and H2 produced by CCS and P2G equipment to synthesize methane, so the configuration capabilities of the electrolytic cell are mainly influenced by the minimum operating constraint of the thermal power units, which is kept at the lowest installed and operational level. When natural gas prices range from 5.3 to 7.7 CNY/m3, the methane synthesis by CCS and P2G has high economic efficiency. Hence, the installed capacity of the electrolytic cell increases gradually at this time. When the natural gas price is more than 7.7 CNY/m3, the configured ability of the electrolytic cell is at the maximum installed size and maximum power operation due to the unit output, carbon capture efficiency, load demand, and other related constraints. The sensitive price range can balance electrolytic cells’ installed capacity and help the energy sector set prices according to local energy endowments and demand.

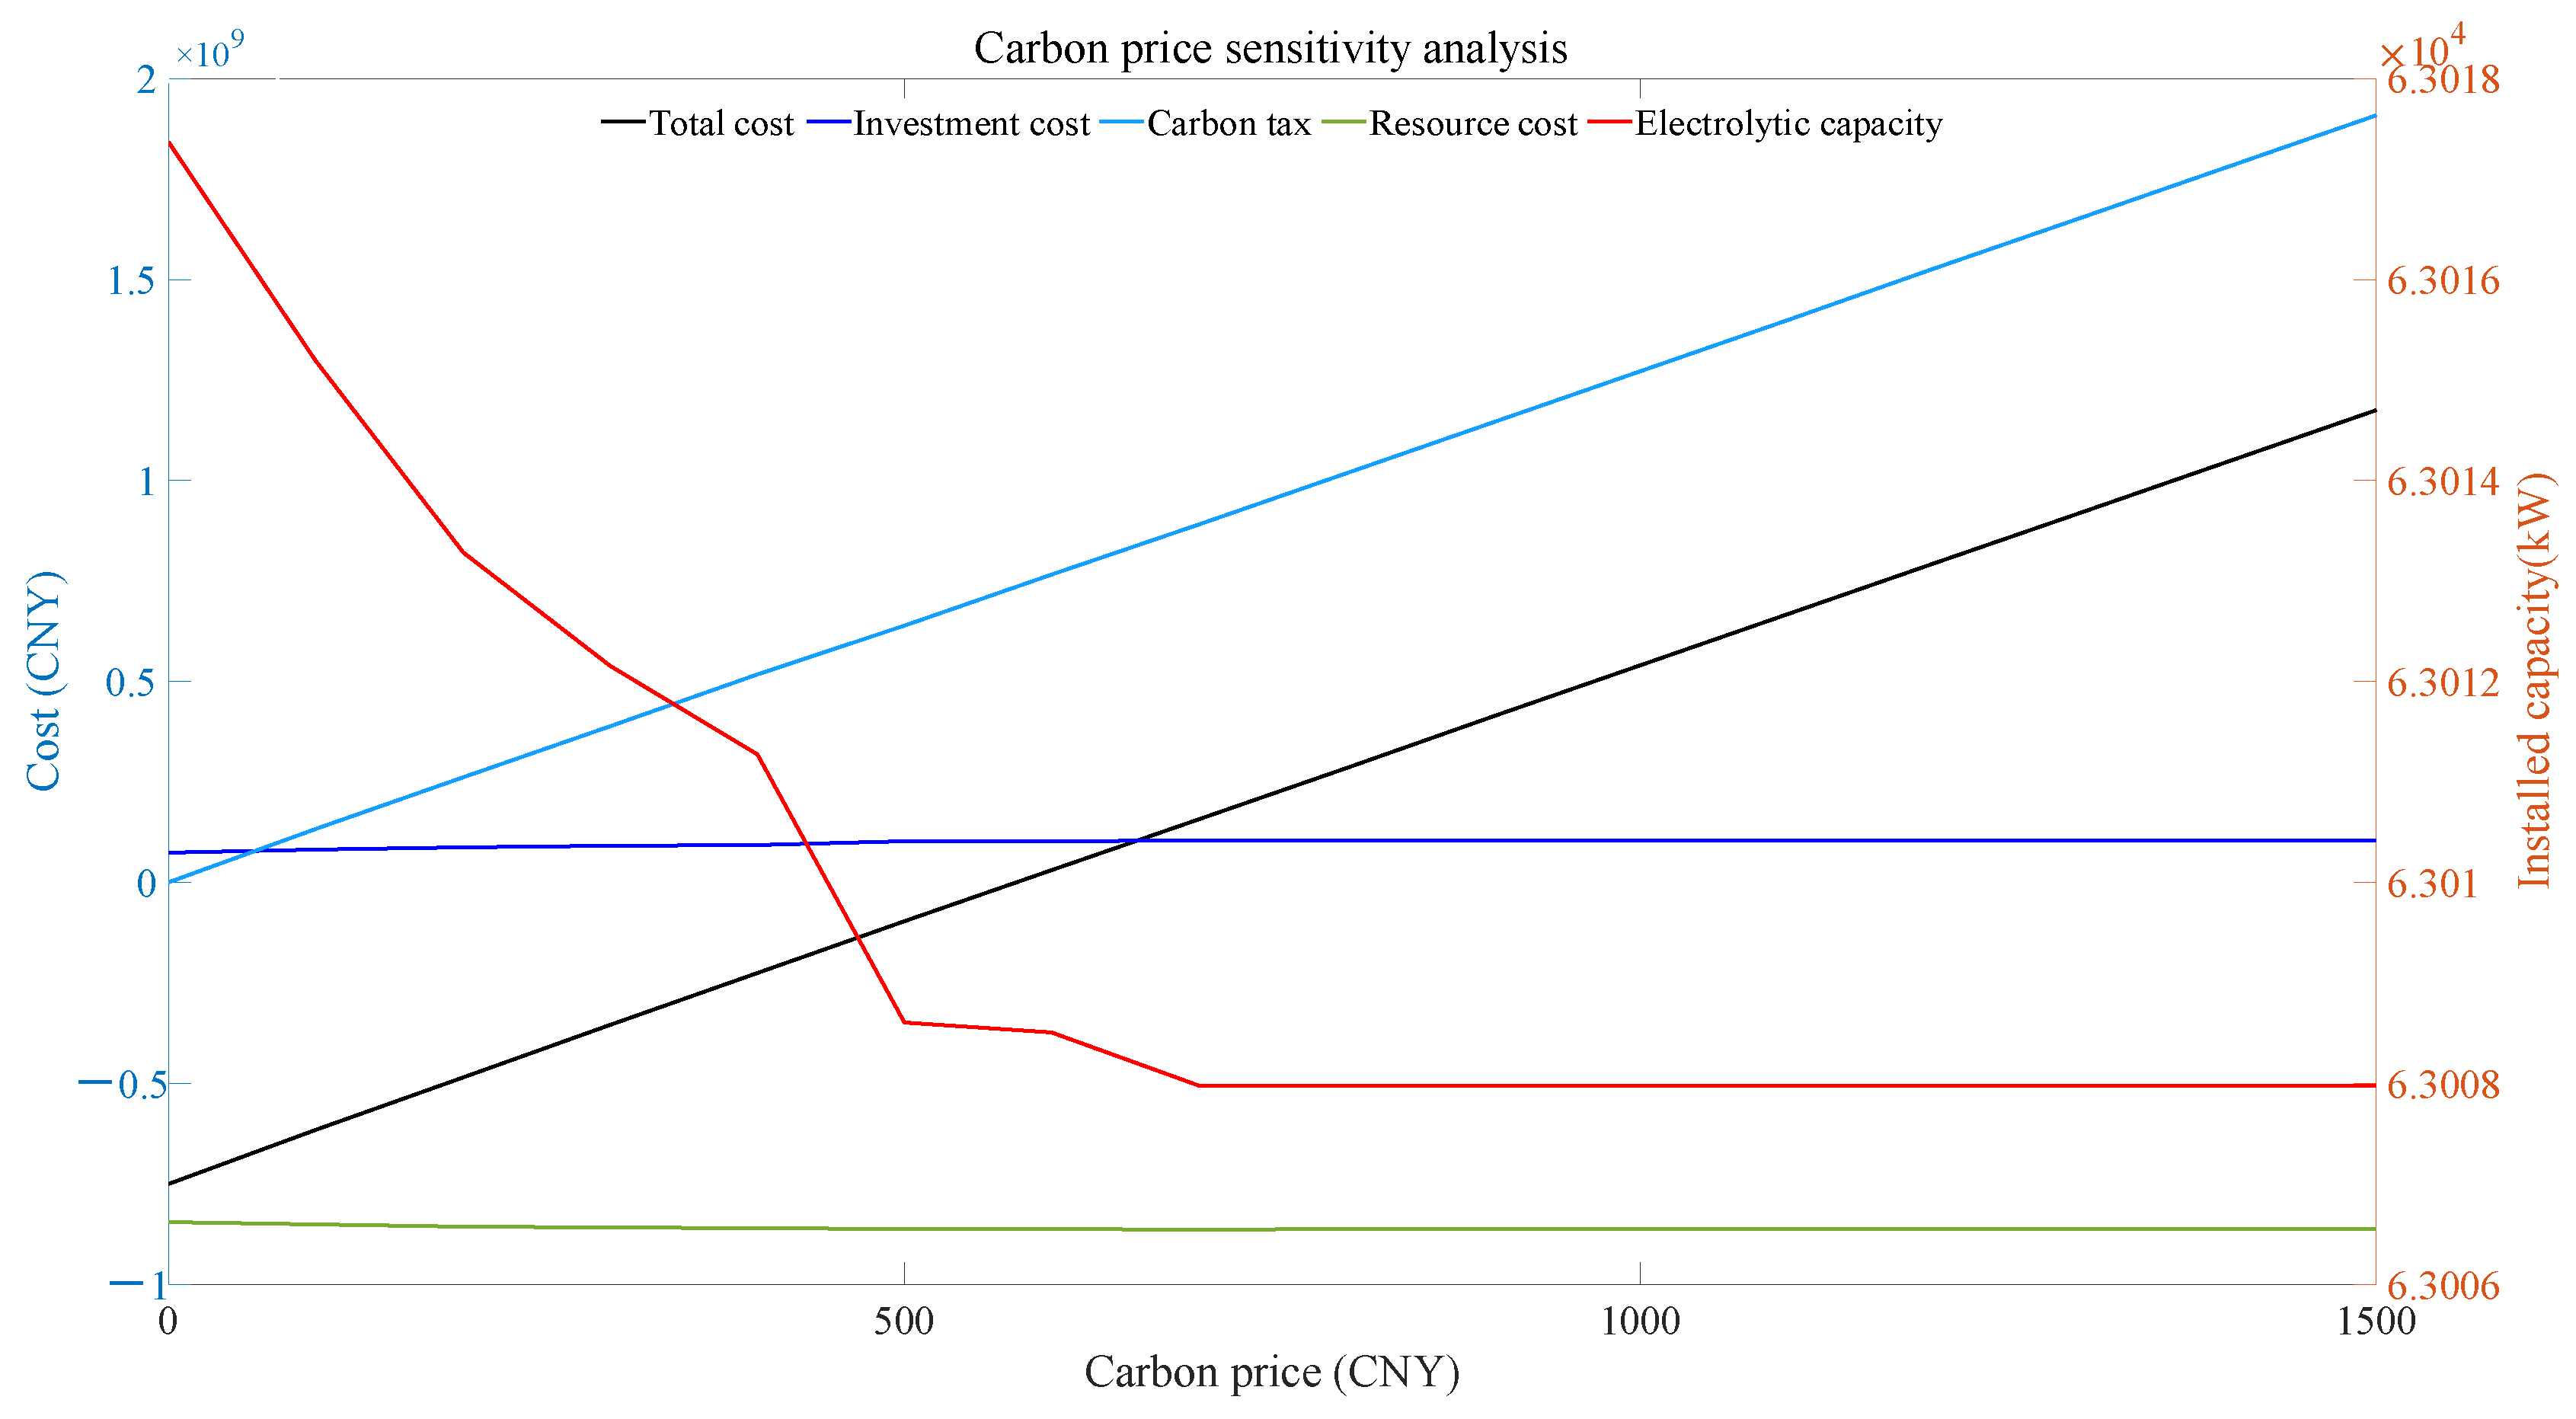
5.3.3. Carbon Tax Price Sensitivity Analysis

According to Figure 12, as the carbon tax price increases, the carbon emission cost and total cost of the IEPS system also significantly increase, showing a linear relationship. The investment cost of the system and the cost of purchasing raw materials almost remain unchanged, while the configuration capabilities of the electrolytic cell first decrease and then remain unchanged. When the carbon tax price is under 700 CNY/t, the cost of carbon emissions gradually increases but remains relatively low. Therefore, it is not economically feasible to use CCS and P2G to synthesize methane, resulting in a gradual decrease in the configuration capacity of the IEPS. When the carbon tax price is higher than 700 CNY/t, because the benefits of synthetic methane compared to the carbon tax do not have significant advantages and are limited by the minimum operating constraint of the thermal power generation units, the electrolytic cell configuration remains at the lowest installation level. China’s carbon trading market is still in its infancy, and a reasonable carbon tax price setting can effectively guide users to participate in the carbon trading market. The sensitivity interval of the carbon tax price provides a reference for formulating the carbon tax price, which is conducive to promoting the healthy and sustainable development of the carbon trading market.

6. Conclusions

This study focuses on the integrated energy production system. It proposes a random optimization configuration model that integrates various devices, including CCS, P2G, carbon storage, and hydrogen storage, offering multiple forms of energy, such as electricity, hydrogen, methane, and carbon dioxide, to achieve the recycling of hydrogen and carbon dioxide. Through simulation and multi-scenario comparative analysis, the accuracy and effectiveness of the model are verified. The main conclusions are as follows:
(1)
The integrated energy production system established in this study integrates the CCS and P2G technologies to realize the coupling and transformation of energy resources such as electricity, gas, hydrogen, and carbon dioxide, which can considerably reduce the carbon emission of the system and promote the accommodation of clean and renewable energy.
(2)
Configuring carbon and hydrogen storage equipment in the system can improve the system’s flexibility. The case study results verified that the IEPS significantly improved system economics, PV accommodation rate, and carbon emission reduction when configured with carbon and hydrogen storage equipment.
(3)
This article uses the SBR algorithm based on Kantorovich distance and an improved K-means clustering algorithm to address the uncertainty of photovoltaic output and load. The comparison of the optimization results demonstrates that the capacity allocation scheme, which considers the uncertainties of both photovoltaic output and load, is more practical.
(4)
Sensitivity analysis results show that price factors significantly impact the operating cost of energy systems and the capacity configuration of equipment. The sensitive range of energy prices can provide a decision-making reference for pricing in the energy market.
This study gives a direction for the transition and transformation of China’s current stage thermal power-based energy system to a green, sustainable energy system. The research data in this study mainly comes from statistical data of the reference area and published articles. The sensitivity analysis requires high accuracy of the data. The local resource endowment, energy price, and other factors should be fully considered in constructing the IEPS. In addition, the study considered the source and load uncertainty. Many uncertainty factors affect the IES operation, such as the efficiency of the energy equipment and the flexibility of resources on the load side. In the future, the influence of multiple uncertain factors on the planning and operation of the IES will be further studied.

Author Contributions

A.M.: Methodology, analysis, and writing. Y.Y.: Supervision and review. Y.H.: Wrote sections of the manuscript. H.W.: Review and editing. C.F.: Data curation and investigation. All authors have read and agreed to the published version of the manuscript.

Funding

This work was supported by the Postgraduate Research & Practice Innovation Program of Jiangsu Province, China (KYCX22_0606).

Institutional Review Board Statement

Not applicable.

Informed Consent Statement

Not applicable.

Data Availability Statement

The original contributions presented in the study are included in the article. Further inquiries can be directed to the corresponding author.

Conflicts of Interest

The authors declare no conflict of interest.

References

  1. Shen, W.; Qiu, J.; Meng, K.; Chen, X.; Dong, Z.Y. Low-Carbon Electricity Network Transition Considering Retirement of Aging Coal Generators. IEEE Trans. Power Syst. 2020, 35, 4193–4205. [Google Scholar] [CrossRef]
  2. Xu, H.; Pan, X.; Guo, S.; Lu, Y. Forecasting Chinese CO2 emission using a non-linear multi-agent intertemporal optimization model and scenario analysis. Energy 2021, 228, 120514. [Google Scholar] [CrossRef]
  3. Jia, L.; Cheng, P.; Yu, Y.; Chen, S.; Wang, C.; He, L.; Nie, H.; Wang, J.; Zhang, J.; Fan, B.; et al. Regeneration mechanism of a novel high-performance biochar mercury adsorbent directionally modified by multimetal multilayer loading. J. Environ. Manag. 2023, 326, 116790. [Google Scholar] [CrossRef] [PubMed]
  4. Moioli, E.; Mutschler, R.; Züttel, A. Renewable energy storage via CO2 and H2 conversion to methane and methanol: Assessment for small scale applications. Renew. Sustain. Energy Rev. 2019, 107, 497–506. [Google Scholar] [CrossRef]
  5. Cheng, Y.; Zhang, N.; Lu, Z.; Kang, C. Planning multiple energy systems toward low-carbon society: A decentralized approach. IEEE Trans. Smart Grid 2019, 10, 4859–4869. [Google Scholar] [CrossRef]
  6. Wang, R.; Wen, X.; Wang, X.; Fu, Y.; Zhang, Y. Low carbon optimal operation of integrated energy system based on carbon capture technology, LCA carbon emissions and ladder-type carbon trading. Appl. Energy 2022, 311, 118664. [Google Scholar] [CrossRef]
  7. Schick, C.; Klempp, N.; Hufendiek, K. Role and impact of prosumers in a sector-integrated energy system with high renewable shares. IEEE Trans. Power Syst. 2022, 37, 3286–3298. [Google Scholar] [CrossRef]
  8. Ma, Y.; Wang, H.; Hong, F.; Yang, J.; Chen, Z.; Cui, H.; Feng, J. Modeling and optimization of combined heat and power with power-to-gas and carbon capture system in integrated energy system. Energy 2021, 236, 121392. [Google Scholar] [CrossRef]
  9. Jin, J.; Wen, Q.; Cheng, S.; Qiu, Y.; Zhang, X.; Guo, X. Optimization of carbon emission reduction paths in the low-carbon power dispatching process. Renew. Energy 2022, 188, 425–436. [Google Scholar] [CrossRef]
  10. Lin, S.; Liu, C.; Shen, Y.; Li, F.; Li, D.; Fu, Y. Stochastic Planning of Integrated Energy System via Frank-Copula Function and Scenario Reduction. IEEE Trans. Smart Grid 2022, 13, 202–212. [Google Scholar] [CrossRef]
  11. Zhang, D.; Zhu, H.; Zhang, H.; Goh, H.H.; Liu, H.; Wu, T. Multi-Objective Optimization for Smart Integrated Energy System Considering Demand Responses and Dynamic Prices. IEEE Trans. Smart Grid 2022, 13, 1100–1112. [Google Scholar] [CrossRef]
  12. Wilberforce, T.; Olabi, A.G.; Sayed, E.T.; Elsaid, K.; Abdelkareem, M.A. Progress in carbon capture technologies. Sci. Total Environ. 2021, 761, 143203. [Google Scholar] [CrossRef] [PubMed]
  13. Lee, B.; Lee, H.; Lim, D.; Brigljević, B.; Cho, W.; Cho, H.-S.; Kim, C.-H.; Lim, H. Renewable methanol synthesis from renewable H2 and captured CO2: How can power-to-liquid technology be economically feasible? Appl. Energy 2020, 279, 115827. [Google Scholar] [CrossRef]
  14. He, L.C.; Lu, Z.G.; Zhang, J.F.; Geng, L.J.; Zhao, H.; Li, X.P. Low-carbon economic dispatch for electricity and natural gas systems considering carbon capture systems and power-to-gas. Appl. Energy 2018, 224, 357–370. [Google Scholar] [CrossRef]
  15. Chehade, Z.; Mansilla, C.; Lucchese, P.; Hilliard, S.; Proost, J. Review and analysis of demonstration projects on power-to-X pathways in the world. Int. J. Hydrog. Energy 2019, 44, 27637–27655. [Google Scholar] [CrossRef]
  16. Wu, X.; Qi, S.; Wang, Z.; Duan, C.; Wang, X.; Li, F. Optimal scheduling for microgrids with hydrogen fueling stations considering uncertainty using data-driven approach. Appl. Energy 2019, 253, 113568. [Google Scholar] [CrossRef]
  17. Zhang, G.; Wang, W.; Chen, Z.; Li, R.; Niu, Y. Modeling and optimal dispatch of a carbon-cycle integrated energy system for low-carbon and economic operation. Energy 2022, 240, 122795. [Google Scholar] [CrossRef]
  18. Costamagna, P. Three-pipeline gas grid: A new concept for power-to-gas associated with complete carbon capture and utilization. Energy Convers. Manag. 2021, 229, 113739. [Google Scholar] [CrossRef]
  19. Mignoni, N.; Carli, R.; Dotoli, M. Distributed Noncooperative MPC for Energy Scheduling of Charging and Trading Electric Vehicles in Energy Communities. IEEE Trans. Control Syst. Technol. 2023, 31, 2159–2172. [Google Scholar] [CrossRef]
  20. Li, Y.; Zou, Y.; Tan, Y.; Cao, Y.; Liu, X.; Shahidehpour, M.; Tian, S.; Bu, F. Optimal Stochastic Operation of Integrated Low-Carbon Electric Power, Natural Gas, and Heat Delivery System. IEEE Trans. Sustain. Energy 2018, 9, 273–283. [Google Scholar] [CrossRef]
  21. Lu, S.; Gu, W.; Zhou, S.; Yao, S.; Pan, G. Adaptive Robust Dispatch of Integrated Energy System Considering Uncertainties of Electricity and Outdoor Temperature. IEEE Trans. Ind. Inform. 2020, 16, 4691–4702. [Google Scholar] [CrossRef]
  22. Al-Awami, A.T.; Amleh, N.A.; Muqbel, A.M. Optimal Demand Response Bidding and Pricing Mechanism with Fuzzy Optimization: Application for a Virtual Power Plant. IEEE Trans. Ind. Appl. 2017, 53, 5051–5061. [Google Scholar] [CrossRef]
  23. Mignoni, N.; Scarabaggio, P.; Carli, R.; Dotoli, M. Control frameworks for transactive energy storage services in energy communities. Control. Eng. Pract. 2023, 130, 105364. [Google Scholar] [CrossRef]
  24. Venkatesan, K.; Govindarajan, U. Optimal power flow control of hybrid renewable energy system with energy storage: A WOANN strategy. J. Renew. Sustain. Energy 2019, 11, 015501. [Google Scholar] [CrossRef]
  25. Tushar, M.H.K.; Zeineddine, A.W.; Assi, C. Demand-Side Management by Regulating Charging and Discharging of the EV, ESS, and Utilizing Renewable Energy. IEEE Trans. Ind. Inform. 2018, 14, 117–126. [Google Scholar] [CrossRef]
  26. Akbari-Dibavar, A.; Mohammadi-Ivatloo, B.; Zare, K.; Khalili, T.; Bidram, A. Economic-emission dispatch problem in power systems with carbon capture power plants. IEEE Trans. Ind. Appl. 2021, 57, 3341–3351. [Google Scholar] [CrossRef]
  27. Reddy K, S.; Panwar, L.K.; Panigrahi, B.K.; Kumar, R. Modeling of carbon capture technology attributes for unit commitment in emission-constrained environment. IEEE Trans. Power Syst. 2017, 32, 662–671. [Google Scholar] [CrossRef]
  28. Zhou, X.; Zhao, Q.; Zhang, Y.; Sun, L. Integrated energy production unit: An innovative concept and design for energy transition toward low-carbon development. CSEE J. Power Energy Syst. 2021, 7, 1133–1139. [Google Scholar]
  29. Koç, Y.; Yağlı, H.; Görgülü, A.; Koç, A. Analysing the performance, fuel cost and emission parameters of the 50 MW simple and recuperative gas turbine cycles using natural gas and hydrogen as fuel. Int. J. Hydrog. Energy 2020, 45, 22138–22147. [Google Scholar] [CrossRef]
  30. Cheng, Y.; Liu, M.; Chen, H.; Yang, Z. Optimization of multi-carrier energy system based on new operation mechanism modelling of power-to-gas integrated with CO2-based electrothermal energy storage. Energy 2021, 216, 119269. [Google Scholar] [CrossRef]
  31. Yang, G.; Jiang, Y.; You, S. Planning and operation of a hydrogen supply chain network based on the off-grid wind-hydrogen coupling system. Int. J. Hydrog. Energy 2020, 45, 20721–20739. [Google Scholar] [CrossRef]
  32. Pan, G.; Gu, W.; Lu, Y.; Qiu, H.; Lu, S.; Yao, S. Optimal planning for electricity-hydrogen integrated energy system considering power to hydrogen and heat and seasonal storage. IEEE Trans. Sustain. Energy 2020, 11, 2662–2676. [Google Scholar] [CrossRef]
  33. Yang, J.; Zhang, N.; Cheng, Y.; Kang, C.; Xia, Q. Modeling the operation mechanism of combined P2G and gas-fired plant with CO2 recycling. IEEE Trans. Smart Grid 2019, 10, 1111–1121. [Google Scholar] [CrossRef]
  34. Pan, G.; Gu, W.; Lu, Y.; Qiu, H.; Lu, S.; Yao, S. Accurate modeling of a profit-driven power to hydrogen and methane plant toward strategic bidding within multi-type markets. IEEE Trans. Smart Grid 2021, 12, 338–349. [Google Scholar] [CrossRef]
  35. Götz, M.; Lefebvre, J.; Mörs, F.; McDaniel Koch, A.; Graf, F.; Bajohr, S.; Reimert, R.; Kolb, T. Renewable power-to-gas: A technological and economic review. Renew. Energy 2016, 85, 1371–1390. [Google Scholar] [CrossRef]
Figure 1. The architecture of the IEPS.
Sustainability 15 14247 g001
Figure 2. Flow chart of combining K-means clustering and SBR algorithm.
Sustainability 15 14247 g002
Figure 3. Annual solar irradiance and load curve.
Sustainability 15 14247 g003
Figure 4. Typical daily predictions of solar irradiance and load for different seasons.
Sustainability 15 14247 g004
Figure 5. Optimal power scheduling in Scenario 1.
Sustainability 15 14247 g005
Figure 6. CO2 optimal scheduling and carbon storage in Scenario 2.
Sustainability 15 14247 g006
Figure 7. H2 ptimal scheduling and carbon storage in Scenario 2.
Sustainability 15 14247 g007
Figure 8. Global horizontal irradiance clustering results for scenarios 3 and 4.
Sustainability 15 14247 g008
Figure 9. Power load clustering results for scenarios 3 and 4.
Sustainability 15 14247 g009
Figure 10. Sensitivity analysis of coal price.
Sustainability 15 14247 g010
Figure 11. Sensitivity analysis of natural gas price.
Sustainability 15 14247 g011
Figure 12. Sensitivity analysis of carbon tax prices.
Sustainability 15 14247 g012
Table 1. Relevant technical and economic parameters.
ParameterNumerical Value
Carbon capture efficiency (%)90
Carbon emission intensity of thermal power unit (t/MWh)1.02
Carbon capture energy consumption (MWh/t)0.269
Power consumption of hydrogen production (kWh/m3)4.2
Power consumption of methane production (kWh/m3)0.3
Coal consumption for electricity supply (gce/kWh)300
Carbon and hydrogen storage equipment efficiency0.95
Electricity price (CNY/kWh)0–7 h0.314
8–11 h, 17–20 h1.07
12–16 h, 21–23 h0.642
Natural gas price (CNY/m3)2.5
Coal price (CNY/t)550
Carbon tax (CNY/t)277.6
Table 2. Configuration of the relevant parameters of the device.
Equipment TypeInvestment CostOperation and Maintenance CostService Life (Years)
PV2000(CNY/kW)60(CNY/kW)20
EC3200(CNY/kW)128(CNY/kW)10
MR3000(CNY/kW)150(CNY/kW)20
CS7.76(CNY/m3)0.12(CNY/m3)25
HS7.76(CNY/ m3)0.12(CNY/m3)15
Table 3. Optimized configuration and operation results.
ResultsScenario 1Scenario2Scenario 3Scenario 4
PV (MW)290.37272.85256.12240.22
CCS (MW)3.144.272.523.63
EC (MW)99.9283.3680.2163.01
MR (MW)1.7821.432
CS (m3)020,000020,000
HS (m3)020,000020,000
Inv_Cost (million CNY)120.88108.22102.4589.95
Op_Cost (million CNY)30.4827.3425.8522.78
Income (million CNY)904.6901.6364.8384.3
Carbon capture (t)39,97745,81030,47835,770
Net_Income (million CNY)373.6394.0364.8384.3
Disclaimer/Publisher’s Note: The statements, opinions and data contained in all publications are solely those of the individual author(s) and contributor(s) and not of MDPI and/or the editor(s). MDPI and/or the editor(s) disclaim responsibility for any injury to people or property resulting from any ideas, methods, instructions or products referred to in the content.

