

Social Life Cycle Assessment of a Coffee Production Management System in a Rural Area: A Regional Evaluation of the Coffee Industry in West Java, Indonesia
 , ,
, ,  and
and
Abstract
:1. Introduction
2. Materials and Methods
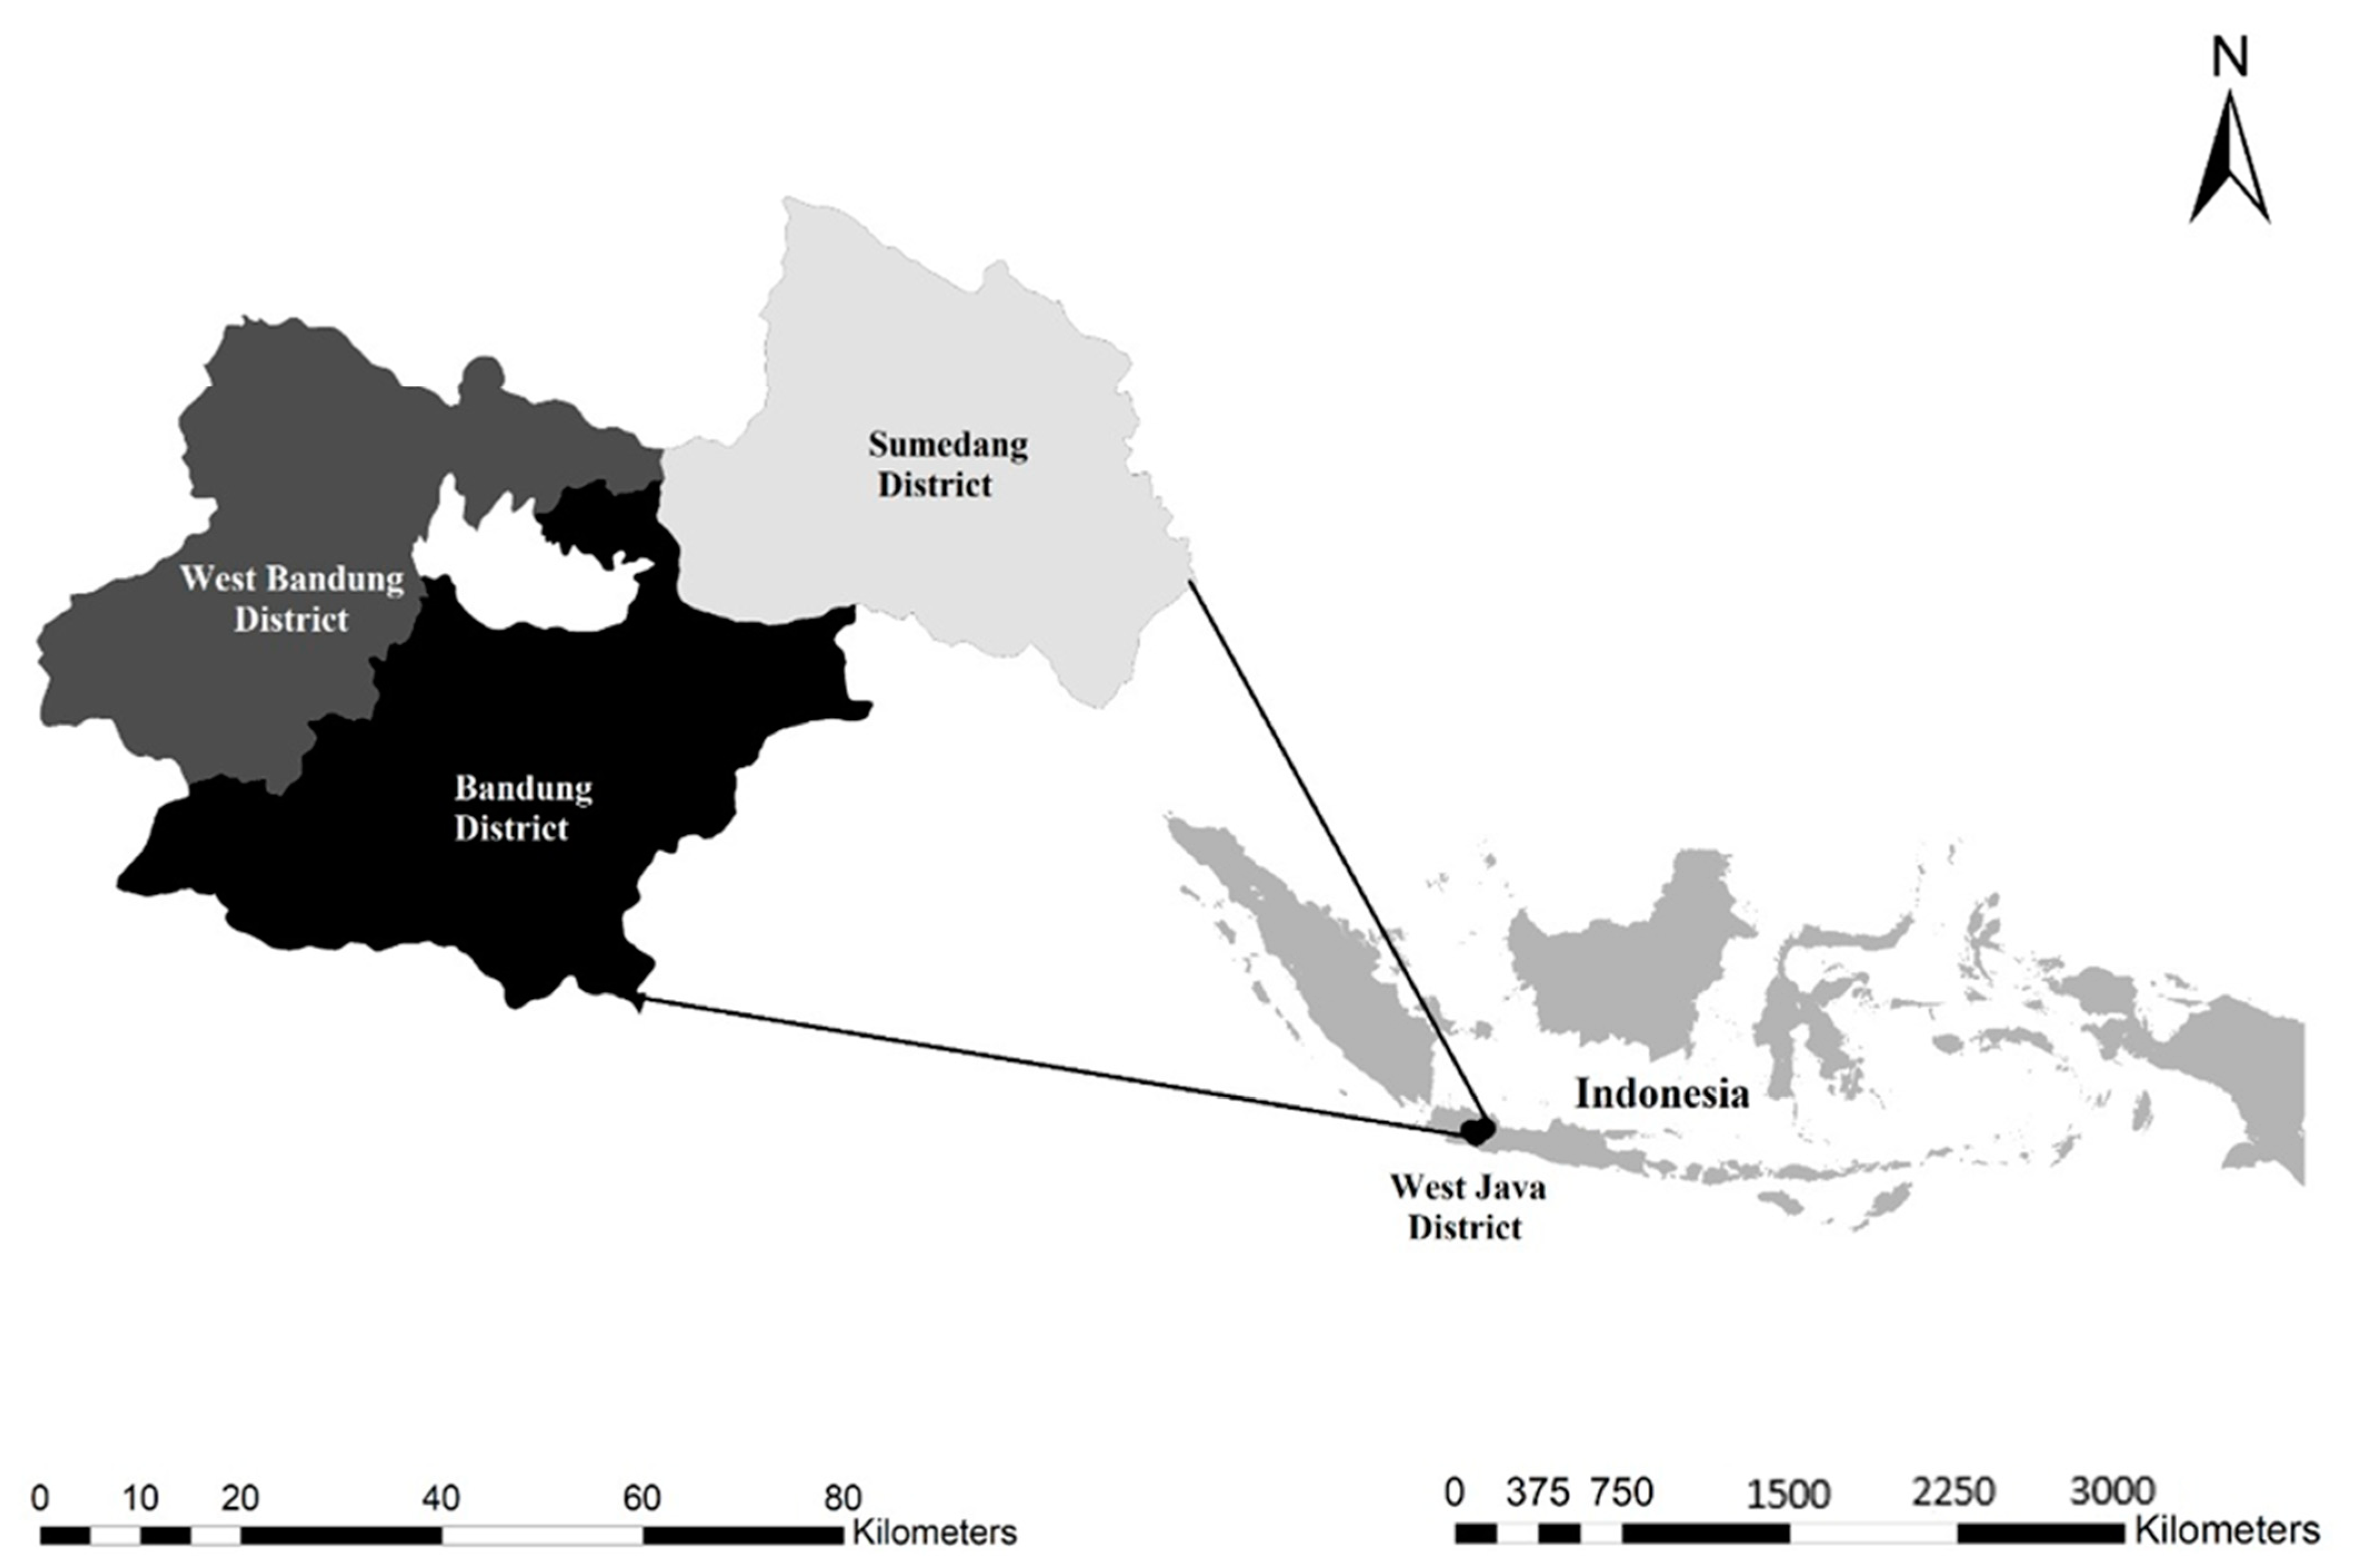
2.1. Research Location
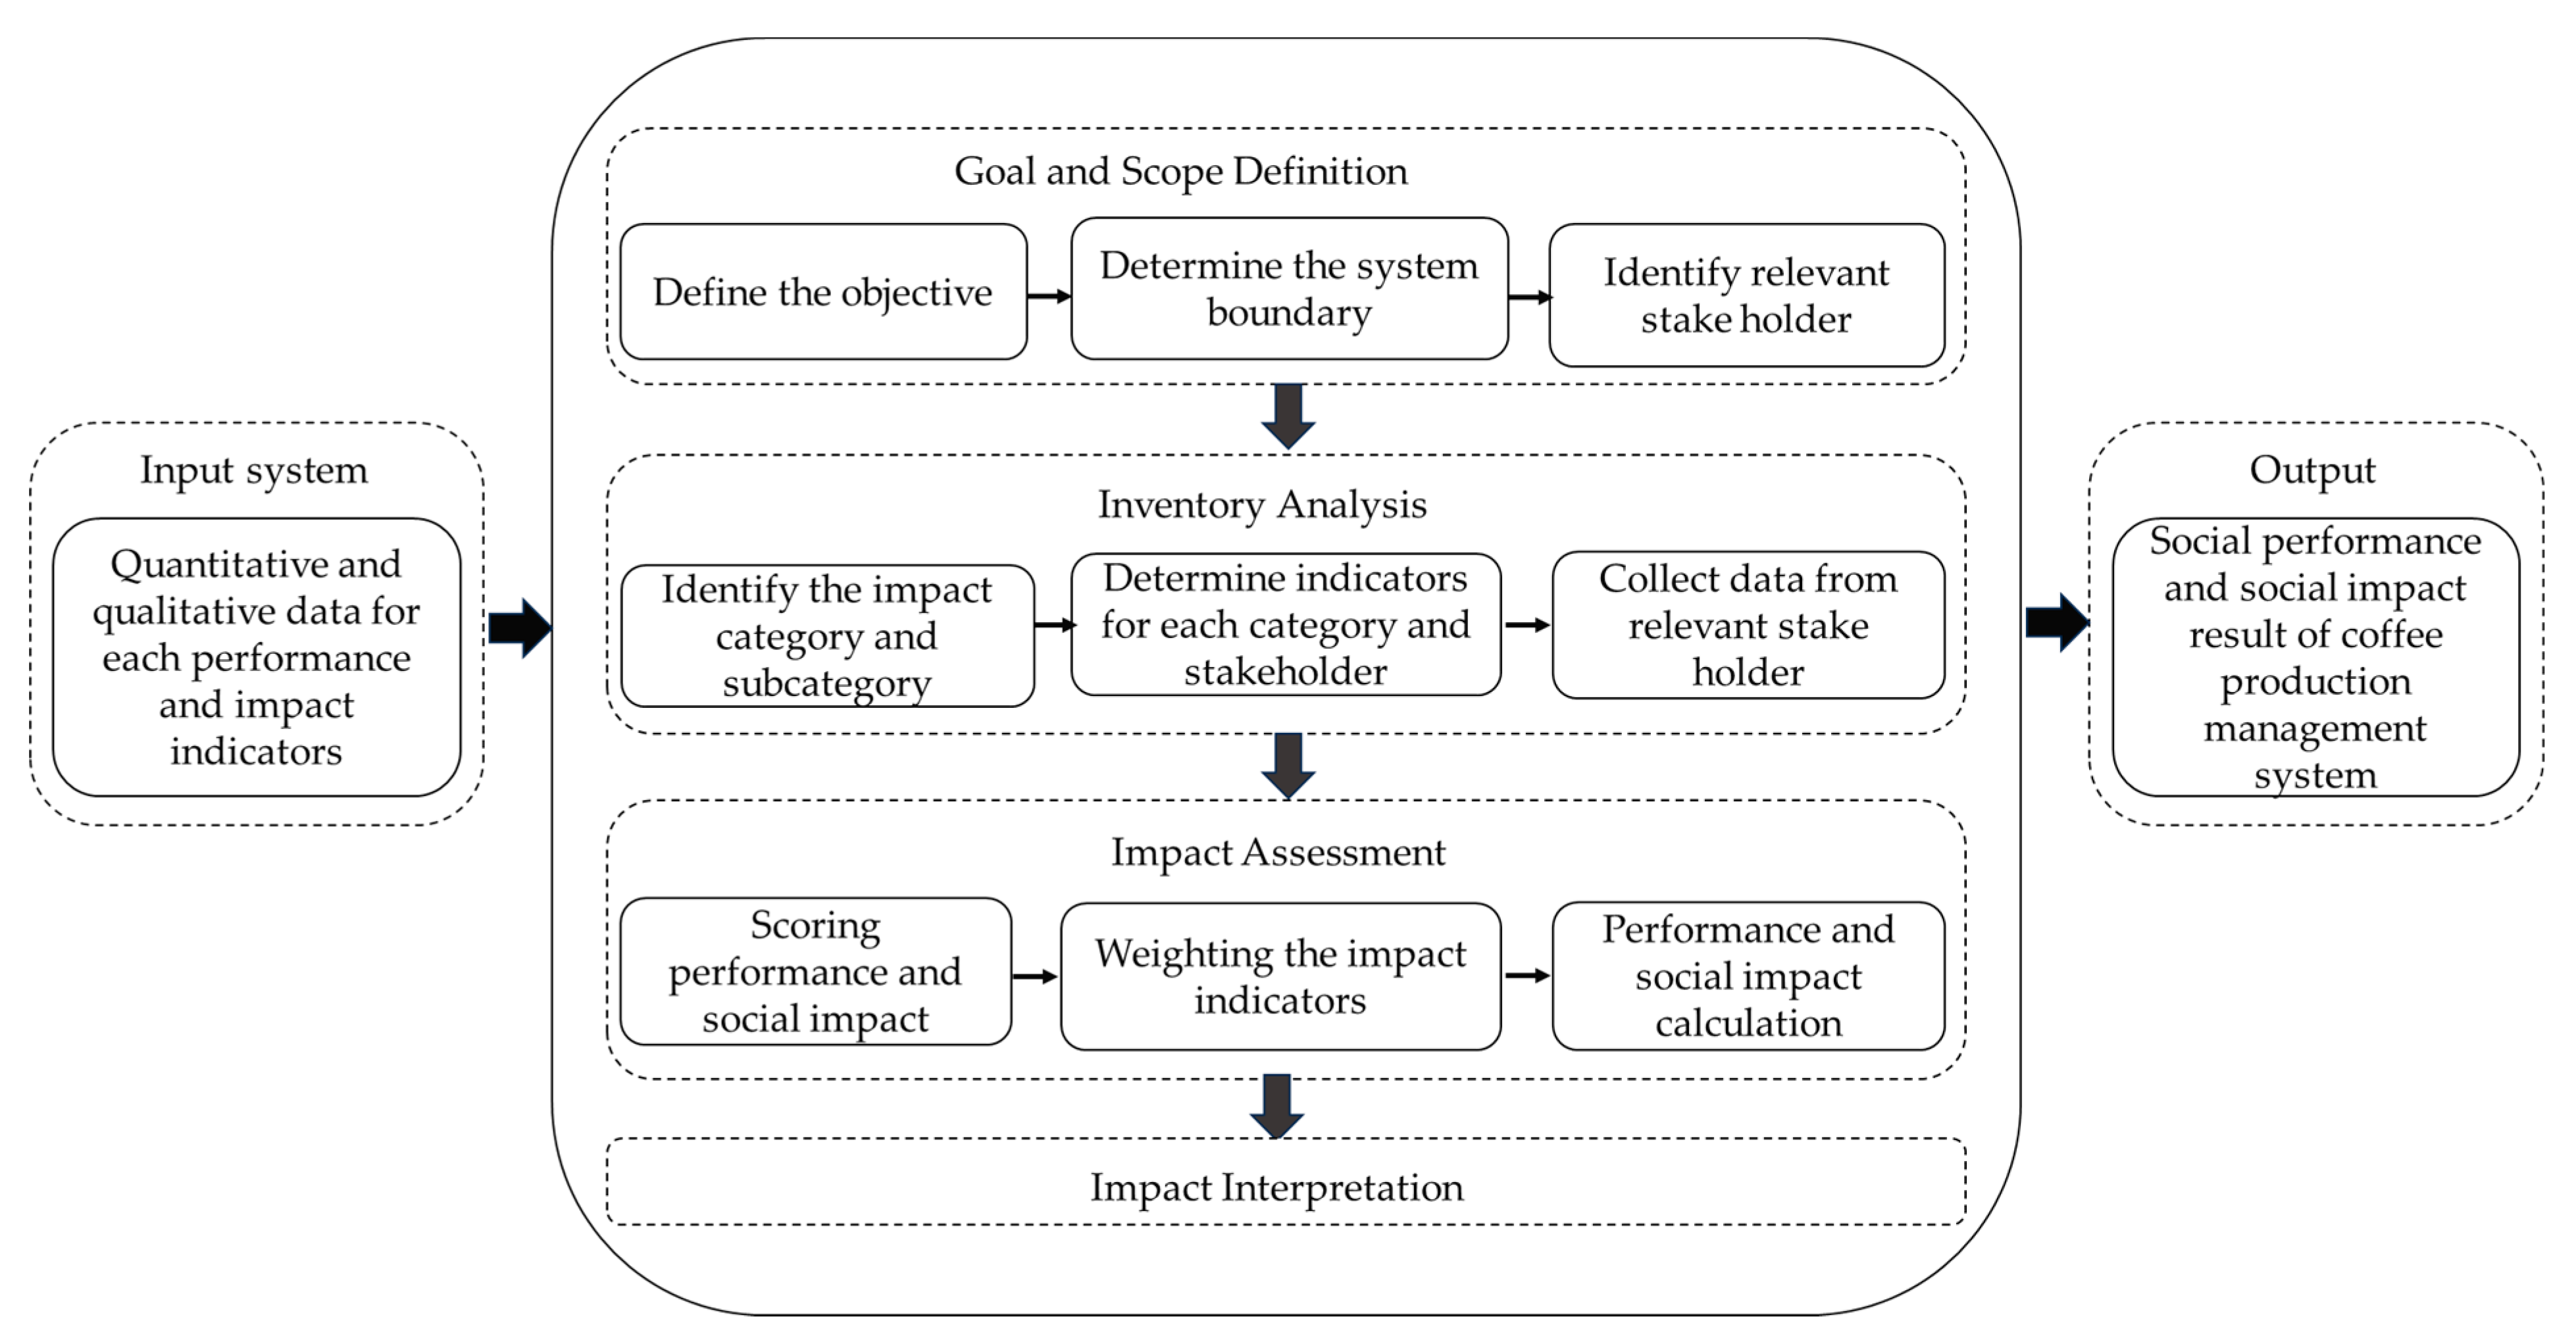
2.2. Methodology
2.2.1. Goal and Scope Definition
- (1)
- To determine the social impact of the coffee industry in rural areas according to its management system: (1) private companies, (2) coffee farmer groups, and (3) middlemen.
- (2)
- To determine the management option that is socially more beneficial for coffee stakeholders.
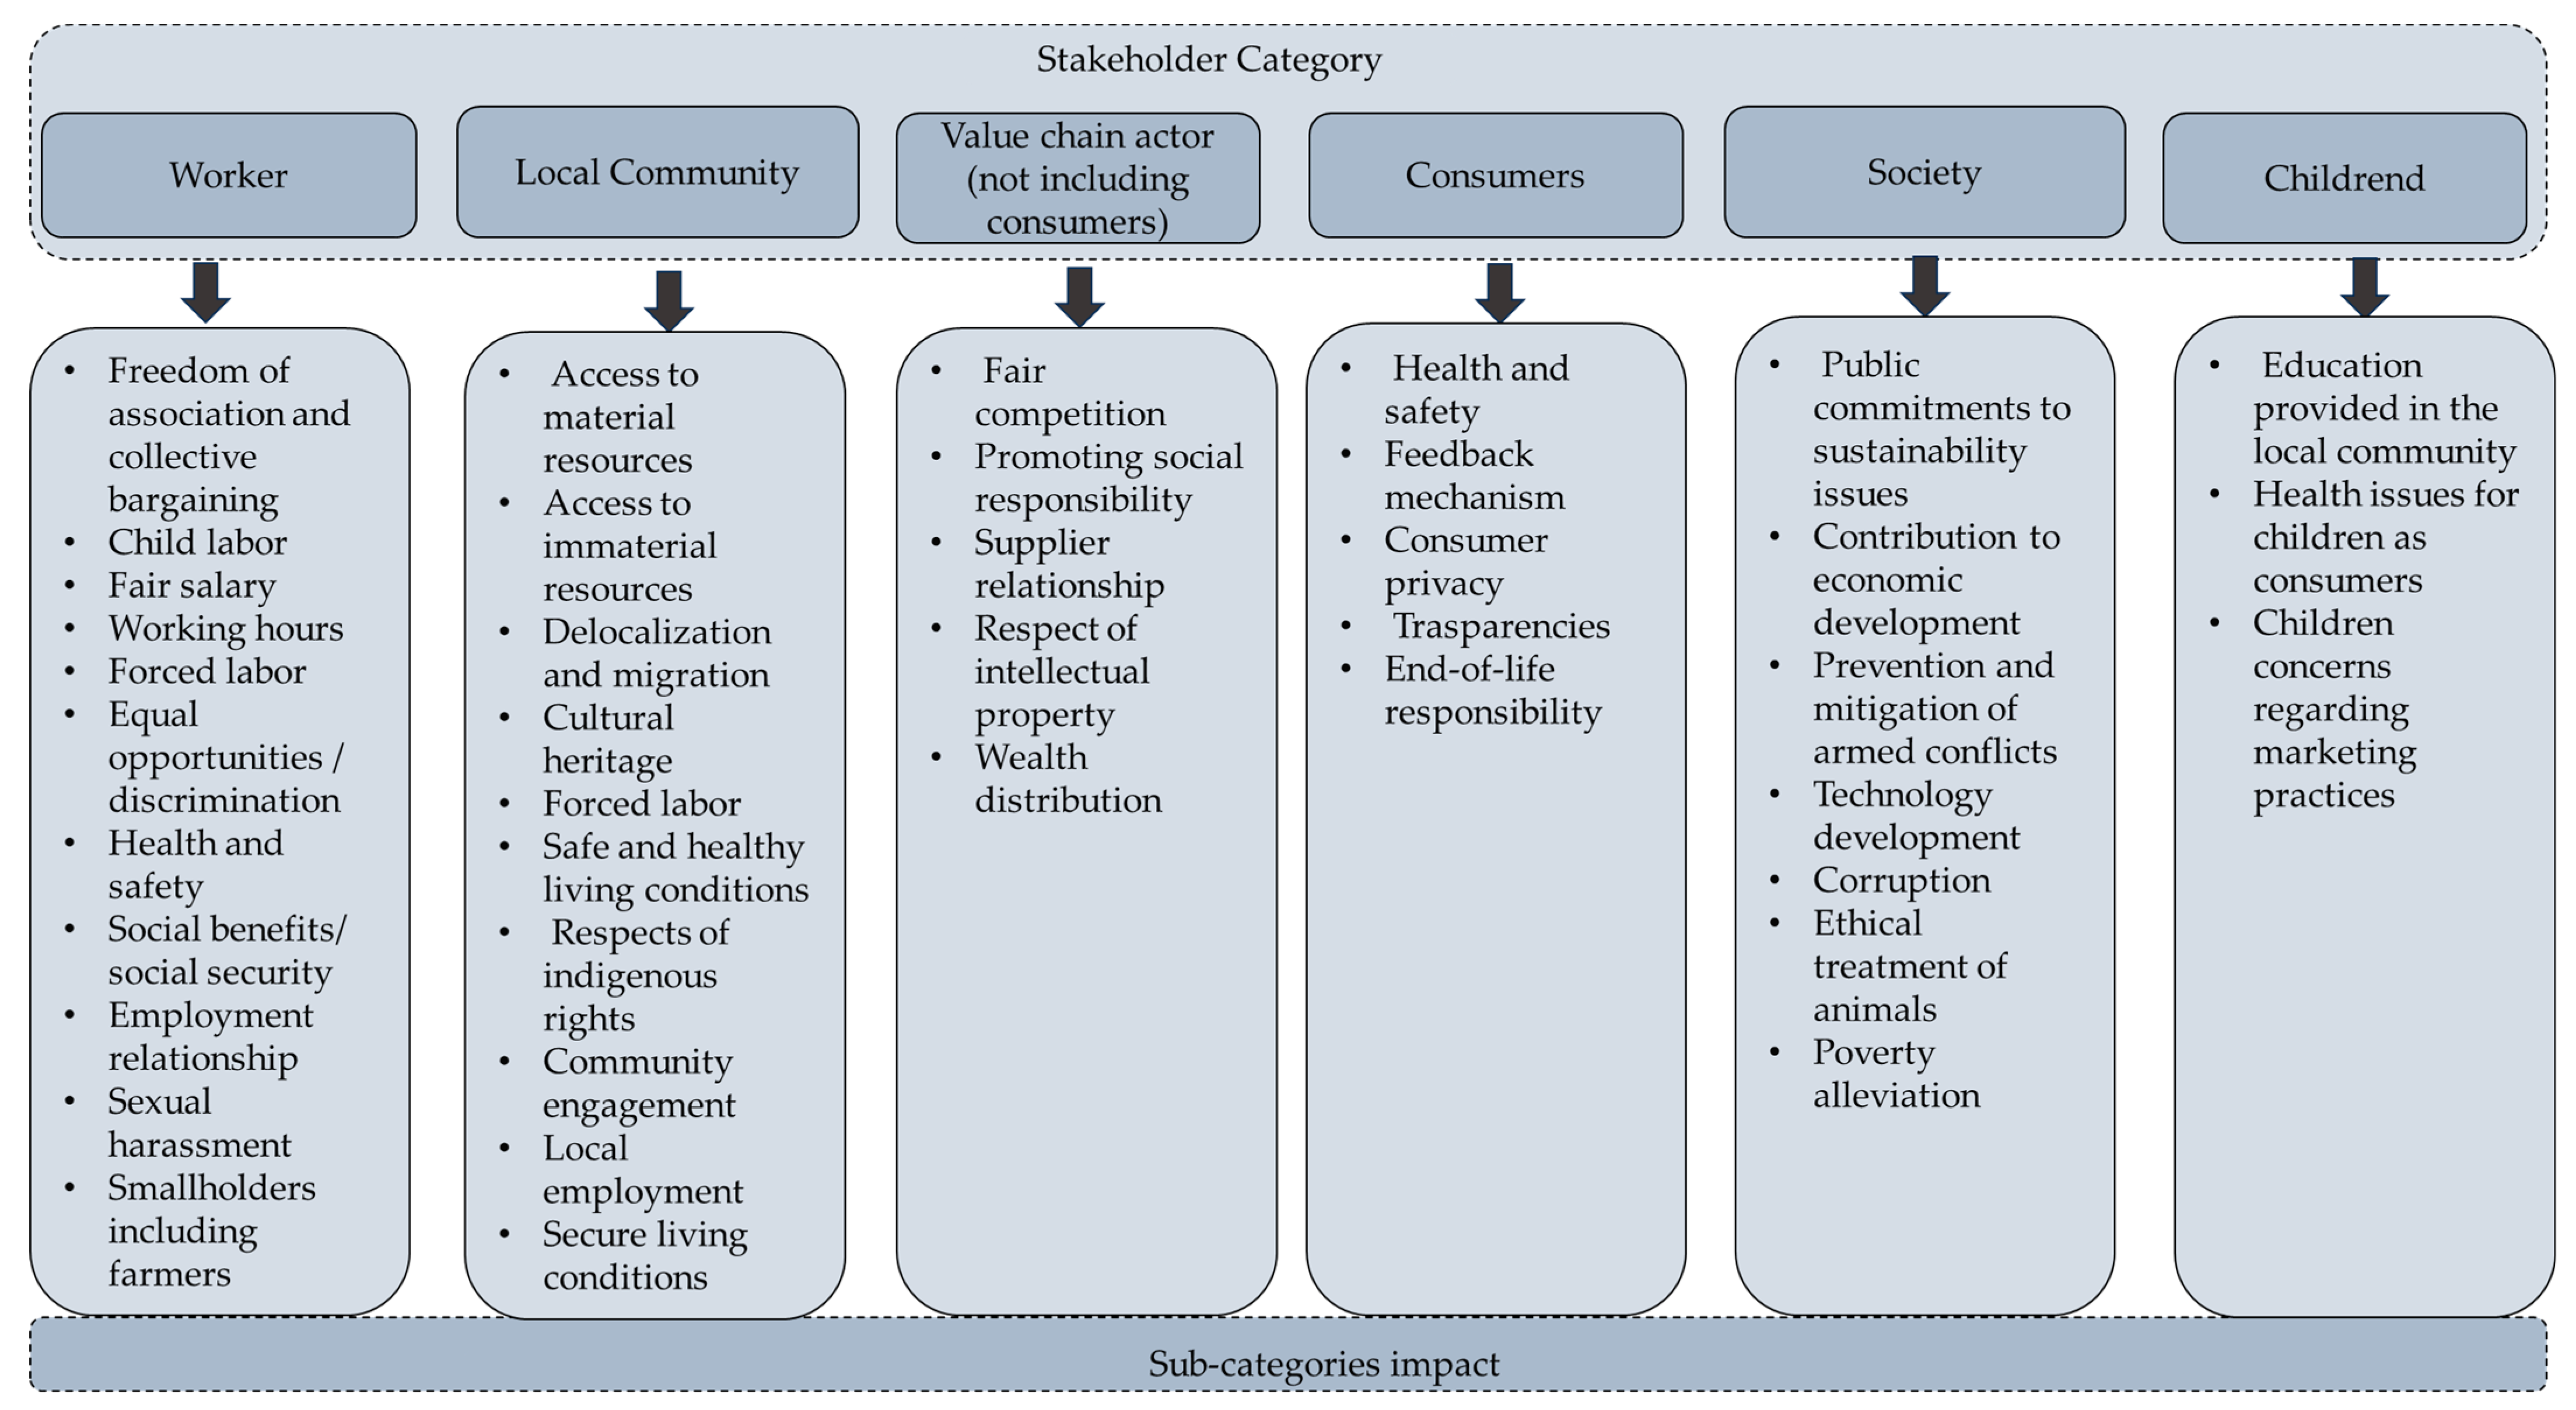
2.2.2. Data Inventory
- (1)
- Workers/employees
- (2)
- Local community
- (3)
- Society
- (4)
- Consumers (all consumers who are part of each supply chain)
- (5)
- Value chain actors (farmers as the main suppliers and shareholders)
- (6)
- Children (the additional stakeholders in the new SETAC/UNEP guidelines)
2.2.3. Social Life Cycle Impact Assessment Method
- = net score of subcategory “x”
- = indicator “i”
- = number of indicators of subcategory “x”
- = coefficient of indicator “i”
- = net score of endpoint category “x”
- = subcategory
- = sum of the total score of all subcategories “x”
- = sum of the total coefficient of endpoint indicator “x”
- = net score of endpoint category “x”
- = endpoint category (score 0–1, following Table 2)
- = sum of the total score of all subcategories “x” (using 1 for all categories)
3. Results
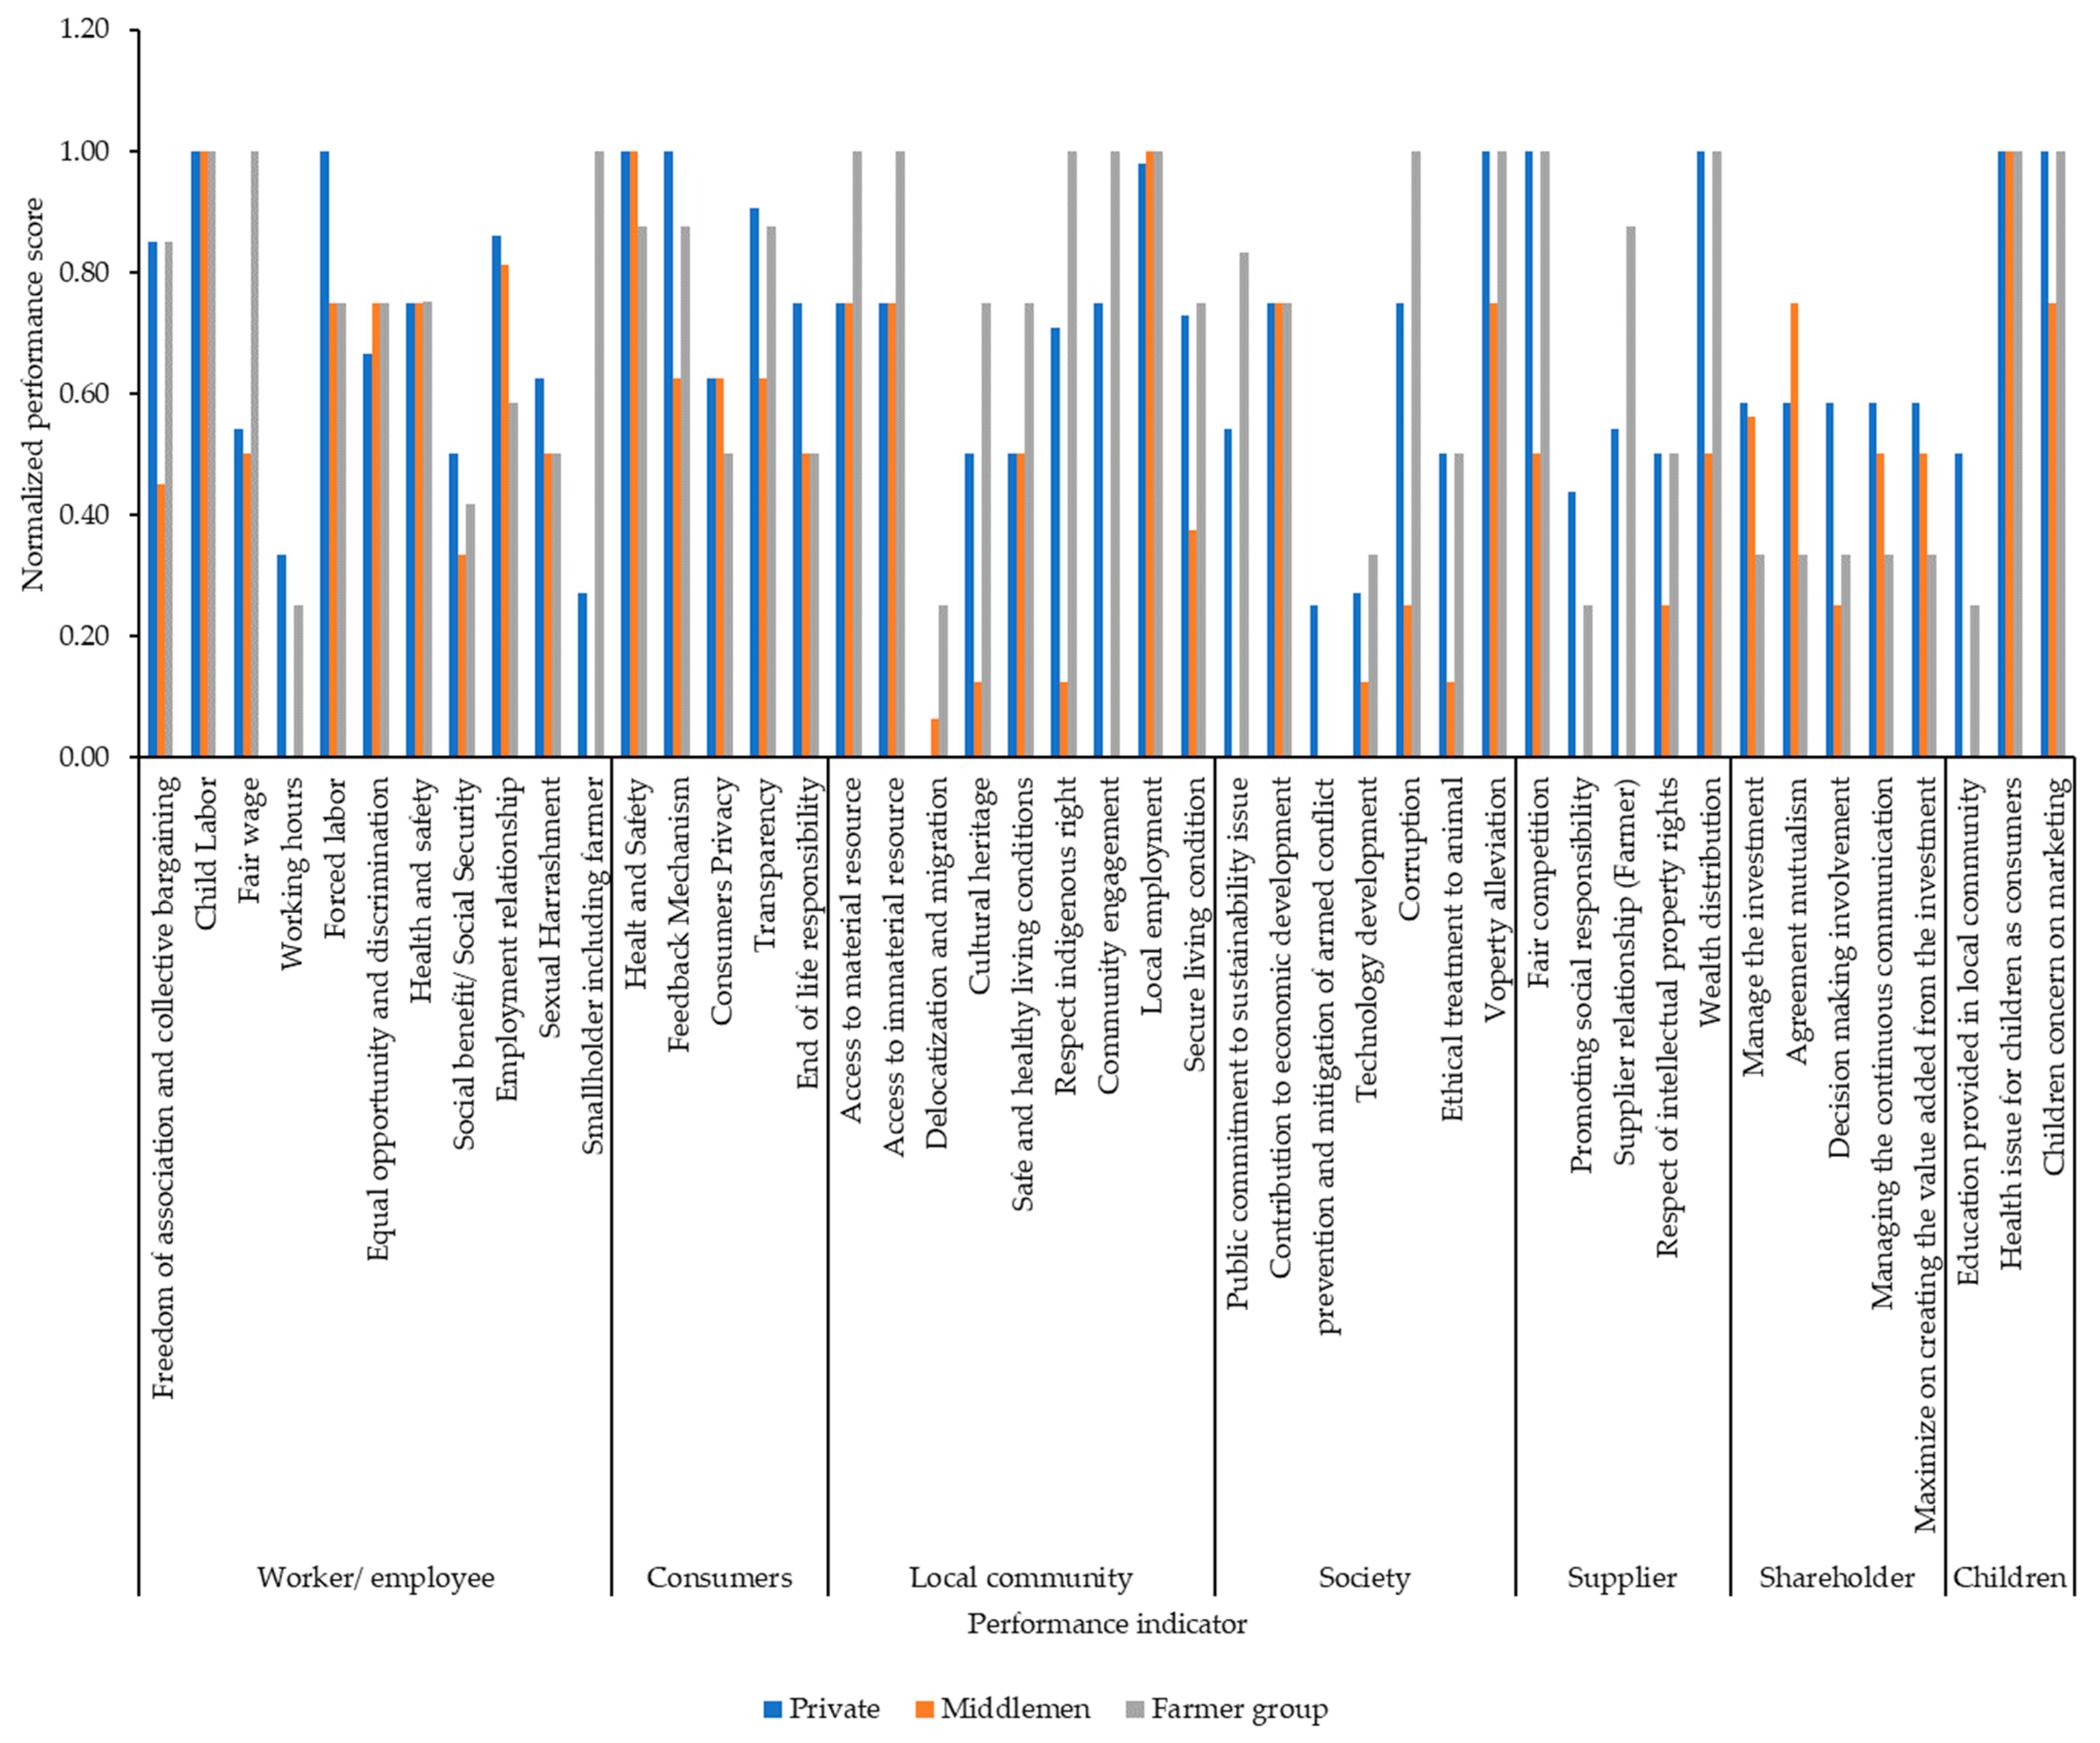
3.1. Social Performance of Coffee Industry with Different Management Systems
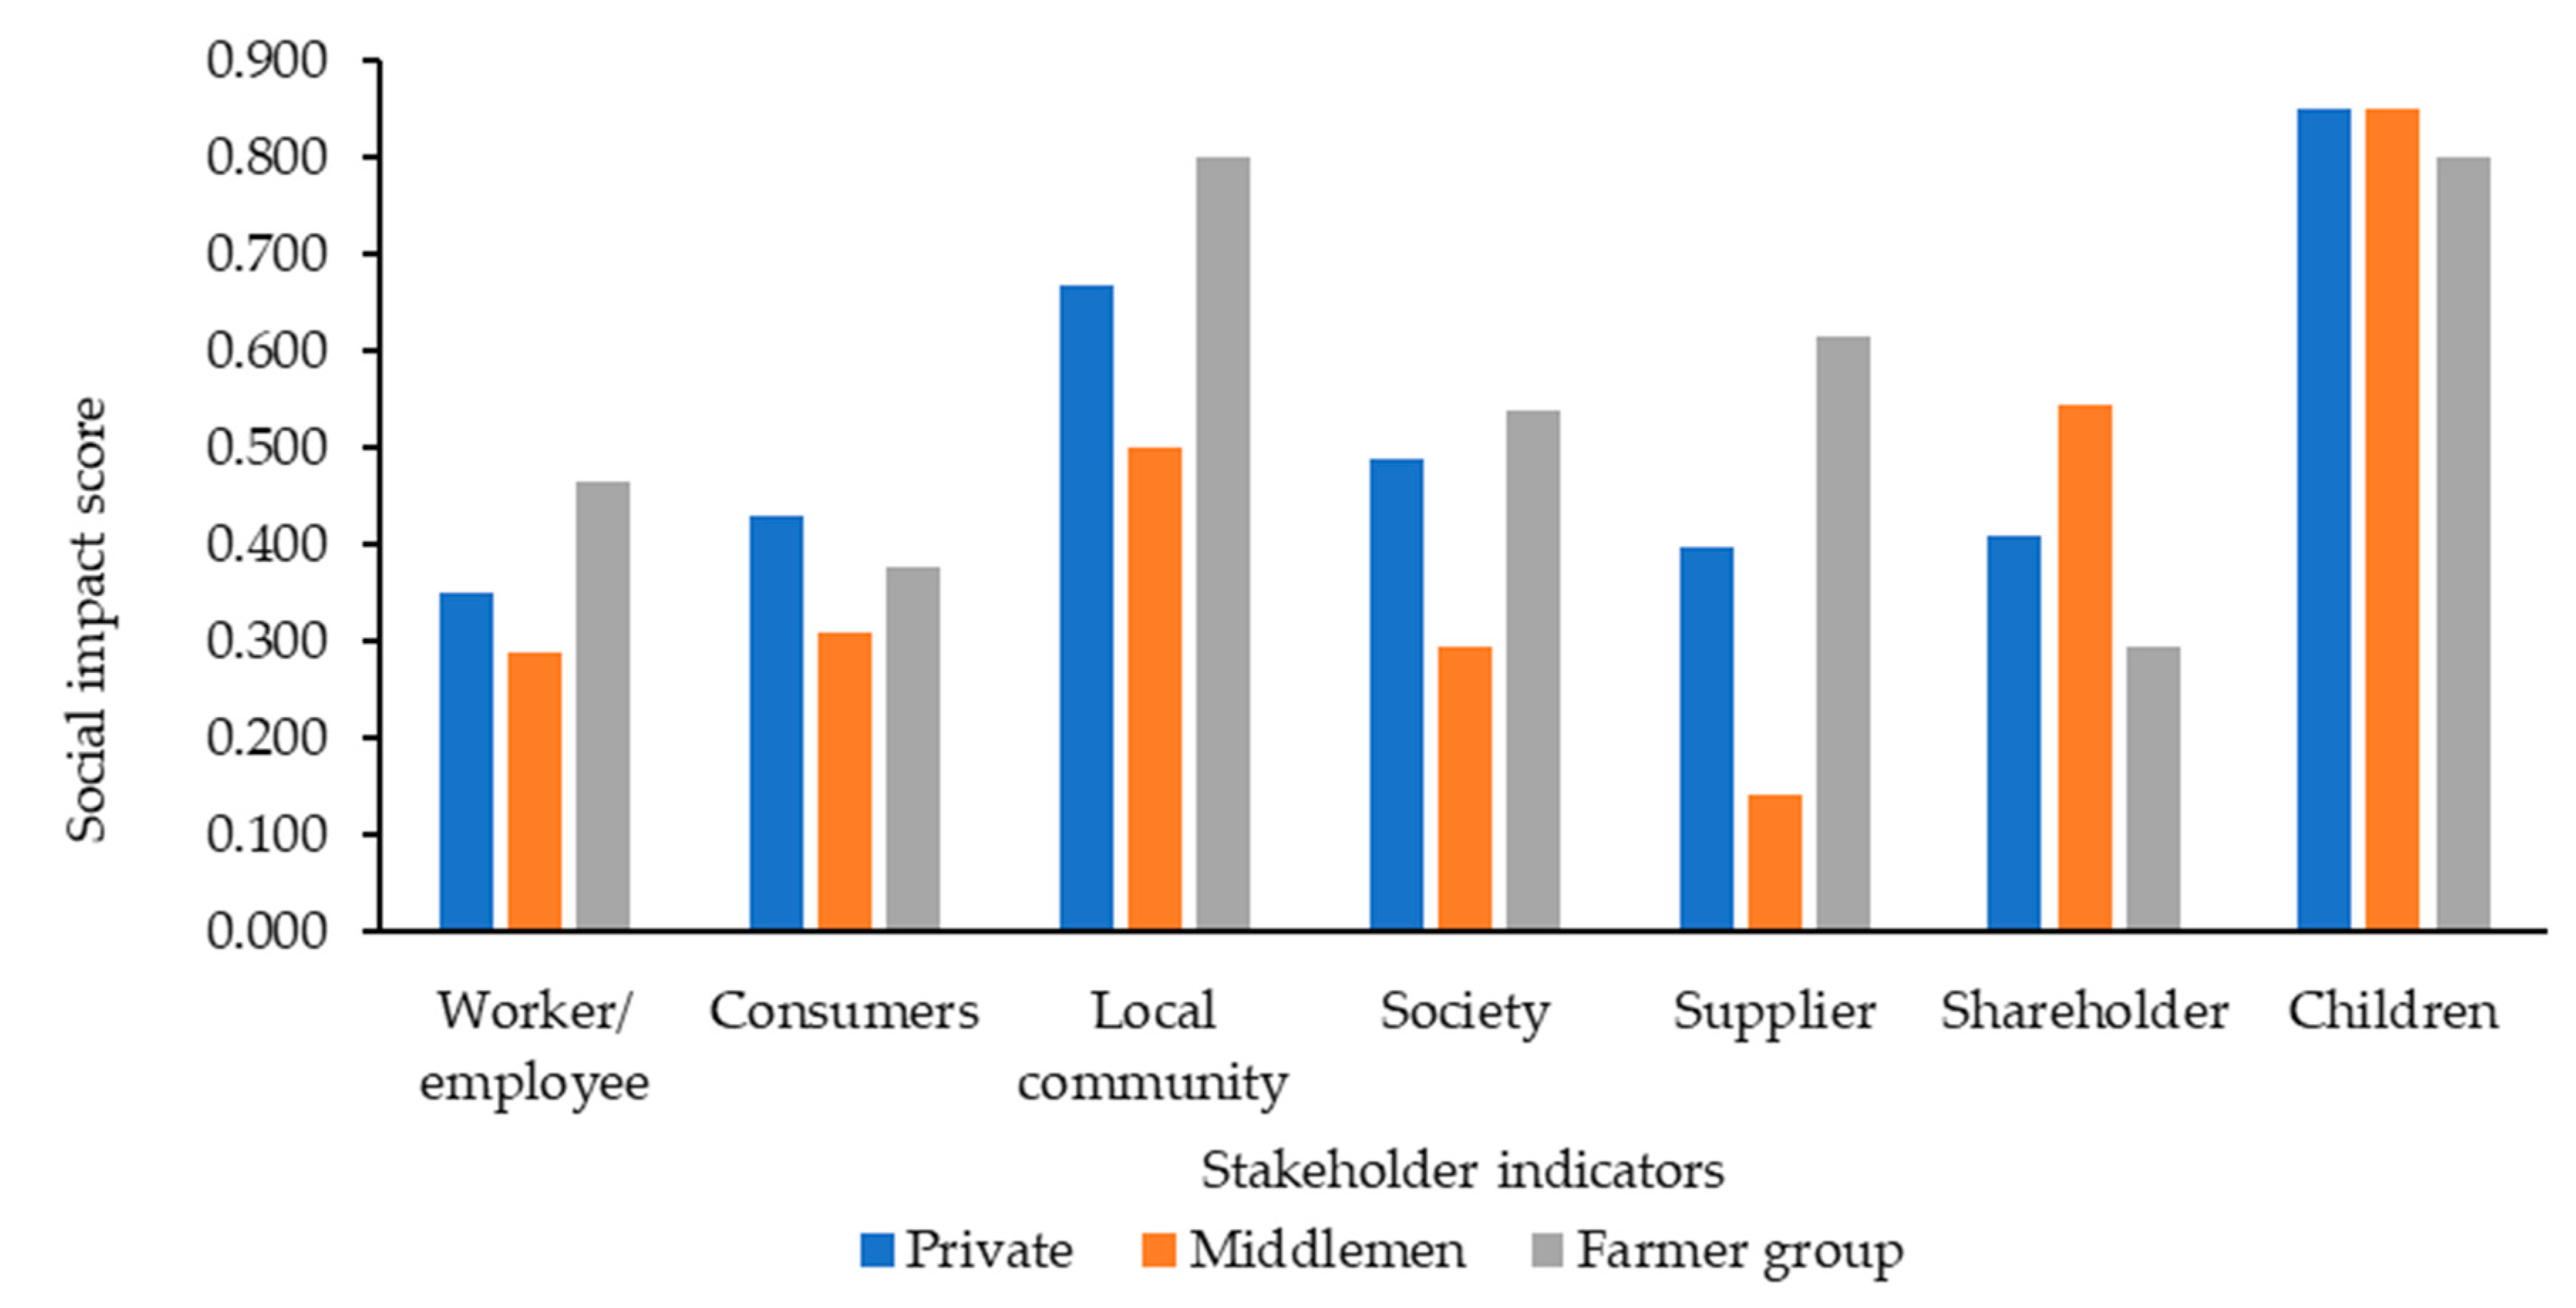
3.2. Social Impact of Coffee Industry with Different Management Systems
- Comparative Impact Per Impact Subcategory
- Comparison of the Social Impact of the Endpoint Categories
4. Discussion
4.1. Social Impact Hotspots of the Three Coffee Management Systems
4.2. Social Sustainability Index of Coffee Industry Management Systems
5. Conclusions
Author Contributions
Funding
Institutional Review Board Statement
Informed Consent Statement
Data Availability Statement
Acknowledgments
Conflicts of Interest
Appendix A

| Stakeholder | Sub-Indicators | Private | Middlemen | Farmer Group |
|---|---|---|---|---|
| Workers/employees | Freedom of association and collective bargaining | 0.85 | 0.45 | 0.85 |
| Child labor | 1.00 | 1.00 | 1.00 | |
| Fair wages | 0.54 | 0.50 | 1.00 | |
| Working hours | 0.33 | 0.00 | 0.25 | |
| Forced labor | 1.00 | 0.75 | 0.75 | |
| Equal opportunity and discrimination | 0.67 | 0.75 | 0.75 | |
| Health and safety | 0.75 | 0.75 | 0.75 | |
| Social benefit/social security | 0.50 | 0.33 | 0.42 | |
| Employment relationship | 0.86 | 0.81 | 0.58 | |
| Sexual harassment | 0.63 | 0.50 | 0.50 | |
| Smallholders, including farmers | 0.27 | 0.00 | 1.00 | |
| Consumers | Health and safety | 1.00 | 1.00 | 0.88 |
| Feedback mechanism | 1.00 | 0.63 | 0.88 | |
| Consumer privacy | 0.63 | 0.63 | 0.50 | |
| Transparency | 0.91 | 0.63 | 0.88 | |
| End of product life responsibility | 0.75 | 0.50 | 0.50 | |
| Local community | Access to material resources | 0.75 | 0.75 | 1.00 |
| Access to immaterial resources | 0.75 | 0.75 | 1.00 | |
| Delocalization and migration | 0.00 | 0.06 | 0.25 | |
| Cultural heritage | 0.50 | 0.13 | 0.75 | |
| Safe and healthy living conditions | 0.50 | 0.50 | 0.75 | |
| Respect indigenous rights | 0.71 | 0.13 | 1.00 | |
| Community engagement | 0.75 | 0.00 | 1.00 | |
| Local employment | 0.98 | 1.00 | 1.00 | |
| Secure living conditions | 0.73 | 0.38 | 0.75 | |
| Society | Public commitment to sustainability issues | 0.54 | 0.00 | 0.83 |
| Contribution to economic development | 0.75 | 0.75 | 0.75 | |
| Prevention and mitigation of armed conflict | 0.25 | 0.00 | 0.00 | |
| Technology development | 0.27 | 0.13 | 0.33 | |
| Corruption | 0.75 | 0.25 | 1.00 | |
| Ethical treatment of animals | 0.50 | 0.13 | 0.50 | |
| Poverty alleviation | 1.00 | 0.75 | 1.00 | |
| Suppliers | Fair competition | 1.00 | 0.50 | 1.00 |
| Promoting social responsibility | 0.44 | 0.00 | 0.25 | |
| Supplier relationships (farmers) | 0.54 | 0.00 | 0.88 | |
| Respect of intellectual property rights | 0.50 | 0.25 | 0.50 | |
| Wealth distribution | 1.00 | 0.50 | 1.00 | |
| Shareholders | Manage the investment | 0.58 | 0.56 | 0.33 |
| Agreement mutualism | 0.58 | 0.75 | 0.33 | |
| Decision-making involvement | 0.58 | 0.25 | 0.33 | |
| Managing continuous communication | 0.58 | 0.50 | 0.33 | |
| Maximize on creating the value added from the investment | 0.58 | 0.50 | 0.33 | |
| Children | Education provided in local community | 0.50 | 0.00 | 0.25 |
| Health issues for children as consumers | 1.00 | 1.00 | 1.00 | |
| Child-related marketing concerns | 1.00 | 0.75 | 1.00 |
| Stakeholder | Performance and Impact Subcategories | Private | Middlemen | Farmer Group |
|---|---|---|---|---|
| Workers/employees | Freedom of association and collective bargaining | 0.48 | 0.25 | 0.67 |
| Child labor | 1.00 | 1.00 | 1.00 | |
| Fair wage | 0.56 | 0.25 | 0.75 | |
| Working hours | 0.75 | 0.75 | 0.75 | |
| Forced labor | 0.54 | 0.50 | 0.50 | |
| Equal opportunity and discrimination | 0.65 | 0.50 | 0.75 | |
| Health and safety | 0.67 | 0.42 | 0.53 | |
| Social benefit/social security | 0.24 | 0.00 | 0.25 | |
| Employment relationship | 0.66 | 0.56 | 0.58 | |
| Sexual harassment | 0.60 | 0.63 | 0.75 | |
| Smallholders, including farmers | 0.50 | 0.00 | 1.00 | |
| Consumers | Health and safety | 0.88 | 0.75 | 0.88 |
| Feedback mechanism | 0.88 | 0.63 | 0.83 | |
| Consumer privacy | 0.74 | 0.50 | 0.50 | |
| Transparency | 0.91 | 0.50 | 0.75 | |
| End of product life responsibility | 0.25 | 0.25 | 0.25 | |
| Local community | Access to material resources | 0.50 | 0.50 | 0.75 |
| Access to immaterial resources | 0.71 | 0.50 | 0.83 | |
| Delocalization and migration | 0.04 | 0.00 | 0.00 | |
| Cultural heritage | 0.27 | 0.13 | 0.29 | |
| Safe and healthy living conditions | 0.50 | 0.50 | 0.75 | |
| Respect indigenous rights | 0.90 | 0.25 | 1.00 | |
| Community engagement | 0.75 | 0.50 | 1.00 | |
| Local employment | 0.98 | 1.00 | 1.00 | |
| Secure living conditions | 0.38 | 0.38 | 0.38 | |
| Society | Public commitment to sustainability issues | 0.20 | 0.00 | 0.25 |
| Contribution to economic development | 0.60 | 0.50 | 0.75 | |
| Prevention and mitigation of armed conflict | 0.25 | 0.13 | 0.13 | |
| Technology development | 0.14 | 0.00 | 0.19 | |
| Corruption | 0.19 | 0.13 | 0.19 | |
| Ethical treatment of animals | 0.25 | 0.25 | 0.38 | |
| Poverty alleviation | 0.46 | 0.25 | 0.42 | |
| Suppliers | Fair competition | 0.77 | 0.25 | 1.00 |
| Promoting social responsibility | 0.23 | 0.00 | 0.56 | |
| Supplier relationships (farmers) | 0.46 | 0.13 | 0.75 | |
| Respect of intellectual property rights | 0.25 | 0.13 | 0.25 | |
| Wealth distribution | 0.38 | 0.25 | 0.67 | |
| Shareholders | Manage the investment | 0.33 | 0.56 | 0.25 |
| Agreement mutualism | 0.40 | 0.50 | 0.25 | |
| Decision-making involvement | 0.15 | 0.25 | 0.17 | |
| Managing continuous communication | 0.58 | 0.50 | 0.33 | |
| Maximize on creating the value added from the investment | 0.29 | 0.50 | 0.25 | |
| Children | Education provided in the local community | 0.38 | 0.38 | 0.25 |
| Health issues for children as consumers | 1.00 | 1.00 | 1.00 | |
| Child-related marketing concerns | 0.75 | 0.75 | 0.75 |
| Category | Private | Middlemen | Farmer Group |
|---|---|---|---|
| Workers/employees | 0.350 | 0.290 | 0.464 |
| Consumers | 0.429 | 0.309 | 0.377 |
| Local community | 0.669 | 0.500 | 0.800 |
| Society | 0.490 | 0.294 | 0.540 |
| Suppliers | 0.398 | 0.143 | 0.615 |
| Shareholders | 0.411 | 0.544 | 0.294 |
| Children | 0.850 | 0.850 | 0.800 |
References
- Rahmah, D.M.; Mardawati, E.; Pujianto, T.; Kastaman, R.; Pramulya, R. Coffee Pulp Biomass Utilization on Coffee Production and Its Impact on Energy Saving, CO2 Emission Reduction, and Economic Value Added to Promote Green Lean Practice in Agriculture Production. Agronomy 2023, 13, 904. [Google Scholar] [CrossRef]
- Al-Mansour, F.; Jejcic, V. A model calculation of the carbon footprint of agricultural products: The case of Slovenia. Energy 2017, 136, 7–15. [Google Scholar] [CrossRef]
- Amini, S.; Rohani, A.; Aghkhani, M.H.; Abbaspour-Fard, M.H.; Asgharipour, M.R. Sustainability assessment of rice production systems in Mazandaran Province, Iran with emergy analysis and fuzzy logic. Sustain. Energy Technol. Assess. 2020, 40, 100744. [Google Scholar] [CrossRef]
- Fiore, M.; Spada, A.; Contò, F.; Pellegrini, G. GHG and cattle farming: CO-assessing the emissions and economic performances in Italy. J. Clean. Prod. 2018, 172, 3704–3712. [Google Scholar] [CrossRef]
- Nowak, A.; Krukowski, A.; Różańska-Boczula, M. Assessment of sustainability in agriculture of the European Union countries. Agronomy 2019, 9, 890. [Google Scholar] [CrossRef]
- Troiano, S.; Novelli, V.; Geatti, P.; Marangon, F.; Ceccon, L. Assessment of the sustainability of wild rocket (Diplotaxis tenuifolia) production: Application of a multi-criteria method to different farming systems in the province of Udine. Ecol. Indic. 2019, 97, 301–310. [Google Scholar] [CrossRef]
- Vinyes, E.; Asin, L.; Alegre, S.; Muñoz, P.; Boschmonart, J.; Gasol, C.M. Life Cycle Assessment of apple and peach production, distribution and consumption in Mediterranean fruit sector. J. Clean. Prod. 2017, 149, 313–320. [Google Scholar] [CrossRef]
- Data Information Center of Agriculture Ministry of Indonesia. Coffee Outlook Indonesia; Data Information Center, Agriculture Ministry of Indonesia: Jakarta, Indonesia, 2020. [Google Scholar]
- Rahmah, D.M.; Putra, A.S.; Ishizaki, R.; Noguchi, R.; Ahamed, T. A Life Cycle Assessment of Organic and Chemical Fertilizers for Coffee Production to Evaluate Sustainability toward the Energy–Environment–Economic Nexus in Indonesia. Sustainability 2022, 14, 3912. [Google Scholar] [CrossRef]
- Pramulya, R.; Bantacut, T.; Noor, E.; Yani, M.; Zulfajrin, M.; Setiawan, Y.; Pulunggono, H.B.; Sudrajat, S.; Anne, O.; Anwar, S.; et al. Carbon Footprint Calculation of Net CO2 in Agroforestry and Agroindustry of Gayo Arabica Coffee, Indonesia. J. Jordan Biol. Sci. 2023, 16, 335–343. [Google Scholar] [CrossRef]
- Coltro, L.; Mourad, A.L.; Oliveira, P.A.P.L.V.; Baddini, J.P.O.A.; Kletecke, R.M. Environmental profile of Brazilian green coffee. Int. J. Life Cycle Assess. 2006, 11, 16–21. [Google Scholar] [CrossRef]
- Hassard, H.A.; Couch, M.H.; Techa-Erawan, T.; Mclellan, B.C. Product carbon footprint and energy analysis of alternative coffee products in Japan. J. Clean. Prod. 2014, 73, 310–321. [Google Scholar] [CrossRef]
- Basavalingaiah, K.; Paramesh, V.; Parajuli, R.; Girisha, H.C.; Shivaprasad, M.; Vidyashree, G.V.; Thoma, G.; Hanumanthappa, M.; Yogesh, G.S.; Dhar, S.; et al. Energy flow and life cycle impact assessment of coffee-pepper production systems: An evaluation of conventional, integrated and organic farms in India. Environ. Impact Assess. Rev. 2022, 92, 106687. [Google Scholar] [CrossRef]
- Acosta-Alba, I.; Boissy, J.; Chia, E.; Andrieu, N. Integrating diversity of smallholder coffee cropping systems in environmental analysis. Int. J. Life Cycle Assess. 2020, 25, 252–266. [Google Scholar] [CrossRef]
- Daniel, A.; Ibarra, A.A.; Galeana-pizaña, J.M.; Manuel, J. Changes over Time Matter: A Cycle of Participatory Sustainability Assessment of Organic Coffee in Chiapas, Mexico. Sustainability 2022, 14, 2012. [Google Scholar]
- Marulanda, V.A.; Solarte-Toro, J.C.; Carlos, A.C.A. Economic and social assessment of biorefinerues coffee cut steam. Bioresour. Technol. Rep. 2020, 9, 1–9. [Google Scholar]
- Benoît-norris, C.; Vickery-niederman, G.; Valdivia, S.; Franze, J.; Traverso, M.; Ciroth, A.; Mazijn, B. Introducing the UNEP/SETAC methodological sheets for subcategories of social LCA. Int. J. Life Cycle Assess. 2011, 16, 682–690. [Google Scholar] [CrossRef]
- Ekener-Petersen, E.; Hoglund, J.; Finneveden, G. Screening Potential Social Impact of Fosil Fuel and Biofuels for Vehicle. Energy Pol. 2014, 73, 416–426. [Google Scholar] [CrossRef]
- Agyekum, E.O.; Fortuin, K.P.J.; van der Harst, E.J.M. Environmental and social life cycle assessment of bamboo bicycle frames made in Ghana. J. Clean. Prod. 2017, 143, 1069–1080. [Google Scholar] [CrossRef]
- Hossain, M.U.; Poon, C.S.; Dong, Y.H.; Lo, I.M.C.; Cheng, J.C.P. Development of social sustainability assessment method and a comparative case study on assessing recycled construction materials. Int. J. Life Cycle Assess. 2018, 23, 1654–1674. [Google Scholar] [CrossRef]
- Maister, K.; Di Noi, C.; Andreas Ciroth, M.S. PSILCA V.3 Database Documentation. A Product Social Impact Life Cycle Assessment Database. 2020. Available online: https://www.researchgate.net/publication/366605856_PSILCA_v3_Database_documentation (accessed on 29 August 2023).
- D’Eusanio, M.; Bianca Maria Tragnone, L.P. Social Organisational Life Cycle Assessment and Social Life Cycle Assessment: Adifferent twins? Correlation from a case study. Int. J. Life Cycle Assess. 2022, 27, 173–187. [Google Scholar] [CrossRef]
- Costa, D.; Quinteiro, P.; Pereira, V.; Dias, A.C. Social life cycle assessment based on input-output analysis of the Portuguese pulp and paper sector. J. Clean. Prod. 2022, 330, 129851. [Google Scholar] [CrossRef]
- Dunuwila, P.; Rodrigo, V.H.L.; Daigo, I.; Goto, N. Social impact improving model based on a social life cycle assessment for raw rubber production: A case of a Sri Lankan rubber estate. J. Clean. Prod. 2022, 338, 130555. [Google Scholar] [CrossRef]
- Haryati, Z.; Subramaniam, V.; Noor, Z.Z.; Hashim, Z.; Loh, S.K.; Aziz, A.A. Social life cycle assessment of crude palm oil production in Malaysia. Sustain. Prod. Consum. 2022, 29, 90–99. [Google Scholar] [CrossRef]
- Pimentel, D.; Burgess, M. An environmental, energetic and economic comparison of organic and conventional farming systems. Integr. Pest Manag. Pestic. Probl. 2014, 3, 141–166. [Google Scholar] [CrossRef]
- Thies, C.; Kieckhäfer, K.; Spengler, T.S.; Sodhi, M.S. Assessment of social sustainability hotspots in the supply chain of lithium-ion batteries. Procedia CIRP 2019, 80, 292–297. [Google Scholar] [CrossRef]
- Jana Gerta Backers, M.T. Social Life Cycle Assessment in the Construction Industry: Systematic Literature Review and Identification of Relevant Social Indicators for Carbon Reinforced Concrete. Environ. Dev. Sustain. 2023, 1–35. [Google Scholar] [CrossRef]
- Ramjeewon, R.K.F.T. Comparative life cycle assessment and social life cycle assessment of used polyethylene terephthalate (PET) bottles in Mauritius. Int. J. Life Cycle Assess. 2013, 18, 155–171. [Google Scholar]
- Serreli, M.; Petti, L.; Raggi, A.; Simboli, A.; Luliano, G. Social life cycle assessment of an innovative indutrial wastewater treatment plant. Int. J. Life Cycle Assess. 2021, 26, 1878–1899. [Google Scholar] [CrossRef]
- Tobos-Chavero, S.; Madrid-Lopez, C.; Villalba, G.; Durany, X.G.; Huckstadt, A.B.; Matthias Finkbeiner, A.L. Environmental and Social Life Cycle Assessment of growing media for urban rooftop farming. Int. J. Life Cycle Assess. 2021, 26, 2085–2102. [Google Scholar] [CrossRef]
- UNEP. Guideline for Social Life Cycle Assessment of Product and Organization; UN Environmental Programme: Nairobi, Kenya, 2020. [Google Scholar]
- Rebolledo-Leiva, R.; Moreira, M.T.; González-García, S. Progress of social assessment in the framework of bioeconomy under a life cycle perspective. Renew. Sustain. Energy Rev. 2023, 175, 113162. [Google Scholar] [CrossRef]
- Halog, A.; Manik, Y. Life Cycle Sustainability Assessments. Encycl. Inorg. Bioinorg. Chem. 2016, 1–17. [Google Scholar] [CrossRef]
- Konstantas, A.; Stamford, L.; Azapagic, A. A framework for evaluating life cycle eco-efficiency and an application in the confectionary and frozen-desserts sectors. Sustain. Prod. Consum. 2020, 21, 192–203. [Google Scholar] [CrossRef]
- Martinelli, G.; Vogel, E.; Decian, M.; Farinha, M.J.U.S.; Bernardo, L.V.M.; Borges, J.A.R.; Gimenes, R.M.T.; Garcia, R.G.; Ruviaro, C.F. Assessing the eco-efficiency of different poultry production systems: An approach using life cycle assessment and economic value added. Sustain. Prod. Consum. 2020, 24, 181–193. [Google Scholar] [CrossRef]
- Valente, C.; Møller, H.; Johnsen, F.M.; Saxegård, S.; Brunsdon, E.R.; Alvseike, O.A. Life cycle sustainability assessment of a novel slaughter concept. J. Clean. Prod. 2020, 272, 122651. [Google Scholar] [CrossRef]
- Sandra, A.; Stefan, S. Development of a social impact assessment methodology. Int. J. Life Cycle Assess. 2013, 18, 1106–1115. [Google Scholar]
- Ciroth, A.; Franze, J. LCA of an Ecolabeled Notebook: Consideration of Social and Environmental Impacts along the Entire Life Cycle; UN Environmental Programme: Nairobi, Kenya, 2011. [Google Scholar]


| Categories | Private | Middlemen | Farmer Groups |
|---|---|---|---|
| Ownership | Personal, with individual ownership | Personal, individual, or partnership with the third parties (medium–large company) | Farmer organization |
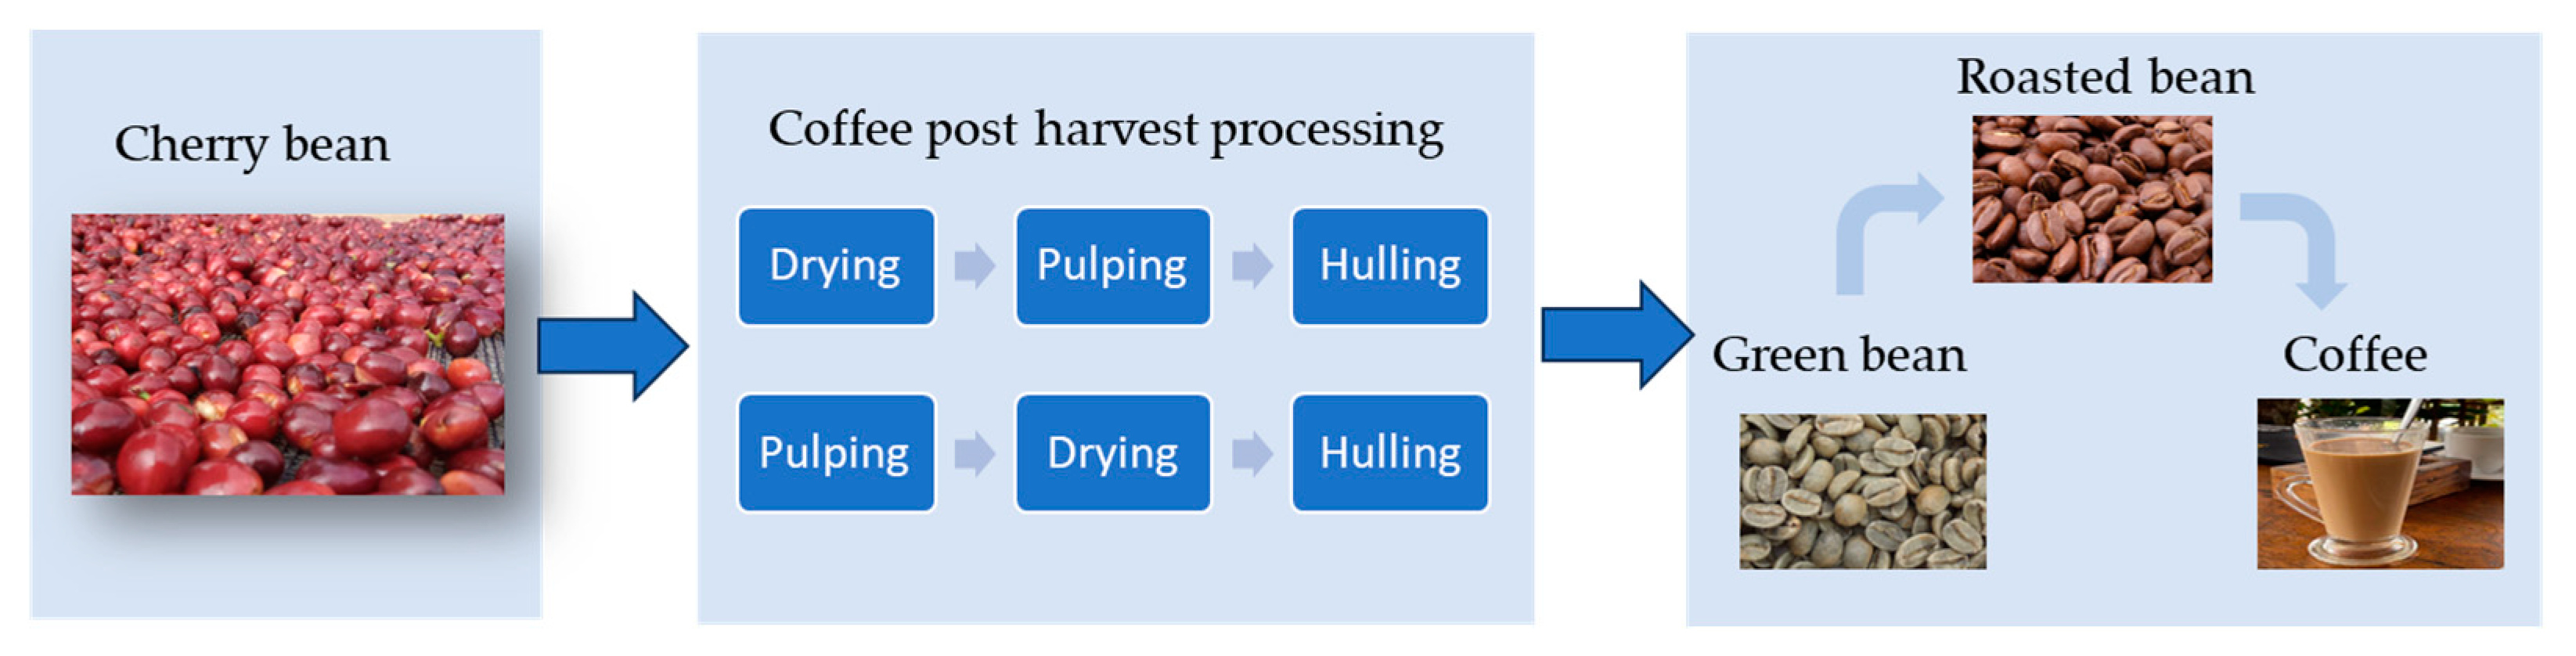
| Activity | Processing the coffee cherry bean until green bean, roasted bean, and other coffee products for the end user | Processing the coffee cherry bean until green bean | Processing the coffee cherry bean until green bean, roasted bean, and other coffee products for the end user |
| Final product | All coffee products: green bean, roasted bean, and other coffee products for the end user | Green bean as a raw material for third parties | All coffee products: green bean, roasted bean, and other coffee products for the end user |
| Trading activity | Direct selling to the end user (café shop, retailer, reseller, etc.) | Selling to the third parties | Direct selling to the end user (café shop, retailer, reseller, etc.) |
| Stakeholder | Subcategories | Performance Indicators | Impact Indicator | |
|---|---|---|---|---|
| Worker/employee | Freedom of association and collective bargaining | Freedom to form and join a union | Workers’ social interests are promoted and protected | |
| Membership of union | Workers’ economic interests are promoted and protected | |||
| Child Labor | Percentage of child labor (under 18) | Percentage of child labor (under 18) who have forfeited school | ||
| Fair wage | Following the minimum standard of salary regulation | Satisfaction of salary regulation and implementation in companies | ||
| Regulation document of salary | Implementation of salary protection | |||
| Working hours | Following the standard of working time regulation | Workers’ satisfaction with working hours | ||
| Forced labor | Workload following the regulation | Satisfaction of workload condition | ||
| Equal opportunity and discrimination | Share of female workers in the total work force | Workers’ satisfaction with job assignment | ||
| Health and safety | Recordable injury | Workers understand the procedure of safe working | ||
| Process safety event | Workers’ satisfaction with safety mitigation and procedures in the workplace | |||
| The number of accidents | Safe workplace conditions | |||
| Employee involvement in action of HSE | ||||
| Site with OHAS certification | ||||
| Social benefit/social security | Social program for workers | Workers’ satisfaction with company’s social program | ||
| Holiday regulation | ||||
| Expenditure on social security | Level of worker security on social aspect | |||
| Employment relationship | Permanent employee | The impact of the permanent worker status on the workers’ security satisfaction | ||
| Contract employee | The impact of the contract worker status on the workers’ security satisfaction | |||
| Document related to employment status | The legal document of working status’ impact on the employee–industry relationship | |||
| Sexual harassment | Regulation for sexual harassment prevention | Satisfaction of workers’ security through the sexual harassment prevention regulation | ||
| Cases of sexual harassment | Workers’ safety during work hours related to sexual harassment threats | |||
| Smallholders, including farmers | Farmers as workers | The level of farmers’ satisfaction with their involvement as workers | ||
| Consumers | Health and safety | Product guarantee in terms of health and safety | Customer satisfaction with product guarantee | |
| Cases related to health issues after consuming the product | Consumer trust related to health issue mitigation regarding products | |||
| Feedback mechanism | Complaint mechanism | Consumer satisfaction regarding complaint mechanism | ||
| Unsolved complaints | Consumer satisfaction with unsolved complaint performance | |||
| Consumer privacy | The agreement document/regulation | Consumer trust regarding the availability of the agreement document/regulation | ||
| Commitment to consumer privacy | Consumer satisfaction with the company’s commitment regarding consumer privacy | |||
| Transparency | Transparent information related to product quality | Consumer satisfaction related to the transparency of product quality information | ||
| Accessible information on social media or digital flatform information | Consumer satisfaction with the accessibility of information | |||
| End of product life responsibility | End of product life responsibility | Customer satisfaction with the end of product life responsibility | ||
| Local community | Access to material resources | Utilize the material resources from the local community | Satisfaction with the benefit to the local community due to the access to material resources | |
| Access to immaterial resources | Utilize the immaterial resources from the local community | Satisfaction with the benefits to the local community due to the access to immaterial resources | ||
| Delocalization and migration | Promoting local community migration | Migration number | ||
| Cultural heritage | Fulfillment of the statutory requirement for protection | Cultural heritage protection | ||
| Safe and healthy living conditions | Cost of the environmental impact on human health/ECM (derived from the ELCA model) | Rate of environmental hazards to human health | ||
| Respect indigenous rights | Involve indigenous considerations in activities | Satisfaction with consideration of indigenous rights | ||
| Community engagement | Community engagement in business activity | Satisfaction with community engagement performance | ||
| Local employment | Employees from local areas | Contribute to decreasing the number of unemployed local people | ||
| Secure living conditions | Effort to develop secure living conditions | Satisfaction with the security of living conditions | ||
| Society | Public commitment to sustainability issues | Commitment to sustainability issues | Public satisfaction with the industry’s commitment to sustainability issues | |
| Contribution to economic development | Job creation | Satisfaction with job opportunities | ||
| Prevention and mitigation of armed conflict | Procedure to mitigate the military conflict | Satisfaction of society related to the security from war or military conflict | ||
| Technology development | Economic contribution for technological development for society | Value-added creation to the society according to technological development | ||
| Corruption | The amount of corruption | Corruption’s impact on society | ||
| Ethical treatment of animals | Animal welfare consideration during production | Animal welfare issues | ||
| Poverty alleviation | Job creation for the local community | Contribute to reducing poverty | ||
| Value chain actors | ||||
| Suppliers | Fair competition | Farmers receive a fair purchase price for their product | Farmers’ satisfaction with fair purchase prices for their products | |
| Promoting social responsibility | Social responsibility program for farmers | Satisfaction of farmers related to the social responsibility program | ||
| Supplier relationship (farmers) | Product supply agreement among coffee farmers | Suppliers’ commitment to supplying the product | ||
| Training and coaching | Suppliers’ satisfaction with the company’s effort to manage the relationship | |||
| Respect of intellectual property rights | Intellectual property rights’ consideration | Suppliers’ satisfaction with the company’s performance regarding intellectual property rights | ||
| Wealth distribution | Contributing to farmers’ wealth improvement | Farmers’ wealth improvement | ||
| Shareholders | Manage the investment | The existing investment | Shareholders’ satisfaction with the company’s performance on investment management | |
| Agreement mutualism | Agreement document | Satisfaction with agreement mutualism implementation | ||
| Decision-making involvement | Investors involved in decision-making | Satisfaction with shareholders’ involvement in decision-making | ||
| Managing continuous communication | Special flatform communication/duration of meeting | Satisfaction with communication performance management | ||
| Maximize on creating the value added from the investment | Investment satisfaction | Satisfaction with the obtained value added | ||
| Children | Education provided in the local community | Education program for children related to the product | Satisfaction with the education program for children related to the product | |
| Health issues for children as consumers | Consideration of health issues for children | Health issues of children reported after consuming the product | ||
| Child-related concerns in marketing | Child-friendly advertisement | Children reporting negative impacts of marketing | ||
| Points | Performance Assessment | Impact Assessment | Prioritizing assessment | Color |
|---|---|---|---|---|
| 1 | Ideal performance/Very good performance | Strongly positive | Fully agreed/very highly related | |
| 0.75 | Beyond compliance/Good performance | Mostly positive | Moderately agreed/highly related | |
| 0.5 | Compliance with basic society expectation/satisfactory | Neutrally affected | Agree/neutrally related | |
| 0.25 | Slightly below compliance level/Poor performance | Mostly negative | Partially disagree/moderately related | |
| 0 | Starkly below compliance level/ Very poor performance | Strongly negative | Fully disagreed/highly unrelated |
| Percentage | Score | Subcategories and Indicators |
|---|---|---|
| 0% | 1 | Child labor (percentage of child labor (under 18)); health and safety (the number of accidents, cases of sexual harassment); health and safety consumers (cases related to health issues after consuming the product); feedback mechanism (unsolved complaints) |
| 1–25% | 0.75 | |
| 26–50% | 0.5 | |
| 51–750% | 0.25 | |
| 75–100% | 0 | |
| 100% | 1 | Fair wage (following the minimum standard of salary regulation); employment relationship (permanent employee, contract employee); smallholder, including farmers (farmers as workers); fair competition (farmers receive fair purchase prices according to the standard) |
| 76–99% | 0.75 | |
| 51–75% | 0.5 | |
| 26–50% | 0.25 | |
| until 25% | 0 | |
| 0–100% | 1 | Working hours (following the standard of working time regulation (maximum 8 h per day)) |
| 121–140% | 0.75 | |
| 141–160% | 0.5 | |
| 161–180% | 0.25 | |
| 181–200% | 0 |
| Category | Endpoint Indicator |
|---|---|
| Workers | HR management |
| Consumers | Consumer satisfaction |
| Local community | Communal development |
| Society | Societal development |
| Supply chain actor | Socioeconomic value added for supply chain actor |
| Children | Children awareness |
| Sustainability Index | Grade | Level of Sustainability | Significance |
|---|---|---|---|
| 0.81–1.00 | A | Highly sustainable | Strongly positive |
| 0.61–0.80 | B | Sustainable | Positive |
| 0.41–0.60 | C | Neutral | Moderate/satisfied |
| 0.21–0.40 | D | Unsustainable | Negative |
| 0.00–0.20 | E | Highly unsustainable | Strongly negative |
| Stakeholder Category | Impact Subcategory | Private | Middlemen | Farmer Group | |||
|---|---|---|---|---|---|---|---|
| Workers/employees | Freedom of association and collective bargaining | 0.483 | 0.250 | 0.667 | |||
| Child labor | 1.000 | 1.000 | 1.000 | ||||
| Fair wages | 0.563 | 0.250 | 0.750 | ||||
| Working hours | 0.750 | 0.750 | 0.750 | ||||
| Forced labor | 0.542 | 0.500 | 0.500 | ||||
| Equal opportunity and discrimination | 0.646 | 0.500 | 0.750 | ||||
| Health and safety | 0.674 | 0.417 | 0.528 | ||||
| Social benefit/social security | 0.240 | 0.000 | 0.250 | ||||
| Employment relationship | 0.656 | 0.563 | 0.583 | ||||
| Sexual harassment | 0.604 | 0.625 | 0.750 | ||||
| Smallholders, including farmers | 0.500 | 0.000 | 1.000 | ||||
| Consumers | Health and safety | 0.875 | 0.750 | 0.875 | |||
| Feedback mechanism | 0.875 | 0.625 | 0.833 | ||||
| Consumer privacy | 0.740 | 0.500 | 0.500 | ||||
| Transparency | 0.906 | 0.500 | 0.750 | ||||
| End of product life responsibility | 0.250 | 0.250 | 0.250 | ||||
| Local community | Access to material resources | 0.500 | 0.500 | 0.750 | |||
| Access to immaterial resources | 0.708 | 0.500 | 0.833 | ||||
| Delocalization and migration | 0.036 | 0.000 | 0.000 | ||||
| Cultural heritage | 0.271 | 0.125 | 0.292 | ||||
| Safe and healthy living conditions | 0.500 | 0.500 | 0.750 | ||||
| Respect indigenous rights | 0.896 | 0.250 | 1.000 | ||||
| Community engagement | 0.750 | 0.500 | 1.000 | ||||
| Local employment | 0.979 | 1.000 | 1.000 | ||||
| Secure living conditions | 0.375 | 0.375 | 0.375 | ||||
| Society | Public commitment to sustainability issues | 0.198 | 0.000 | 0.250 | |||
| Contribution to economic development | 0.604 | 0.500 | 0.750 | ||||
| Prevention and mitigation of armed conflict | 0.250 | 0.125 | 0.125 | ||||
| Technology development | 0.135 | 0.000 | 0.192 | ||||
| Corruption | 0.188 | 0.125 | 0.188 | ||||
| Ethical treatment of animals | 0.250 | 0.250 | 0.375 | ||||
| Poverty alleviation | 0.458 | 0.250 | 0.417 | ||||
| Suppliers | Fair competition | 0.771 | 0.250 | 1.000 | |||
| Promoting social responsibility | 0.234 | 0.000 | 0.563 | ||||
| Supplier relationship (farmers) | 0.458 | 0.125 | 0.750 | ||||
| Respect of intellectual property rights | 0.250 | 0.125 | 0.250 | ||||
| Wealth distribution | 0.375 | 0.250 | 0.667 | ||||
| Shareholders | Manage the investment | 0.328 | 0.563 | 0.250 | |||
| Agreement mutualism | 0.396 | 0.500 | 0.250 | ||||
| Decision-making involvement | 0.146 | 0.250 | 0.167 | ||||
| Managing continuous communication | 0.583 | 0.500 | 0.333 | ||||
| Maximize on creating the value added from the investment | 0.292 | 0.500 | 0.250 | ||||
| Children | Education provided in local community | 0.375 | 0.375 | 0.250 | |||
| Health issues for children as consumers | 1.000 | 1.000 | 1.000 | ||||
| Child-related marketing concerns | 0.750 | 0.750 | 0.750 | ||||
| Type of Coffee Industry | Endpoint Score | Grade | Sustainability Status |
|---|---|---|---|
| Private | 0.591 | C | Neutral/Sufficient |
| Middlemen | 0.482 | C | Neutral/Sufficient |
| Farmer group | 0.640 | B | Sustainable |
Disclaimer/Publisher’s Note: The statements, opinions and data contained in all publications are solely those of the individual author(s) and contributor(s) and not of MDPI and/or the editor(s). MDPI and/or the editor(s) disclaim responsibility for any injury to people or property resulting from any ideas, methods, instructions or products referred to in the content. |
© 2023 by the authors. Licensee MDPI, Basel, Switzerland. This article is an open access article distributed under the terms and conditions of the Creative Commons Attribution (CC BY) license (https://creativecommons.org/licenses/by/4.0/).
Share and Cite
Rahmah, D.M.; Purnomo, D.; Filianty, F.; Ardiansah, I.; Pramulya, R.; Noguchi, R. Social Life Cycle Assessment of a Coffee Production Management System in a Rural Area: A Regional Evaluation of the Coffee Industry in West Java, Indonesia. Sustainability 2023, 15, 13834. https://doi.org/10.3390/su151813834
Rahmah DM, Purnomo D, Filianty F, Ardiansah I, Pramulya R, Noguchi R. Social Life Cycle Assessment of a Coffee Production Management System in a Rural Area: A Regional Evaluation of the Coffee Industry in West Java, Indonesia. Sustainability. 2023; 15(18):13834. https://doi.org/10.3390/su151813834
Chicago/Turabian StyleRahmah, Devi Maulida, Dwi Purnomo, Fitry Filianty, Irfan Ardiansah, Rahmat Pramulya, and Ryozo Noguchi. 2023. "Social Life Cycle Assessment of a Coffee Production Management System in a Rural Area: A Regional Evaluation of the Coffee Industry in West Java, Indonesia" Sustainability 15, no. 18: 13834. https://doi.org/10.3390/su151813834