Article

Impact of Natural Disasters on Household Income and Expenditure Inequality in China

School of Business, Nanjing University of Information Science and Technology, Nanjing 210044, China
*
Author to whom correspondence should be addressed.
Sustainability 2023, 15(18), 13813; https://doi.org/10.3390/su151813813
Submission received: 27 July 2023 / Revised: 5 September 2023 / Accepted: 9 September 2023 / Published: 16 September 2023
(This article belongs to the Special Issue Economic Inequality, Regional Disparities and Sustainable Development)

Abstract

:
Natural disasters have been demonstrated to cause devastating effects on economic and social development in China, but little is known about the relationship between natural disasters and income at the household level. This study explores the impact of natural disasters on household income, expenditure, and inequality in China as the first study of this nature for the country. The empirical analysis is conducted based on a unique panel dataset that contains six waves of the Chinese Household Income Project (CHIP) survey data over the 1988–2018 period, data on natural disasters, and other social and economic status of households. By employing the fixed effects models, we find that disasters increase contemporaneous levels of income inequality, and disasters that occurred in the previous year significantly increase expenditure inequality. Natural disasters increase operating income inequality but decrease transfer income inequality. Poor households are found to be more vulnerable to disasters and suffer significant income losses. However, there is no evidence to suggest that natural disasters significantly reduce the income of upper- and middle-income groups. These findings have important implications for policies aimed at poverty alleviation and revenue recycling, as they can help improve economic justice and enhance resilience to natural disasters.

1. Introduction

In recent decades, there has been an increase in both the frequency and severity of natural disasters worldwide. China is one of the countries that is most likely to be significantly attacked by natural disasters in the world due to its vast territory, complex geographical phenomena, large-scale climatic fluctuation, and fragile ecological conditions [1]. Historical records show that various types of natural disasters, such as floods, droughts, and earthquakes, have had far-reaching impacts on China’s economy and social development [2]. For example, the major flood in the Yangtze River basin in 1998 resulted in economic losses totaling approximately 166 billion RMB yuan (USD 20 billion). The 2008 Wenchuan earthquake caused 69,227 deaths and more than 845 billion RMB yuan (USD 121 billion) in direct economic losses. Despite advancements in early warning systems and precautionary measures, the rise in population and economic growth has contributed to rising economic losses from natural disasters over the past few decades [3]. Furthermore, anthropogenic climate change is expected to amplify the frequency and intensity of extreme weather events [4]. These trends emphasize the need to investigate the impacts of natural disasters on the economy and society [5].
Since the beginning of China’s economic reform in 1978, there has been rapid economic growth, resulting in an increase in household income as well as a significant rise in economic inequality. While the exact figures may be debated, there is a consensus that income inequality in China is now much higher than it was in the 1980s [6]. Scholars have identified various factors that contribute to this high level of inequality, including industrial structure, the rural–urban divide, regional disparities, family structure, and education. However, little attention has been given to the impact of accidental and non-systemic factors such as natural disasters. The frequency of natural disasters is increasing, which puts additional strain on the population, particularly those who are less resilient, and consequently affects the distribution of income and expenditure. Therefore, it is crucial to explore the causal relationship between natural disasters and income distribution.
The aim of this paper is to investigate how natural disasters impact the distribution of household income and expenditure. We do so by constructing a panel dataset of 20 provinces for 6 survey waves spanning from 1988 to 2018. The results of this study can offer valuable insights for policymakers and relevant agencies in designing effective policies and disaster relief programs that strengthen resilience against disasters. Additionally, our findings can also provide implications for other developing, emerging, and transition economies similar to China.
The rest of this paper proceeds as follows. The next section provides a review of the relevant literature on natural disasters and their impact on income, expenditure, and inequality. Section 3 describes the main data used in this study. The methodological approach employed in the empirical analysis is presented in Section 4. Section 5 reports the findings of our empirical research, and Section 6 is a robustness check. In Section 7, we present further discussions of our findings and some policy implications. The final section offers some conclusions and highlights the remaining issues to be resolved by future studies.

2. Literature Review

Natural disasters and the impacts they have on the economy and society have sparked widespread concerns and have been widely studied by scholars. A substantial body of literature has been dedicated to estimating the relationship between natural disasters and economic growth. Some studies find that natural disasters, on average, have negative effects on gross production and, subsequently, on economic growth [5,7,8]. Other studies suggest that negative effects vary depending on the type of disaster and the specific economic sectors affected [9]. Using a 1961–2005 cross-country panel dataset, Loayza et al. [10] discovered that moderate disasters can have a positive growth effect in certain sectors (i.e., the industrial sector), whereas severe disasters do not. They also find that economic growth in developing countries is more sensitive to natural disasters than in developed ones. Kotz et al. [11] show that extreme rainfall events have negative global economic consequences, with the services and manufacturing sectors being most severely hindered. Xia et al. [12] find that heat waves result in significant economic losses in the manufacturing and service sectors in China. Using night-time light intensity data as a proxy of GDP per capita, Klomp [13] demonstrates that climatic and hydrological disasters adversely affect economic development in developing and emerging countries, while geophysical and meteorological disasters cause a drop in economic development in industrialized countries. The research of Okiyama [14] found that disasters in Japan significantly damage the agricultural and manufacturing sectors and eventually cause considerable economic losses.
Another strand of research examines the impact of socioeconomic factors on disaster losses at the national and regional levels. The literature widely agrees that socioeconomic development can contribute to improving resilience to natural disasters. For instance, Kahn [15] found that richer nations with higher per capita income suffer less death from catastrophic events. Anbarci et al. [16] further confirm this finding in their study by highlighting that the resulting death toll from earthquakes is ascribable to economic, political, and institutional factors. Based on data from multiple economic regions across mainland China, Wu et al. [17] conclude that economic development level is correlated with both human and economic vulnerability to natural disasters, and the vulnerability declines with the increase of per-capita income. Other studies suggest that factors such as income, institutions, urbanization, trade openness, and financial integration can also influence the detrimental effects of natural disasters [18,19]. Further investigations reveal an inverted U-shaped relationship between economic growth and the overall impact of disasters [20,21,22].
In contrast to studies that focus on the macroeconomic level, one strand of literature estimates the effect of disasters on average household income and distribution. The empirical evidence is decidedly mixed. For instance, Yamamura [23] employs cross-country panel data from 86 countries over the period 1970–2004 to examine the impact of natural disasters on income inequality. His analysis reveals that natural disasters increase income inequality in the short term (5 years); however, this effect disappears in the long term (10 years). Using the Vietnam Household Living Standard Survey in 2008, Bui et al. [24] found that natural disasters noticeably increase income and expenditure inequality among households in Vietnam. By contrast, Abdullah et al. [25] show that income inequality decreased following Cyclone Aila in the Sundarbans region in Bangladesh in 2009. Similarly, Keerthiratne and Tol [26] also find that natural disasters significantly decrease household income inequality as measured by the Theil index in Sri Lanka. A recent study by Pleninger [27] concludes that natural disasters primarily affect middle incomes, which translates into non-existent effects on inequality measures. Based on a comprehensive literature survey, Karim and Noy [28] suggest that the distributional impact of a disaster on household income levels is ambiguous, indicating the need for country-level research in this field.
There have been several empirical studies conducted on the impact of natural disasters on household income inequality in China. One study by Feng et al. [29] examines the impact of the 2008 Sichuan earthquake on household income, consumption, and income inequality. They found that average household income fell by 14%, but income inequality remained unchanged. Another study by Wu et al. [30] estimated the impact of natural disasters on rural household wealth using household-level data. Their findings show that natural disasters have a negative impact on average household wealth. The heterogeneity analysis further indicates that larger households and households with high consumption levels experience greater wealth losses. Zeng and Yang [31] use regressions and household-level survey data to quantify the effect of natural disasters on household income inequality. They find that disasters widen the income gap between high-income and low-income households. However, their analysis is based on a single year’s data. Our analysis makes three main contributions to the existing literature. First, it provides a comprehensive assessment of the distributional effects in China, considering all types of natural disasters. Previous studies focus either on specific types of natural disasters or on regional impacts. Second, we examine the underlying mechanisms of the effects of natural disasters on income inequality by decomposing income into several components. The distinction among different income measures is relevant due to their difference in the amount of risk that each component may bear [27]. The third contribution is enriching knowledge of the factors that influence household income and expenditure inequality. This provides policy insights for the government in designing effective disaster management and poverty alleviation strategies. Overall, our study highlights disaster injustice in the country and the compelling need for the government to take greater action in supporting socially and economically marginalized groups in an era of climate change.

3. Data

In this section, we first describe the dataset on natural disasters. Next, we present the set of income and expenditure inequality measures, along with other socioeconomic variables extracted from an existing survey dataset. Lastly, the descriptive statistics of all variables are presented in the summary table.

3.1. Natural Disasters

The data on natural disasters is obtained from the China Civil Affairs Statistical Yearbook. The natural disasters accounted for in this paper refer to all major types of disasters in China. They can be classified as hydrological (e.g., floods, mudslides, coastal floods, and storm surges, etc.), geophysical (e.g., landslides, earthquakes, etc.), and climatic and meteorological (e.g., droughts, wildfires, typhoons, windstorms, extreme temperature events, etc.) disasters. This dataset contains the yearly number of people affected by all natural disasters for each province in China from 1988 to 2018. It is considered the official and most comprehensive source for assessing the damage caused by these events. The term “affected people” refers to individuals who have been physically injured or require immediate assistance as a result of the disaster. It includes people who have been physically injured at all levels, those who suffer from house damage or other property loss, and those whose production and livelihood are impacted or damaged due to natural disasters. According to the dataset, the total number of affected individuals in the surveyed provinces ranged from 0 to 53.5 million between 1988 and 2018. The intensity of natural disasters (Dist) is measured as the percentage of the population affected in each province during a calendar year. It is important to note that the impacts of natural disasters on income and expenditure inequality can persist for a long time [32]. To account for this delayed effect, we also include four disaster lags for each survey time in our analysis (Dist_lag1~Dist_lag4).
It is noteworthy that there are several options when it comes to measuring the impact of natural disasters, such as the number of occurrences, total deaths, or total direct economic damages. While the number of occurrences provides information on the frequency of disasters, it does not capture their severity. When considering deaths and people affected, the latter is preferred as severe disasters may not necessarily result in high death rates [33,34]. Keerthiratne and Tol [26] stated that the economic data may be collected by local individuals who may have biased perspectives, making it an inappropriate measure for assessing natural disasters. Hence, in this study, we choose to focus on the proportion of people affected by natural disasters as our variable of interest.

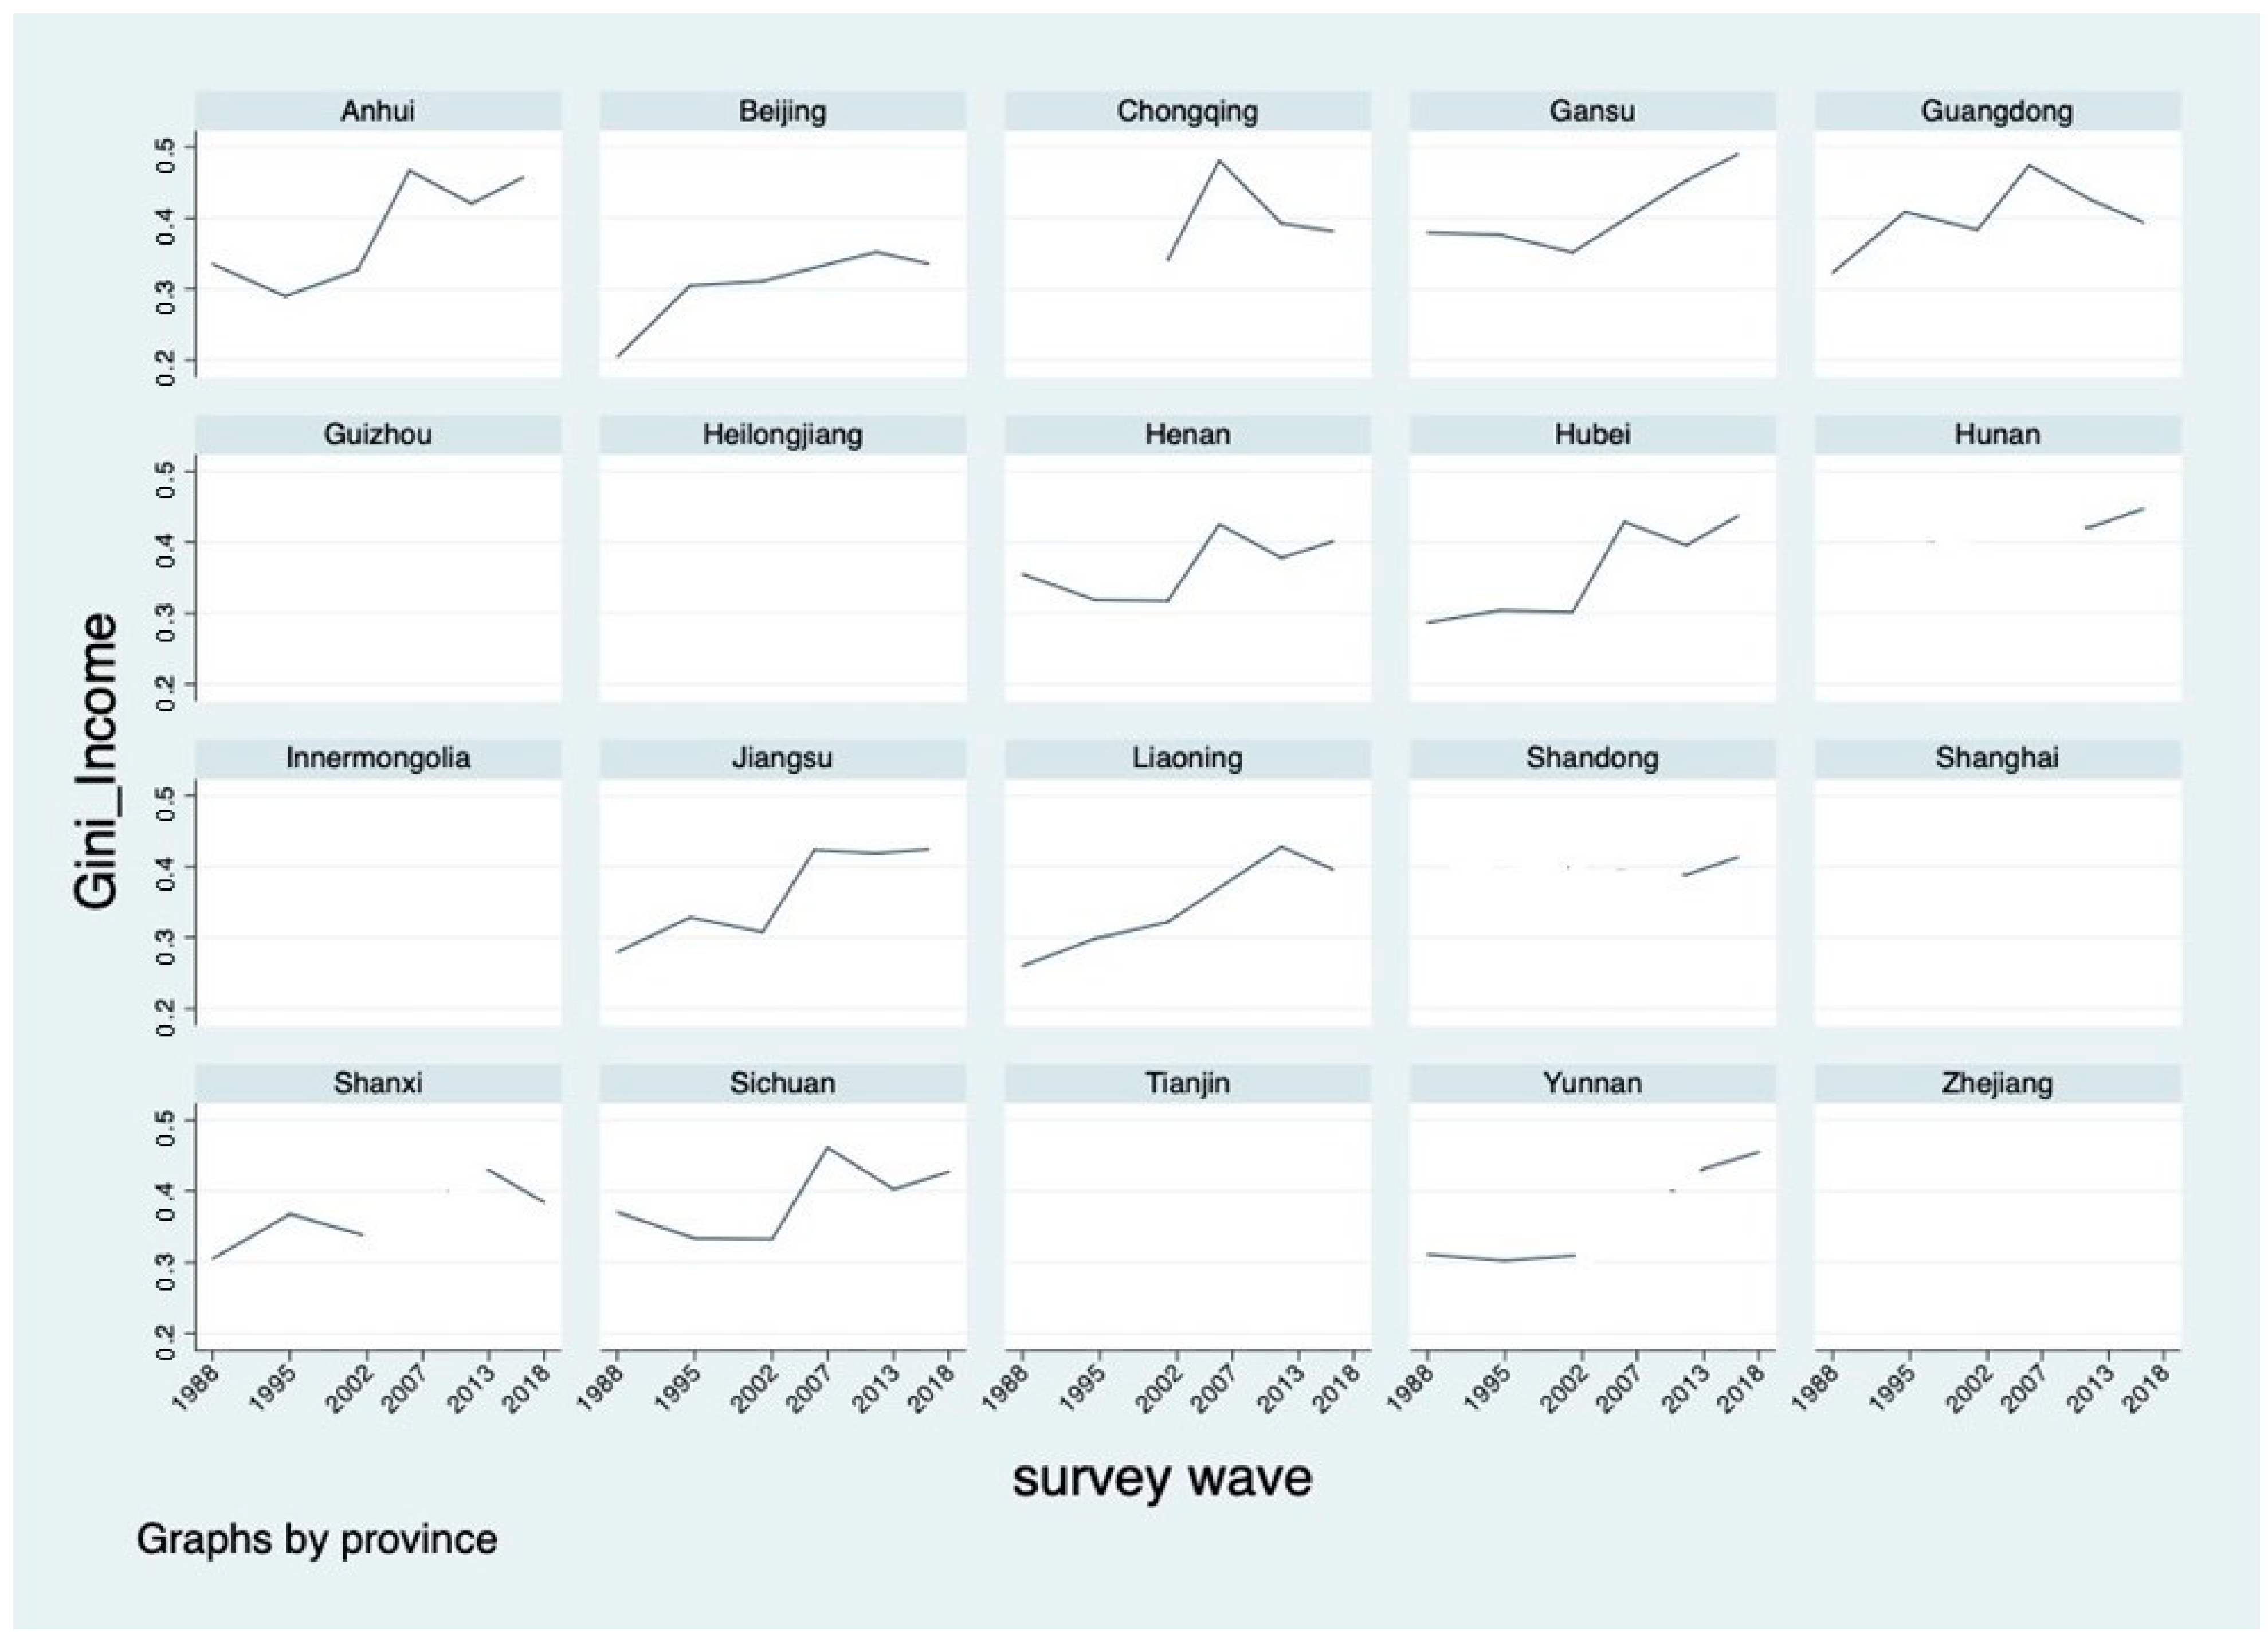
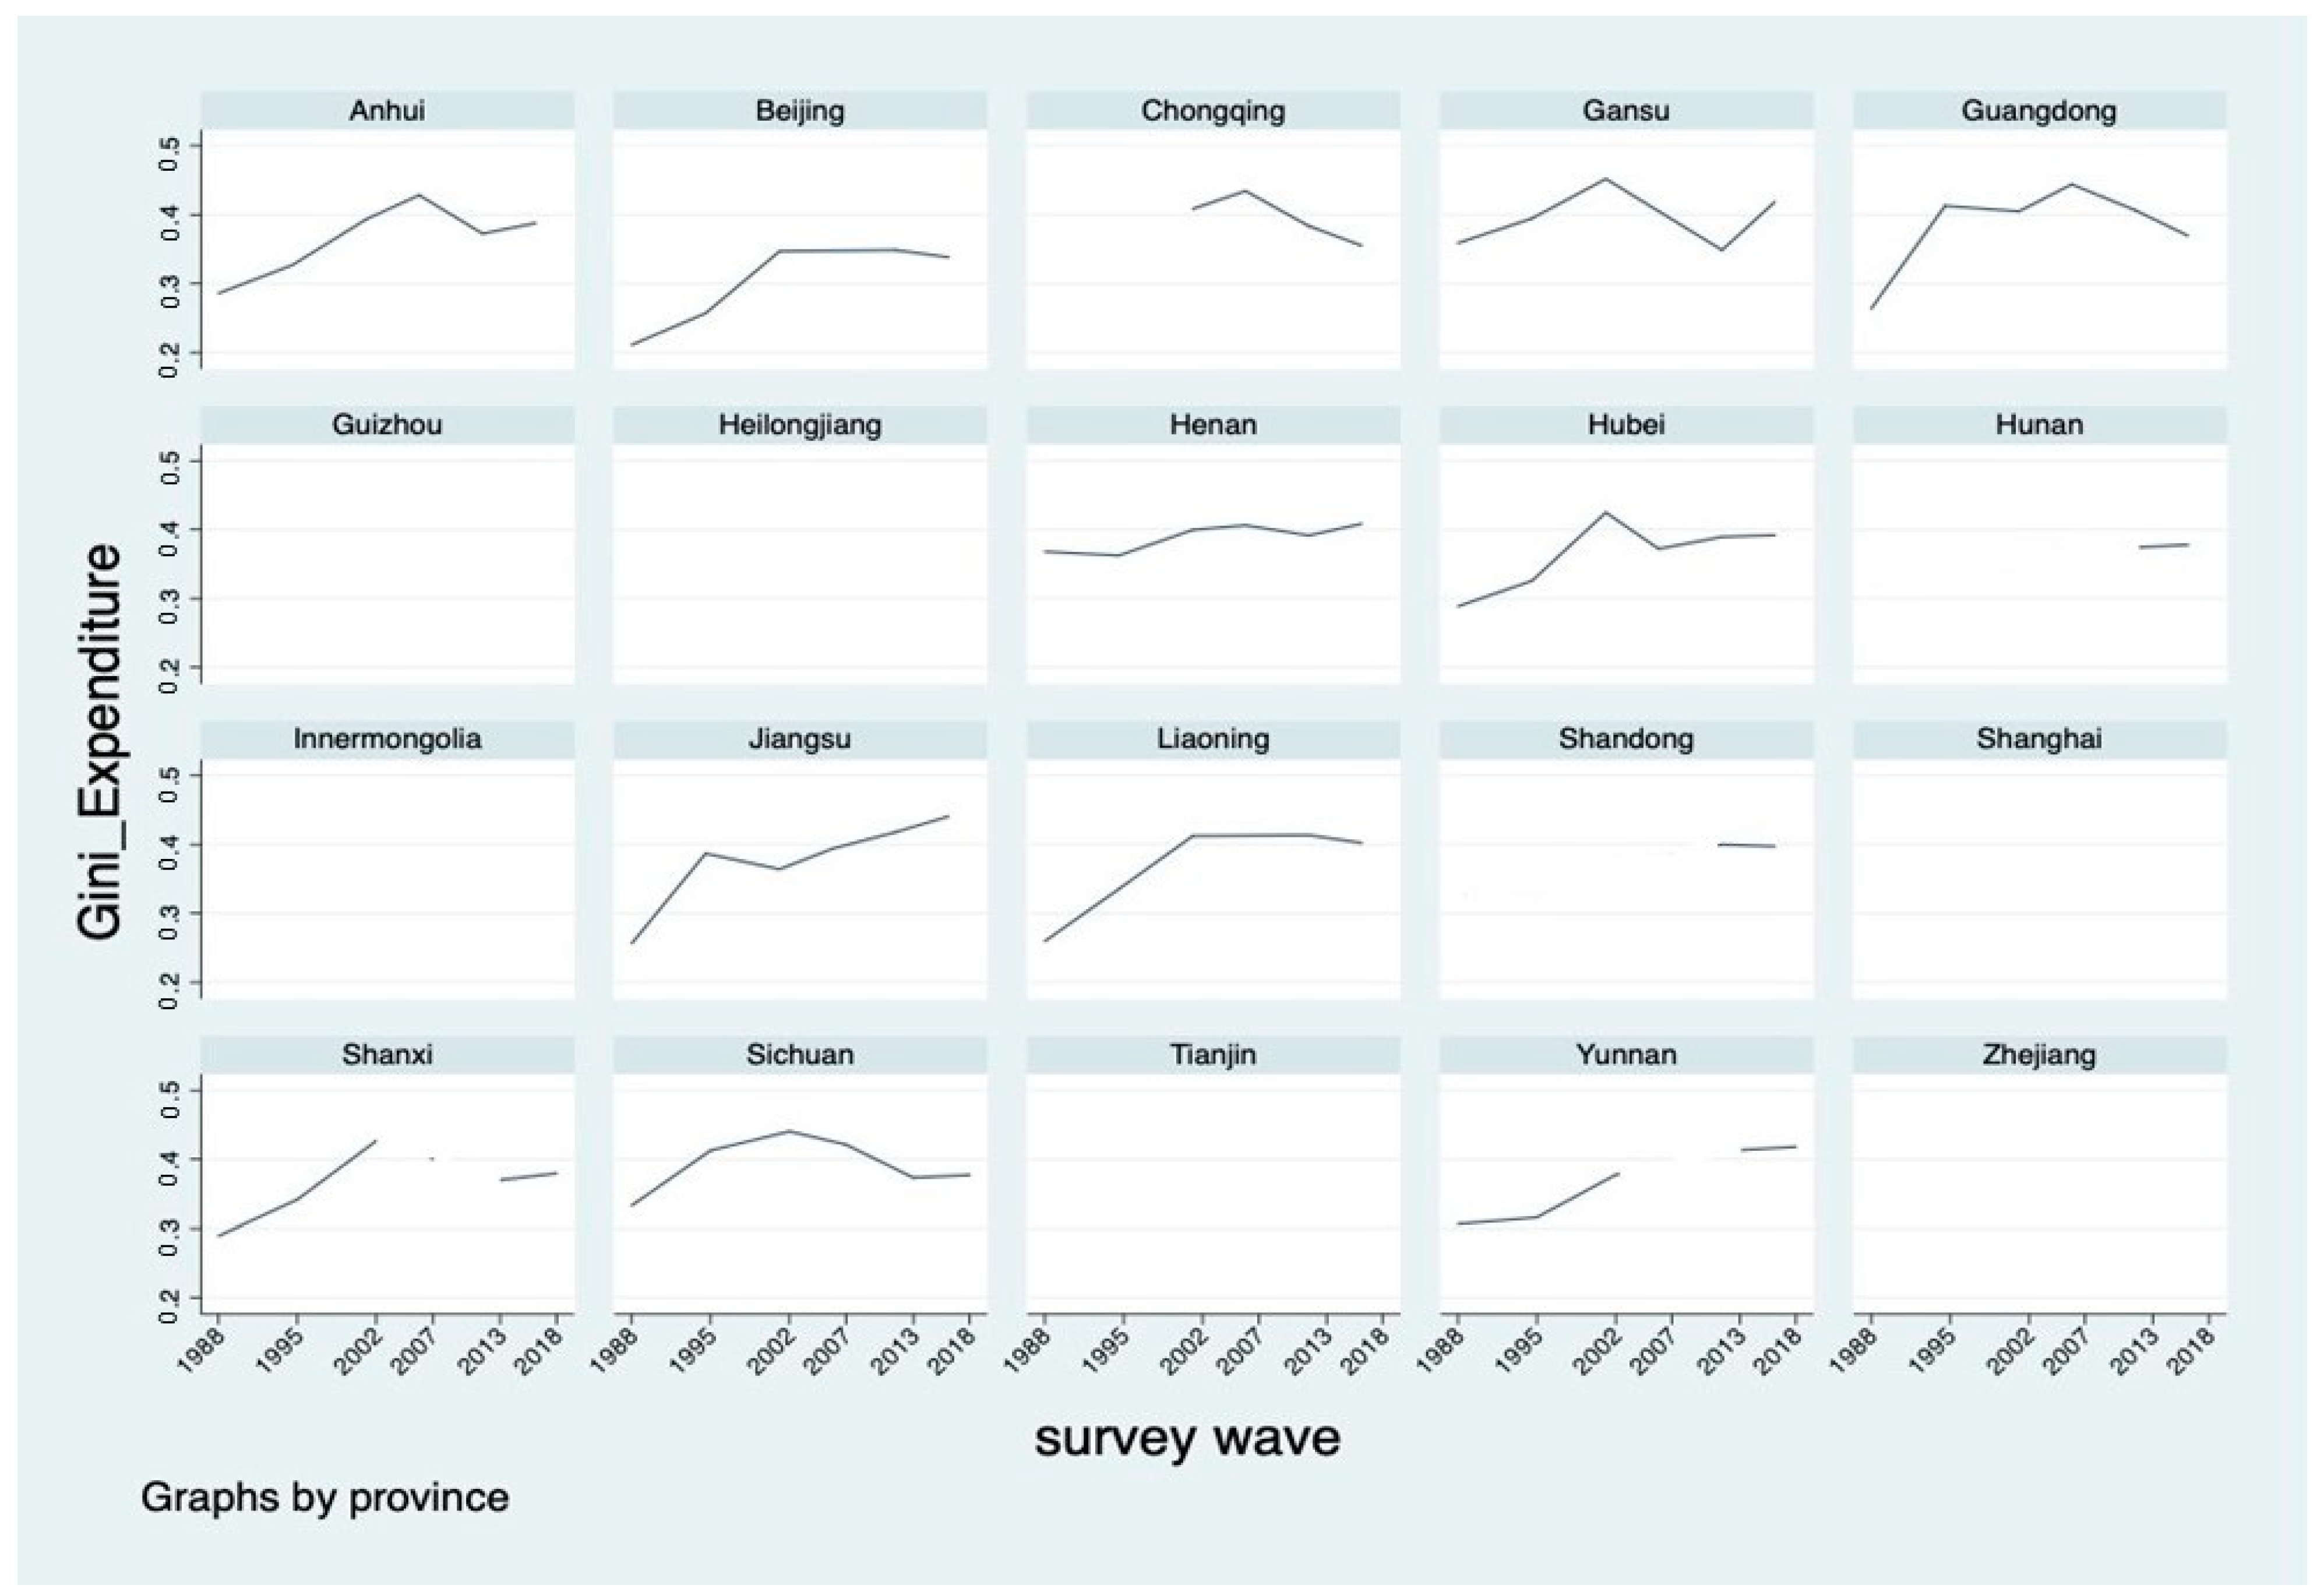
3.2. Income and Expenditure Inequality

To analyze the impact of natural disasters on household income and expenditure inequality, we utilize household survey data from the Chinese Household Income Project (CHIP) to calculate the Gini index. We choose to use CHIP data for three reasons: (1) it spans a substantial period from 1988 to 2018; (2) it surveys a comprehensive set of households from both urban and rural areas; (3) it covers approximately two-thirds of Chinese provinces and offers a representative regional sample that includes the eastern, central, and western regions of China. The data consist of 6 available waves (i.e., 1988, 1995, 2003, 2007, 2013, and 2018), encompassing 20 provinces in China. In our calculations, we consider disposable income (post-tax and post-transfer) derived from various sources. Household income is further disaggregated into four components as defined by the National Bureau of Statistics (NBS).
(a)
Employment income—wages, pensions, and other compensation received by working or retired members;
(b)
Operating income—income from the sale of the products of farming, industrial and subsidiary activities, private/individual enterprise, etc.;
(c)
Property income—income from house rent, leasing out other goods, interest amounts received from savings accounts, etc.;
(d)
Transfer payment—relief payments, health and medical aid, receipts from welfare fund and the collective, other windfall income.
Household per capita income is determined by summing all income components and then dividing by the equivalent household size. The household size is equivalized by adopting the widely recognized Organization for Economic Cooperation and Development (OECD) modified equivalence scale. According to this scale, the household head is assigned a value of 1, each additional adult member is assigned a value of 0.5, and each child member is assigned a value of 0.3 [35]. The adjusted household per capita expenditure for each survey year is calculated using the same method. These resulting per capita income and expenditure figures are then used to calculate income inequality for each province and survey year. The Gini coefficient is employed as the measure of inequality in the baseline model, as it is the most widely accepted indicator of income distribution. Alternative inequality metrics, such as the Theil index and interquartile range, are utilized to verify the validity of the findings.
Socioeconomic factors have been found to impact the disparity in income and expenditure within a district. We collected information on extra variables, including average household size (Avg_HH) and mean household income (Avg_Income). These explanatory variables are included in the empirical estimation to mitigate any potential bias from omitted variables.
Based on the above data, we constructed a province-wise panel dataset that contains annual household incomes and expenditures, natural disasters, and other socioeconomic data for 20 provinces in China over 6 survey waves. Note that this is an unbalanced panel as the number of provinces covered in the survey varies between 9 and 20. Table 1 presents the acronyms and main statistics for all variables used in the analysis. There exists a big difference in the number of people affected by natural disasters in different provinces. On average, 23.46% of the population is affected by disasters across all surveyed provinces, and the maximum percentage of the population affected is as high as 74.95%. In Figure 1, we illustrate the changes in income and expenditure inequality as measured by the Gini coefficient. A considerable variation of inequality over time is observed for nearly all provinces. No variation is shown within the provinces of Guizhou, Heilongjiang, Inner Mongolia, Tianjin, Shanghai, and Zhejiang, as they were covered only once in the survey waves.
We also checked for the presence of multicollinearity among the control variables. As indicated in Table 2, the value of VIF (variance inflation factor) is below 5, and the value of tolerance is above 0.2. Therefore, we can conclude that the issue of multicollinearity is not present among the variables.

4. Empirical Methodology

We are interested in examining the causal relationship between natural disasters and household income and expenditure inequality. To estimate this relationship, we choose the panel regression estimator with fixed effects for provinces and time as our main estimation strategy. The fixed effect model has two main advantages: firstly, it controls for time-invariant spatial heterogeneity among regions, which greatly reduces the endogeneity issue; secondly, by incorporating time effects, it controls for factors that remain unchanged in the current year. The benchmark model is defined as follows:
I n e q u a l i t y p t = α p + β t + γ D i s t p t + n = 1 4 θ p n D i s t p t n + δ p t X p t + ε p t
where I n e q u a l i t y p t is the dependent variable for income or expenditure inequality in province p and survey year t; D i s t p t represents the affected people (%) due to all natural disasters in province p and survey year t; lagged disaster impacts ( D i s t p t n ) are also included in the regression; X p t represents control variables that affect income and expenditure inequality, including median household income and average household size; α p and β t are the province and time-fixed effects, respectively, and the final term ε p t represents an error term. Errors are clustered at the province level.
In addition to the Gini coefficient as used in the benchmark model, we employed other alternative inequality measures, such as the Theil index and interquartile range (IQR) as the dependent variable. We also conducted a robustness check of our findings by employing two alternative estimators (ordinary least squares (OLS) and generalized method of moments (GMM)). More detailed information is presented in the robustness check sector.

5. Results

5.1. The Effect of Natural Disasters on Income Inequality

Table 3 presents the findings on how natural disasters impact the inequality of household per capita income. Results of the baseline model of effect on total income inequality are given in column (1) of Table 3. We find a statistically significant positive impact of natural disasters that occurred in the same year on income inequality. An increase of the current disaster-affected population by 1% would lead to a 0.144 increase in income inequality as measured by the Gini coefficient. Conversely, we find no significant effect on income inequality from disasters that occurred in previous years. In summary, the occurrence of natural disasters has an immediate detrimental effect on income inequality, but this impact does not endure over time. These findings align with the conclusions of previous studies such as Yamamura [23] and Bui et al. [24].
In order to disentangle the ways by which income inequality is increased due to natural disasters, we conducted a panel regression analysis on the effect of natural disasters on each income component. The findings, as shown in columns (2)–(5) of Table 3, indicate that the effects vary across the composition of household income. Among all sources of income, natural disasters have a negative impact on operating income inequality. However, there is no significant effect on employment income inequality. This can be attributed to the fact that formal enterprises are usually more resilient to natural hazards compared to self-employed businesses (e.g., farming, transportation, retail shops, etc.). In addition, labor laws protect the rights of employees working in formal employment. On the other hand, natural disasters significantly decrease transfer income inequality (which includes any relief payments). One possible explanation is that disaster relief payments are distributed unevenly among income groups, with the low-income group benefiting the most from government emergency support. There is no conclusive evidence that exposure to natural shocks significantly affects property income inequality. The results suggest that the positive impact of natural disasters on income inequality is primarily driven by operating income received by households. Similar findings have been reported by Ye et al. [36], who found that natural disasters exacerbated income inequality in seasonal agriculture and individual-owned enterprises.

5.2. The Effect of Natural Disasters on Income

In order to further investigate the impact of natural disasters on income inequality, we analyzed how these disasters affect household income within different income groups. As shown in Table 4, current natural disasters negatively affect the income of the two poorest quintiles (as indicated in columns (1) and (2)). However, there is no significant impact on the middle and richest quintiles. These results, along with the findings on income inequality presented in Table 3 (column (1)), demonstrate how changes in different income quintiles feed into the changes in overall income inequality caused by natural disasters. It is evident that the effects of disasters on income vary considerably across different income groups. Low-income households suffer income losses due to current natural disasters, whilst the middle and rich groups do not see significant losses to their total income. As a result, natural disasters lead to increased income inequality, which aligns with the positive effects of current disasters on the Gini-coefficient observed in the baseline model (see Table 3 column (1)).

5.3. The Effect of Natural Disasters on Expenditure Inequality

To examine the impact of natural disasters on household consumption, we repeated our analysis for expenditure inequality at the household level. Results of the baseline model using the panel fixed effects estimator are given in Table 5. We find a statistically significant positive impact of natural disasters that occurred one year prior to the survey year on Gini-based expenditure inequality. Specifically, an increase in the disaster-affected population by 1% in the previous year would lead to an increase of expenditure inequality by 0.143. However, there is no significant effect found with current natural disasters. This finding differs from the results obtained from the base model with respect to the current disaster impact on income inequality. A possible explanation for this lagged effect is that households typically do not immediately change their spending habits when confronted with natural shocks as they prioritize basic needs and have inertia in their consumption patterns. However, they are likely to adjust their expenditure in the year following the disaster, and these adjustments may disproportionately impact different income quantiles. Overall, our findings indicate that natural disasters worsen expenditure inequality with a one-year lag in response.

6. Robustness Checks

We further conducted various robustness tests regarding alternative inequality metrics, estimation methods, and panel datasets.

6.1. Alternative Inequality Metrics

In order to verify if our findings are applicable to various inequality measures, we also employ some other metrics, such as the Theil index and interquartile range. The Theil index was initially proposed by Theil [37] and has gained popularity as an inequality measure due to its decomposability. The interquartile range measures the difference between the third and first quartile. As shown in Table 6, the occurrence of disasters leads to an increase in income inequality as measured by both the Theil index and the interquartile range of income. Moreover, natural disasters in the previous year significantly increased the expenditure inequality as measured by the indices of Theil and IQR. All these results are consistent with the primary findings obtained from the baseline model.

6.2. Alternative Estimators

We checked the validity of the Gini-based results by applying the ordinary least square (OLS) estimator. The results are presented in columns (1) and (5) in Table 7, which confirm that the primary findings remain valid through the OLS regression. Furthermore, there may be potential simultaneity between income inequality and the damages caused by natural disasters [38]. To further address the potential endogeneity issue, we re-estimated the model using the system GMM panel estimator as proposed by Arellano and Bover [39] and Blundell and Bond [40]. This estimator is designed to be used with panel data when the explanatory variables are suspected to be correlated with past and current realizations of the error and when suitable instrumental variables are not available [41]. It is particularly powerful in the context of a small and wide panel dataset (i.e., short time periods and a large number of districts). Our results from the system GMM analysis, displayed in columns (3) and (7) of Table 7, demonstrate that the impacts of disasters on both income and expenditure inequality remain robust in the base model.
In order to control unobserved heterogeneity generated by regional differences in the effects of natural disasters, we also included a regional-specific dummy variable in the OLS and system GMM analysis. We followed the standard division of Chinese provinces into six regions (see Table 8). The provinces within the same region are geographically close and share similar climate conditions [42]. We generated regional dummies for the North, Northeast, Northwest, Southcentral, and Southwest regions, leaving the East region as the reference region. The even-number columns in Table 7 report the results with regional dummy variables using OLS and system GMM estimators. Clearly, adding regional dummies does not change our conclusions, suggesting the positive impact of natural disasters on income inequality and expenditure inequality. The positive and significant coefficients associated with the Northeast region (columns (2) and (4)) imply that natural disasters have a greater impact on income inequality in the Northeast region relative to the reference East region.

6.3. Balanced Panel Dataset

The number of provinces included in the survey changes over time, resulting in an unbalanced panel dataset. In order to check whether the results are influenced by some newly surveyed areas, we repeated our analysis for income and expenditure inequality with a balanced panel of nine provinces for all six waves. The estimated coefficients, as presented in Table 9, confirm the initial findings, demonstrating that natural disasters do have adverse effects on income and expenditure inequality.

7. Discussion

The impact of natural disasters and income/expenditure inequality are topics that have been extensively explored in the research literature, but usually in separate ways. With the increasing frequency of natural disasters in recent years, investigation of socioeconomic consequences in the wake of these events has become more pressing among sociologists and economists [32]. Different countries and populations are affected in different ways by natural disasters due to their varying abilities to prepare for, respond to, and recover from these events. Many scholars discover that what people often call ‘natural’ disasters are, in fact, patterned in ways that reflect social and economic inequalities [42,43]. Therefore, it is crucial to analyze their distributional impact. This article aims to investigate the impact of natural disasters on household income and expenditure inequality in China. Unlike previous studies that have focused on specific districts or disasters, we harness information from various publicly available datasets on affected populations due to natural disasters, household income, expenditure, and economic and social conditions. By doing so, we are able to address potential biases in sample selection and omitted variables. Therefore, this study provides a more reliable evaluation of the effects of natural disasters on overall income and expenditure inequality in China.
Our estimates reveal that contemporaneous natural disasters increase province-level income inequality, and disasters in the previous year increase expenditure inequality as measured by the Gini coefficient. Poor households are more vulnerable to disasters and suffer significant income losses due to their inability to engage in work and the destruction of property. In contrast, we do not find any evidence suggesting that natural disasters have a negative effect on the income of the upper- and middle-income groups. The delayed increase in expenditure inequality might be because households do not change their expenditure patterns immediately despite a decrease in income caused by the disasters. Further analysis of household income components reveals that natural disasters increase operating income inequality while employment and property income remain unaffected. This is likely due to the fact that the poorer households rely more heavily on income from agricultural and low-skilled activities, which are more vulnerable to natural disasters. In contrast, the operating income of wealthier households is mainly derived from non-agricultural sources, such as manufacturing and medium to large enterprises. Transfer income inequality is found to be reduced by disasters, which is likely driven by enhanced disaster relief payments. However, this mitigation effect is not substantial enough to negate the adverse impact on overall income inequality.
This study put forward targeted policy implications for the government of China. First, it is crucial for the government to consider the impact of all types of natural hazards when designing poverty alleviation and redistribution policies. Natural disasters disproportionately affect different income groups and contribute to increased poverty and income inequality. When measuring and addressing income and expenditure inequality, natural disasters should be taken into account along with other regular factors such as GDP (gross domestic product) and household size. Second, policymakers and the insurance industry should explore more effective strategies to reduce poverty and inequality caused by disasters. While direct financial aid and relief assistance are helpful, they are not sufficient. Policies should target the enhancement of low-income households’ resilience to natural disasters. This can be achieved through strategies such as diversifying household income sources, improving unemployment insurance, and enhancing public medical benefits. Third, government inventions should aim to reduce the occurrence of natural disasters and minimize exposure. As suggested by Skoufias [44], it is more effective to have public responses in place ahead of a natural disaster occurring. Policies promoting low-carbon technology, afforestation, and biodiversity are highly needed to mitigate risks posed by increasingly frequent natural hazards.

8. Conclusions

The rising concerns about climate change and the increasing occurrence of extreme events have brought the impact of natural disasters to the forefront of studies and policy discussions. This study adds to prior research by examining the causal relationship between natural disasters and inequality of household income and expenditure in China. Employing a panel fixed effects estimator as the primary empirical strategy, we find that disasters increase contemporaneous levels of income inequality and lead to an increase in expenditure inequality in the immediate aftermath. These results are robust across sub-samples, alternative measures of inequality, and empirical estimation methods. Further investigation into the effects on different income components and quintiles suggests that natural disasters significantly worsen the income of impoverished households, thus widening the wealth gap between the rich and the poor.
If poverty and income inequality are not addressed effectively, they can hinder economic welfare and social development. Our analysis calls for a broader understanding of income and expenditure inequality as the combination of natural disasters and socioeconomic factors. Such a view would shape policies that minimize the harmful effects of natural disasters and alleviate poverty. Both adaptation and mitigation mechanisms should be well established to reduce the vulnerability of exposed populations.
Our analysis does not capture internal migration as a result of natural disasters due to limited data availability. Recent research by Pleninger [27] suggests that migration is an important tool for mitigating the adverse effects of natural disasters. Future research can address the role of migration and examine how these migration patterns evolve with occurrences of natural disasters. Furthermore, it would be interesting to explore the effects of disaster subgroups (i.e., biological, climatic, geophysical, hydrological, and meteorological disasters). Further study on different types of disasters is valuable for formulating effective relief and mitigation policies. Finally, in order to estimate the effects on incomes and consumption more accurately, monthly data would be more useful. As natural disasters tend to peak during the summer season in China, using annual data from January to December may result in underestimated effects. We leave this for future work.

Author Contributions

Conceptualization, W.W.; Methodology, W.W.; Validation, Y.Z.; Formal analysis, W.W.; Data curation, Y.Z.; Writing—original draft, W.W. and Y.Z.; Supervision, W.W.; Project administration, W.W.; Funding acquisition, W.W. All authors have read and agreed to the published version of the manuscript.

Funding

This research is funded by Project on Philosophy and Social Science of Jiangsu Higher Education Institutions [2023SJYB0189]; Startup Foundation for Introducing Talent of NUIST (2022r110) and the Nanjing Overseas Students Science and Technology Innovation Project (R2022LZ05).

Institutional Review Board Statement

Not applicable.

Informed Consent Statement

Not applicable.

Data Availability Statement

The data presented in this study are available on request from the corresponding author.

Conflicts of Interest

The authors declare no conflict of interest.

References

  1. Liu, Y.; Yang, Y.; Li, L. Major Natural Disasters and Their Spatio-Temporal Variation in the History of China. J. Geogr. Sci. 2012, 22, 963–976. [Google Scholar] [CrossRef]
  2. Zhou, Y.; Li, N.; Wu, W.; Wu, J.; Gu, X.; Ji, Z. Exploring the Characteristics of Major Natural Disasters in China and Their Impacts during the Past Decades. Nat. Hazards 2013, 69, 829–843. [Google Scholar] [CrossRef]
  3. Coronese, M.; Lamperti, F.; Keller, K.; Chiaromonte, F.; Roventini, A. Evidence for Sharp Increase in the Economic Damages of Extreme Natural Disasters. PNAS 2019, 116, 21450–21455. [Google Scholar] [CrossRef] [PubMed]
  4. IPCC Global Warming of 1.5 °C: An IPCC Special Report on the Impacts of Global Warming of 1.5 C above Pre-Industrial Levels and Related Global Greenhouse Gas Emission Pathways. 2018. Available online: http://www.Ipcc.ch/Report/sr15 (accessed on 15 March 2023).
  5. Botzen, W.J.W.; Deschenes, O.; Sanders, M. The Economic Impacts of Natural Disasters: A Review of Models and Empirical Studies. Rev. Environ. Econ. Policy 2019, 13, 167–188. [Google Scholar] [CrossRef]
  6. Li, J.; Wang, X.; Xu, J.; Yuan, C. The Role of Public Pensions in Income Inequality among Elderly Households in China 1988–2013. China Econ. Rev. 2020, 61, 101422. [Google Scholar] [CrossRef]
  7. Nordhaus, W.D. The Economics of Hurricanes And Implications of Global Warming. Clim. Change Econ. 2010, 1, 1–20. [Google Scholar] [CrossRef]
  8. Shabnam, N. Natural Disasters and Economic Growth: A Review. Int. J. Disaster Risk Sci. 2014, 5, 157–163. [Google Scholar] [CrossRef]
  9. Klomp, J.; Valckx, K. Natural Disasters and Economic Growth: A Meta-Analysis. Glob. Environ. Change 2014, 26, 183–195. [Google Scholar] [CrossRef]
  10. Loayza, N.V.; Olaberría, E.; Rigolini, J.; Christiaensen, L. Natural Disasters and Growth: Going Beyond the Averages. World Dev. 2012, 40, 1317–1336. [Google Scholar] [CrossRef]
  11. Kotz, M.; Levermann, A.; Wenz, L. The Effect of Rainfall Changes on Economic Production. Nature 2022, 601, 223–227. [Google Scholar] [CrossRef]
  12. Xia, Y.; Li, Y.; Guan, D.; Tinoco, D.M.; Xia, J.; Yan, Z.; Yang, J.; Liu, Q.; Huo, H. Assessment of the Economic Impacts of Heat Waves: A Case Study of Nanjing, China. J. Clean. Prod. 2018, 171, 811–819. [Google Scholar] [CrossRef]
  13. Klomp, J. Economic Development and Natural Disasters: A Satellite Data Analysis. Glob. Environ. Change 2016, 36, 67–88. [Google Scholar] [CrossRef]
  14. Okiyama, M. Impact of the Great East Japan Earthquake on Production Loss Using an Inter-Regional Social Accounting Matrix. In Spatial Economic Modelling of Megathrust Earthquake in Japan; Tokunaga, S., Resosudarmo, B.P., Eds.; New Frontiers in Regional Science: Asian Perspectives; Springer Singapore: Singapore, 2017; Volume 11, pp. 65–94. ISBN 978-981-10-6492-0. [Google Scholar]
  15. Kahn, M.E. The Death Toll from Natural Disasters: The Role of Income, Geography, and Institutions. Rev. Econ. Stat. 2005, 87, 271–284. [Google Scholar] [CrossRef]
  16. Anbarci, N.; Escaleras, M.; Register, C.A. Earthquake Fatalities: The Interaction of Nature and Political Economy. J. Public. Econ. 2005, 89, 1907–1933. [Google Scholar] [CrossRef]
  17. Wu, J.; Han, G.; Zhou, H.; Li, N. Economic Development and Declining Vulnerability to Climate-Related Disasters in China. Environ. Res. Lett. 2018, 13, 034013. [Google Scholar] [CrossRef]
  18. Felbermayr, G.; Gröschl, J. Naturally Negative: The Growth Effects of Natural Disasters. J. Dev. Econ. 2014, 111, 92–106. [Google Scholar] [CrossRef]
  19. Noy, I. The Macroeconomic Consequences of Disasters. J. Dev. Econ. 2009, 88, 221–231. [Google Scholar] [CrossRef]
  20. Kellenberg, D.K.; Mobarak, A.M. Does Rising Income Increase or Decrease Damage Risk from Natural Disasters? J. Urban. Econ. 2008, 63, 788–802. [Google Scholar] [CrossRef]
  21. Tselios, V.; Tompkins, E.L. What Causes Nations to Recover from Disasters? An Inquiry into the Role of Wealth, Income Inequality, and Social Welfare Provisioning. Int. J. Disaster Risk Reduct. 2019, 33, 162–180. [Google Scholar] [CrossRef]
  22. Zhou, Y.; Li, N.; Wu, W.; Liu, H.; Wang, L.; Liu, G.; Wu, J. Socioeconomic Development and the Impact of Natural Disasters: Some Empirical Evidences from China. Nat. Hazards 2014, 74, 541–554. [Google Scholar] [CrossRef]
  23. Yamamura, E. The Impact of Natural Disasters on Income Inequality: Analysis Using Panel Data during the Period 1970 to 2004. Int. Econ. J. 2015, 29, 359–374. [Google Scholar] [CrossRef]
  24. Bui, A.T.; Dungey, M.; Nguyen, C.V.; Pham, T.P. The Impact of Natural Disasters on Household Income, Expenditure, Poverty and Inequality: Evidence from Vietnam. Appl. Econ. 2014, 46, 1751–1766. [Google Scholar] [CrossRef]
  25. Abdullah, A.N.M.; Zander, K.K.; Myers, B.; Stacey, N.; Garnett, S.T. A Short-Term Decrease in Household Income Inequality in the Sundarbans, Bangladesh, Following Cyclone Aila. Nat. Hazards 2016, 83, 1103–1123. [Google Scholar] [CrossRef]
  26. Keerthiratne, S.; Tol, R.S.J. Impact of Natural Disasters on Income Inequality in Sri Lanka. World Dev. 2018, 105, 217–230. [Google Scholar] [CrossRef]
  27. Pleninger, R. Impact of Natural Disasters on the Income Distribution. World Dev. 2022, 157, 105936. [Google Scholar] [CrossRef]
  28. Karim, A.; Noy, I. Poverty and Natural Disasters—A Qualitative Survey of the Empirical Literature. Singap. Econ. Rev. 2016, 61, 1640001. [Google Scholar] [CrossRef]
  29. Feng, S.; Lu, J.; Nolen, P.; Wang, L. The effect of the Wenchuan earthquake and government aid on rural households. In Earthquake Lessons from China: Coping and Rebuilding Strategies; Chen, K.Z., Zhang, Q., Hsu, C., Eds.; International Food Policy Research Institute (IFPRI): Washington, DC, USA, 2016; Chapter 2; pp. 11–34. [Google Scholar] [CrossRef]
  30. Wu, S.; Zhang, R.; Wang, C.; Feng, D. The Impact of Natural Disasters on Rural Household Wealth: Micro Evidence from China. Front. Environ. Sci. 2022, 10, 993722. [Google Scholar] [CrossRef]
  31. Zeng, G.; Yang, P. The Impact of Natural Disasters on Income Disparities between Households in China-A Study Based on CFPS (2014) Survey Data (In Chinese). Fujian Forum Humanit. Soc. Sci. Ed. 2018, 5. [Google Scholar]
  32. Kulanthaivelu, E. The Impact of Tropical Cyclones on Income Inequality in the U.S.: An Empirical Analysis. Ecol. Econ. 2023, 209, 107833. [Google Scholar] [CrossRef]
  33. Gassebner, M.; Keck, A.; Teh, R. Shaken, Not Stirred: The Impact of Disasters on International Trade. Rev. Int. Econ. 2010, 18, 351–368. [Google Scholar] [CrossRef]
  34. Klomp, J. Financial Fragility and Natural Disasters: An Empirical Analysis. J. Financ. Stab. 2014, 13, 180–192. [Google Scholar] [CrossRef]
  35. Hagenaars, A.J.M.; De Vos, K.; Asghar Zaidi, M. Poverty Statistics in the Late 1980s: Research Based on Micro-Data; Office for Official Publications of the European Communities: Luxembourg, 1994. [Google Scholar]
  36. Ye, T.; Liu, W.; Chen, S.; Chen, D.; Shi, P.; Wang, A.; Li, Y. Reducing Livestock Snow Disaster Risk in the Qinghai–Tibetan Plateau Due to Warming and Socioeconomic Development. Sci. Total. Environ. 2022, 813, 151869. [Google Scholar] [CrossRef] [PubMed]
  37. Theil, H. Economics and Information Theory; North-Holland Pub. Co.: Amsterdam, The Netherlands; Rand McNally: Chicago, IL, USA, 1967. [Google Scholar]
  38. Cappelli, F.; Costantini, V.; Consoli, D. The Trap of Climate Change-Induced “Natural” Disasters and Inequality. Glob. Environ. Change 2021, 70, 102329. [Google Scholar] [CrossRef]
  39. Arellano, M.; Bover, O. Another Look at the Instrumental Variable Estimation of Error-Components Models. J. Econom. 1995, 68, 29–51. [Google Scholar] [CrossRef]
  40. Blundell, R.; Bond, S. Initial Conditions and Moment Restrictions in Dynamic Panel Data Models. J. Econom. 1998, 87, 115–143. [Google Scholar] [CrossRef]
  41. McDermott, T.K.J.; Barry, F.; Tol, R.S.J. Disasters and Development: Natural Disasters, Credit Constraints, and Economic Growth. Oxf. Econ. Pap. 2014, 66, 750–773. [Google Scholar] [CrossRef]
  42. Bullard, R.D. Differential Vulnerabilities: Environmental and Economic Inequality and Government Response to Unnatural Disasters. Soc. Res. 2008, 75, 753–784. [Google Scholar] [CrossRef]
  43. Peek, L.; Wachtendorf, T.; Meyer, M.A. Sociology of Disasters. In Handbook of Environmental Sociology; Schaefer Caniglia, B., Jorgenson, A., Malin, S.A., Peek, L., Pellow, D.N., Huang, X., Eds.; Handbooks of Sociology and Social Research; Springer Nature Switzerland AG: Cham, Switzerland, 2021; pp. 219–241. ISBN 978-3-030-77711-1. [Google Scholar]
  44. Skoufias, E. Economic Crises and Natural Disasters: Coping Strategies and Policy Implications. World Dev. 2003, 31, 1087–1102. [Google Scholar] [CrossRef]
Figure 1. Variation of income and expenditure measured by the Gini coefficient over time.
Sustainability 15 13813 g001aSustainability 15 13813 g001b
Table 1. Summary statistics (N = 78).
VariableMeanStd. Dev.MinMax
Gini_income0.3760.0610.2050.490
Gini_expenditure0.3690.0510.2110.452
Dist (% of Pop Affected)23.45916.926074.952
Dist_lag124.82715.898082.291
Dist_lag229.07117.530065.583
Dist_lag325.72515.8880100
Dist_lag429.30118.774085.781
Avg_Income12,513.4598749.688693.16942,775.363
Avg_HH3.6710.5122.7225.656
Table 2. Correlation matrix of all control variables.
VariablesDistDist
_Lag1
Dist
_Lag2
Dist
_Lag3
Dist
_Lag4
Ln(Avg_
Income)
Avg_HHVIFTolerance
Dist1.000 2.5680.389
Dist_lag10.4341.000 2.3570.424
Dist_lag20.4980.5651.000 2.6680.372
Dist_lag30.4420.4390.5031.000 2.6160.382
Dist_lag40.3130.4240.4290.4231.000 2.1420.467
Ln(Avg_income)−0.311−0.399−0.337−0.335−0.2241.000 1.8170.550
Avg_HH0.2340.0630.1130.170−0.024−0.4591.0001.8020.555
Note: The VIF value should be less than 4, and the tolerance value should be more than 0.2 so that there is no multicollinearity.
Table 3. Effects on income inequality, by income component.
Dependent Variable: Income Inequality (Gini)
(1)(2)(3)(4)(5)
Total incomeEmployment incomeOperating incomeProperty incomeTransfer income
Disaster0.144 ***
(0.037)
0.0468
(0.132)
0.112 ***
(0.037)
0.122
(0.099)
−0.107 *
(0.058)
Disaster_lag1−0.002
(0.039)
−0.150
(0.137)
−0.207
(0.194)
0.079
(0.073)
0.249
(0.173)
Disaster_lag2−0.009
(0.038)
−0.084
(0.135)
0.035
(0.091)
0.019
(0.068)
0.031
(0.068)
Disaster_lag3−0.091
(0.062)
0.099
(0.151)
−0.189
(0.103)
−0.054
(0.075)
−0.065
(0.076)
Disaster_lag40.034
(0.033)
0.065
(0.119)
−0.066
(0.082)
0.078
(0.063)
0.036
(0.059)
Ln(Avg_income)0.080 ***
(0.007)
0.004
(0.024)
−0.015
(0.015)
0.011
(0.059)
0.038 ***
(0.008)
Avg_HH0.120 **
(0.049)
0.038
(0.076)
0.052 **
(0.021)
0.017
(0.026)
0.016
(0.032)
Observations7878787878
R-squared0.7570.6500.5470.4510.487
Note: The Table shows the effects of natural disasters on different household incomes. The effects are estimated using fixed effects regression with standard error clusters at the province level. Robust standard errors are in parentheses. *** p < 0.01, ** p < 0.05, * p < 0.1.
Table 4. Impact of natural disasters on household income by quintile.
Dependent Variable: Household Income (Logged)
(1)
Q1
(2)
Q2
(3)
Q3
(4)
Q4
(5)
Q5
Disaster−1.008 ***
(0.328)
−0.708 *
(0.390)
−0.569
(0.367)
−0.389
(0.348)
−0.069
(0.339)
Disaster_lag11.140
(0.893)
0.822
(0.528)
0.749
(0.503)
0.792
(0.463)
0.904
(0.571)
Disaster_lag20.441
(0.468)
0.190
(0.406)
0.159
(0.382)
0.185
(0.363)
0.183
(0.352)
Disaster_lag3−0.160
(0.522)
−0.469
(0.453)
−0.505
(0.426)
−0.547
(0.404)
−0.758
(0.493)
Disaster_lag4−0.485
(0.415)
−0.367
(0.360)
−0.413
(0.339)
−0.450
(0.322)
−0.406
(0.313)
Observations7878787878
R-squared0.5250.5430.5120.5600.526
Note: Q1–Q5 represents the income quintiles. Robust standard errors are in parentheses. *** p < 0.01, ** p < 0.05, * p < 0.1.
Table 5. Effects on expenditure inequality.
Dependent Variable: Expenditure Inequality (Gini)
Disaster−0.035
(0.038)
Disaster_lag10.143 ***
(0.040)
Disaster_lag20.045
(0.038)
Disaster_lag3−0.065
(0.043)
Disaster_lag4−0.039
(0.034)
Ln(Avg_Income)0.048 *
(0.026)
Avg_HH0.015
(0.024)
Observations78
R-squared0.662
Note: Models include a constant term, province- and time-fixed effects. Errors clustered at the province level. Robust standard errors are in parentheses. *** p < 0.01, ** p < 0.05, * p < 0.1.
Table 6. Impact of natural disasters on income and expenditure inequality measured by Theil index and IQR.
Dependent Variable: Income InequalityDependent Variable: Expenditure Inequality
(1)
Theil
(2)
Ln(IQR)
(3)
Theil
(4)
Ln(IQR)
Disaster0.231 ***
(0.063)
0.294 ***
(0.073)
−0.066
(0.063)
−0.809
(0.551)
Disaster_lag10.087
(0.176)
0.003
(0.151)
0.204 ***
(0.071)
1.161 ***
(0.350)
Disaster_lag20.011
(0.066)
0.113
(0.131)
0.043
(0.061)
0.041
(0.302)
Disaster_lag3−0.183
(0.173)
−0.139
(0.144)
−0.091
(0.068)
−0.075
(0.334)
Disaster_lag40.051
(0.059)
−0.088
(0.118)
0.016
(0.055)
0.238
(0.274)
Ln(Avg_Income)0.097 ***
(0.022)
1.142 ***
(0.110)
0.053 ***
(0.013)
1.239 ***
(0.256)
Avg_HH0.133 *
(0.076)
0.233 *
(0.128)
0.026
(0.037)
0.149
(0.182)
Observations78787878
R-squared0.6240.8050.5330.810
Note: Theil indicates the inequality measurement of the Theil index. Ln(IQR) is the natural logarithm of the interquartile range. Robust standard errors are in parentheses. *** p < 0.01, ** p < 0.05, * p < 0.1.
Table 7. Results for alternative estimators: OLS and System GMM.
Dependent Variable: Income Inequality (Gini)Dependent Variable: Expenditure Inequality (Gini)
(1)
OLS
(2)
OLS_Reg
(3)
Sys GMM
(4)
Sys GMM_Reg
(5)
OLS
(6)
OLS_Reg
(7)
Sys GMM
(8)
Sys GMM_Reg
Disaster0.119 ***
(0.045)
0.143 ***
(0.042)
0.139 ***
(0.051)
0.102 ***
(0.037)
−0.045
(0.039)
−0.035
(0.038)
0.021
(0.057)
0.028
(0.044)
Disaster_lag10.005
(0.045)
−0.003
(0.045)
−0.035
(0.042)
−0.031
(0.046)
0.159 ***
(0.039)
0.143 ***
(0.041)
0.162 ***
(0.033)
0.155 ***
(0.041)
Ln(Avg_income)0.062 ***
(0.014)
0.074 ***
(0.007)
0.085 ***
(0.032)
0.084 ***
(0.021)
0.048 ***
(0.014)
0.050 ***
(0.007)
0.048
(0.057)
0.032
(0.056)
Avg_HH0.093 ***
(0.013)
0.117 ***
(0.014)
0.099 ***
(0.021)
0.092 ***
(0.032)
0.041 ***
(0.011)
0.040 ***
(0.012)
0.103 ***
(0.034)
0.116 ***
(0.024)
North −0.006
(0.018)
−0.011
(0.043)
−0.039
(0.027)
−0.028
(0.033)
Northeast 0.043 **
(0.019)
0.024 **
(0.012)
0.022
(0.018)
0.017
(0.023)
Northwest 0.016
(0.017)
0.018
(0.042)
0.018
(0.015)
0.026
(0.043)
Southcentral −0.036 **
(0.013)
−0.045 **
(0.022)
−0.004
(0.012)
−0.011
(0.017)
Southwest −0.006
(0.015)
0.009
(0.025)
0.003
(0.014)
0.002
(0.018)
Observations7878727278787272
R-squared0.5850.682 0.5750.627
Arellano–Bond Test AR(1) 0.0120.014 0.0690.071
Arellano–Bond Test AR(2) 0.0320.033 0.8730.889
Hansen Test 0.2130.262 0.3510.354
Note: Errors clustered at the province level. Robust standard errors are in parentheses. *** p < 0.01, ** p < 0.05, * p < 0.1.
Table 8. Division of six administrative regions in China.
RegionProvince
NortheastHeilong jiang, Liaoning
NorthBeijing, Inner Mongolia, Tianjin,
NorthwestShanxi, Gansu
EastAnhui, Jiangsu, Shandong, Shanghai, Zhejiang
South CentralGuangdong, Henan, Hubei, Hunan
SouthwestChongqing, Guizhou, Sichuan, Yunnan,
Table 9. Regression results with a balanced panel dataset.
Dependent Variable: Income Inequality (Gini)Dependent Variable: Expenditure Inequality (Gini)
Disaster0.153 ***
(0.042)
−0.046
(0.040)
Disaster_lag1−0.038
(0.045)
0.161 ***
(0.043)
Disaster_lag20.013
(0.040)
0.074
(0.048)
Disaster_lag3−0.115
(0.065)
−0.105
(0.059)
Disaster_lag40.037
(0.034)
−0.056
(0.036)
Ln(Avg_Income)0.075 ***
(0.008)
0.048 ***
(0.007)
Avg_HH0.103 ***
(0.035)
0.007
(0.025)
Observations5454
R-squared0.7750.739
Note: Models include aconstant term, province-and time-fixed effects. Errors clustered at the province level. Robust standard errors are in parentheses. *** p < 0.01, ** p < 0.05, * p < 0.1.
Disclaimer/Publisher’s Note: The statements, opinions and data contained in all publications are solely those of the individual author(s) and contributor(s) and not of MDPI and/or the editor(s). MDPI and/or the editor(s) disclaim responsibility for any injury to people or property resulting from any ideas, methods, instructions or products referred to in the content.

