Article

Study on Urban Spatial Expansion and Its Scale Benefit in the Yellow River Basin

1
College of Geographic Science, Shanxi Normal University, Taiyuan 030031, China
2
Institute of Human Geography, Shanxi Normal University, Taiyuan 030031, China
3
Institute of Ecology and Environment of Yellow River Basin, Taiyuan 030031, China
*
Author to whom correspondence should be addressed.
Sustainability 2023, 15(18), 13747; https://doi.org/10.3390/su151813747
Submission received: 20 June 2023 / Revised: 18 August 2023 / Accepted: 13 September 2023 / Published: 14 September 2023
(This article belongs to the Special Issue Urban Social Space and Sustainable Development)

Abstract

:
Based on nighttime light data from 2000, 2005, 2010, 2015 and 2020, the urban built-up area of 90 prefecture-level cities in the Yellow River Basin was extracted, and the urban spatial expansion characteristics of 90 prefecture-level cities were explored from the two elements of expansion speed and expansion intensity. The entropy method was used to calculate the comprehensive level of economic-, social- and ecological-scale benefits of 90 prefecture-level cities. The gray correlation degree was used to measure the correlation between urban spatial expansion and scale benefits, and the geographical detector was used to identify the driving factors of urban spatial expansion. The results show the following: (1) The urban spatial expansion characteristics of 90 prefecture-level cities in the Yellow River Basin are clearly different. From 2000 to 2020, the urban spatial area increased to 2.94 times the original, and the expansion speed and intensity increased but fluctuated significantly. (2) The comprehensive level of economic-, social- and ecological-scale benefits of 90 prefecture-level cities in the Yellow River Basin has gradually improved. (3) There is a high correlation between urban spatial expansion and economic-, social- and ecological-scale benefits in 90 prefecture-level cities in the Yellow River Basin, but there are obvious regional differences in the eastern, central and western prefecture-level cities. (4) The urban spatial expansion of the Yellow River Basin is the result of the joint action of natural factors, the economic development level, industrial structure, government regulation ability, population size and opening level. Among them, per capita GDP, population density and the proportion of secondary and tertiary industry output value to the total output value are the most important driving factors.

1. Introduction

Cities are the main bodies of modern development. Urban spatial expansion is an inevitable outcome of the process of social and economic development. It is the embodiment of the integrated development level of the country and the region [1]. Since the beginning of the 21st century, China’s urbanization process has accelerated, leading to rapid growth in urban economy and population. As a result, urban areas have been continuously expanding outward [2]. This expansion consumes a significant amount of limited urban land. Inevitably, the rate of urban spatial expansion has failed to keep up with the improvement of urban-scale efficiency. This trend has had a negative impact on the sustainable development of the cities. Coordinating the relationship between urban spatial expansion and urban-scale efficiency has become a key issue that affects the high-quality development of Chinese cities.
With the introduction of sustainable theory, foreign scholars have recognized the dynamic nature of urban development from different perspectives. They regard urban development as an open, dynamic and complex system [3] that influences the urban spatial form [4], model [5] and various other elements. However, quantitatively revealing the characteristics of urban spatial evolution remains challenging. With the continuous development of space remote sensing technology, the use of remote sensing observation images to monitor and quantify the evolution of urban spatial structure has become a hot topic in the research [6,7,8]. The research results of urban spatial expansion in China are fairly abundant, mainly focusing on the structure of urban spatial expansion [9], spatial and temporal patterns [10,11,12], the optimization and control of urban spatial expansion quality [13], urban spatial expansion mechanisms [14,15] and urban growth boundary research [16]. Urban scale studies are not limited to the scale of urban land use, but also consider population size, economic scale and urban comprehensive scale, as well as measuring and studying the benefits of the urban scale in multiple dimensions, such as cost-effectiveness, agglomeration economy, urban benefits and even the ecological environment [17,18]. The spatial and temporal heterogeneity of urban space and scale efficiency is significant. Most previous studies have focused on the moderate scale in a specific time dimension, or have merely connected urban space with economic-scale efficiency, and have not paid sufficient attention to the long-term urban space change and comprehensive benefit coordination relationship [19,20].
In 2019, General Secretary Xi Jinping obviously proposed to incorporate the ecological protection and high-quality development of the Yellow River Basin into the national major strategy, aiming to achieve high-level protection and high-quality development of the Yellow River Basin [21]. The key to promoting the implementation of the strategy lies in the coordinated development of urban spatial expansion and scale benefits in the Yellow River Basin. Thanks to their distinct geographical advantages and national policy support, Beijing–Tianjin–Hebei, the Yangtze River Delta and the Pearl River Delta have evolved into China’s three most competitive regions and have emerged as the driving force behind the country’s economic growth. Therefore, it has also become a hot area of academic research, but less attention has been paid to the Yellow River Basin.
This paper started from the perspective of the coordination relationship between urban spatial expansion and scale benefits. By processing and comparing DMSP/OLS (Defense Meteorological Satellite Program/Operational Linescan System) and NPP/VIIRS (Suomi National Polar-Orbiting Partnership/Visible Infrared Imaging Radiometer Suite) data from 2000 to 2020, two measurement elements of expansion speed and expansion intensity were introduced. The urban scale benefit of 90 prefecture-level cities in the Yellow River Basin were analyzed by combining GIS and mathematical analysis, and the gray correlation model was introduced to study the relationship between the two systems. The geographical detector model was established from six dimensions: natural factors, economic development level, industrial structure, government regulation ability, population size and opening level. This study aimed to achieve the following objectives: (1) to comprehend the spatial and temporal evolution characteristics of the spatial expansion of prefecture-level cities in the Yellow River Basin from 2000 to 2020; (2) to measure the development trends of economic, social and ecological benefit resulting from urban scale in prefecture-level cities in the Yellow River Basin, and to reveal the characteristics and correlation between urban spatial expansion and scale benefits; (3) and to identify the dominant factors driving urban spatial expansion in the Yellow River Basin. This study aims to enhance the understanding of the spatial and temporal evolution characteristics of urban spatial expansion and scale efficiency of prefecture-level cities in the Yellow River Basin, better facilitate the coordinated development between the two systems and provide an important theoretical basis for urban space development and scale efficiency development in the Yellow River Basin and the formulation of relevant policies.

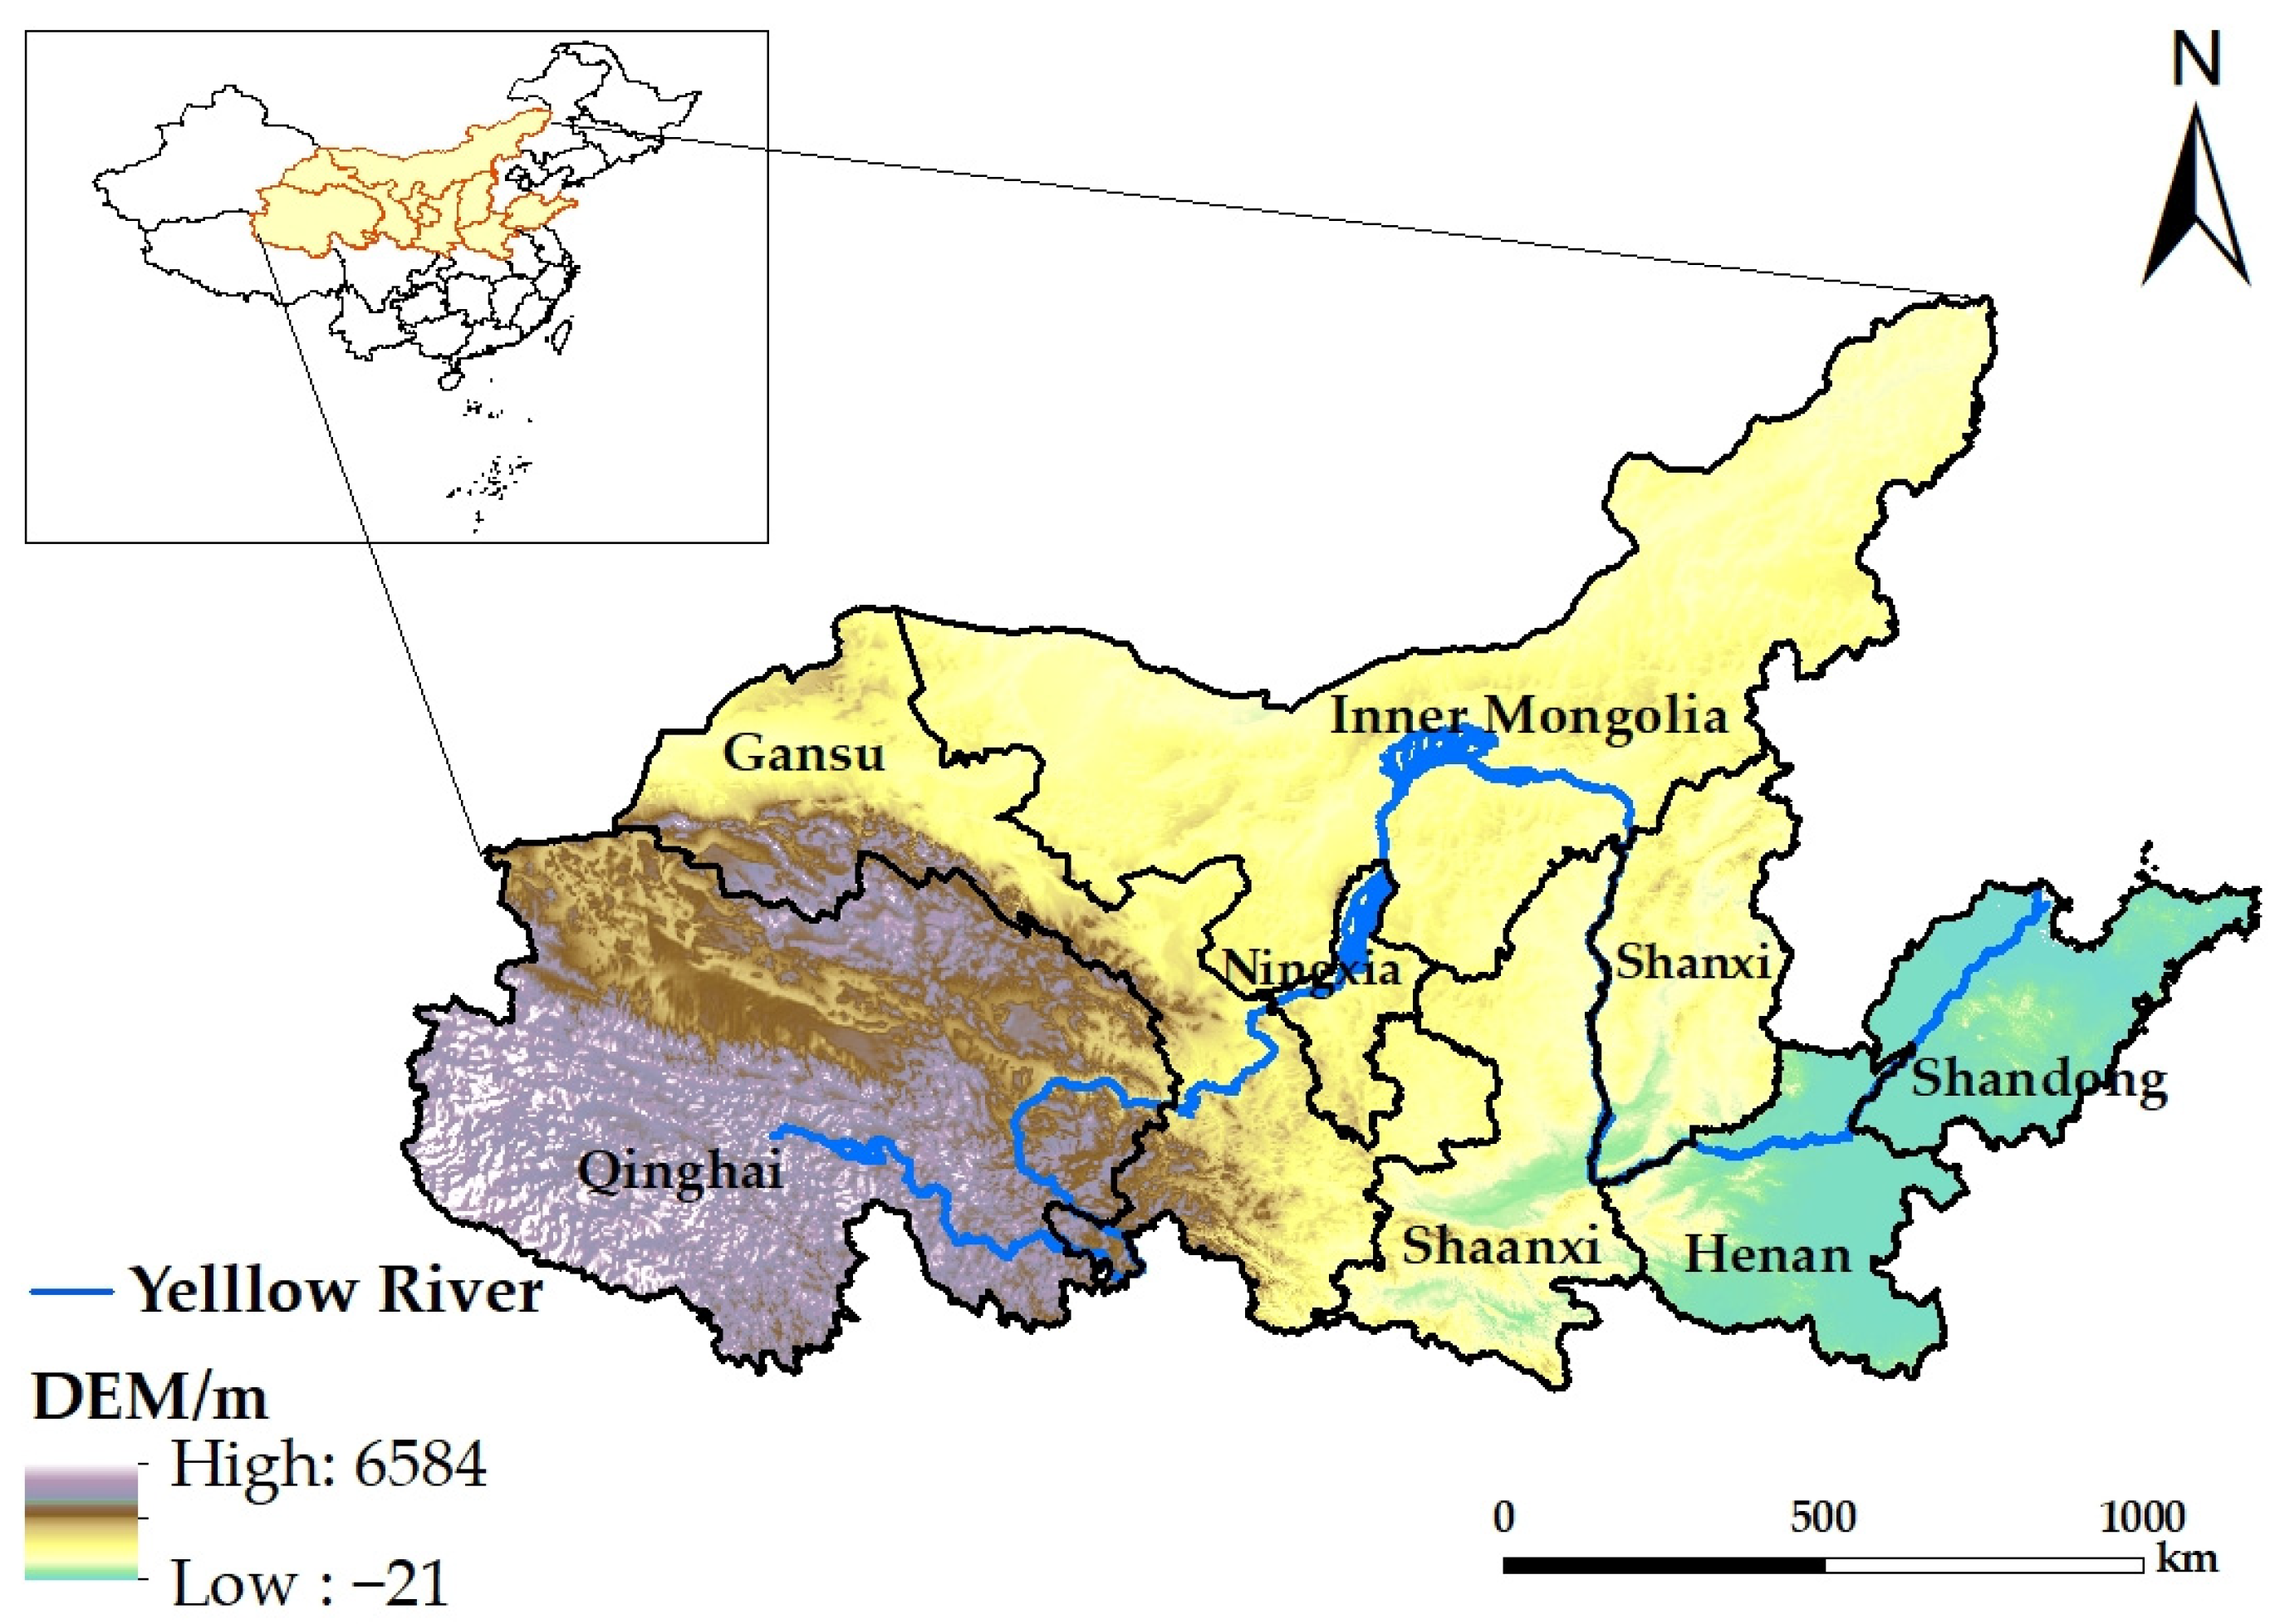
2. Overview of the Study Area

The Yellow River, with a total length of 5464 km, is situated between 32°6′53″ N–42°48′18″ N, 95°50′29″ E–119°06′53″ E. It flows through the nine provinces, Qinghai, Sichuan, Gansu, Ningxia, Inner Mongolia, Shaanxi, Shanxi, Henan and Shandong [22]. The Yellow River Basin is vast and abundant in resources. Since the reform and opening up, the economy of the Yellow River Basin has achieved remarkable achievements. From 1978 to 2020, the economic aggregate of the Yellow River Basin increased by more than 56 times. As of 2020, the total global GDP of the Yellow River Basin is CNY 25.39 trillion, accounting for 25 percent of the total national population, with a population of 113.6823 million people, accounting for 8.6 percent of the total population. The effects of ecological environment quality protection and restoration are clearly visible. In recent years, the high-quality economic development level of the Yellow River Basin has been continuously improved, the protection of the ecological environment has been gradually strengthened, and the status of the Yellow River Basin has gradually become prominent [23], but there is still a clear imbalance in development within the basin.
Based on the prefecture-level administrative boundary and the direct correlation between regional economic development and the Yellow River [24], because Sichuan belongs to the Yangtze River Basin, the four leagues in Inner Mongolia (Chifeng City, Tongliao City, Hulun Buir City and Xing’an League) are broadly classified as Northeast China. Therefore, they are not studied in this paper. Based on the division of administrative regions, prefecture-level cities included in Qinghai, Gansu and Ningxia were divided into the upper reaches of the Yellow River Basin; the prefecture-level cities included in Inner Mongolia, Shanxi and Shaanxi were divided into the middle reaches of the Yellow River Basin; and the prefecture-level cities included in Henan and Shandong were divided into the lower reaches of the Yellow River Basin [25] (Figure 1). Therefore, this paper considered 90 prefecture-level cities (states and leagues) in the Yellow River Basin as the research object.

3. Data Sources and Research Methods

3.1. Data Sources and Processing

In this paper, the years 2000, 2005, 2010, 2015 and 2020 were selected as the time section. In 2000, the western development was formally implemented, and then the overall strategy of regional development was formed with the revitalization of the northeast, the rise of the central region and the first development of the eastern region [26]. Therefore, taking 2000 as the starting time of this research can ensure the continuity of major policy implementation as much as possible.
This study used image data from DMSP/OLS and NPP/VIIRS nighttime light data. The DMSP/OLS data includes image data obtained by DMSP satellite F15 (2000–2007), F16 (2004–2009) and F18 (2010–2013) in 2000, 2005 and 2010. The pixel gray value range is 0–63, and the image resolution is 1 km. The NPP/VIIRS data includes 2015 and 2020, with a resolution of about 500 m. These image data were obtained from the National Geographic Information Center website (https://ngdc.noaa.gov/eog (accessed on 10 March 2022)). The original data were preprocessed using the ArcGis10.8 platform. The threshold for the spatial extent of the city was determined by combining the statistical data of urban built-up area through the projection grid, integer, rotation surface, fusion [27], the best threshold method and others. Then, the urban built-up areas of each prefecture-level city were extracted for the five research periods. The original data were projected in ArcGIS10.8 with Asia_Lambert_Conformal_Conic uniform projection coordinate. After resampling, the unified resolution was 500 m.
The social and economic data were collected from the statistical yearbooks of each province and prefecture-level cities in the study area. Among them, there was a small amount of missing data in some prefecture-level cities. Based on the data of adjacent years, the interpolation method was used to supplement the missing data.

3.2. Research Method

3.2.1. Entropy Method

Following the principles of scientificity, pertinence, hierarchy and operability of the established indicators, and drawing on relevant research results [28,29,30], a comprehensive index system for the scale benefit level of the Yellow River Basin was constructed from the three dimensions of economy, society and ecology. The weight of each index was calculated using the entropy method (Table 1). Among them, the economic-scale benefits included the economic aggregate, people’s lives, industrial structure and scientific and technological development level; the social-scale benefits included education and culture, health, road traffic and urban infrastructure level; and the ecological-scale benefits included the greening environment and environmental protection ability level.
First, the original data were standardized, and then the entropy value, difference coefficient and weight of each index were calculated, respectively. Finally, the comprehensive score was calculated. The specific calculation formula was as follows [31,32]:
S i = j 1 m W i j × f i j
In the formula, Ej represents the information entropy of the jth index, Dj represents the difference coefficient of the jth index, Wij represents the weight of the jth index and Si represents the comprehensive score of each sample. The larger the S value, the higher the comprehensive score, and the more favorable the evaluation result.

3.2.2. Urban Spatial Expansion Index

As an important manifestation in the process of urbanization, urban spatial expansion is reflected in the amount of growth and spatial change of urban built-up areas. This paper introduced two indicators of expansion speed and expansion intensity to compare the number and spatial variation characteristics of urban built-up areas in 90 prefecture-level cities in the Yellow River Basin from 2000 to 2005, from 2005 to 2010, from 2010 to 2015 and from 2015 to 2020. The specific calculation formulas of urban spatial expansion speed and intensity index were as follows [33]:
V = A i + n A i / n
S = A i + n A i / n / A i × 100 %
In the formula, V is the speed of urban spatial expansion; S is the intensity of urban spatial expansion; Ai+n and Ai are the urban space built-up area at the beginning and end of the study period, respectively; and n is the research period (this paper used 5 years as a unit).

3.2.3. Gray Relational Analysis

In order to better enhance the benign promotion of the two systems and improve the development status between the two, the gray correlation degree was used to analyze the degree of correlation between urban spatial expansion and economies of scale. The core idea is to establish a time-varying feature sequence according to certain rules. The evaluation objects that change over time are used as comparison sequences, the correlation between each sub-sequence and the parent sequence is obtained and the conclusion is drawn according to the correlation size [34,35]. In this paper, urban spatial expansion and urban economic, social and ecological benefits were set as the characteristic sequence and comparative sequence, respectively.
U δ i k = min min X o k X i k + ρ × max max X o k X i k X o k X i k + ρ × max max X o k X i k
γ o i = 1 n i = 1 n δ o i t , i = 1 , 2 , , m
In the formula, U δ i ( k ) denotes the gray correlation coefficient and Xo represents the characteristic sequence, Xi represents the ratio sequence, and this paper used 0.5 as the calculation formula. (max max|(k) − (k)|) represents the ‘maximum value’, and (min min |(k) − (k)|) represents the ‘minimum value’. The resolution coefficient was generally considered to be 0.50. The closer the calculation result is to 1, the better the correlation between the two systems, and the worse the correlation between the two systems.

3.2.4. Geographical Detector

The geographical detector is a model for detecting the influence of independent variables on the spatial differentiation of geographical phenomena [36]. The basic principle is that if the independent variable has a strong influence on the dependent variable, then there will be some similarity in its spatial distribution. This paper used the factor detection in the geographical detector to quantitatively study the influence of data from 2000, 2005, 2010, 2015 and 2020 on the urban spatial expansion of 90 prefecture-level cities in the Yellow River Basin. Then, this paper analyzed the driving force of each influencing factor on the urban spatial expansion of prefecture-level cities in the Yellow River Basin in each research period. The calculation formula of factor detection was as follows:
q = 1 - 1 n σ 2 k L n k σ k 2 , ( k = 1 , 2 , , L )
In the formula, q is the explanatory degree of each driving factor to urban expansion; n and σ 2 , respectively, represent the total sample size and variance; and n k   σ k , respectively, denote the sample size and sample variance of the kth. The closer the value of q is to 1, the greater the impact of this factor on urban spatial expansion, and vice versa.
The selection of impact factor indicators for urban spatial expansion was affected by natural [37], socioeconomic and policy factors. In view of the difficulty in quantifying the data of regional policy system, referring to the existing research, combined with the actual situation of urban spatial expansion, the influencing factors of spatial and temporal differences in urban spatial expansion of prefecture-level cities in the Yellow River Basin were selected from six dimensions: natural factors [38], economic development level, industrial structure, government regulation ability, population size and openness level.
Natural elements have become the “natural constraints” that affect the development of urban spatial form, which are important factors for urban construction and residents’ site selection. Therefore, elevation (X1) and slope (X2) were used to characterize the natural conditions. The improvement of the overall level of economic development continues to promote the expansion of urban and rural construction land. People’s increasing demand for social services and the urgent requirements of the living environment have correspondingly stimulated the large-scale development of the secondary and tertiary industries and increased investment in fixed assets. When the economy develops to a certain stage, it seeks to use foreign capital to achieve a higher level of development. Therefore, per capita GDP (X3) represents the level of economic development [39]; the proportion of output value of secondary and tertiary industries to total output value (X4) characterizes the industrial structure [40]; fixed asset investment (X5) represents the ability of government regulation [41]; and the total actual utilization of foreign capital (X6) represents the level of openness [42]. Urban spatial expansion is accompanied by the acceleration of population mobility, and when the demand for urban space is also increasing. Therefore, population density (X7) represents the population size [40].

4. Results and Analysis

4.1. Spatiotemporal Evolution and Index Analysis of Urban Spatial Expansion in the Yellow River Basin

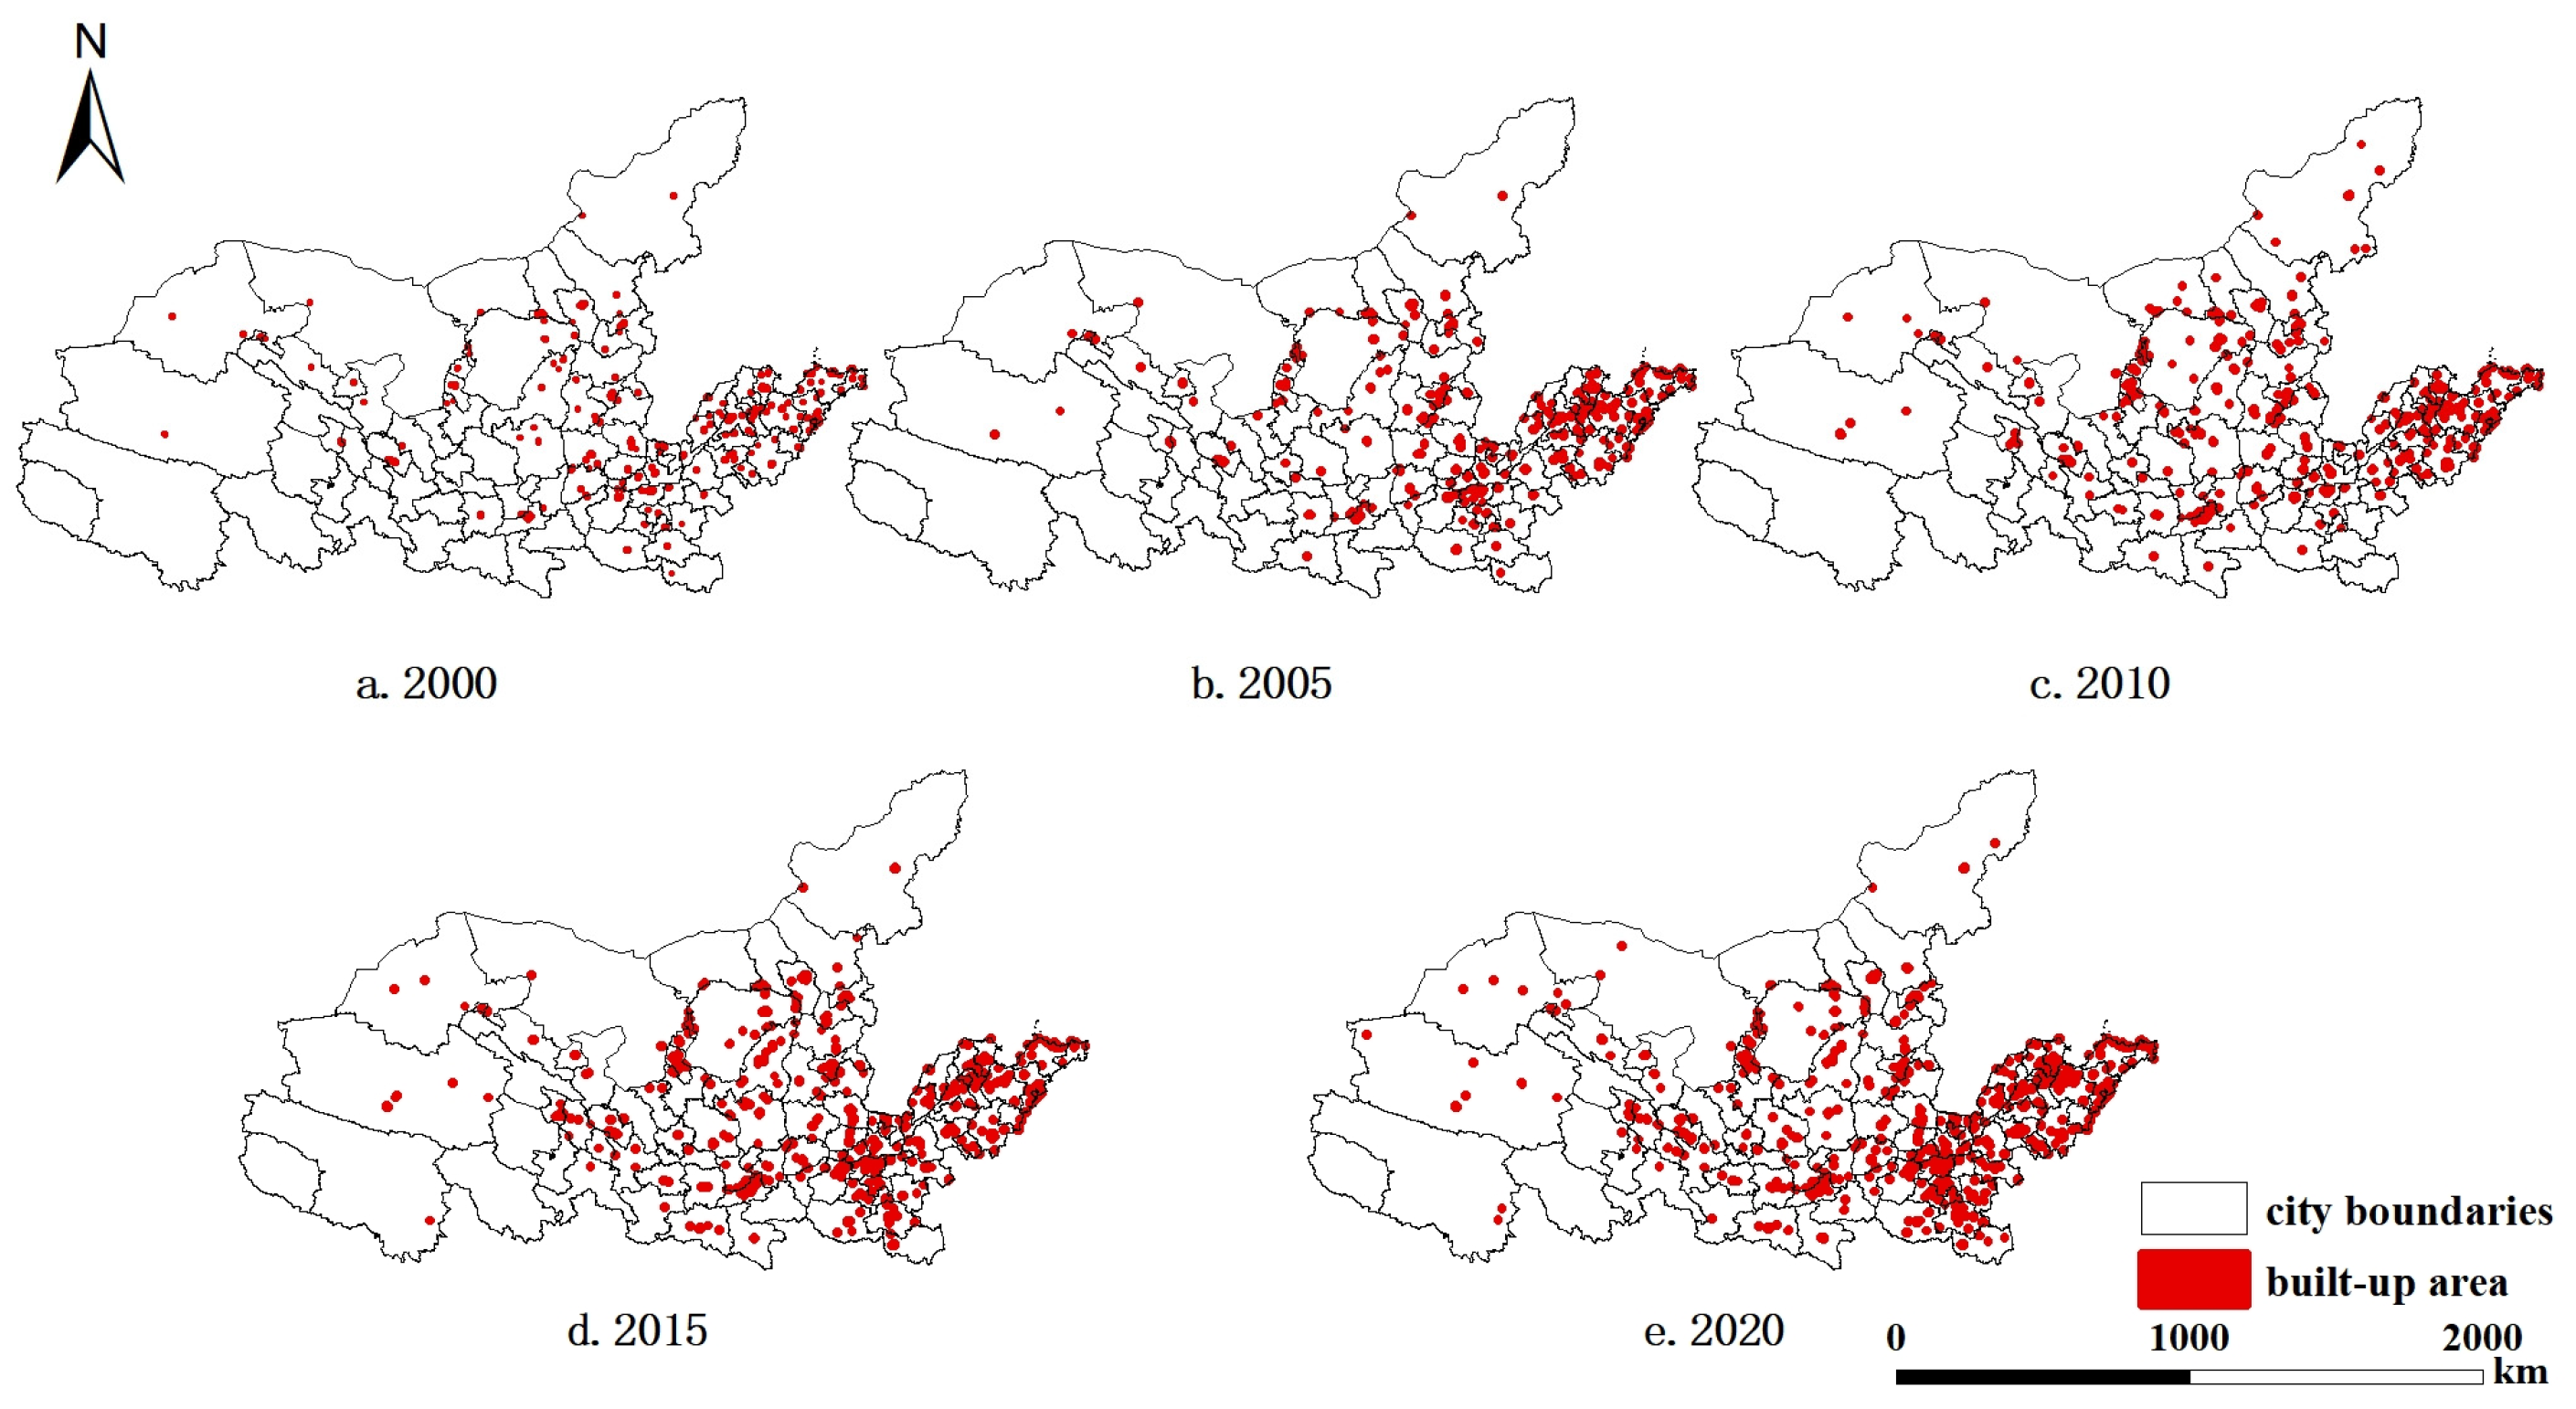
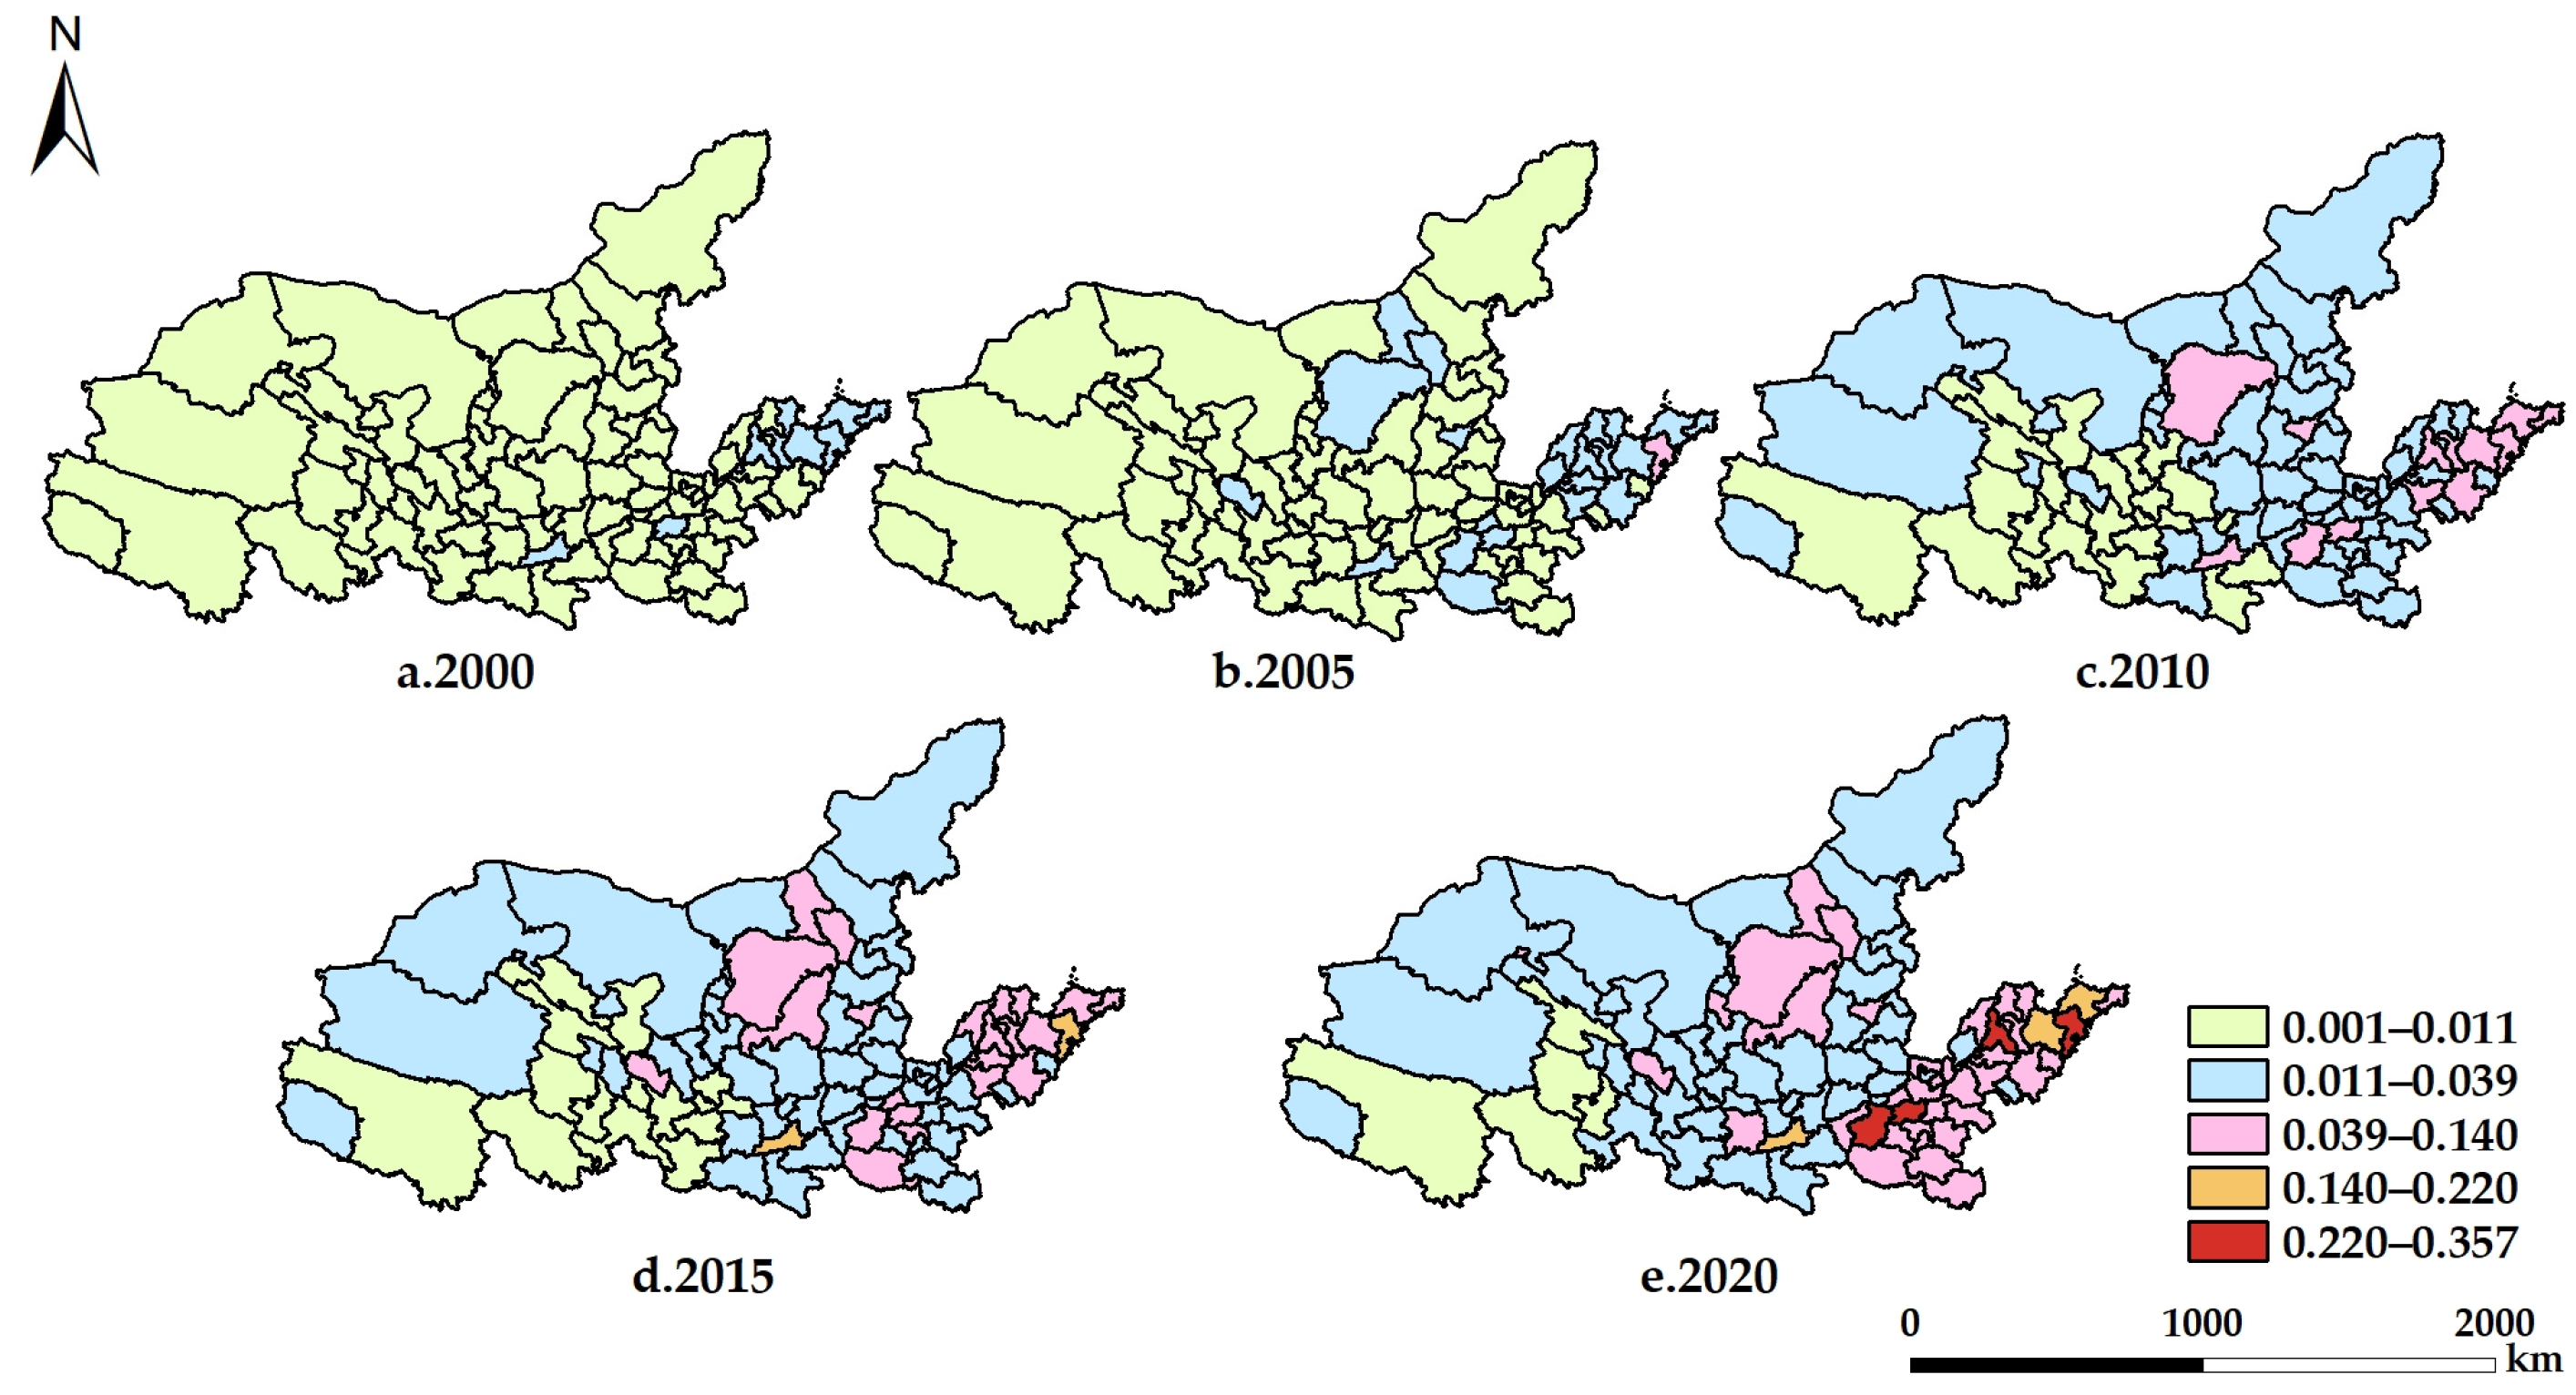
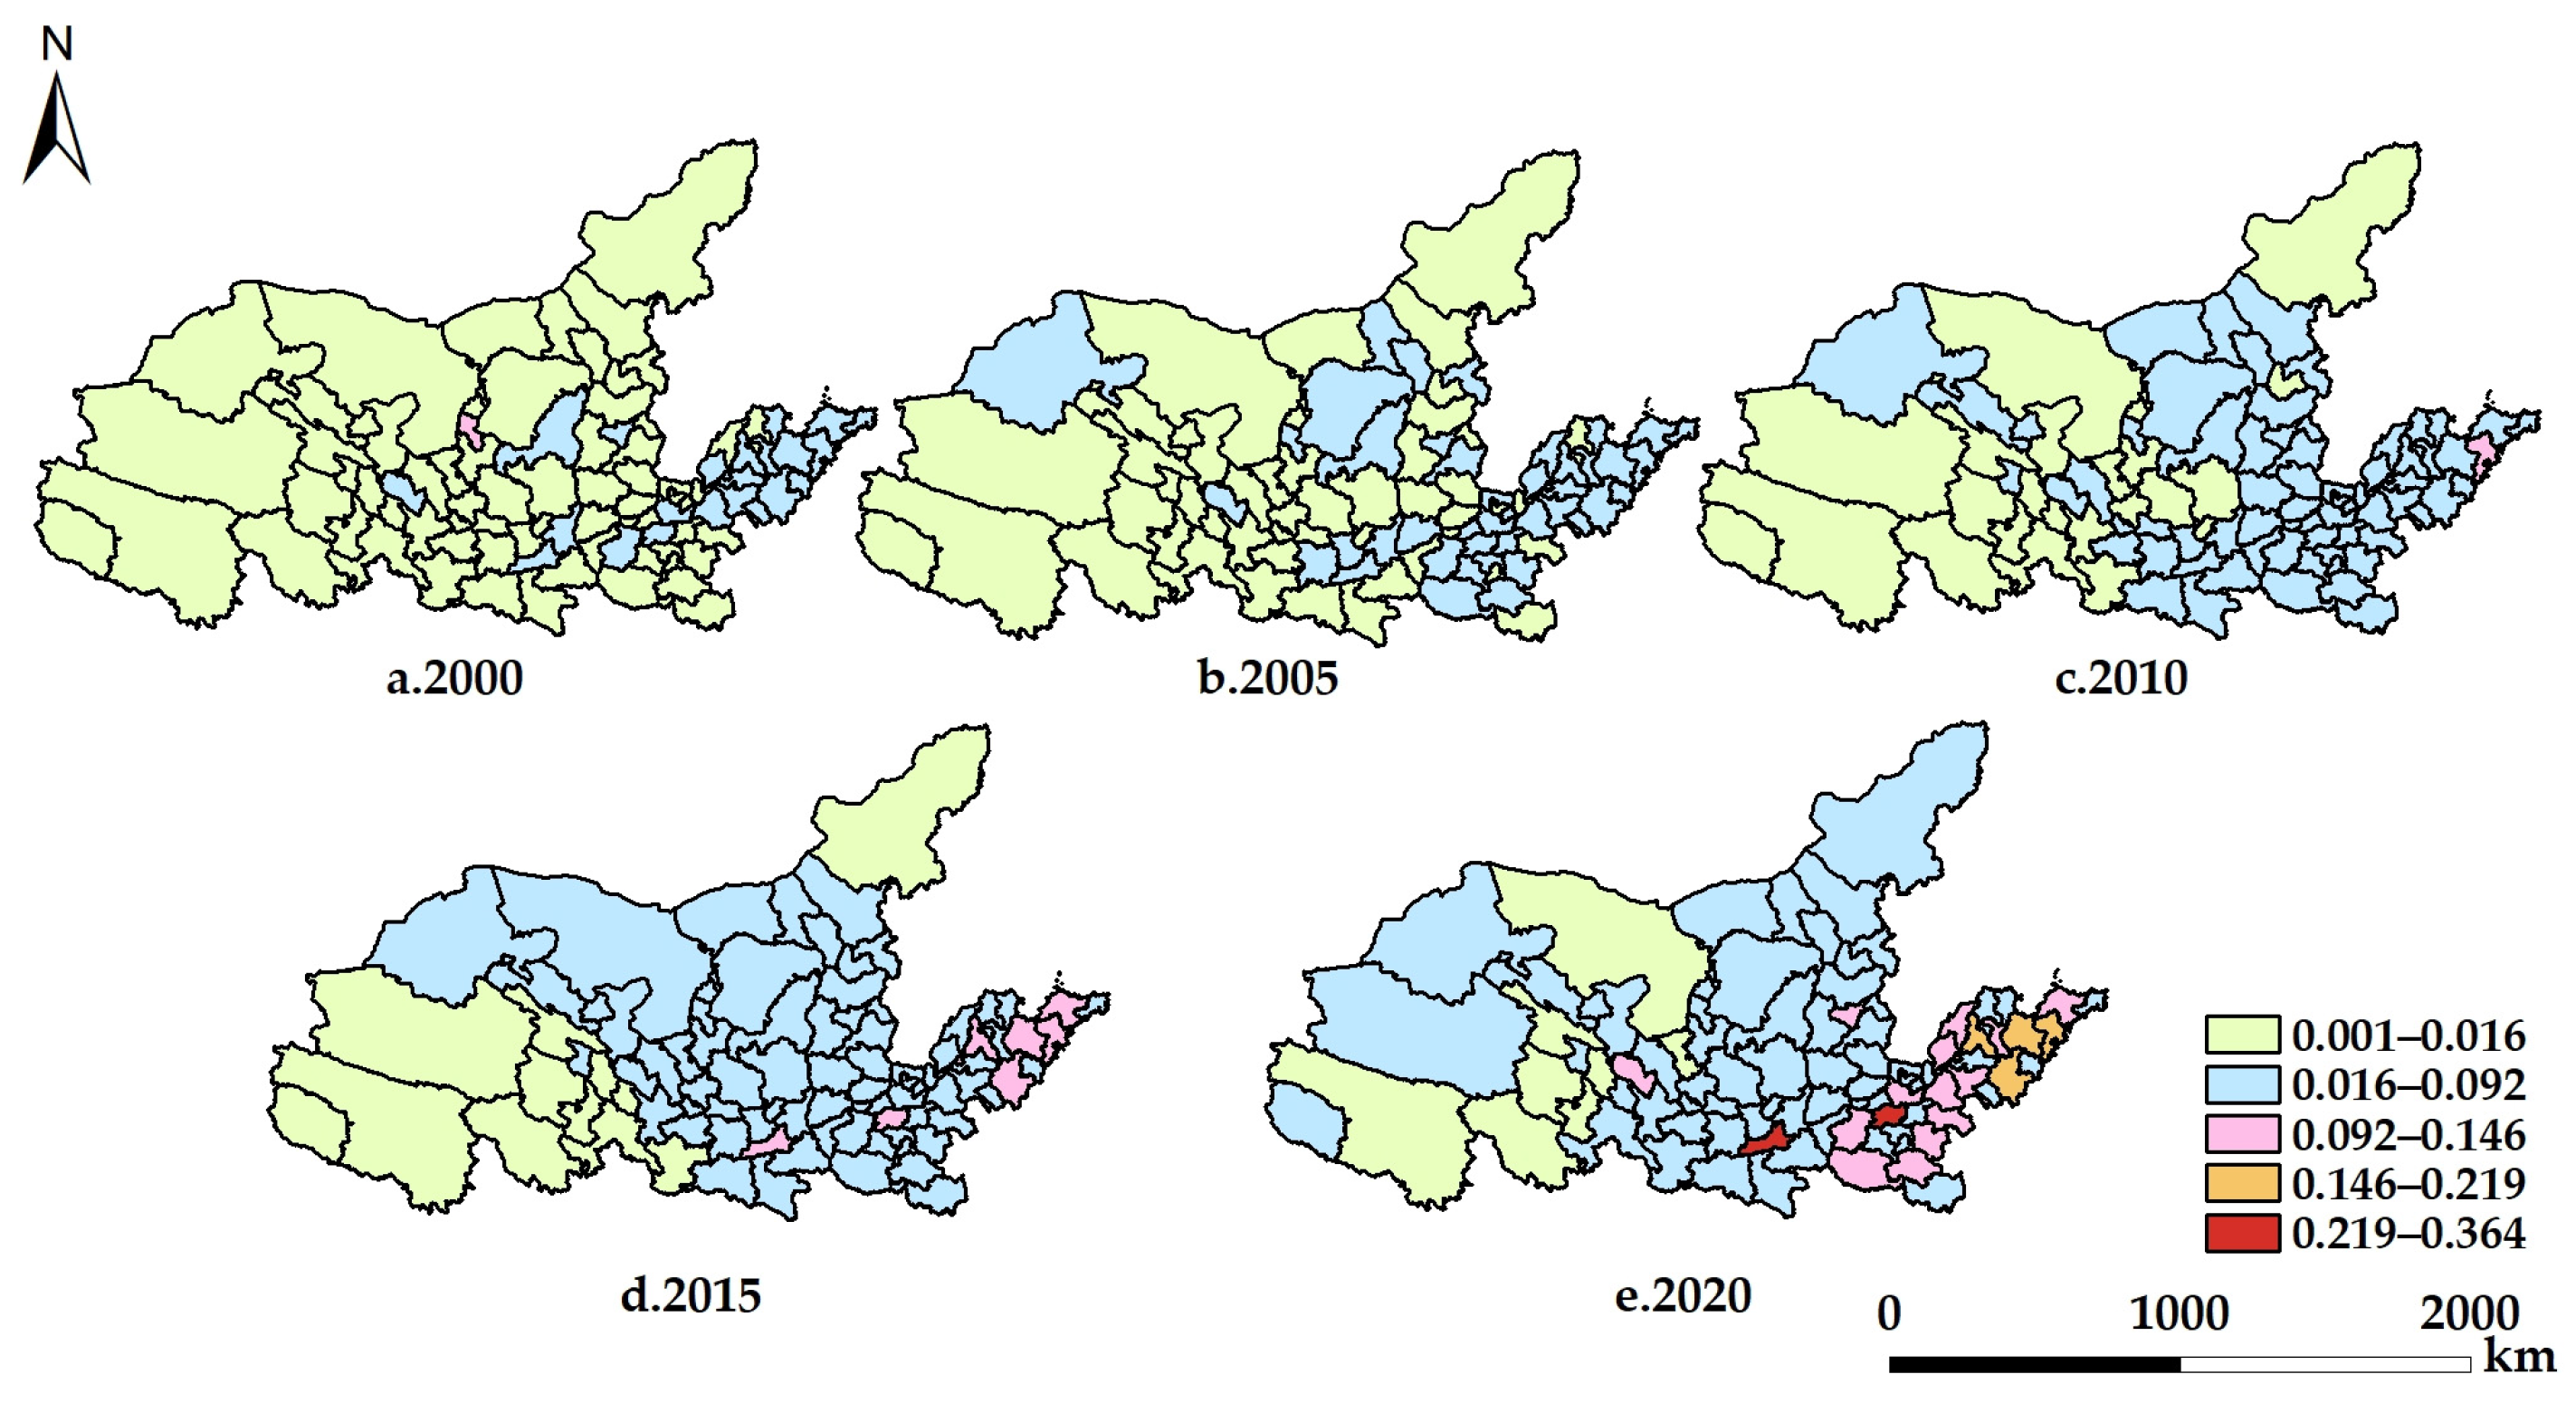
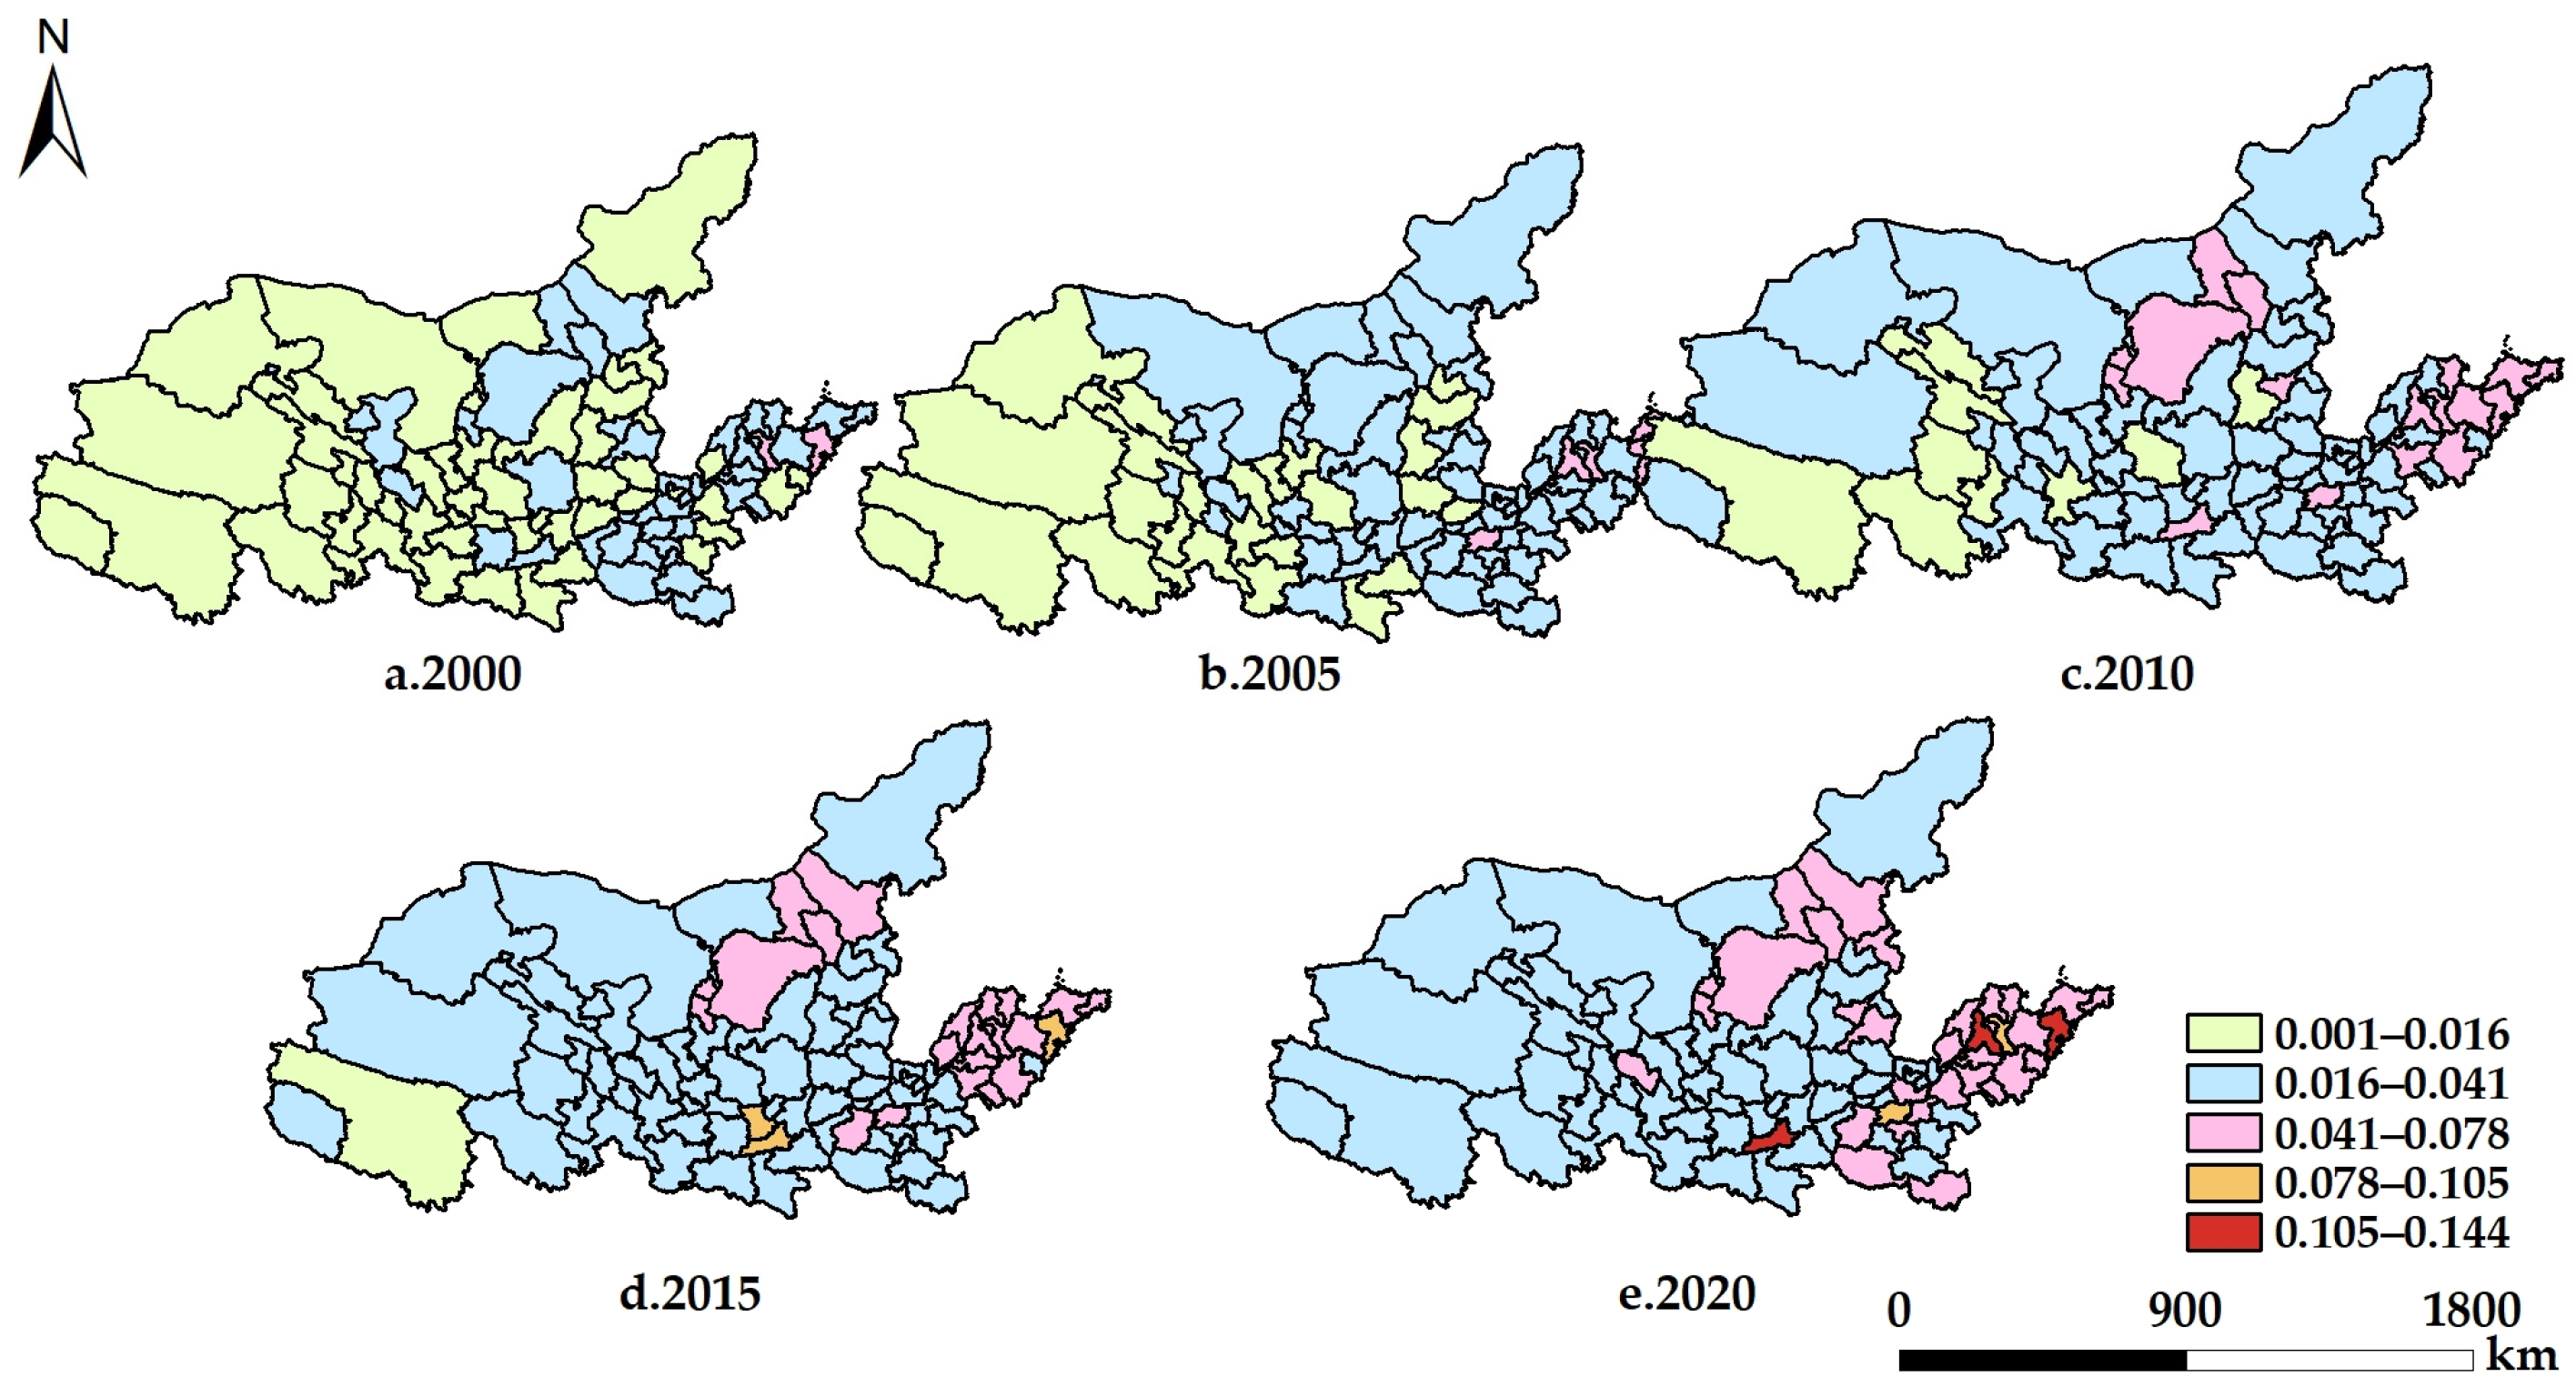
4.1.1. Analysis of Spatial and Temporal Evolution of Urban Spatial Expansion in the Yellow River Basin

After a series of correction processing of the nighttime light data of prefecture-level cities in the Yellow River Basin, the spatial area of prefecture-level cities in 2000, 2005, 2010, 2015 and 2020 was obtained by setting the spatial range threshold of the built-up area (Figure 2). Then, the extraction results of the built-up area of prefecture-level cities in the Yellow River Basin were calculated. In this paper, the urban built-up area was used to characterize the urban space.
From the perspective of time scale, the built-up area of prefecture-level cities in the Yellow River Basin in 2000, 2005, 2010, 2015 and 2020 was 3024.19 km2, 4303.43 km2, 6143.23 km2, 7570.45 km2 and 8903.92 km2, respectively. In the past 20 years, the built-up area has increased by 2.94 times, with a growth rate of 66.04%, and the expansion rate has been rapid. From the perspective of spatial structure, the built-up area of prefecture-level cities in the Yellow River Basin typically showed a trend of gradually decreasing from east to west and gradually decreasing density. The built-up area of the prefecture-level cities in western provinces increased from 427.42 km2 to 1663.12 km2, and the built-up area increased by 3.89 times in 20 years. Due to its lagging economic development, weak industrial foundation, fragile ecological environment and other problems, the western provinces lag behind in the initial stage of development, and the built-up area is small. However, with the later development and growth rate, these differences are particularly obvious, though the spatial connection between the prefecture-level cities in the western provinces is not close enough. The built-up area of prefecture-level cities in the central provinces increased from 1092.46 km2 to 2975.26 km2, an increase of roughly 2.72 times. It can be seen that the expansion of the built-up area of the provincial capital cities led by Taiyuan, Xi’an and Hohhot was higher than that of other cities. Although the basic conditions and overall development of the prefecture-level cities in the central provinces were better than those in the western provinces, the expansion rate of built-up area remained slow. The urban space of prefecture-level cities in the eastern provinces increased from 1504.31 km2 to 4265.54 km2, an increase of almost 2.84 times, which is similar to the growth rate of the central provinces. However, the overall development of the prefecture-level cities in the eastern provinces was relatively strong, especially in Zhengzhou and Jinan. Their surrounding urban built-up areas also grew relatively well, and the spatial links between prefecture-level cities were relatively close.

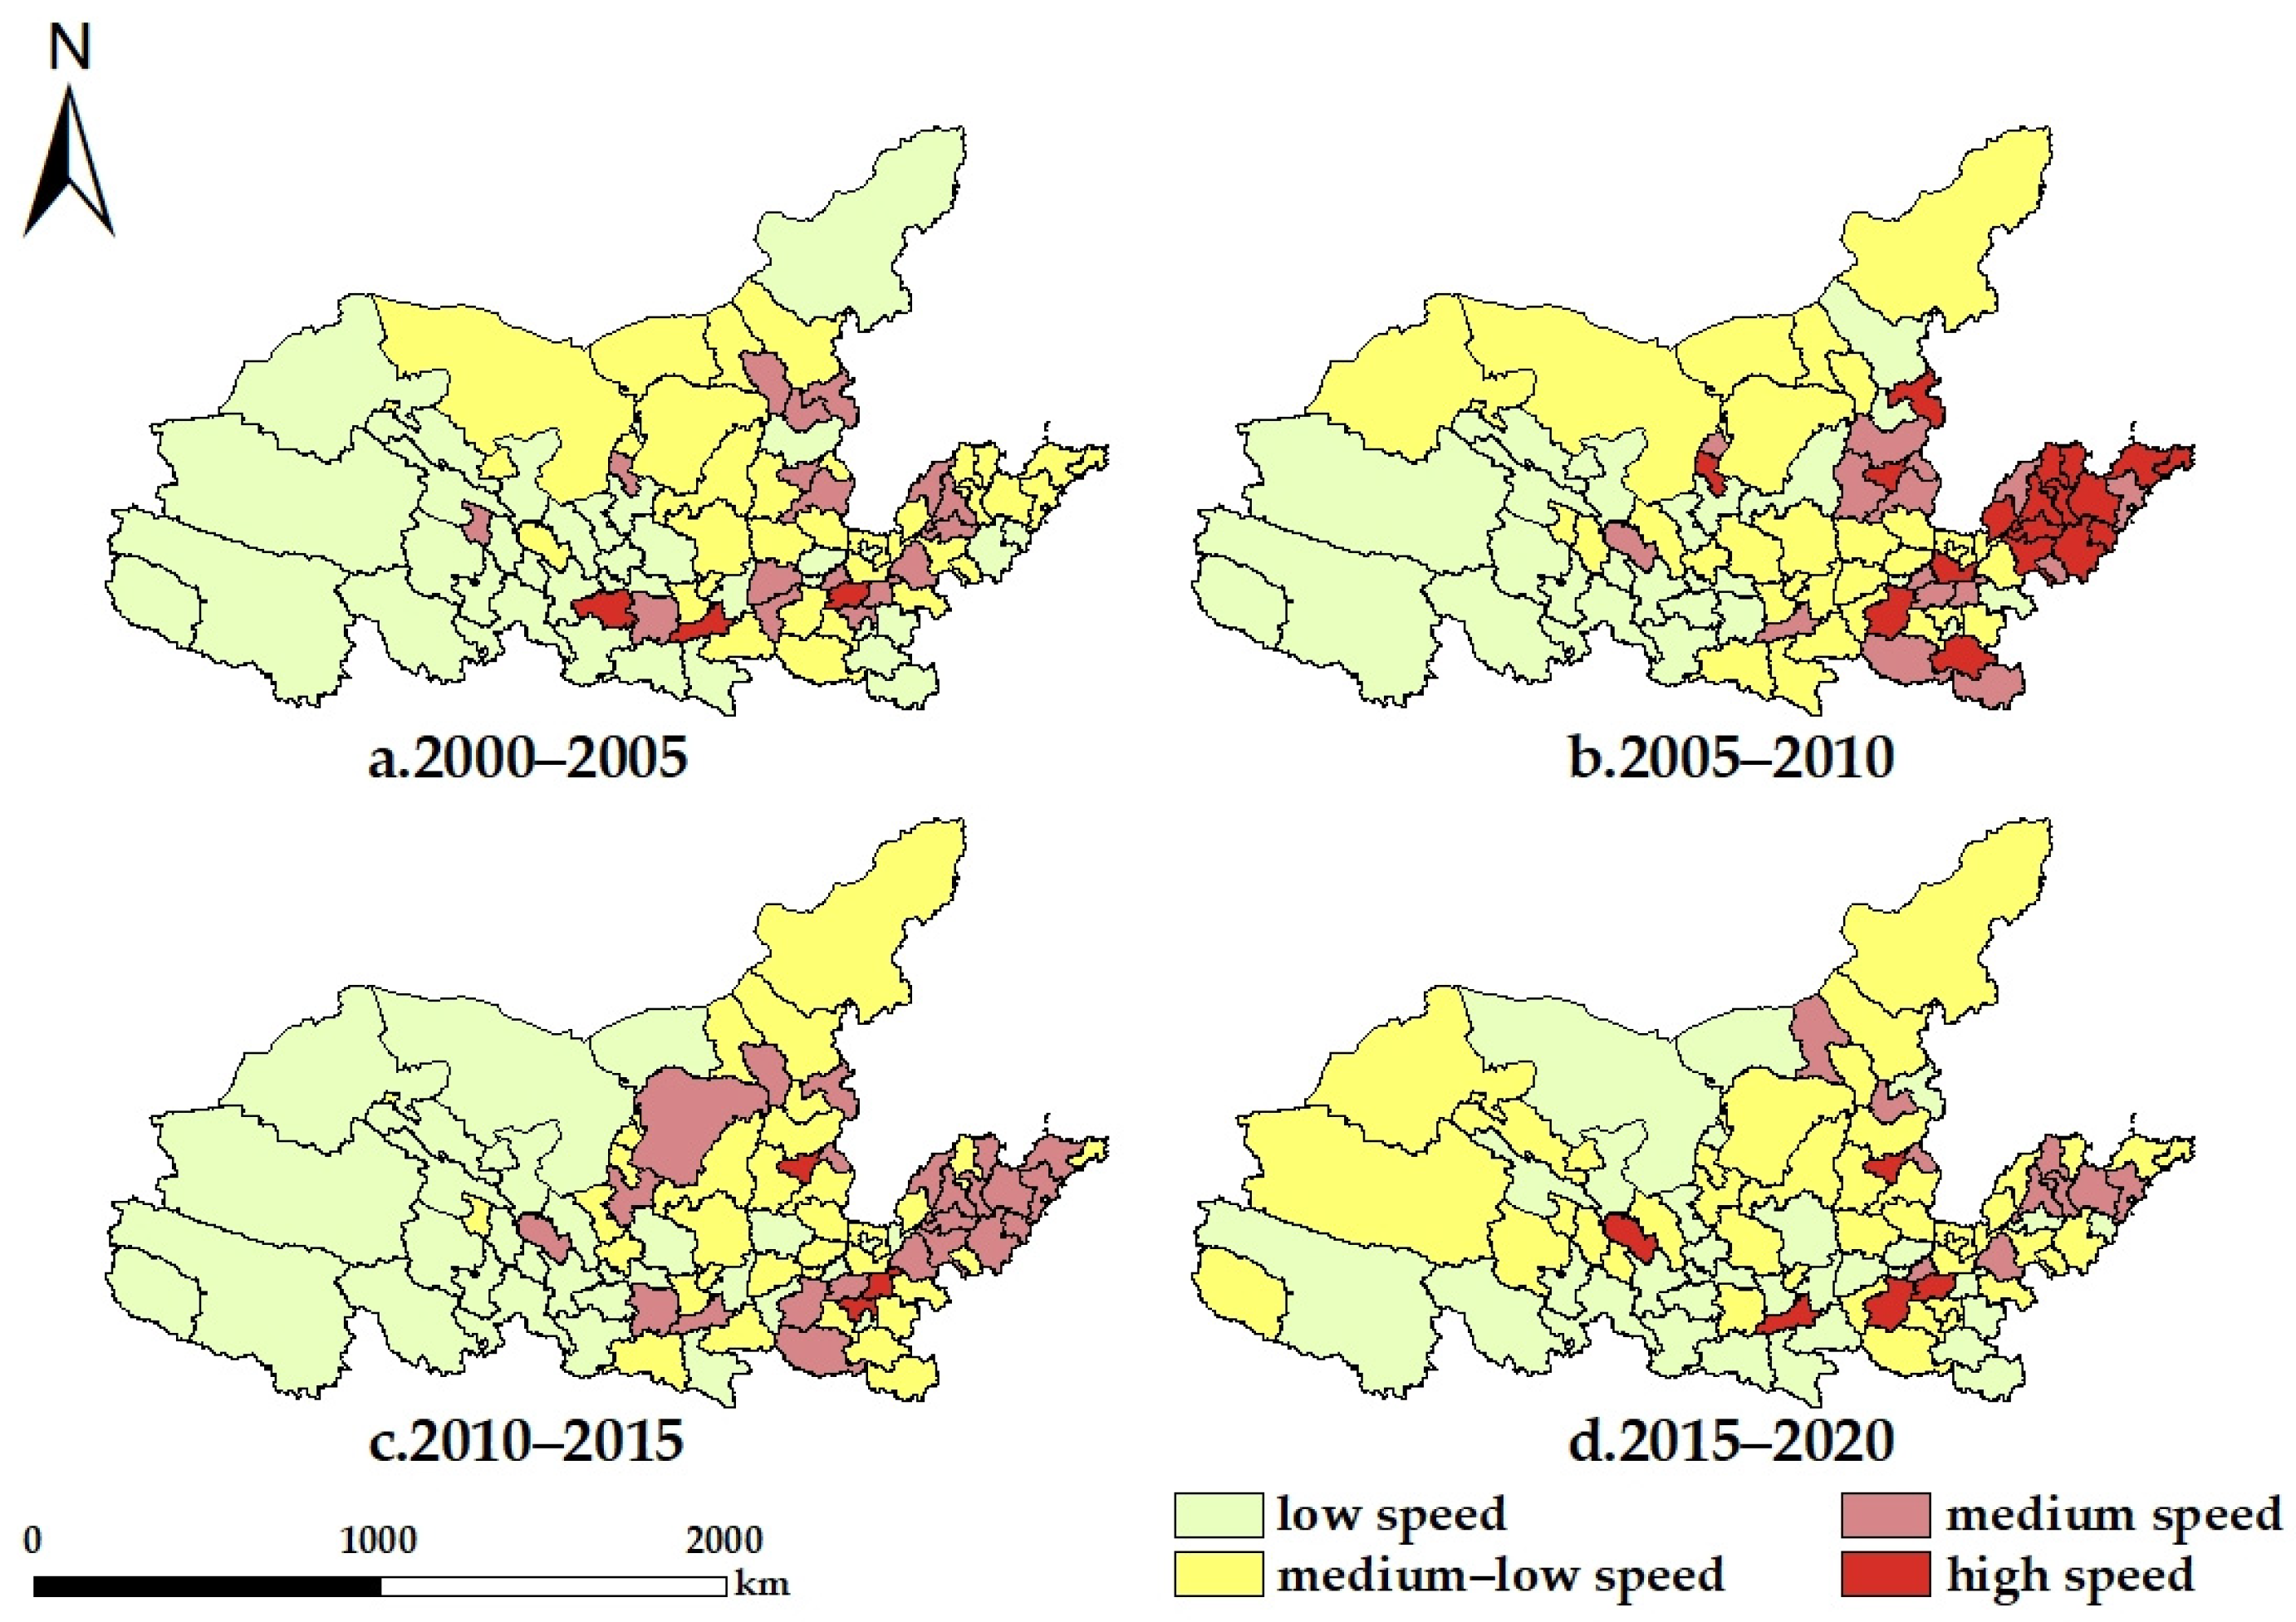
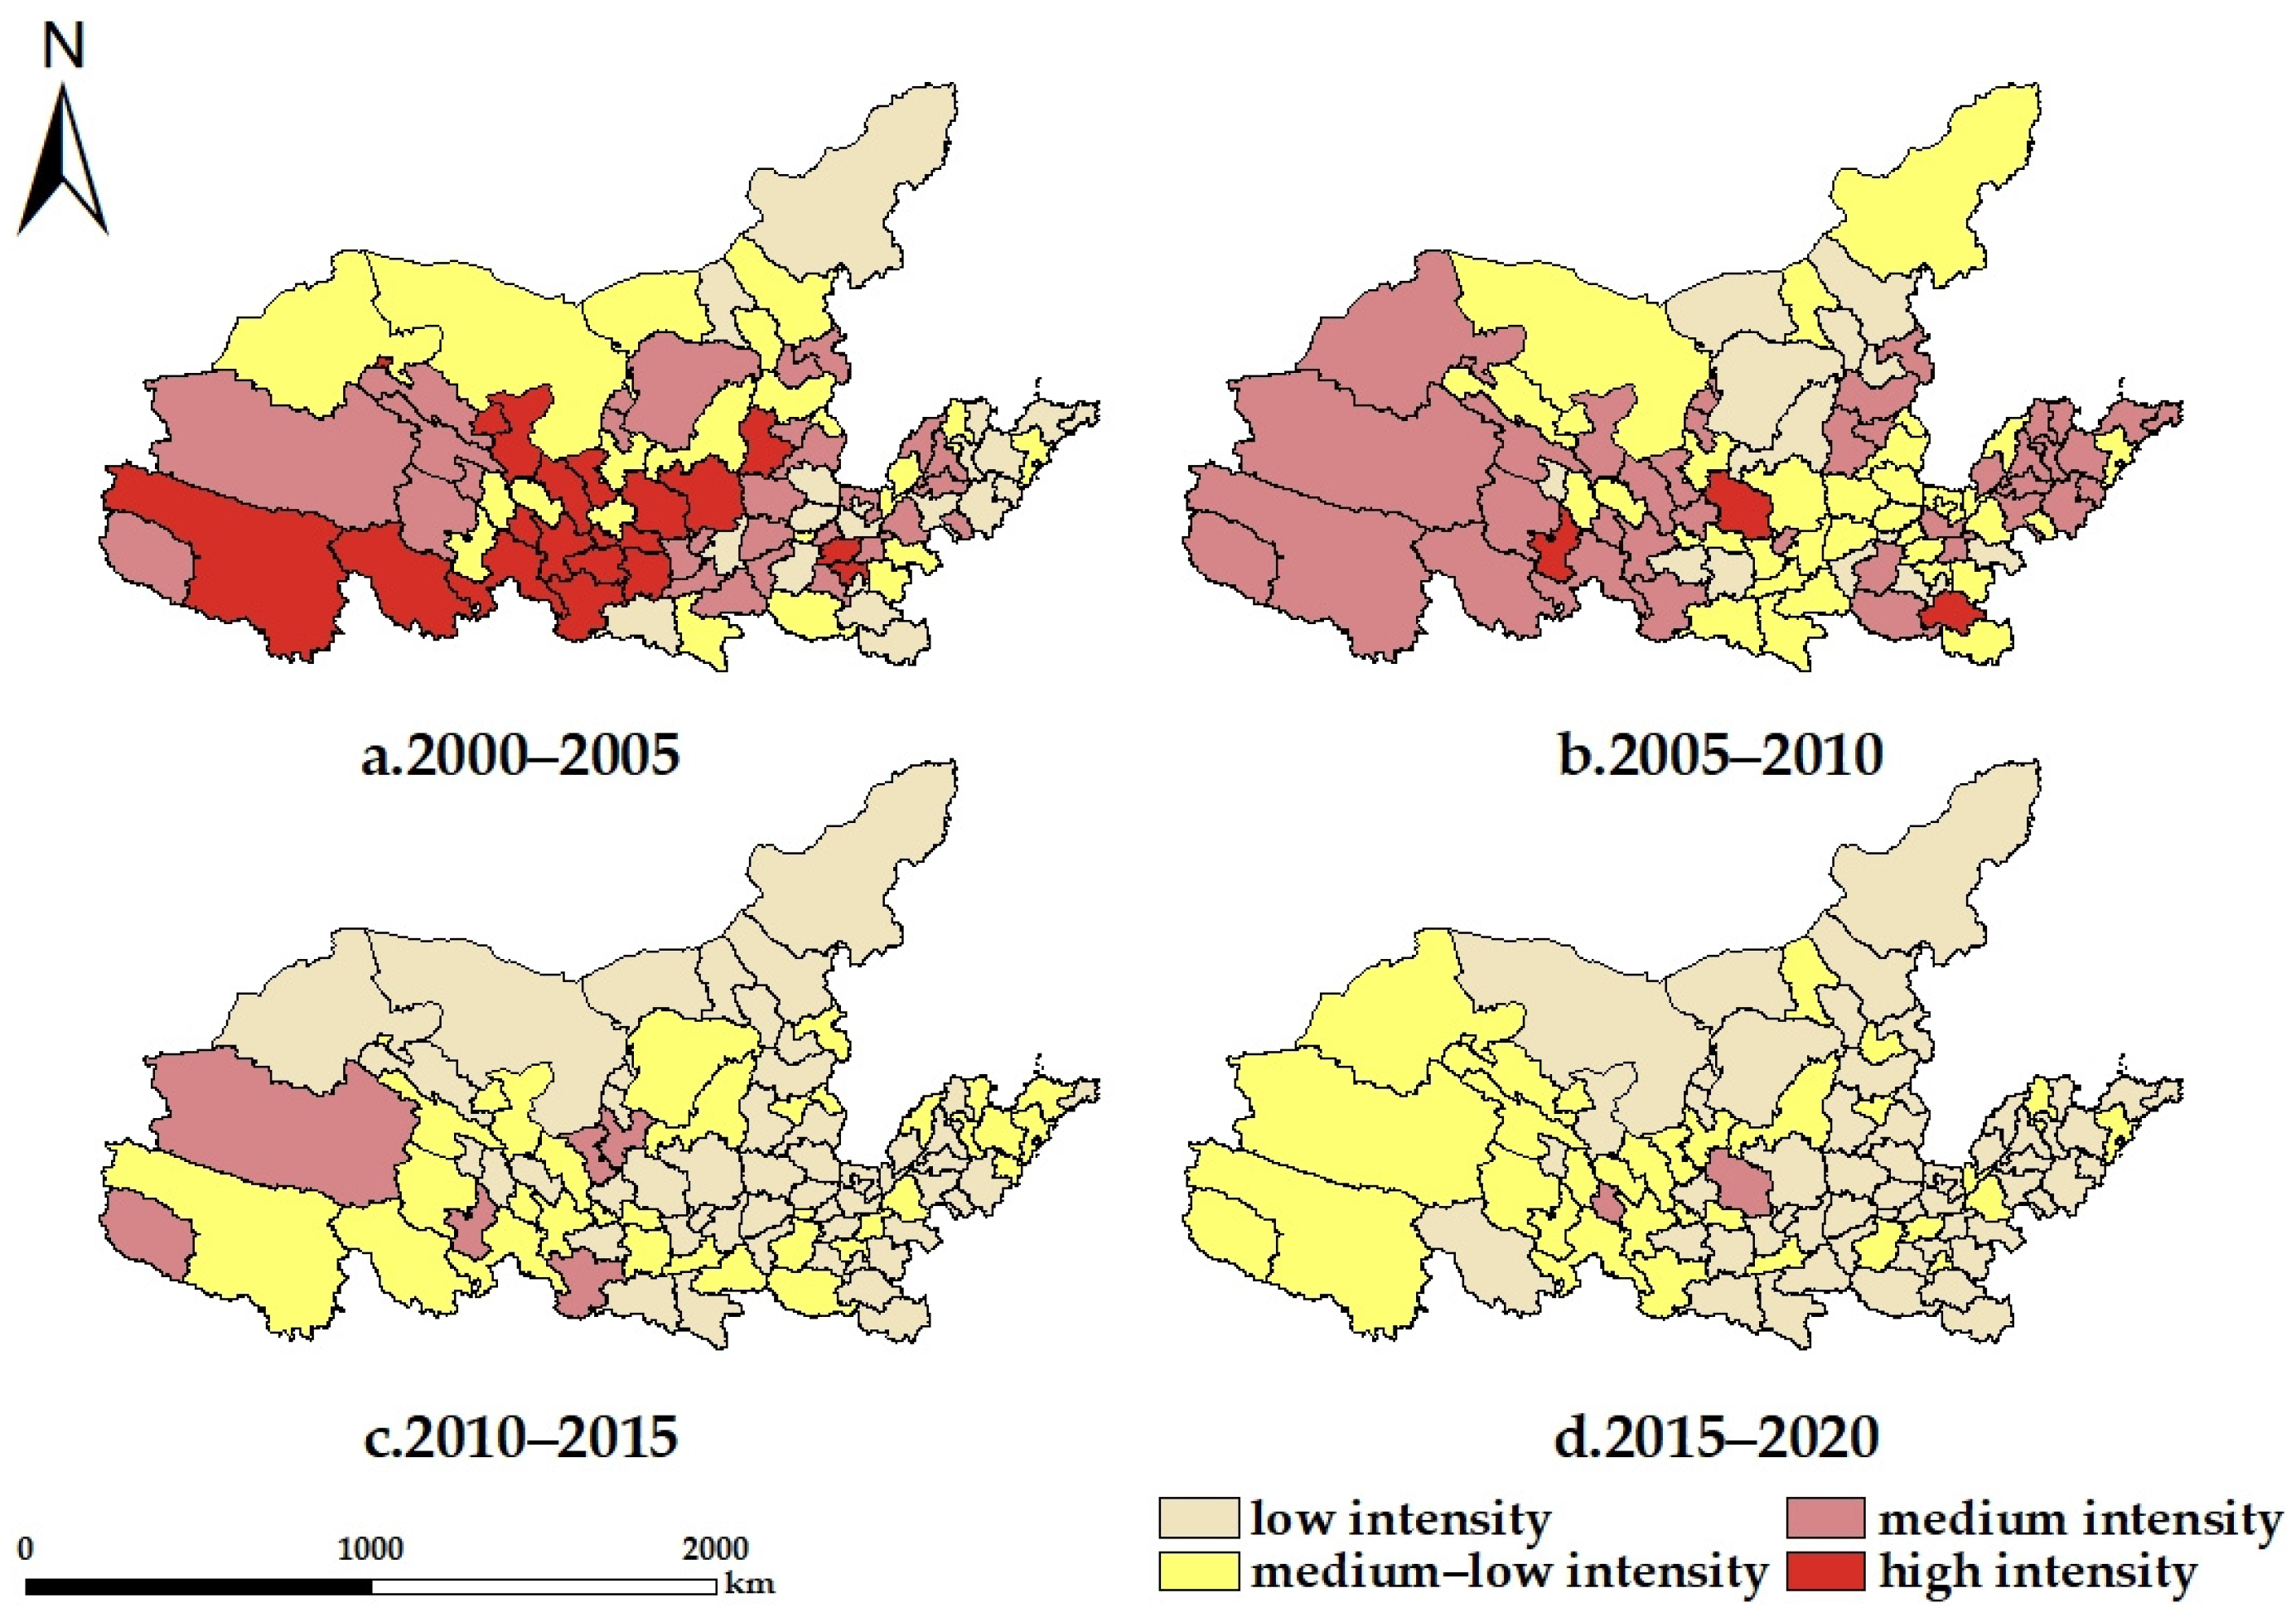
4.1.2. Analysis of Urban Spatial Expansion Index in the Yellow River Basin

Through SPSS cluster analysis, the expansion speed was divided into four categories (Figure 3), that is, the low speed expansion (0.11–2.23), medium–low speed expansion (2.23–4.35), medium speed expansion (4.35–6.47) and high speed expansion (6.47–8.60). For a long time, the expansion speed of prefecture-level cities in the western provinces of the Yellow River Basin was lower than that of the prefecture-level cities in the central and eastern provinces, which may have been related to the development level of the economy and population. In addition, the urban space was largely on the rise, but the fluctuation was large. Among them, only Lanzhou City’s expansion speed has maintained a steady growth trend, while Xining City, Yinchuan City and Shizuishan City’s expansion speed was faster and maintained a stable level compared to other prefecture-level cities. From 2000 to 2005, the urban spatial expansion speed of Tianshui City reached the highest value, mainly due to the small area of the built-up area in 2000. Among the prefecture-level cities in the central provinces, Taiyuan and Xi’an had the strongest expansion speed, maintaining the level of medium and high-speed expansion. The expansion speed of Hohhot is mostly at the level of medium–low speed and medium speed expansion, but the expansion speed showed a steady trend over 20 years, and the speed was higher than that of other prefecture-level cities in Inner Mongolia. The rest of the prefecture-level cities in Shanxi Province and Shaanxi Province had relatively slow urban spatial development and large fluctuations over the past 20 years. In the prefecture-level cities of the eastern provinces, the spatial expansion speed of the two “dual-core” urban agglomerations of Jinan, Qingdao, Zhengzhou and Luoyang has been more significant over 20 years. From 2000 to 2005, only Zhengzhou City in the eastern provinces was at a high-speed expansion level. From 2005 to 2015, most of the prefecture-level cities in the eastern provinces were at the level of medium and high-speed expansion, and then the expansion speed gradually slowed down. By 2020, the high value of the expansion speed of the prefecture-level cities in the entire eastern provinces only appears near the two ‘dual-core’ urban agglomerations, and the remaining prefecture-level cities are still at a low-speed and medium–low-speed expansion level.
Through SPSS cluster analysis, the expansion intensity was divided into four categories (Figure 4), that is, low intensity expansion (0.08–7.31), medium–low intensity expansion (7.31–14.54), medium intensity expansion (14.54–21.77) and high intensity expansion (21.77–62.56). The expansion intensity of the built-up areas in the 27 prefecture-level cities in the western provinces from 2000 to 2005 was particularly rapid, which may have been affected by the western development policy. Among them, 15 prefecture-level cities were at a high-intensity expansion level. The main reason is that the economic development level of this type of prefecture-level cities is extremely low, the strength is weak, the construction land is small, the overall scale of the urban area is small and the development speed is accelerated after the national policy is tilted, causing the built-up area to expand rapidly. Because the initial size was relatively small, a small increase in area will also lead to a significant change in the expansion intensity. From 2005 to 2010, in the prefecture-level cities of the western provinces, except Qingyang City and Huangnan Tibetan Autonomous Prefecture, which were at a high level of expansion, the expansion intensity of the built-up area of the remaining prefecture-level cities showed different degrees of slowdown. In the following 10 years, the expansion intensity of the built-up area of each prefecture-level city has gradually slowed down, but the urban space has maintained a relatively stable growth trend. From 2000 to 2010, the expansion intensity of built-up areas in prefecture-level cities in the central provinces was significantly different. Only Yan’an City and Lvliang City were at a high-intensity expansion level from 2000 to 2005, and the remaining prefecture-level cities were at medium-intensity and medium–low intensity. From 2010 to 2020, the expansion intensity of the built-up area of each prefecture-level city was in medium intensity and medium–low intensity, but the overall built-up area still maintained a slow growth. The change of built-up area expansion intensity in the eastern provinces is similar to that in the central provinces. From 2000 to 2005, Zhengzhou and Xuchang were at a high level of expansion in the prefecture-level cities of the eastern provinces, while the expansion intensity of the built-up areas of the remaining prefecture-level cities were significantly different. From 2005 to 2010, the expansion intensity of the built-up area of prefecture-level cities in the eastern provinces increased. Among them, only Zhumadian City was at a high-intensity expansion level, and most of the remaining prefecture-level cities were in medium-intensity and medium–low intensity. From 2010 to 2020, the expansion intensity of built-up areas in prefecture-level cities in eastern provinces gradually decreased, all of which were in low intensity and medium–low intensity. The high values of Yan’an City, Lvliang City and Zhumadian City were all related to their small urban space area. This phenomenon in the central and eastern provinces may be related to their own development, and the comparison objects were prefecture-level cities in the western provinces.

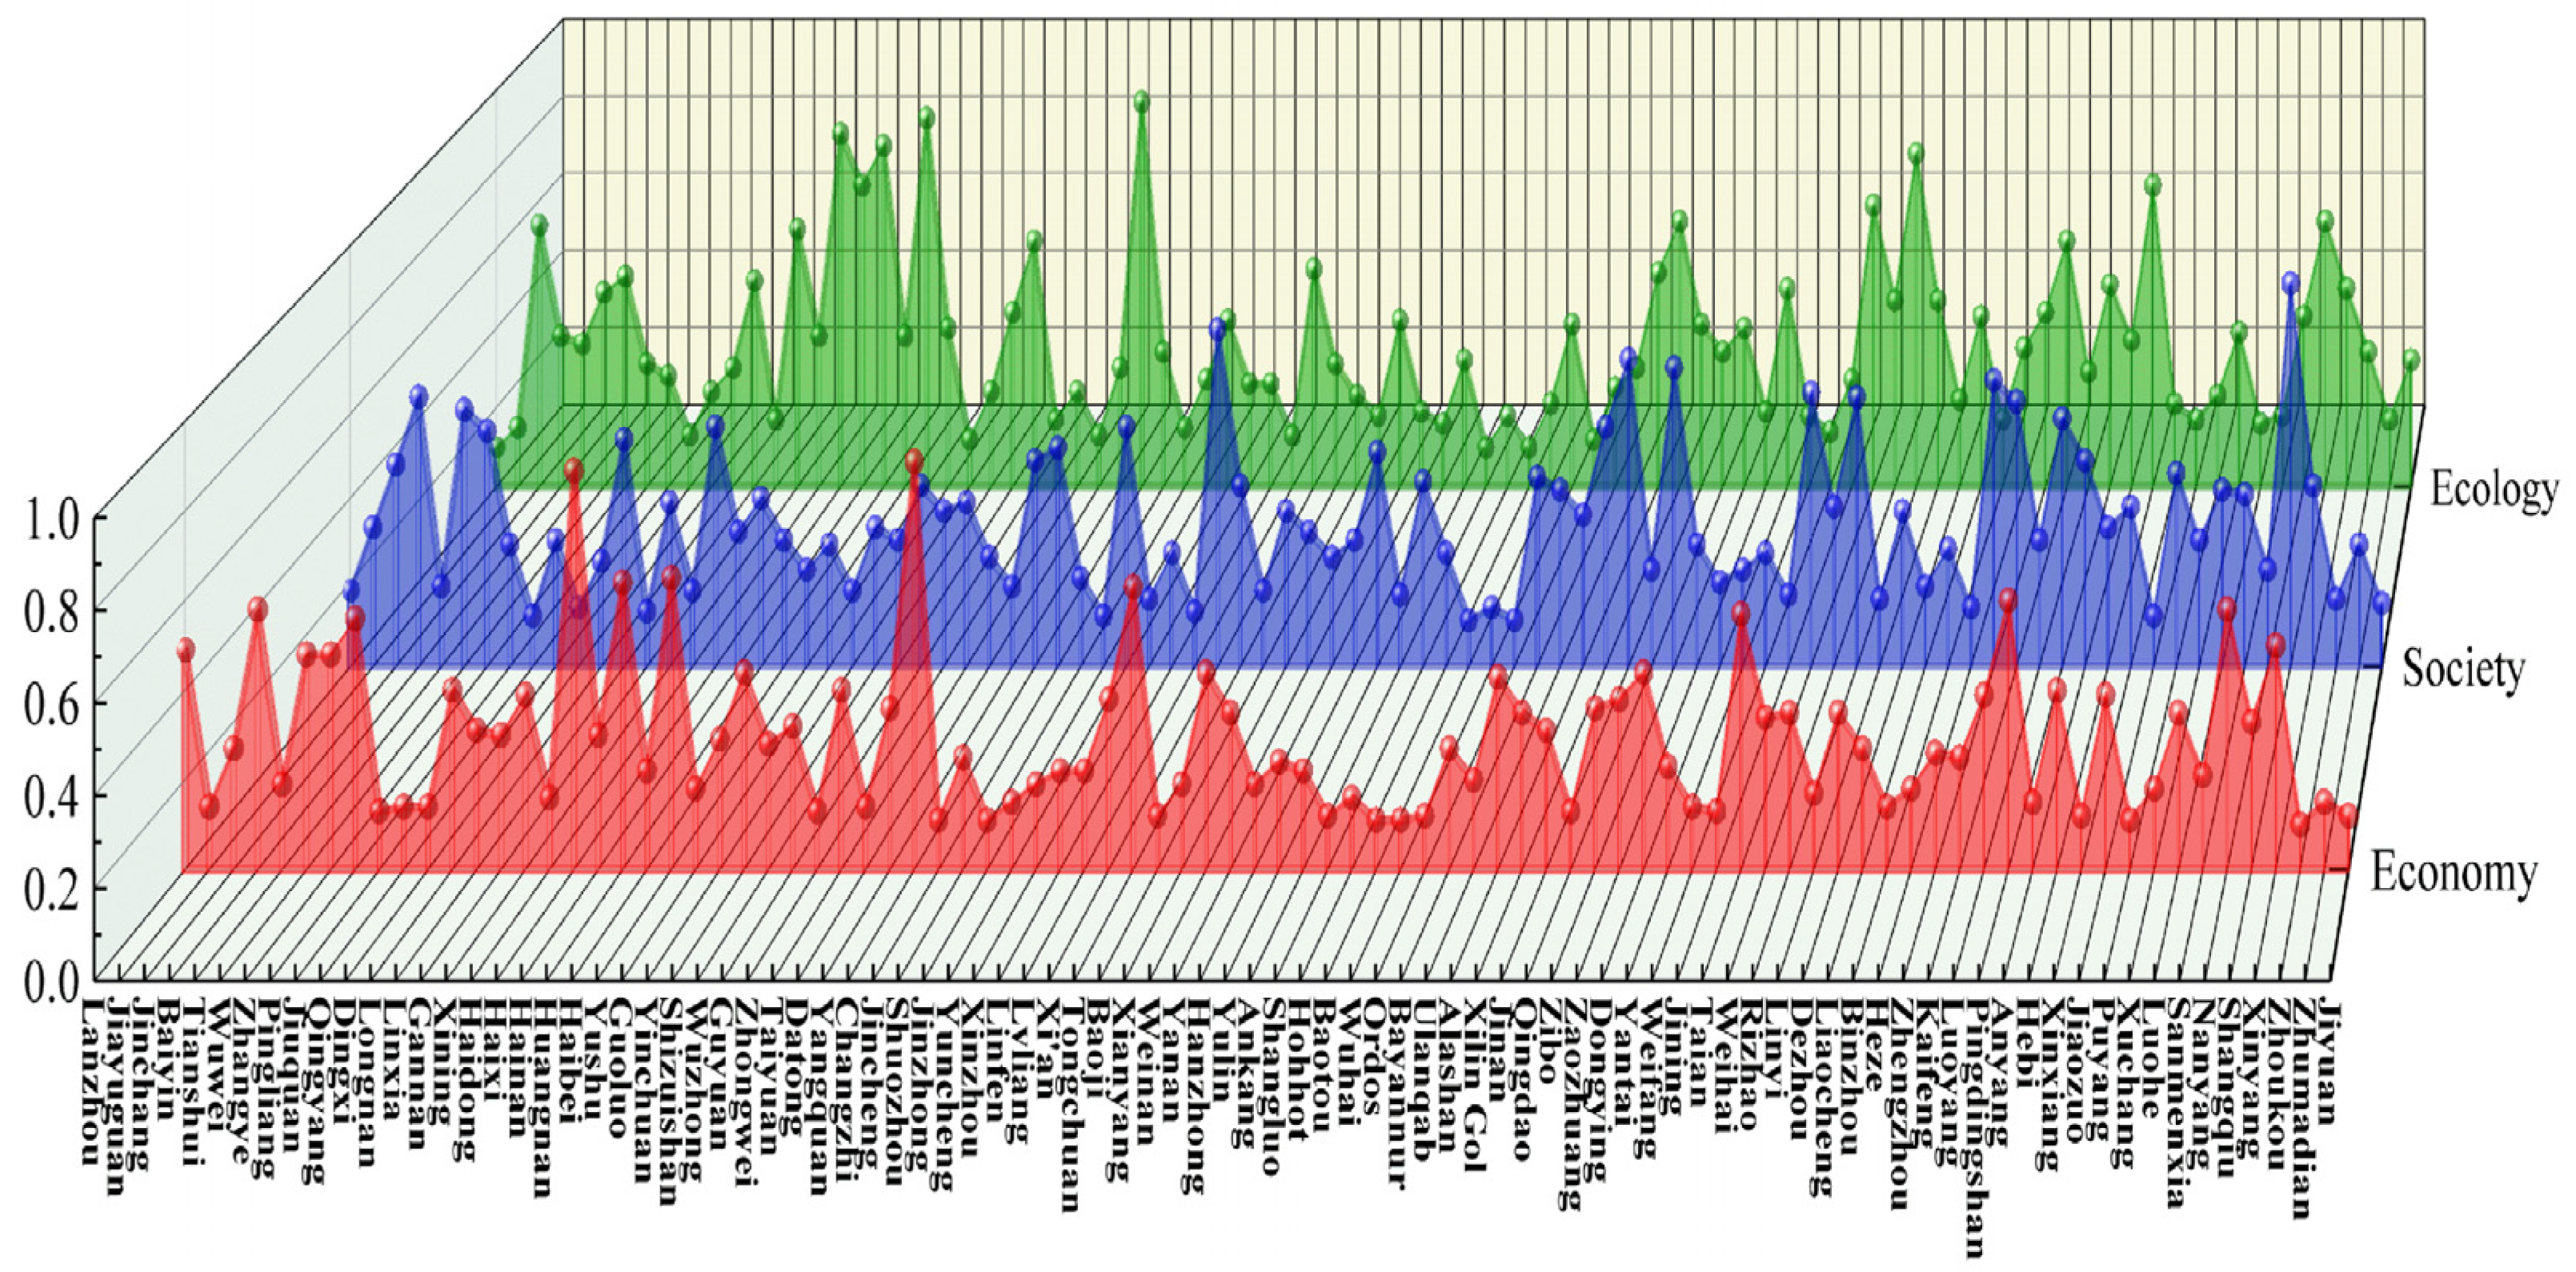
4.2. Analysis of the Urban-Scale Benefit in the Yellow River Basin

The entropy method was used to calculate the weight of each index in the evaluation index system of urban-scale benefit of prefecture-level cities in the Yellow River Basin. In addition, the comprehensive development level of the urban-scale benefit in 2000, 2005, 2010, 2015 and 2020 was calculated. Through SPSS cluster analysis, the comprehensive score of the economic-scale benefit was divided into five categories (Figure 5), that is, the low-level development stage (0.001–0.011), medium–low-level development stage (0.011–0.039), medium-level development stage (0.039–0.140), medium–high-level development stage (0.140–0.220) and high-level development stage (0.220–0.357). From 2000 to 2020, the level of economic-scale efficiency of 90 prefecture-level cities in the Yellow River Basin showed a trend of gradual development from a low level to a high level, and during this period, the imbalance of economic-scale efficiency in the eastern, central and western provinces was also obvious. In 2000, most of the 90 prefecture-level cities were in the low-level and medium–low-level development stage. By 2020, only an extremely small number of western provinces had prefecture-level cities with a low-level development stage of economic-scale efficiency, while prefecture-level cities in the high-level development stage mainly appeared in the eastern provinces, namely Zhengzhou City and Luoyang City in Henan Province, and Jinan City and Qingdao City in Shandong Province. It can be seen that the economic-scale efficiency of 90 prefecture-level cities in the Yellow River Basin is developing rapidly, and the economic development of the eastern provinces is faster than that of the central and western provinces. The main reason is limited to the development conditions of each prefecture-level city itself. The eastern provinces are only two ‘dual-core cities’ with better development, but the radiation effect on the economic development of the surrounding prefecture-level cities is not obvious.
Through SPSS cluster analysis, the comprehensive score of social-scale benefit was divided into five categories (Figure 6), that is, the low-level development stage (0.001–0.016), medium–low-level development stage (0.016–0.092), medium-level development stage (0.092–0.146), medium–high-level development stage (0.146–0.219) and high-level development stage (0.219–0.364). From 2000 to 2020, the social-scale benefit level of 90 prefecture-level cities in the Yellow River Basin showed a trend of gradual development from a low level to a high level, and the development of prefecture-level cities in the eastern, central and western provinces was quite different. In 2000, 90 prefecture-level cities were in the low-level and medium–low-level development stage. Obviously, only one prefecture-level city in Yinchuan was in the middle level of development. From 2005 to 2015, the number of prefecture-level cities in the low-level development stage gradually decreased, the number of prefecture-level cities in the middle and low-level development stage increased and the prefecture-level cities in the middle and eastern provinces gradually appeared in the middle-level development stage. By 2020, the differences between prefecture-level cities were particularly obvious, and the only high-level prefecture-level cities were Xi’an and Zhengzhou. The cities in the middle and high level of the development stage were evenly distributed in Shandong Province. Among the prefecture-level cities in the central and western provinces, only Taiyuan and Lanzhou belonged to the medium-level development stage, and the remaining prefecture-level cities belonged to the low-level and medium–low-level development stage. The main reason for this situation can also be attributed to the limited level of economic development of various prefecture-level cities.
Through SPSS cluster analysis, the comprehensive score of ecological-scale benefit was divided into five categories (Figure 7), that is, the low-level development stage (0.001–0.016), medium–low–level development stage (0.016–0.041), medium-level development stage (0.041–0.0.078), medium–high-level development stage (0.078–0.105) and high-level development stage (0.105–0.144). Most of the prefecture-level cities in the Yellow River Basin were in the low-level and medium–low-level development stage in 2000, and only Zibo City and Qingdao City were in the medium-level development stage. By 2005, Zhengzhou City, Jinan City and Yantai City were added to the three prefecture-level cities at the medium-level development stage, while the number of prefecture-level cities at the low-level development stage increased. In 2010, the number of prefecture-level cities in the middle-level development stage increased and most of them in the central and eastern provinces. At the same time, the ecological-scale benefits of prefecture-level cities in the western provinces gradually improved. In 2015, only the Yushu Tibetan Autonomous Prefecture was at a low level of development. In 2020, the prefecture-level cities in the western provinces, except Lanzhou City, Shizuishan City and Yinchuan City, were all in the middle and low levels of development. Xi’an, a prefecture-level city in the central province, underwent the only high-level development stage. Among the prefecture-level cities in the eastern provinces, the whole Shandong Province was above the medium-level development stage, among which Jinan and Qingdao were at a high-level development stage. In Henan Province, only Zhengzhou City was in the middle- and high-level development stage, and the remaining prefecture-level cities were in the middle- and low-level of development stage. The ecological environment of the Yellow River Basin is relatively fragile, and the carrying capacity of resources and environment is weak [43]. A good ecological environment is not only the basis of regional development, but also a vital guarantee for supporting high-quality economic development. It is conducive to accelerating regional economic growth, promoting industrial development and promoting the continuous improvement of scale efficiency [44]. It is particularly essential to focus on solving the contradiction between economic growth and ecological environment protection, as well as the problem of imbalance and inadequacy of river basin development [45].

4.3. Analysis of the Relationship between Urban Spatial Expansion and Urban-Scale Benefit in the Yellow River Basin

By calculating the gray correlation degree between the urban spatial expansion and scale benefits of prefecture-level cities in the Yellow River Basin (Figure 8), it can be seen that in the process of the urban spatial expansion of 27 prefecture-level cities in the western provinces of the Yellow River Basin, the total correlation degree of 20 prefecture-level cities was greater than 0.7, which shows that urban spatial expansion had a good reflection on urban-scale benefits in the western provinces. The six prefecture-level cities had a higher correlation score in terms of economic-scale benefits, among which, the Haixi Mongolian and Tibetan Autonomous Prefecture had the highest correlation. In addition, seven prefecture-level cities had higher correlation scores in terms of social-scale benefits, and fourteen prefecture-level cities had higher correlation scores in terms of ecological-scale benefits. The highest value was found for the Yushu Tibetan Autonomous Prefecture. As the source of the Yellow River, the prefecture-level cities in the western provinces have the strongest ecological constraints and environmental sensitivity. The city scale is generally lower than other regions, whereas the urban space is expanding rapidly, and it will also pay more attention to the protection of the ecological environment. Therefore, the correlation between urban spatial expansion and ecological-scale efficiency in prefecture-level cities in the western provinces is more significant.
In the process of the urban spatial expansion of 29 prefecture-level cities in the central provinces of the Yellow River Basin, only 15 prefecture-level cities had a total correlation degree of 0.70. It can be seen that urban spatial expansion has not had a significant impact on urban-scale benefits in the central provinces. Among them, 11 prefecture-level cities had higher scores in social-scale benefits, with the highest value of 0.80 in Xi’an. However, these scale benefits need to be further improved in terms of both economic and ecological-scale benefits. Most of the central provinces are located in the Loess Plateau, and their development foundation is relatively weak. Most cities are coal resource-based cities, which are affected by factors such as the decline of the coal economy, overcapacity of traditional industries and difficulties in economic transformation. To a certain extent, the above situation can be explained.
In the process of the urban spatial expansion of 34 prefecture-level cities in the eastern provinces, the total correlation degree of 25 prefecture-level cities was greater than 0.70, indicating that urban spatial expansion has caused a significant increase in scale efficiency to a certain extent. Among them, 14 prefecture-level cities scored higher in terms of social-scale benefits, with the highest value being Shangqiu City. Moreover, 11 prefecture-level cities scored higher in terms of ecological scale benefits, with the highest value being Rizhao City. The eastern provinces have obvious geographical advantages, good economic foundation and ecological environment. The economic development and the rapid expansion of urban space have promoted the further improvement and development of the social infrastructure of the prefecture-level cities in the eastern provinces and have greatly improved the quality of the ecological environment.

4.4. Analysis of the Detection Results of Urban Spatial Expansion Impact Factors in the Yellow River Basin

In this paper, the geographical detector model was used to identify the key influencing factors of urban spatial expansion in prefecture-level cities in the Yellow River Basin. The results are shown in Table 2. It can be seen from Table 2 that the spatial and temporal differentiation of urban spatial expansion in prefecture-level cities in the Yellow River Basin is the result of the combined effects of natural, socioeconomic and policy factors. In 2000, the influence of the proportion of the output value of the secondary and tertiary industries in the total output value was the first among the explanatory variables, indicating that industrial structure was the main driving force to promote urban spatial expansion. The fixed asset investment and the total actual utilization of foreign capital ranked second and third, with q values of 0.34 and 0.33, respectively, exceeding 0.30 and passing the 1% significance level test, indicating that the government‘s regulatory capacity and openness level had an important driving effect on the spatial and temporal differentiation of urban spatial expansion. In 2005, the influence of the proportion of the output value of the secondary and tertiary industries in the total output value still ranked first, but the q value increased to 0.75. The investment in fixed assets and the total amount of actual utilization of foreign capital ranked second and third, with q values of 0.30 and 0.26, respectively, indicating that the expansion of urban space was accelerated by the government‘s regulatory capacity and the level of openness. In 2010, the influence intensity of population density in each explanatory variable was greater than that of other explanatory variables, and its q value was 0.36. With the improvement of public service facilities, such as education and medical care, in the process of urbanization, a large number of rural people have been attracted to cities in order to seek better employment, education and medical services. The growth of population size has led to the expansion of urban space. The proportion of the output value of the three industries in the total output value and the influence of fixed asset investment ranked second and third, and their q values were 0.31 and 0.28, respectively, indicating that the industrial structure and government regulation ability were important driving forces to promote urban spatial expansion. In 2015, the influence of per capita GDP ranked first among the explanatory variables, and its q value was 0.50. The population density and the total amount of foreign capital actually utilized ranked second and third, with q values of 0.35 and 0.33, respectively. By 2020, the impact of per capita GDP was greater than other explanatory variables, and its q value was 0.51. The proportion of the output value of the three industries to the total output value and the influence of population density ranked second and third, and their q values were 0.46 and 0.040, respectively.
Overall, the level of economic development, industrial structure and population size from 2000 to 2020 are the main driving factors affecting the urban spatial expansion of prefecture-level cities in the Yellow River Basin. The growth of per capita GDP and the proportion of secondary and tertiary industry output value to total output value has an increasing impact on urban spatial expansion. The growth of the population has increased the demand for urban residential and infrastructure land, which has led to the continuous expansion of urban space. The impact of fixed-asset investments and total actual utilization of foreign capital on urban spatial expansion has gradually declined, indicating that the dependence of urban spatial expansion on government and foreign investment in prefecture-level cities across the Yellow River Basin has declined. The influence of natural factors on urban spatial expansion is always low.

5. Conclusions and Discussions

5.1. Conclusions

The results show that the urban spatial expansion of prefecture-level cities in the Yellow River Basin is rapid; the scale benefits of the urban economy, society and ecology are gradually improving; and there is a positive correlation with urban spatial expansion. The urban spatial expansion of the Yellow River Basin is mainly driven by the factors of the economic development level, industrial structure and population density.
(1) In general, the urban spatial land area of each prefecture-level city in the Yellow River Basin has increased from 3024.19 km2 to 8903.92 km2 in the past 20 years, with an overall increase of 2.94 times and a growth rate of 66.04%. The expansion was fast, but the overall expansion speed was lower than the national level [46], and there were obvious characteristics of unbalanced development in the eastern, central and western prefecture-level cities [47]. The expansion speed and expansion intensity showed a trend of gradually decreasing from high to low. In addition, they maintained a positive and stable growth trend as a whole, but there were obvious differences in the speed and intensity of expansion among prefecture-level cities.
(2) The results show that the economic-, social- and ecological-scale benefits of the prefecture-level cities in the Yellow River Basin from 2000 to 2020 demonstrated a trend of gradual transition from a low level to a high level, and the prefecture-level cities developed better in terms of ecological-scale benefits. From the perspective of regional differences in scale benefits, the eastern prefecture-level cities in the Yellow River Basin were superior to the central and western prefecture-level cities in terms of economic-, social- and ecological-scale benefits, and the high values also mainly appeared among the eastern prefecture-level cities. It can be seen that the ecological scale benefits in the whole Yellow River Basin have developed well, and more attention has been paid to the protection of ecological benefits while developing economic benefits.
(3) Through an analysis of the correlation between urban space and the scale benefit of most prefecture-level cities in the Yellow River Basin in the past 20 years, it was found that there was a high positive correlation between them, but this positive correlation had obvious differences in the performance of prefecture-level cities in the eastern, central and western regions. For most prefecture-level cities, the positive correlation between urban spatial expansion and social- and ecological-scale benefits was more significant.
(4) The urban spatial expansion of prefecture-level cities in the Yellow River Basin is the result of a combination of natural factors, the economic development level, industrial structure, government regulation ability, population size and openness level. Among them, per capita GDP, the proportion of secondary and tertiary industry output value to total output value, and population density are important driving factors to promote urban spatial expansion. The influence of the economic development level, industrial structure and population size on the spatial differentiation of urban spatial expansion in prefecture-level cities is gradually increasing, while the influence of government regulation ability and opening level is gradually weakening.

5.2. Discussion

In order to realize the coordination of urban spatial expansion and scale benefit of prefecture-level cities in the Yellow River Basin and promote the ecological protection and high-quality development of the Yellow River Basin, based on the scale of prefecture-level cities, this paper used DMSP/OLS and NPP/VIIRS nighttime light data and statistical yearbooks, as well as the GIS and mathematical analysis, to analyze the spatial and temporal evolution pattern of the urban spatial expansion, as well as the development trend of scale efficiency level and the degree of correlation between the two. This paper also used the geographical detector model to reveal the driving mechanism behind the urban spatial expansion of prefecture-level cities.
The speed of urban spatial expansion of prefecture-level cities in the Yellow River Basin was fast. The spatial performance was gradually decreasing from east to west, and the density is gradually decreasing. The expansion speed and expansion intensity were gradually decreasing from high to low, which was consistent with the research results of Chen Hongzhang [48]. The comprehensive level of urban economic-, social- and ecological-scale benefits gradually increased from 2000 to 2020, and it has a high degree of correlation with urban spatial expansion, but there are spatial differentiation rules in different regions, which was consistent with the research results of Xu Mingchong [20]. Per capita GDP, the proportion of secondary and tertiary industry output value to total output value and population density are the most important driving factors for urban spatial expansion of prefecture-level cities in the Yellow River Basin, which was consistent with Li Jintao‘s research results [40]. The expansion of urban space is the premise to realize the development of industrialization and urbanization; it is also necessary to realize the sustainable development of social economy [49]. In the process of development, we should put an end to the “spatial urbanization” that is separated from the economic foundation, and especially be alert to the false “urbanization” of the underdeveloped prefecture-level cities in the western provinces and the prefecture-level cities lacking resource endowments. In addition, in the process of the urban spatial expansion of prefecture-level cities, the quality of development of prefecture-level cities should be continuously improved [50] so as to promote the scientific development of prefecture-level cities; to realize the coordinated development of economy, population, society and ecology; and gradually to solve and improve the problems of medical treatment, education, employment, health and environmental protection. It is also particularly important to ensure the positive development between urban spatial expansion and scale efficiency. The Yellow River Basin has a vast area, and the resource endowments and development conditions of prefecture-level cities in the eastern, central and western regions are quite different [51]. The eastern prefecture-level cities take the lead in development, the central prefecture-level cities develop steadily and the western prefecture-level cities rise rapidly and have great development potential. The prefecture-level cities in the eastern provinces should play an active leading role, enhance the connection between the basins, focus on the overall layout of the Yellow River Basin, realize resource sharing and promote the high-quality development of the Yellow River Basin through joint development. These prefecture-level cities should also participate in the construction of the “Belt and Road” and strengthen economic ties and social and cultural exchanges with countries along the route. Therefore, in the process of formulating development policies, prefecture-level cities in the Yellow River Basin should respect the general laws of the development of prefecture-level cities. Moreover, attention should be paid to the characteristics of each prefecture-level city, and targeted research and understanding are needed [52,53].
Based on nighttime light data, this study successfully applied a series of data technology methods to analyze the relationship between the urban spatial expansion and scale benefit of prefecture-level cities in the Yellow River Basin, drawing some useful conclusions and policy implications. Although the results do not affect the research on the urban spatial expansion of prefecture-level cities, they reflect that the urban built-up area of prefecture-level cities is still calculated by the best threshold method, and it should continue to be improved in the future. In addition, due to the complex and diverse driving factors affecting the urban spatial expansion of prefecture-level cities, this study only simplified them into six indicators. In the future, we should further explore the dynamic mechanism affecting the urban spatial expansion of prefecture-level cities in the Yellow River Basin from a more comprehensive and complex perspective, so as to provide theoretical support for the healthy and sustainable development of prefecture-level cities in the Yellow River Basin.

Author Contributions

Writing—original draft preparation, L.L.; Writing—review and editing, Z.Z.; supervision, J.Z.; funding acquisition, Z.Z. All authors have read and agreed to the published version of the manuscript.

Funding

This research was funded by Shanxi Provincial Department of Education Project Shanxi. Yellow River ‘5G+’ Tourism Planning Research, grant number HH202005.

Institutional Review Board Statement

Not applicable.

Informed Consent Statement

Not applicable.

Data Availability Statement

Not applicable.

Conflicts of Interest

The authors declare no conflict of interest.

References

  1. Qian, M.; Pu, L.; Zhang, J.; Zhang, M. Urban Spatial Expansion Characteristics in China’s Rapid Urbanization Region—A Case Study of SXC Region. Int. J. Geosci. 2013, 4, 1365–1375. [Google Scholar] [CrossRef]
  2. Liu, Y.X.; Huang, C.; Zhang, L. The Spatio-Temporal Patterns and Driving Forces of Land Use in the Context of Urbanization in China: Evidence from Nanchang City. Int. J. Environ. Res. Public Health 2023, 20, 2330. [Google Scholar] [CrossRef] [PubMed]
  3. Floková, L.; Hübelová, D.; Kozumpliková, A.; Caha, J.; Janošíková, L. Multi-perspective quality of life index for urban development analysis, example of the city of Brno, Czech Republic. Cities 2023, 137, 104338. [Google Scholar] [CrossRef]
  4. Lake Robert, W. Readings in Urban Analysis:Perspectives on Urban Form and Structure; Taylor and Francis: Oxfordshire, UK, 2017. [Google Scholar]
  5. Kwon, T.J. A New Co-Creative Urban Development Model Based on Participant Diversification. J. Korea Plan. Assoc. 2019, 54, 42–57. [Google Scholar] [CrossRef]
  6. Sono, D.; Wei, Y.; Chen, Z.; Jin, Y. Spatiotemporal Evolution of West Africa’s Urban Landscape Characteristics Applying Harmonized DMSP-OLS and NPP-VIIRS Nighttime Light (NTL) Data. Chin. Geogr. Sci. 2022, 32, 933–945. [Google Scholar] [CrossRef]
  7. Yuan, X.; Jia, L.; Menenti, M.; Jiang, M. Consistent nighttime light time series in 1992–2020 in Northern Africa by combining DMSP-OLS and NPP-VIIRS data. Big Earth Data 2022, 6, 603–632. [Google Scholar] [CrossRef]
  8. Huang, R.; Wu, W.; Yu, K. Building consistent time series night-time light data from average DMSP/OLS images for indicating human activities in a large-scale oceanic area. Int. J. Appl. Earth Obs. Geoinf. 2022, 114, 103023. [Google Scholar] [CrossRef]
  9. Wang, C.; Wu, G.; Zhang, C. The research on the spatial structure of Chengdu-Chongqing urban agglomeration based on DMSP/OLS night light data. Urban Dev. Res. 2015, 22, 20–24. [Google Scholar]
  10. Dong, H.; Li, R.; Li, J.; Li, S. Spatial and Temporal Pattern of Urban Expansion of Three Urban Agglomeration in China Based on Integrated Data of DMSP-OLS and NPP-VIIRS. J. Geoinf. Sci. 2020, 22, 1161–1174. [Google Scholar]
  11. Zhang, Z.; Liu, Y. Spatial Expansion and Correlation of Urban Agglomeration in the Yellow River Basin Based on Multi-Source Nighttime Light Data. Sustainability 2022, 1, 9359. [Google Scholar] [CrossRef]
  12. Wang, J.; Qium, S.; Du, J.; Meng, S.; Wang, C.; Teng, F.; Liu, Y. Spatial and Temporal Changes of Urban Built-Up Area in the Yellow River Basin from Nighttime Light Data. Land 2022, 11, 1067. [Google Scholar] [CrossRef]
  13. Qiu, C.; Li, Y.; Feng, Y. The ecological appropriateness and optimization of urban land expansion space in Guiyang City. Appl. Ecol. J. 2015, 26, 2777–2784. [Google Scholar] [CrossRef]
  14. Xiong, H.; Zheng, B.; Jia, L. The driving force and constraints are expanded in my country’s urban space. Econ. Geogr. 2016, 36, 82–88. [Google Scholar]
  15. Shi, H.; Wu, W.; Li, Y.; Liu, J.; Wan, Z. The central city of the Yellow River Basin in the Yellow River Basin based on night lighting image data expands and power factor analysis. China Desert 2021, 41, 235–248. [Google Scholar]
  16. Liu, H.; Zhang, Y.; Wang, H.; Shi, P. Research on urban spatial expansion characteristics and driving factors in inter-provincial boundary area:A case study of the Jin-Shaanxi-Yu Yellow River Golden Triangle. Urban Issues 2021, 22–32. [Google Scholar] [CrossRef]
  17. Gao, M.; Zhou, Q. Analysis of the influence of the scale of urban scale on green growth-research on experience based on 266 cities in China. J. Hebei Norm. Univ. Natl. 2023, 43, 68–79. [Google Scholar]
  18. Yang, C.; Zhao, S. Scaling of Chinese urban CO2 emissions and multiple dimensions of city size. Sci. Total Environ. 2022, 857, 159502. [Google Scholar] [CrossRef]
  19. Li, Y.; Huang, Q.; Cao, W. Measurement of Urban Efficiency and Scale Coordination in the Pan-Yangtze River Delta Region. Hum. Geogr. 2017, 32, 124–130. [Google Scholar]
  20. Xu, M.; Li, S.; Zhang, Y. Study on Coordination Degree of Urban Scale and Benefit in Dunhua City. World Geol. 2022, 41, 428–436. [Google Scholar]
  21. Zhu, C.; Zhong, S.; Long, Y.; Yan, D. The Time and Space Evolution of Ecosystem Services in the Yellow River Basin and Its Driving Force [J/OL]. Ecological Magazine: 1–15. Available online: http://kns.CNKI.NET/KCMS/detail/21.1148.q.20230410.1449.016.html (accessed on 3 June 2023).
  22. Fang, C. The urban agglomeration of the Yellow River Basin forms a developed spatial organization structure and high-quality development. Econ. Geogr. 2020, 40, 1–8. [Google Scholar] [CrossRef]
  23. Ren, B.; Zhang, C. The open development drive research of high-quality development and ecological environmental protection coupling in the Yellow River Basin. Ningxia Soc. Sci. 2023, 3, 133–139. [Google Scholar]
  24. Du, H.; Wei, W.; Zhang, X.; Ji, X. The evolution and influencing factors of energy consumption of energy consumption in the Yellow River Basin-based on DMSP/OLS and NPP/VIIRS night light data. Geogr. Res. 2021, 40, 2051–2065. [Google Scholar]
  25. Li, M.; Wang, C.; Liu, H.; Wang, R.; Yu, S. Quality Evaluation of Urban Development and Characteristics of Spatial Connection Network in the Yellow River Basin. Econ. Geogr. 2021, 41, 84–93. [Google Scholar]
  26. Si, L.; Wang, C. Regional Economic Disparities, Dynamic Evolution and Convergence in China’s Urban Agglomeration: A Study Based on Nighttime Lighting Data of Ten Urban Agglomeration. Shanghai Econ. Res. 2021, 10, 38–52. [Google Scholar] [CrossRef]
  27. Wang, L.; Feng, C. Spatial Expansion Pattern and Its Dynamic Mechanism of Beijing-Tianjin-Hebei Urban Agglomeration in Transition: Based on Night Light Data. Geogr. J. 2016, 71, 2155–2169. [Google Scholar]
  28. Zhang, L.; Liu, S. Urban scale benefit analysis of Hubei Province based on grey relational comprehensive analysis. Stat. Decis.-Mak. 2005, 19, 88–89. [Google Scholar]
  29. Zhang, X.; Zhang, Z. Urban scale benefit analysis of Guangxi based on grey relational comprehensive analysis. J. Guangxi Univ. (Philos. Soc. Sci.) 2010, 32, 1–5. [Google Scholar] [CrossRef]
  30. Huang, Q.; Cao, W. Spatial-temporal pattern evolution of urban benefits in the Pan-Yangtze River Delta. Urban Issues 2016, 10, 44–50. [Google Scholar] [CrossRef]
  31. Chen, M.; Lu, D.D.; Zhang, H. Comprehensive Measurement and Dynamic Factor Analysis of Urbanization in China. J. Geogr. 2009, 64, 387–398. [Google Scholar]
  32. Wang, F.; Mao, A.; Li, H. Measurement of Urbanization Quality and Analysis of Spatial Differences in Shandong Province Based on Entropy Method. Geogr. Sci. 2013, 33, 1323–1329. [Google Scholar]
  33. Sun, H.; Li, X.; Ming, L.H. Spatial Expansion and Correlation Studies of Urban Habitat Activities in China: Based on Integrating Remote Sensing Data of DMSP/OLS and NPP/VIIRS Night Lighting. Resour. Dev. Mark. 2021, 37, 1427–1432. [Google Scholar]
  34. Li, H.; Gao, W. Grey Correlation Analysis of the Impact of China’s Aging Population on Consumption Structure. Popul. Dev. 2008, 14, 67–72. [Google Scholar]
  35. Wang, R.; Chen, Y. Characteristics of Kuznets Curve and Grey Correlation Analysis of Its Genesis in China. Popul. Resour. Environ. 2005, 2, 42–47. [Google Scholar]
  36. Wang, J.; Xu, C. Geodetector: Principles and Prospects. J. Geogr. 2017, 72, 116–134. [Google Scholar]
  37. Yang, Y.Q.; Li, Z.I.Q.I.; Kang, J.I.N.; Wang, Y.G.; Huang, X.; Sun, Y.T.; Wang, S.F. Analysis of watershed water pollution impact factors based on geographical detector. Environ. Sci. Technol. 2023, 46, 176–183. [Google Scholar]
  38. Liu, L.; Yu, S.; Zhang, H.; Wang, Y.; Liang, C. Analysis of Land Use Change Drivers and Simulation of Different Future Scenarios: Taking Shanxi Province of China as an Example. Int. J. Environ. Res. Public Health 2023, 20, 1626. [Google Scholar] [CrossRef]
  39. Zhang, Q.; Shen, J. Spatiotemporal heterogeneity and driving mechanisms of water resources carrying capacity for sustainable development of Guangdong Province in China. J. Clean. Prod. 2023, 412, 10929. [Google Scholar]
  40. Li, J.; Liu, Y.; Yang, Y.; Liu, J. Study on Spatiotemporal Evolution Characteristics and Driving Factors of Urban Construction Land in Beijing-Tianjin-Hebei Region from 1985 to 2015. Geogr. Res. 2018, 37, 37–52. [Google Scholar]
  41. Liu, H.; Zhang, L.; Wang, W. Spatial pattern and influencing factors of county urbanization in China’s inter-provincial border areas. Geogr. J. 2023, 78, 1408–1426. [Google Scholar]
  42. Wang, J.; Li, H. Analysis of spatial-temporal differentiation characteristics and influencing factors of economy in the Yellow River Basin. People’s Yellow River 2022, 44, 1–6+31. [Google Scholar]
  43. Dong, Y.; Fan, B.; Li, S.; Shan, J. Ecological Economy in the Yellow River Basin from the Perspective of Ecological Civilization. Ecol. Econ. 2022, 38, 217–222. [Google Scholar]
  44. Wang, Q.; Cui, L.; Yan, H. Spatial Heterogeneity of Influencing Factors of Regional Economic Disparities in the Yellow River Basin: Empirical Study Based on MGWR Model. Reg. Res. Dev. 2023, 42, 7–13. [Google Scholar]
  45. Miao, C.; Zhao, H.; Zhang, B. High-quality Development of the Economic, Social and Ecological Trinity of the Yellow River Basin-Based on the Investigation of 8 Provinces, Autonomous Regions and 79 Prefectures and Municipalities. Open Guide 2022, 3, 27–39. [Google Scholar] [CrossRef]
  46. He, X.; Wang, S. Analysis of spatiotemporal characteristics and driving factors of urban spatial expansion in China. J. Wuhan Univ. Technol. 2022, 35, 72–83. [Google Scholar]
  47. Liu, J.; Chen, Y. Spatiotemporal Evolution and Driving Factors of Urban Spatial Expansion in China. Urban Probl. 2018, 6, 20–28. [Google Scholar] [CrossRef]
  48. Chen, H.; Zeng, B.; Guo, H. Spatio-temporal differentiation and influencing factors of county economy in the Yellow River Basin-Test from nighttime light data. Econ. Geogr. 2022, 42, 37–44. [Google Scholar] [CrossRef]
  49. Yao, S.; Chen, S.; Wu, J.; Zhang, Y.; Chen, Z. Exploration of Several Spatial Expansion Laws of Land Use in Large Cities in China: Suzhou City, for example. Geography 2009, 29, 15–21. [Google Scholar]
  50. Hong, S.; Hui, E.C.M.; Lin, Y. Relationships between carbon emissions and urban population size and density, based on geo-urban scaling analysis: A multi-carbon source empirical study. Urban Clim. 2022, 46, 101337. [Google Scholar] [CrossRef]
  51. Zhang, W.; Wang, Y.; Li, J.; Hao, Z. Analysis of the Coordinated Network of Ecological Protection and High-Quality Economic Development in the Yellow River Basin. Ecol. Econ. 2022, 38, 179–189. [Google Scholar]
  52. Zhou, C.; Tang, C.; Zhang, X.; Zhou, L. The Yellow River Basin urban agglomeration of the Yellow River Basin in the Yellow River Basin at night Economic and Space Evolution and Driving Factors. Resour. Environ. Arid. Areas 2023, 37, 28–36. [Google Scholar] [CrossRef]
  53. Zhang, Z.; Zhang, J.; Liu, L.; Gong, J.; Li, J.; Kang, L. Spatial–Temporal Heterogeneity of Urbanization and Ecosystem Services in the Yellow River Basin. Sustainability 2023, 15, 3113. [Google Scholar] [CrossRef]
Figure 1. Overview of the Yellow River Basin.
Sustainability 15 13747 g001
Figure 2. Spatiotemporal expansion process of the urban space in prefecture-level cities in the Yellow River Basin from 2000 to 2020.
Sustainability 15 13747 g002
Figure 3. The change of the urban spatial expansion speed of prefecture-level cities in the Yellow River Basin from 2000 to 2020.
Sustainability 15 13747 g003
Figure 4. Change map of the urban spatial expansion intensity of prefecture-level cities in the Yellow River Basin from 2000 to 2020.
Sustainability 15 13747 g004
Figure 5. Comprehensive score of the economic-scale benefit of prefecture-level cities in the Yellow River Basin from 2000 to 2020.
Sustainability 15 13747 g005
Figure 6. Comprehensive score of the social-scale benefit of prefecture-level cities in the Yellow River Basin from 2000 to 2020.
Sustainability 15 13747 g006
Figure 7. Comprehensive score of the ecological-scale benefit of prefecture-level cities in the Yellow River Basin from 2000 to 2020.
Sustainability 15 13747 g007
Figure 8. Gray correlation degree between the urban spatial expansion and scale benefits of prefecture-level cities in the Yellow River Basin from 2000 to 2020.
Sustainability 15 13747 g008
Table 1. Comprehensive index system of the urban-scale benefit level in the Yellow River Basin.
SubsystemEvaluating IndicatorIndex AttributeComprehensive Weight
economic scope benefitRegional GDP (billions)+0.119
Per capita GDP (yuan)+0.088
The ratio of the output value of the second and third industries to the GDP (%)+0.005
Science and technology investment (CNY ten thousand)+0.227
Social-scale benefitPublic library book collection (ten thousand volumes)+0.161
Number of beds in health institutions (sheets)+0.067
Number of Internet broadband access users (thousands)+0.142
Per capita paved road area (m2)+0.046
Ecological-scale benefitGreen area (hectare)+0.115
CO2 emissions (million tons)-0.001
Domestic sewage treatment rate (%)+0.014
Domestic waste harmless treatment rate (%)+0.014
Table 2. Detection results of the driving factors of urban spatial expansion in prefecture-level cities in the Yellow River Basin.
Impact Factorsp Valueq Value
20002005201020152020
natural featureelevation X10.00 0.13 0.20 0.21 0.07 0.12
Gradient X20.00 0.04 0.08 0.01 0.12 0.01
economic development levelper capita GDP X30.00 0.25 0.22 0.26 0.50 0.51
industrial structureproportion of output value of secondary and tertiary industries to total output value X40.00 0.40 0.75 0.31 0.30 0.46
government regulation abilityfixed investment X50.00 0.34 0.30 0.28 0.23 0.20
open levelactual use of foreign investment X60.00 0.33 0.26 0.21 0.33 0.20
population sizepopulation density X70.00 0.28 0.12 0.36 0.35 0.40
Disclaimer/Publisher’s Note: The statements, opinions and data contained in all publications are solely those of the individual author(s) and contributor(s) and not of MDPI and/or the editor(s). MDPI and/or the editor(s) disclaim responsibility for any injury to people or property resulting from any ideas, methods, instructions or products referred to in the content.

