Article

Identifying and Modeling the Factors That Affect Bicycle Users’ Satisfaction

by
Kyriakos Ketikidis
1,
Apostolos Papagiannakis
1 and
Socrates Basbas
2,*
1
School of Spatial Planning and Development, Aristotle University of Thessaloniki, 54124 Thessaloniki, Greece
2
School of Rural and Surveying Engineering, Aristotle University of Thessaloniki, 54124 Thessaloniki, Greece
*
Author to whom correspondence should be addressed.
Sustainability 2023, 15(18), 13666; https://doi.org/10.3390/su151813666
Submission received: 27 July 2023 / Revised: 31 August 2023 / Accepted: 8 September 2023 / Published: 13 September 2023

Abstract

:
The parameters that affect bicyclists’ satisfaction are of vital importance when it comes to determining the reasons that endure bicycle usage in an urban environment. This research refers to the factors that affect bicycle users’ satisfaction with the existing infrastructure in the Municipality of Thessaloniki, Greece. Bicycle dependence in Thessaloniki is relatively limited when it is compared to other European cities with similar topological and demographic characteristics. This article aims to determine the most suitable measures that policymakers should implement to enhance bicycle infrastructure. The data collection process was realized through an online questionnaire survey addressed to the bicycle organizations and groups that are situated in Thessaloniki. Inferential statistical analysis investigated the dependency between the perceived satisfaction and the perceived level of safety of cyclists. Ordinal and multinomial logistic regressions were applied to identify the significant problems that influenced cyclists’ satisfaction, as well as the most important improvement measures suggested by the survey participants. The findings revealed that the lack of safety and urban integration of bicycle infrastructures were the statistically significant issues affecting users’ satisfaction. The development of a safe, integrated, and interconnected bicycle network area emerges as a priority to increase cyclists’ satisfaction and daily bicycle trips in cities with low bicycle culture.

1. Introduction

Communities are shifting their interest to bicycles for various reasons, such as the small impact that bicycles have on the deterioration of air quality. In Europe, in 2014, the transport sector was responsible for 70% of greenhouse gas emissions. Bicycles tend to become the main means of transport in many cities around the world, as they offer a series of benefits for both the bicycle user and the city’s environment in general. The European Union’s (EU) goal is to reduce the percentage of environmentally harmful gas emissions by 60% until the mid-21st century compared to 1960 [1]. Bicycles play a primary role in the EU’s efforts, as the more bicycles are used for commuting, the greater the reduction of harmful gas emissions will be and the greater the impact on improving environmental conditions [2,3]. Bicycles are completely eco-friendly, and their extensive utilization can reduce the number of cars that are on the streets, thus reducing harmful gas emissions and improving the environmental parameters, especially in highly urbanized environments.
Specifically, it is estimated that if all car drivers who live within a 30 min distance from their workplace in Stockholm, Sweden, switched to cycling, it would result in 111,000 new cyclists, which statistically corresponds to an increase of 209% compared to today’s numbers. Adopting this scenario can have immediate and visible results in the quality of life, as this plan would lead to a 7% reduction in harmful NOx and BC emissions. This reduction is capable of saving several citizens’ lives, which, cumulatively, is estimated at 449 annual years [4]. Additionally, the use of bicycles can lead to indirect economic benefits for the state budget. In Stockholm, the increase in bicycle use has been estimated to lead to an improvement in citizens’ physical condition and health, resulting in a decreased need for medical care from the public health system. This will help the Municipality of Stockholm save 8.7% of the funds allocated to the healthcare sector in the annual budget [5].
Similar studies that have been conducted in the USA show that a reduction in greenhouse gas emissions can result in significant social and institutional benefits. The positive impact of reducing PM2.5 particles from 2008 to 2017 translates into earnings of around USD 270 billion for 2017. Mortality associated with these particles would have been 2.4 times higher in 2017 if vehicles continued to emit harmful particles at the same rate as in 2008 [6].
When designing a bike lane, more factors must be taken into consideration. For example, the Level of Service (LOS) that a bike lane has to offer is important for the infrastructure’s efficiency. The LOS is closely related to the density of bicycle users inside the examined bike lane, and the same logic is used for assessing the LOS of pedestrian or road networks. LOS, characterized with “A”, is the ideal condition in the network of bike lanes as it represents speed such as free flow and low vehicle density. On the other hand, LOS “F” demonstrates a completely different view of the network, where travel speed is low and vehicle density is considerably increased. LOS is highly connected with comfort and perceived satisfaction of the bicycle user because a network which is assessed with a LOS close to “A”, is more likely to increase the user’s satisfaction, thus possibly attracting more users. There are many different techniques for assessing the LOS in a bike lane and, depending on the nature of the network of bike lanes (one-way, shared spaces with pedestrians, etc.), a different method can be utilized each time. Estimating the LOS can result in operational improvements into the examined bike lane, such as changing the lane design characteristics to reduce or increase travel speed, changing the lane width for the reduction of vehicle density, and even relocating bike parking stands that cause congestion [7,8].
In the same context of identifying factors that affect the design of a bike lane, special reference must be made to the urban integration of the network of bike lanes. Bike lanes are part of a city’s urban environment, and their design must follow the urban characteristics and not try to surpass them by altering the entire scene. In cities where the existing road width is sufficient, and the road geometrical design supports the development of a bike lane, the design of a new lane is not a difficult task. On the contrary, in parts of cities, such as Thessaloniki, with narrow streets and intense slopes, the design of a new bike lane is challenging. Bike lanes need to blend into the existing urban design and respect the nature of a city’s infrastructure [9]. On this basis, measures for lane improvement can be taken to improve bicycle infrastructure. In Thessaloniki, a large part of the city was built in the early 20th century, so the basic principles of today’s urban design were not followed. As a result, in older parts of the city, the mixture between pedestrian and bicycle lanes is a common phenomenon. Pedestrian crossings can be utilized as a means of reducing encounters with bicycles, as both these users will be more aware of the existing conditions in the network [10]. All these factors indicate the importance of coexistence between urban environments and a network of bike lanes.
Moreover, since bicycle lanes are designed to be used by bike users, in many cases, the cultural background and the experience of the bicycle user need to be considered. For example, in cities such as Munich and Amsterdam, where the existing network of bike lanes is extensive, and a large number of daily trips is based on bicycles, the users tend to be more experienced and know how to adapt to the circumstances more efficiently compared to those in Thessaloniki, where the total length of bike lanes is limited, and only a few people use their bicycle every day [11,12]. Of course, this is closely related to the driving behavior of car drivers, especially in Thessaloniki, where, in many cases, bicycle lanes are on the same level as the lanes which serve vehicular traffic. The experience of being a regular bicycle rider helps those who are car drivers as well to drive safely. Furthermore, if the infrastructure of bike lanes becomes more attractive and new users start to use it, car drivers could alter their driving behavior and drive more carefully, thus respecting the other road users [13].
Important factors for the design of an efficient bicycle infrastructure include comfort and attractiveness. Both factors include the parameter of subjectiveness, so describing and analyzing them is a rather difficult task since bicycle riders have different views and assessment criteria. However, some indicators are common among bicycle riders, such as travel speed, safety, vehicle density, accessibility to important destinations, adequate lane width, and proper lighting. Some of the problems that bicyclists often face and affect their overall network evaluation include traffic conflicts, pedestrians crossing the bicycle lanes, and sudden car door openings inside the bike lane [14,15,16].
A general view of the bicycle user’s needs, which is also recorded in the present research, is that bicyclists want direct access to key destinations, and this is something they would prefer to be done through a continuous, safe, and integrated cycle network. Easy and safe access between origin and destination points is very important for existing and new bicycle riders. If an efficient level of connectivity between origin and destination points is not achieved, then the LOS of the bicycle lane is low, and attracting new users becomes a more difficult task [17,18]. An important aspect is the existence of safe parking spots near the trip destination points. Bicyclists must be able to park their bicycles in a safe place. Parking spaces are of crucial importance when it comes to the user’s perceived satisfaction, as it is a matter that many bicyclists appear to evaluate as important [19]. This issue is not properly considered in Thessaloniki, as there are very few parking spots for bicycles, and at the same time, there are many key destination points that do not have a parking spot in their nearby area. This is a problem that was raised by many participants in this research. As far as comfort is concerned, it cannot be described and analyzed with the same terms for every bicycle user. It can be concluded that traffic signs, free flow movement without obstacles, and the appropriate condition of the infrastructure are factors that are related to comfort as well as the aforementioned [20].
Although bicyclists are vulnerable road users, the use of bicycles can be generally considered safe, especially under certain conditions when travel speed is low, and road users have enough time to react in case something unexpected happens [21,22]. As far as fatalities from road accidents are concerned, it is mentioned that in Germany, between 1991 and 2011, 149,483 people lost their lives due to a road accident [23], while the USA and Italy are listed as the top countries as far as car accidents are concerned, with 12.93 and 4.87 deaths in road accidents per one million inhabitants, respectively [24]. The total number of deaths due to road accidents worldwide is approximately 1.3 million. In Europe, 6% of those who die in a road accident are cyclists. From 2010 to 2013, the number of cyclist deaths in road accidents decreased by 9%, a smaller percentage compared to the overall reduction in deaths due to road accidents, which reached 18% during the period 2010–2013 [25]. The reduction in the use of private cars and the increase in the use of bicycles reduces the exposure of cyclists in dangerous situations [26]. It has also been suggested that well-designed and appropriate cycling infrastructure can provide a safer environment for cyclists. Therefore, in countries where cycling is adequately promoted, the reduction of cycling accidents can be achieved [27,28,29,30].
The installation of separate lanes for cyclists since the 1950s has played an important role in the promotion of cycling. After the Second World War, as many European cities were in the process of rebuilding, the bike lanes became an inseparable element of a city’s structure and daily operation. In this context, the need to design bicycle lanes was inevitable [31,32,33,34]. Furthermore, as urban planning considered the basic principles of sustainability, integrated bike lanes were created worldwide. At the same time, urban road design is aimed at the provision of a safer and healthier environment. The institutional actors quickly realized that bicycle lanes could increase bicycle safety and prove to be beneficial for the function of a city’s transport system in general [35,36].
The development of new bike lanes led to the investigation of the factors that determine and affect the level of service of these lanes. Studies in the USA and in Europe have tested the importance of parameters such as the width of the bike lane, the distance between the bike lane and the lanes serving the vehicular traffic, the speed of cars, and the number of traffic lanes that are dedicated to serve private vehicles [37,38]. The findings of these studies can be characterized by the fact that the narrower the width of a bike lane, the lower the speed, resulting in motorcycle drivers and cyclists having more reaction time in case of crossing between them, thus reducing the likelihood of a traffic accident. Another way to reduce speed is to design a colored line on the pavement at intersections where there are bike lanes and lanes serving vehicular traffic. This will lead to lower speeds for cars at these points, as drivers will be alert while seeing this line [39]. Another important safety factor is the condition of the cycling infrastructure and whether it is protected from the main traffic or not. Bicycle users tend to feel safer and more satisfied when they cycle through protected bike lanes, and the cycling infrastructure is adequately maintained [40,41].
Parameters that determine the level of service of a particular bike lane are commonly considered to be the lane’s safety, the immediate connection with other basic infrastructure, comfort, the spatial integration of the bike lane into the urban environment, and a bike network which is continuous and allows the user to drive his/her bicycle without facing any obstacles or changing the bicycle course [42]. Bike lanes that are separated from the main traffic flow, have sufficient width, and are part of a greater network of bike lanes usually tend to be safer and attract more bike users. Thus, people can start to consider that using their bicycle is worth more than using their private car.
This research tries to determine the factors that affect bicycle users’ perceived satisfaction with the existing network of bike lanes in the Municipality of Thessaloniki, Greece. The focus of this specific research is on the problems that bicycle users usually face during their daily trips. In addition, this research attempts to identify the factors that tend to discourage people from using their bicycles. Finally, this research suggests special measures to improve the city’s bike lane network and to make it more efficient for its users. The research is based on an online questionnaire-based survey that was conducted between December 2022 and January 2023 in Thessaloniki. A total number of 504 bicyclists participated in the survey. The research’s main contribution consists of confirming and highlighting that the development of an integrated bicycle network that provides good accessibility to the main urban destinations and ensures the trip safety of cyclists is a prerequisite for the promotion of sustainable mobility in cities with low bicycling culture such as Thessaloniki.
The structure of this paper is as follows. Section 1 refers to the introduction, where the need to identify and model the factors that affect bicycle users’ satisfaction is emphasized. Section 2 includes the literature review and refers to respective projects and case studies worldwide. The description of the study area, the methodology used, and the design of the survey are included in Section 3. Section 4 has to do with the descriptive and inferential statistical analysis as well as the data modeling. Finally, Section 5 refers to the discussion of the results and to the conclusions of this research.

2. Literature Review

This section includes the investigation of research projects and case studies that concern the evaluation of satisfaction as perceived by bicycle users during their daily trips. It is well-known that decision makers involved in the urban planning process have decided to implement sustainable and eco-friendly transport policies. As a result, the use of bicycles is considered an effective transport mode, which is in line with the aims and objectives of the three pillars of sustainable development (social, economic, and environmental). Therefore, lots of research has been done in this field worldwide.
It must be mentioned at this point that researchers have decided that various factors are important for the user’s satisfaction. Willis, Manaugh, and El Geneidy [43] concluded in their research, which was carried out in Montreal, Canada, in 2013, that a series of parameters were described as important. In their research, the most satisfied bicyclists were those who were described as “Cycling Enthusiasts”, meaning people who cycle the longest distances and they use transit during winter. Bicycle users who belong to this category are also cycling on bicycle routes that are outside of the urban environment and, in many cases, are located in rural areas. The least satisfied users are characterized as “Active environmentalists”; they cycle year-round, and their main motivation is to exercise or to protect the environment. Furthermore, season has an important role in bicycle users’ satisfaction, as only 22% of the cyclists involved in this research declared that they cycle during winter. Winter bicyclists noted lower satisfaction rates than fall cyclists.
Other research highlight the importance of traveling distance in the user’s satisfaction [44]. For commuters who travel two hours or more every day to arrive at work, the probability that they would be satisfied is 23%. For those who travel thirty minutes or less, the respective probability is 46%.
A similar project in Shanghai, China, has brought more parameters into the discussion [45]. This specific research was conducted based on questionaries, and it concluded that bicyclists tend to be more satisfied by the cycling facility when bike lanes are wider and the existing network is well-connected. The connectivity of the bicycle network is an aspect that was highlighted as important in the research that took place in Shanghai as well as in the case study of this paper.
Other projects aiming at the determination of parameters that affect bicyclist’s satisfaction include more factors [46]. Based on this research [46], it was found that when the traveled distance is up to 8km, the bicyclist is more likely to be satisfied. Moreover, the specific research concludes that the adequate maintenance of the bicycling infrastructure is important for the user’s satisfaction. It must be mentioned that men and women do not consider the same type of facilities as important, as far as their satisfaction is concerned.
According to a study thatexamined this topic in the USA, some of the beforementioned parameters such as the quality of the existing infrastructure and the distance traveled, are important factors for user satisfaction. In addition to that, the research focuses on the social environment in the workplace and concludes that it plays a significant role in the user’s perceived satisfaction. If the working environment supports a bike-friendly policy, then bicyclists would feel more satisfied and would use their bicycles more instead of their private cars [47].

3. Materials and Methods

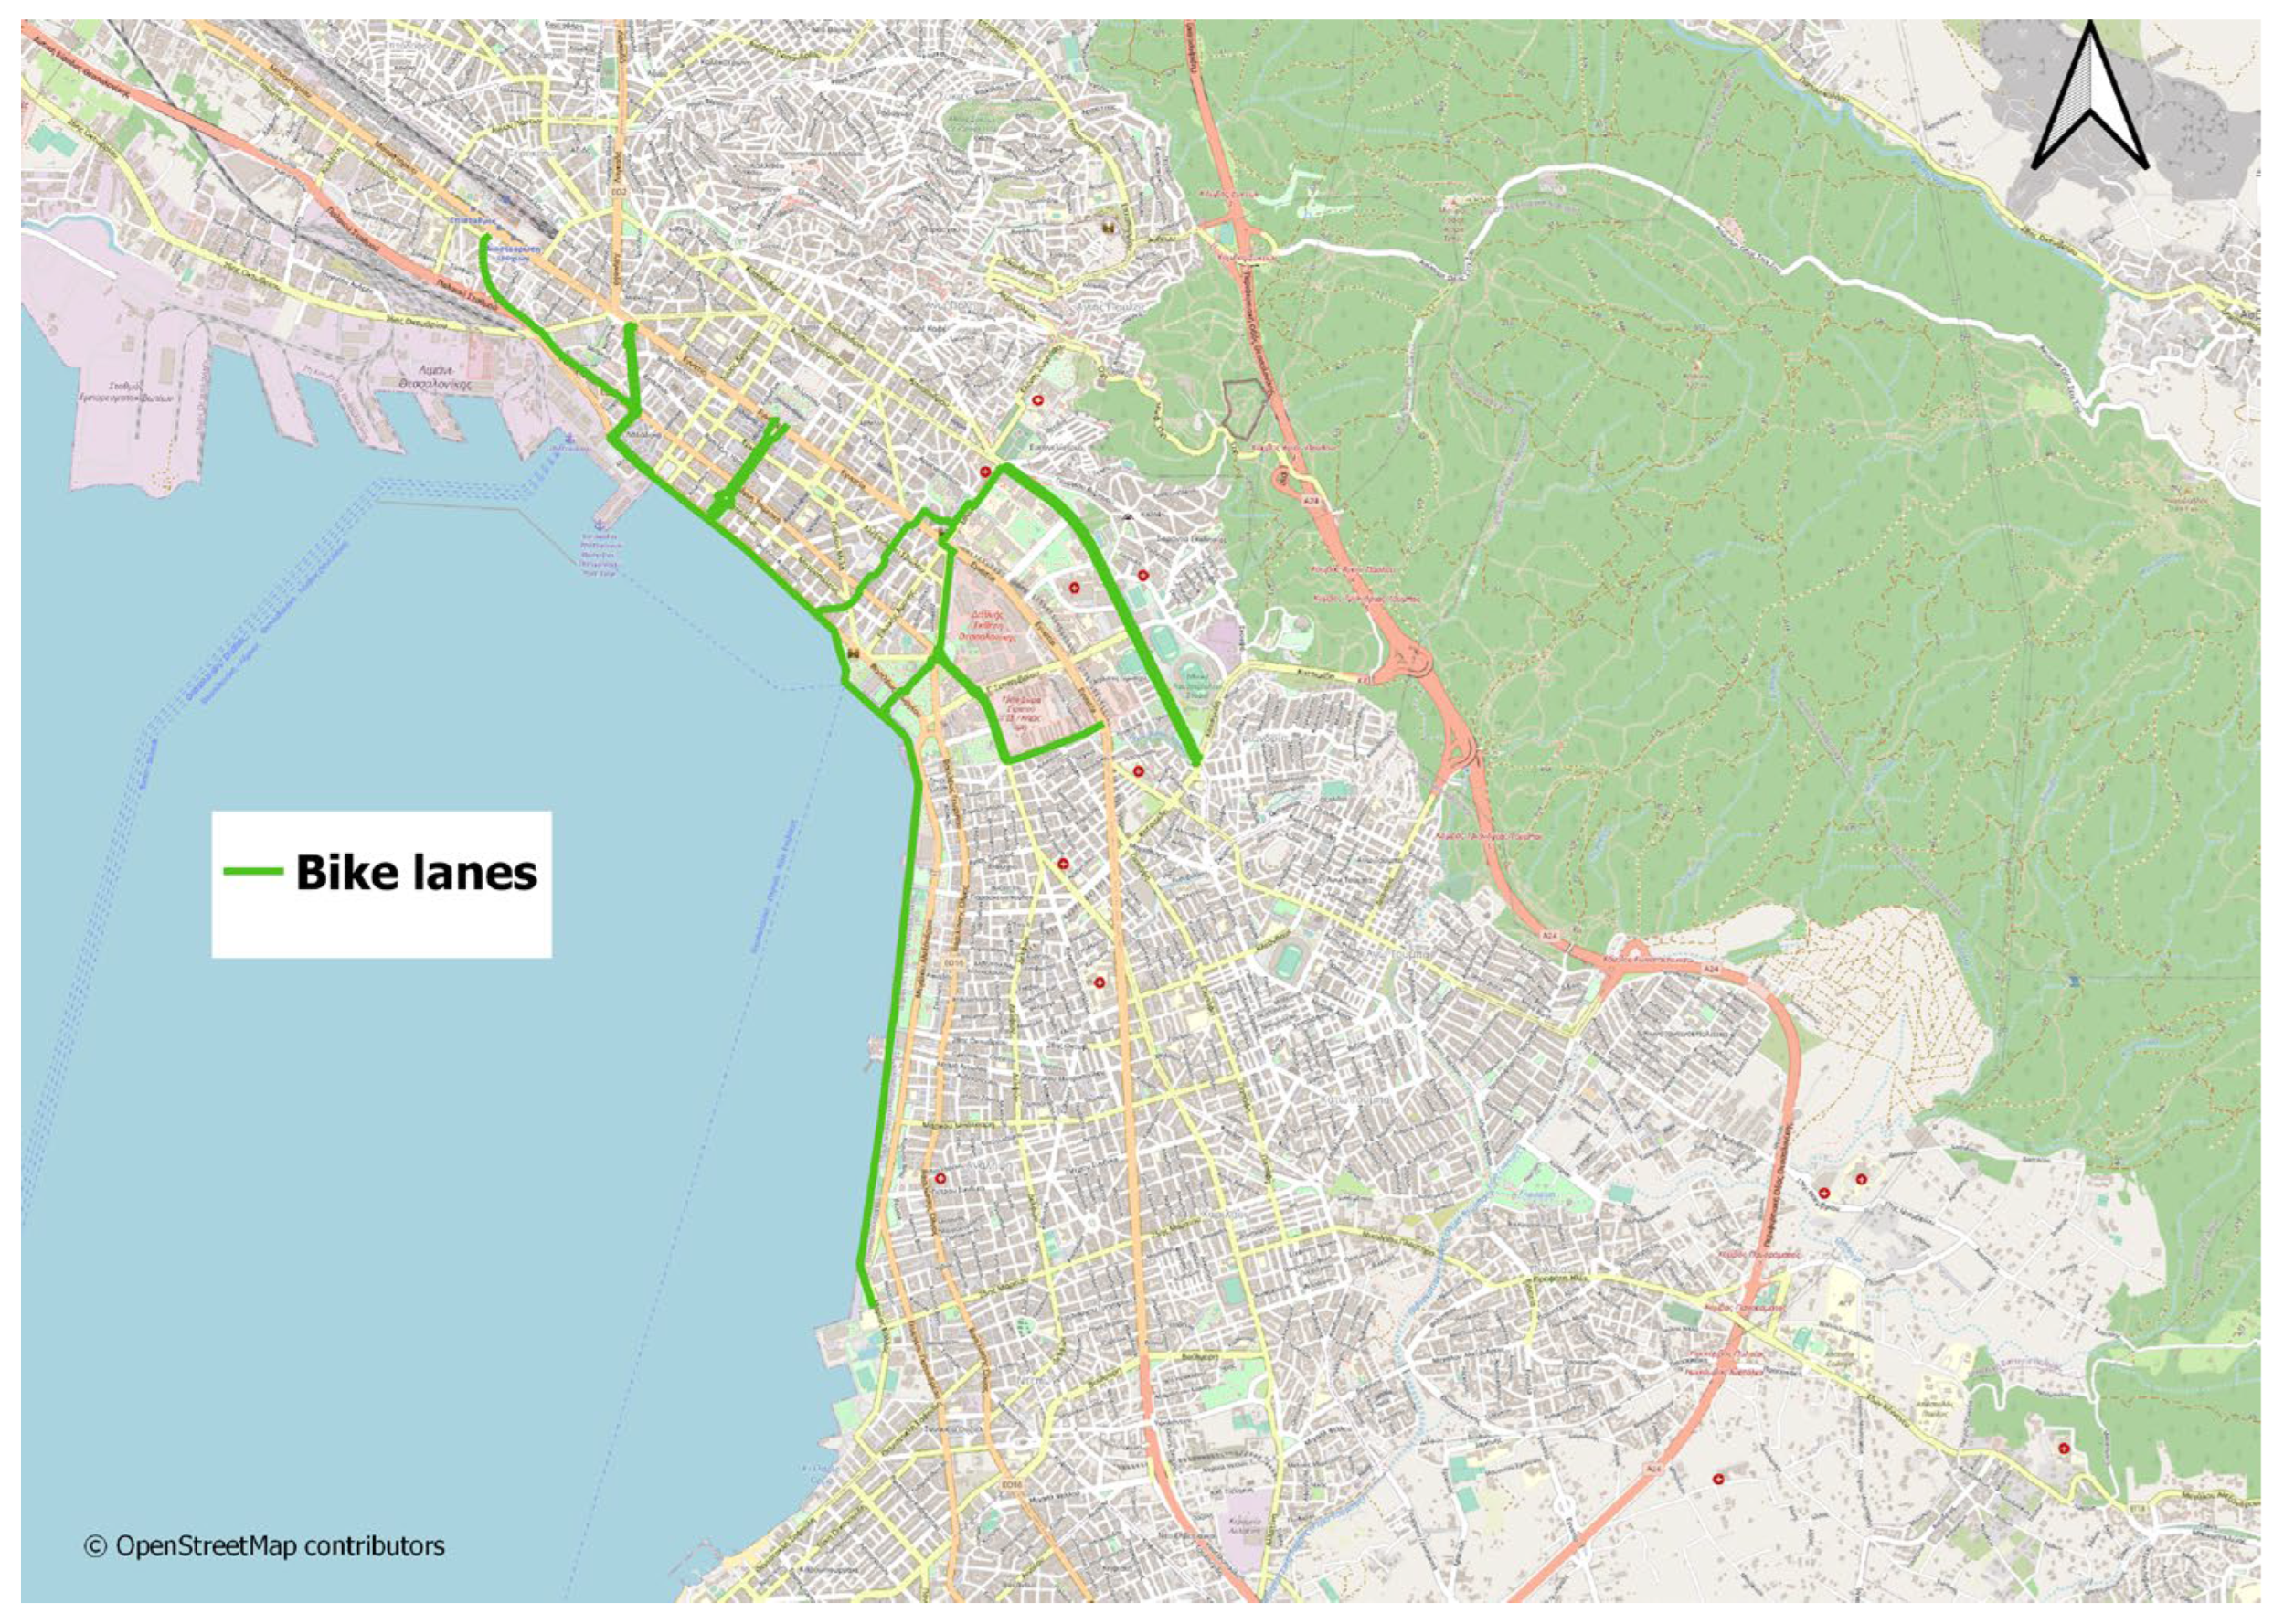
3.1. Study Area and Methodology

Thessaloniki is the second largest city in Greece, with approximately 1 million inhabitants and around 1.3 million daily vehicle trips in the Greater Area [48]. The study area includes the Municipality of Thessaloniki, which is one of the most densely populated Municipalities of Thessaloniki’s Greater Area, as more than 300,000 citizens live in it according to the latest census of 2021 [49]. The city can be considered a compact one, with the main origin and destination points being near to each other [50]. The existing public transport system is based on buses for the time being. A metro line is expected to be operational in the first months of 2024. This situation places Thessaloniki in a rather disadvantageous place among other European countries with similar urban structure and demographic characteristics [51]. Statistics from the Sustainable Urban Mobility Plan of the Municipality of Thessaloniki show a high degree of dependence on the daily trips on motorized vehicles, as 44% of these trips are made by cars, 4% by taxis, and 11% by motorcycle. It must be mentioned that only 27% of the daily trips are made on public buses. Another interesting point is that 11% of the daily trips are made on foot and 3% by bicycle, which is among the lowest among European cities [52]. Therefore, it is evident that most of the daily trips are made using private cars while at the same time, the use of environmentally friendly transport modes is not at a desirable level.
As far as the network of bike lanes in the Municipality of Thessaloniki is concerned, the first initiative to create the appropriate infrastructure for cyclists started in 2001. The main objective of the first bike lanes was to serve trips for recreation activities rather than to serve the needs of commuters. The main bike lane, with a length of 2.9 km, covers only the coastal front of the city, while the total length of the bicycle network is 12 km. The bicycle network lacks continuity, and it does not serve important destinations within the central business district (CBD) as well as within the University campuses, which are very near to the CBD. Moreover, the network consists of mono-directional and bi-directional lanes placed on the road pavement, often occupied by illegally parked cars or motorcycles.
These cycle routes are characterized by some problems (e.g., their colored surfaces need maintenance, and the vertical and horizontal signs need maintenance as well).
This research tries to investigate the reasons why cycling is not an option for many people. At the same time, it tries to investigate the necessary policies and measures that need to be taken so that cycling will be an attractive transport mode for existing and new users. The study area of this research refers to the network of bike lanes in the Municipality of Thessaloniki, as it appears in the following Figure 1:
The research methodology consists of the following steps:
  • The first step includes data collection, which was based on an online questionnaire-based survey. The questionnaire was addressed to a sample of 504 cyclists who use the bike lane network under study.
  • The second step includes the descriptive statistical analysis. More specifically, variables such as age, bicycle trip frequency, bicycle trip purpose, years of cycling experience, main trip origin-destination of cyclists, the bike lanes that cyclists frequently use, and the qualitative evaluation of the bicycle network infrastructure are considered for the purposes of the analysis. In addition, the participants stated their perceived level of satisfaction as far as the quality and safety of bicycle lanes are concerned, in a Likert scale from 1 to 5. Finally, they selected the most suitable measures that could be implemented to improve the quality of the bicycle infrastructure.
  • The third step concerns the inferential statistical analysis, focusing on the investigation of dependency between the perceived satisfaction and the perceived level of safety of cyclists.
  • The final step includes the development of ordinal and multinomial regression models to identify the significant factors that influenced cyclists’ satisfaction as far as bicycle infrastructure is concerned. We consider as factors either the problems stated by the participants or the necessary improvements suggested by the participants.

3.2. Survey Design

As already mentioned, the research objective was to determine the parameters that affect user satisfaction from the existing bike network. The sample includes 504 cyclists, which were approached through an online survey sent to volunteer groups and bicycle unions that are active in Thessaloniki. The questionnaire-based survey includes 18 questions grouped in 4 sections as follows: demographic information, mobility behavior and characteristics of cycling trips, evaluation of the bicycle network and infrastructure by the participants, and selection of improvement measures (Table 1).
Each participant had the option to select an option on a Likert scale from 1 to 5 for his/her level of satisfaction, where “1” corresponds to a very bad evaluation and “5” to a very good one. Furthermore, the participants had the option to determine the most critical parameters that influence their cycling experience and perceived satisfaction, such as the design, implementation, and maintenance of the bicycle lanes, the trip safety and comfort issues, the connectivity and geographical coverage of the network, the degree of separation from the motorized traffic and the crossing conditions in the intersections, the obstructions caused by illegally parked cars and motorcycles, the flow conflicts created with pedestrians on a bike lane that is placed on sidewalks, and the presence of parking facilities near major destination points, which are typically located in central areas and attract a large number of trips.

4. Results

4.1. Descriptive Statistical Analysis

Concerning the demographic characteristics, 43.2% of the sample were women, 37.8% were men, and 19% did not state their gender. Furthermore, most of the people who participated in this research are young people, as 27.3% of them belong to the age category of 25–34 years old. The rest of the age groups and their percentages are the following: <18 11.4%, 18–24 19.5%, 35–44 11.8%, 45–54 12.9%, 55–64 10%, >65 7.2%.
Concerning transport modes, private cars are the most used, with 19.9%. High usage rates are also observed for walking (17.1%) and bus (15.1%). Lower usage rates are found for taxis (8.2%) and electric scooters (7.2%). Interestingly, 10.8% of respondents stated that they use private cars more frequently as passengers, which is an equally high percentage compared to those who use private cars as drivers. Finally, 12.9% of the participants use their bicycles as a primary transport mode.
The main bicycle trip purposes were leisure (31.6%), commuting (12.6%), and “in the framework of work” (11.8%). Additionally, cycling was chosen for education, transport mode change, shopping, personal business, and “others” by 11%, 11%, 9.2%, 11.4%, and 1.4%, respectively. It is noteworthy that bicycles in Thessaloniki are used primarily for recreational purposes, while there is a percentage of 25% of cyclists who make their trips for work purposes.
Concerning the frequency of use, most of the participants stated a low cycling frequency. Specifically, 23.7% stated 1–2 days per week, 29.5% stated 1–3 days per month, and 18.5% less than 1 day per month. The so-called regular users correspond to 15.3% (3–5 days per week) and 13% (daily use).
Finally, most of the participants (33.3%) travel for short distances (less than 5 km weekly) or between 5–10 km (17.3%). The percentages of respondents who cycle 10–20 km, 20–35 km, and more than 35 km weekly were 21.9%, 12.5% and 14.9% respectively. It is notable that 27.4% of cyclists (27.4%) travel more than 20 Km on a weekly basis (these can be considered as users that rely on bicycles as their main transport mode).
Figure 2 presents the participants’ responses to the question regarding the main problems they face when using a bicycle lane in the Municipality of Thessaloniki. The problems refer to specific design, safety, and efficiency parameters of the bicycle network. Each participant had to choose the three major problems she/he faces when using the bicycle network.
Most responses (50.60%) indicated the vehicles illegally parked on the bicycle lane as the most prominent problem. A high percentage of the sample also identified the obstruction caused by the pedestrians who walk into the bicycle lane (37.5%), the poor maintenance of the bicycle network (33.53%), the lack of safety for cyclists when crossing an intersection (32.14%) and when they approach a bus stop (30.16%), as well as when a motorized vehicle illegally violates the bicycle lanes (30.95%). Other significant problems and deficiencies stated were the following: the lack of appropriate ramps on the pavement edge to facilitate the movement from the road to the sidewalk (27.38%); the insufficient signing and marking that is necessary to ensure clear and visible separation of the bicycle lane from road traffic (26.59%); especially in the city center; the lack of sufficient parking facilities for bicycles across the city and near the main trip destination points (26.59%); the dangerous “sudden openings” of car doors when parked along the edge of the bicycle lane (24.80%). Interestingly, a relatively low percentage of respondents (18.85%) stated the discontinuity and lack of urban integration of the existing bicycle network as an important issue compared to the other listed problems. This finding may be explained by the fact that experienced cyclists tend to also use the main road network in addition to bike lanes.
In general, it can be concluded that cyclists believe that bicycle lanes in Thessaloniki should be better designed and maintained, adequately signalized and marked, and potentially separated from the road traffic. They also emphasize the need to regulate the interactions with pedestrians on the sidewalks and with motor vehicles on the road intersections.
Figure 3 demonstrates the results of a survey question asking respondents to choose the three most important interventions that would help to upgrade the bicycle network and make it safe, efficient, and user-friendly. Most cyclists (52.58%) chose the creation of an integrated and interconnected network as the main measure of improvement. This is a surprising finding because the lack of connectivity was not among the top problems of the bicycle network previously reported. Moreover, 37.50% of the participants mentioned the implementation of secure bicycle parking spaces in areas with high trip attractions. A percentage of 37.30% emphasized the need to create physically separated bike lanes from motor vehicles, either on the sidewalk or directly adjacent to the roadway. Concerning the geometrical design, 35.52% stated the improvement of the geometric characteristics of the bike lanes at the urban intersections to avoid and minimize the conflict points with other road users, 34.52% the quality standards of the pavement of the bicycle lanes, and 29.76% the adequate and visible horizontal and vertical road signage. Finally, 31.35% and 27.78% of the respondents expressed their preference for improved accessibility to parks and recreational areas and to workplaces as well.
In conclusion, cyclists want an integrated and connected bicycle network that covers the entire city, of high-quality infrastructure, and which ensures a safe and comfortable travel experience.

4.2. Inferential Statistical Analysis

The inferential analysis was focused on examining the statistical correlation between perceived satisfaction and safety of cyclists. According to the survey findings, security emerged as a significant problem of the bicycle network in Thessaloniki. Previous research also demonstrated that the level of safety of bike infrastructures has a significant impact on user satisfaction [55,56,57].
The Spearman coefficient was applied as the variables being analyzed were ordinal [58]. The values assigned to the satisfaction and safety variables in the questionnaire ranged from 1 to 5 on a Likert scale, where 1 corresponds to the worst scenario and 5 to the best for both variables. The hypotheses tested under the level of statistical significance a = 0.05 were the following:
Null Hypothesis (H0):
There is no statistically significant correlation between the two variables, and the value of the Spearman coefficient is r = 0.
Alternative Hypothesis (H1):
There is a statistically significant correlation between the two variables, and the value of the Spearman coefficient is r ≠ 0.
As shown in Table 2, there is a statistically significant correlation between the variable’s satisfaction and safety at level a = 0.01. The value of the Spearman coefficient is r = 0.317, indicating a moderate strength relationship and that an increase in perceived safety leads to a higher level of perceived cyclists’ satisfaction. However, the moderate value of the correlation also suggests that there may be other parameters that have an impact on cyclist satisfaction, and this is something that is further explored in Section 4.3.

4.3. Modeling Cyclists’ Satisfaction

4.3.1. Cyclists’ Satisfaction and Bicycle Network Problems

Multinomial logistic regression (MLR) is used to model the relationship between a categorical dependent variable with more than two categories and one or more independent variables [59]. In this research, the dependent value is the cyclists’ level of satisfaction, and the independent ones are the main problems that face on the bike network of Thessaloniki. The MLR is applied to identify the factors that have a significant effect on each level of satisfaction separately (in the Likert scale from “1: very low” to “5: very high”) and to estimate the probability of a cyclist transitioning from one level of satisfaction to another, depending on the presence or absence of any of the examined factors. The factor takes the value 1 when a specific problem has been chosen by the participants and the value 0 otherwise. It should be underlined that ordinal logistic regression is a more appropriate statistical technique when the dependent variable is ordinal or ranked [60]. However, it was not preferred because it was initially tested, but the model fit indicators (test of parallel lines) were not proven satisfactory. Instead, the MLR was applied, and the satisfactory level was treated as a categorical variable.
The multinomial statistical analysis is performed using SPSS IBM Statistics 25 [61]. Before deciding to use multinomial regression, it is important to perform statistical tests to determine whether this type of modeling is suitable for the provided data and examine if the statistical limits are exceeded. As for the model fitting results of the multinomial analysis displayed in Table 3, the sig value is 0.000 (<0.05), so the selection of this model is suitable for the provided data. Table 3 presents the appropriate statistical test to evaluate the overall model goodness-of-fit and statistical significance.
After examining the goodness-of-fit of this model, an overall conclusion regarding the significance of each of the selected problems can be drawn. Table 4 demonstrates the overall statistical importance of each of the problems selected for the purpose of the research.
Through examining Table 4, it is evident that the problems that seem to be statistically important in an overall analysis of the multinomial model are the following: Parked vehicles on bicycle lanes, Obstruction of pedestrian traffic, and Disconnected bicycle lane network. Insecurity when crossing in front of bus stops is statistically important if the level of significance is 90% (a = 0.10). These early results demonstrate the basic problems of the network of bike lanes in Thessaloniki and help us identify the parameters that need to be changed to improve it. In addition, it must be mentioned that for the level of significance 0.10, marginally statistically important is the problem of Lack of markings on the bicycle lane, as its sig value is 0.119.
The first step of the analysis is the logistic regression, where the probabilities of each level of satisfaction are modeled. The model equation providing the logistic transformation of the odds (referred to as logit) is as follows:
Log(odds) = Logit(P(Y = k)) = β0k + β1kX1 + β2kX2 + … + βpk × Xp
where:
  • k is the number of categories (in this case, k = 5 levels of satisfaction).
  • Logit (P(Y = k)) represents the log odds of the probability of the level of satisfaction being in category k.
  • β0k, β1k, β2k, …, βpk are the coefficients (parameters) to be estimated for each category.
  • X1, X2, …, Xp are the independent variables.
  • p is the total number of independent variables (eleven bicycle network problems).
Once the coefficients are estimated, we can calculate the probabilities for each category using the softmax function. For a given category k, the probability P(Y = k) is calculated as follows:
P Y = k = exp L o g i t P Y = k i = 1 k exp [ L o g i t P Y = i
Finally, the coefficients β0k, β1k, β2k, …, βpk are estimated using maximum likelihood estimation (MLE) methods. The likelihood function is maximized to find the optimal values of the coefficients that maximize the probability of observing the given data. These expressions allow us to estimate the relationship between the independent variables and the probabilities of each category in multinomial logistic regression [62].
The results that emerged from the modulization process identified the statistically significant bike network problems faced by cyclists. Specifically, the variable “Parked vehicles on bicycle lanes” is significant for the satisfaction levels “1”, “2”, and “3”. Moreover, the variable “Disconnected bicycle lane network” is significant for level “1” and marginally significant for level “2”. Regarding the level “4” that corresponds to high satisfaction, none of the evaluated problems emerged as statistically significant. This is a finding that is considered reasonable. Finally, the level of satisfaction characterized as “5” is set as the reference category for the logistic regression. These results are demonstrated in Table 5.
In Table 5, a more detailed analysis, apart from the problems that are statistically important, needs to be done. Specifically, based on the findings of column exp(B), it can be concluded that someone who has selected Parked vehicles on bicycle lanes as a problem for his/her daily routes with a bicycle is 31 times more likely to have characterized his/her satisfaction from the bike lane network with “1” in the Likert scale. Following the same logic, someone who has selected Disconnected bicycle lane network as a problem it is 7 times more likely to have characterized his/her satisfaction with the bike lane network with “1”. As for the next scale of satisfaction, the probabilities for someone to have characterized satisfaction with “2” are 24 times more possible for Parked vehicles on bicycle lanes, 0.461 for Lack of markings on the bicycle lane, and 4 for Disconnected bicycle lane network. The 0.461 index in Lack of markings on the bicycle lane is marginal since this problem is borderline significant for a level of significance of 0.10. Finally, in the last category of satisfaction (satisfaction “3”), someone who has chosen Parked vehicles on bicycle lanes is 15 times more likely to have characterized his/her satisfaction with “3”.
The equations that specify the models for log odds of the probability of satisfaction being in category k = 1 … 3 emerge from column B of Table 5 and are the following:
Logit(P(Satisfaction = 1)) = 0.093 + 3.447 × P1 − 0.142 × P2 + 0.606 × P3 − 0.306 × P4 + 1.994 × P5 − 0.11 × P6 + 0.248 × P7 − 0.412 × P8 − 0.479 × P9 + 0.210 × P10 − 0.475 × P11
Logit(P(Satisfaction = 2)) = 0.882 + 3.19 × P1 − 0.775 × P2 + 0.02 × P3 − 0.398 × P4 + 1.516 × P5 − 0.144 × P6 + 0.34 × P7 − 0.501 × P8 + 0.229 × P9 − 0.13 × P10 − 0.501 × P11
Logit(P(Satisfaction = 3)) = 0.600 + 2.744 × P1 − 0.164 × P2 − 0.218 × P3 − 0.521 × P4 + 1.037 × P5 + 0.143 × P6 − 0.451 × P7 − 0.229 × P8 + 0.374 × P9 − 0.197 × P10 − 0.595 × P11
In Equations (3)–(5) P1, …, P11 symbolize the bike network problems, which are presented in Table 6.

4.3.2. Cyclists’ Satisfaction and Expectations

Ordinal logistic models are used to predict an ordinal dependent variable from a set of independent variables (categorical, ordinal, or continuous). In this research, we developed an ordinal logistics regression to investigate the relationship between the citizen’s rating of their satisfaction regarding the bicycle network and their expectations concerning eight suggested measures to improve the existing bike infrastructure in the city of Thessaloniki. The dependent variable is the level of satisfaction measured on a 5-point Likert scale, while the eight independent variables are binary. The value 1 signifies that a specific improvement measure has been selected by the participants, while the value 0 means that has not. The model equation providing the logistic transformation of the odds is as follows:
Logit(P(Y ≤ j)) = αj − (β₁X₁ + β₂X₂ + … + βₚXₚ)
where:
  • P(Y ≤ j) represents the probability of being at one level (or lower) of satisfaction versus being at the level above it.
  • aj is the intercept corresponding to the level of satisfaction j.
  • β₁, β₂, …, βₚ are the coefficients corresponding to the predictor variables.
  • X₁, X₂, …, Xₚ are a set of predictor variables (eight proposed measures).
  • J = 1, …, k−1, where k is the number of levels of satisfaction (k = 5).
In the case of possible improvements and perceived satisfaction, statistical tests for the selection of the ordinal model were also performed. The first statistical test is the test of parallel lines, and its results are demonstrated in Table 7.
Based on the results of the test of parallel lines, it can be concluded that the null hypothesis can be confirmed. Sig value is above the level of significance (0.451 > 0.05), which means that the slope coefficients of the variables are the same and linear, so the model is suitable for the implementation of the ordinal analysis.
The next table (Table 8) displays the model fitting information of the model. It is evident that the sig value is below the level of significance (0.000 < 0.005), so the given data can describe the problem appropriately using an ordinal regression model.
After understanding that the use of ordinal regression for the analysis of the possible improvements and the satisfaction, is an accurate choice of model, the next step was the extraction of the necessary results. These results determine which improvement suggestions would possibly improve the user’s perceived satisfaction. The results are demonstrated in the following table (Table 9).
The ordinal regression identified the improvement measures that were statistically significant (p < 0.05), such as the variable S1, “Create an integrated and interconnected bicycle network within the city area”, and the factor S8, “Provide direct access to workplace”. The indexes “1” and “0” at every improvement indicate whether someone has or has not selected this specific measure (selected = 1, not selected = 0).
The positive sign on the estimate column of the variable S1 signifies that users with lower satisfaction (levels 1, 2, and 3) are more likely to declare the S1 intervention as a priority. On the contrary, cyclists with higher satisfaction (levels 4 and 5) are more likely to choose the S8 measure since the estimated parameter has a negative sign. In other words, dissatisfied cyclists would expect better connectivity to the network, while satisfied users would prefer better accessibility to the workplace.
Therefore, the ordinal logistic analysis confirms the main findings of the multinomial regression. For example, the equation that describes the log odds of the probability of satisfaction being in a category less than j = 3 emerges from the column entitled “Estimate” of Table 9 as follows:
Logit(P(Satisfaction ≤ 3)) = 1.073 − (0.68 × S1 − 0.12 × S2 − 0.125 × S3 + 0.104 × S4 + 0.109 × S5 − 0.135 × S6 + 0.116 × S7 − 0.53 × S8)
In Equation (7) and in the contents of Table 9, S1, …, S8 symbolize the proposed measures for the improvement of the bicycle network in Thessaloniki, which were evaluated by the cyclists (Table 10).

5. Discussion and Conclusions

This research aimed to investigate and determine the factors that affect cyclists’ satisfaction with the existing bicycle lanes in the city of Thessaloniki, as well as their expectations concerning future improvements. The findings highlight the significant problems regarding the design, construction, and operation of the bicycle infrastructure. Furthermore, they reveal the necessary improvements for the development of a safe, efficient, and user-friendly bicycle network.
The data analysis revealed that lack of safety, continuity, and urban integration were statistically significant issues affecting users’ satisfaction. Moreover, it is demonstrated that lack of safety is mostly dependent on illegal car parking and the conflicts between pedestrians and bicycle riders on the bike lanes. Finally, the development of an integrated and interconnected bicycle network within the city area emerges as a priority to increase cyclists’ satisfaction and bike trips.
A key outcome of this research could be implemented in the city of Thessaloniki, and decision makers may utilize some of the findings to develop more sustainable infrastructure. Thessaloniki lacks a reliable, user-friendly network of bicycle lanes, and following the example of European cities with the same characteristics, the city’s responsible authorities should consider upgrading the bike lanes. A basic step for the improvement of the infrastructure is to identify the target group that the bicycle network refers to. In addition, identify their characteristics, understand their needs, find out what motivates them to use bicycles, and examine the problems that the network has and constitute a barrier towards the extended use of bicycles. This research tries to provide answers to most of the aforementioned parameters and clarifies the overall view of the current situation for bicyclists in Thessaloniki. Decision and policy makers could utilize this project to examine the problems that bicyclists face, the parameters that affect their satisfaction, and categorize the improvements that need to be made for the upgrade of the network. A categorical order of the most important actions can also be organized based on the factors that appear to be statistically important for bicyclists.
Furthermore, the respective authorities could benefit from the findings of this research in a future reconsideration of the bike lane network in Thessaloniki. The city’s transport system needs to be more flexible and resilient to changes. Thessaloniki was not able to adapt to the rapid changes that the SARS-CoV-2 pandemic brought, and the city’s transport environment remained, overall, the same as before the pandemic. In other cities, authorities understood the importance of bicycle lanes for the everyday life of citizens and developed new and temporary bike lanes, and in many cases, they extended their network [63]. In Thessaloniki, the only example close to this was the creation of the bike lane in the eastern part of the Municipality of Thessaloniki (Konstantinou Karamanli Avenue), but this bike lane is not in operation anymore. The present research demonstrates the low level of satisfaction that people express about the bike lane network as well as the need for improvements. These results can offer insight to decision makers, so to design and implement a viable, sustainable, attractive, and efficient bicycle lane network in the city.
Previous studies also demonstrated the importance of similar factors in the cyclist’s positive perception of the bike paths. According to Calvey, Shackleton, Taylor, and Llewellyn [64], the condition of the bike path, the constant maintenance of the network, the material from which the infrastructure is created, and the adequate lighting during the night are important parameters that determine the user’s satisfaction. Hull and Holleran [65] have demonstrated that problems such as the width of the bike lane, the sudden opening of the car doors, the proper lighting, the constant maintenance of the infrastructure, and the materials that it is constructed from are parameters that users consider as important ones. Furthermore, Gao, Sha, Huang, Hu, Tong, and W. Jiang [66] reported that the perception of vibrations caused by bicycle tires and the quality of the bike lane pavement should be evaluated when considering cyclist comfort. Finally, the study of Katsavounidou, Papagiannakis, Christakidis, and Mavros [67] for the city of Thessaloniki confirmed the negative assessment of the cycling infrastructure by users and their low satisfaction with the main design features.
Following the above discussion, a new policy concerning the bike lanes in Thessaloniki should be implemented. The development of a bicycle master plan is necessary with the goal of expanding the bicycle network so as to connect the entire city and to provide safe, fast, and easy accessibility to areas with high trip attractions, such as workplaces, parks, recreational areas, and university campuses. In addition, as safety has proven to be an important factor for cyclists, interventions to improve the design features of bike lanes should include providing physically separated cycle tracks on the sidewalk or adjacent to the roadway, improving road intersection design for safe bicycle crossing, installing adequate and clear horizontal and vertical road signage, enhancing the technical standards of the pavement material, and ensuring good maintenance of the infrastructure.
The implementation of a bicycle network that is attractive and user-friendly will contribute to reducing car use and achieving a higher degree of sustainability and resilience for the city of Thessaloniki. The findings of this research can provide policy makers with an inside understanding of cyclists’ satisfaction and expectations and support future decisions on bicycle network development.
Future research will include a deeper analysis aiming to identify the specific factors related to the design and implementation of the bicycle network, which influence the perceived level of safety for cyclists. Further research is also needed to investigate and model public willingness to adopt cycling as an alternative transport mode when bike lane infrastructure quality is improved.

Author Contributions

Conceptualization, K.K. and A.P.; methodology, A.P. and K.K.; validation, A.P.; formal analysis, A.P. and S.B.; investigation, A.P.; data curation, A.P.; writing—original draft preparation, K.K.; writing—review and editing, K.K., A.P. and S.B. All authors have read and agreed to the published version of the manuscript.

Funding

This research received no external funding.

Institutional Review Board Statement

Not applicable.

Informed Consent Statement

Informed consent was obtained from all subjects involved in the study.

Data Availability Statement

Data is available based on reasonable request.

Conflicts of Interest

The authors declare no conflict of interest.

References

  1. European Commission. Available online: https://climate.ec.europa.eu/eu-action/transport-emissions_en (accessed on 12 December 2022).
  2. Kazancoglu, Y.; Ozbiltekin-Pala, M.; Ozkan-Ozen, Y.D. Prediction and evaluation of greenhouse gas emissions for sustainable road transport within Europe. Sustain. Cities Soc. 2021, 70, 102924. [Google Scholar] [CrossRef]
  3. Nikolaou, P.; Basbas, S.; Politis, I.; Borg, G. Trip and Personal Characteristics towards the Intention to Cycle in Larnaca, Cyprus: An EFA-SEM Approach. Sustainability 2020, 12, 4250. [Google Scholar] [CrossRef]
  4. Johansson, C.; Lövenheim, B.; Schantz, P.; Wahlgren, L.; Almström, P.; Markstedt, A.; Strömgren, M.; Forsberg, B.; Sommar, J.N. Impacts on air pollution and health by changing commuting from car to bicycle. Sci. Total Environ. 2017, 584–585, 55–63. [Google Scholar] [CrossRef] [PubMed]
  5. Kriit, H.K.; Williams, J.S.; Lindholm, L.; Forsberg, B.; Sommar, J.N. Health economic assessment of a scenario to promote bicycling as active transport in Stockholm, Sweden. BMJ Open 2019, 9, e030466. [Google Scholar] [CrossRef] [PubMed]
  6. Choma, E.F.; Evans, J.S.; Gómez-Ibáñez, J.A.; Di, Q.; Schwartz, J.D.; Hammitt, J.K.; Spengler, J.D. Health benefits of decreases in on-road transportation emissions in the United States from 2008 to 2017. Proc. Natl. Acad. Sci. USA 2021, 118, e2107402118. [Google Scholar] [CrossRef]
  7. Nikiforiadis, A.; Basbas, S.; Mikiki, F.; Oikonomou, A.; Polymeroudi, E. Pedestrians-Cyclists Shared Spaces Level of Service: Comparison of Methodologies and Critical Discussion. Sustainability 2021, 13, 361. [Google Scholar] [CrossRef]
  8. Kazemzadeh, K.; Bansal, P. Electric bike level of service: A review and research agenda. Sustain. Cities Soc. 2021, 75, 103413. [Google Scholar] [CrossRef]
  9. Dondi, G.; Simone, A.; Lantieri, C.; Vignali, V. Bike Lane Design: The Context Sensitive Approach. Procedia Eng. 2011, 21, 897–906. [Google Scholar] [CrossRef]
  10. Mastora, C.; Paschalidis, E.; Nikiforiadis, A.; Basbas, S. Pedestrian Crossings as a Means of Reducing Conflicts between Cyclists and Pedestrians in Shared Spaces. Sustainability 2023, 15, 9377. [Google Scholar] [CrossRef]
  11. Clark, C.; Mokhtarian, P.; Circella, G.; Watkins, K. User Preferences for Bicycle Infrastructure in Communities with Emerging Cycling Cultures. Transp. Res. Rec. J. Transp. Res. Board 2019, 2673, 89–102. [Google Scholar] [CrossRef]
  12. Sirkis, A. Bike Networking in Rio: The challenges for non-motorised transport in an automobile-dominated government culture. Local Environ. 2000, 5, 83–95. [Google Scholar] [CrossRef]
  13. Paschalidis, E.; Oikonomou, A.; Konstantinidou, M.N.; Basbas, S.; Politis, I. The relationship of bicycle use and aggressive driving behaviour: A latent variable model approach. Transp. Lett. 2022, 1–14. [Google Scholar] [CrossRef]
  14. Wegman, F.; Zhang, F.; Dijkstra, A. How to make more cycling good for road safety? Accid. Anal. Prev. 2012, 44, 19–29. [Google Scholar] [CrossRef] [PubMed]
  15. Kamel, M.B.; Sayed, T.; Bigazzi, A. A composite zonal index for biking attractiveness and safety. Accid. Anal. Prev. 2020, 137, 105439. [Google Scholar] [CrossRef] [PubMed]
  16. Hunt, J.D.; Abraham, J.E. Influences on bicycle use. Transportation 2007, 34, 453–470. [Google Scholar] [CrossRef]
  17. Lowry, M.B.; Furth, P.; Hadden-Loh, T. Prioritizing new bicycle facilities to improve low-stress network connectivity. Transp. Res. Part A Policy Pract. 2016, 86, 124–140. [Google Scholar] [CrossRef]
  18. Lowry, M.; Loh, T.H. Quantifying bicycle network connectivity. Act. Living Res. Equity Act. Living. 2017, 95, S134–S140. [Google Scholar] [CrossRef]
  19. Heinen, E.; Buehler, R. Bicycle parking: A systematic review of scientific literature on parking behaviour, parking preferences, and their influence on cycling and travel behaviour. Transp. Rev. 2019, 39, 630–656. [Google Scholar] [CrossRef]
  20. McNeil, N.; Monsere, C.M.; Dill, J. Influence of Bike Lane Buffer Types on Perceived Comfort and Safety of Bicyclists and Potential Bicyclists. Transp. Res. Rec. J. Transp. Res. Board 2015, 2520, 132–142. [Google Scholar] [CrossRef]
  21. Paudel, M.; Yap, F.F.; Rosli, T.B.M.; Tan, K.H.; Xu, H.; Vahdati, N.; Butt, H.; Shiryayev, O. A computational study on the basis for a safe speed limit for bicycles on shared paths considering the severity of pedestrian head injuries in bicyclist-pedestrian collisions. Accid. Anal. Prev. 2022, 176, 106792. [Google Scholar] [CrossRef]
  22. Carvajal, G.A.; Sarmiento, O.L.; Medaglia, A.L.; Cabrales, S.; Rodríguez, D.A.; Quistberg, D.A.; López, S. Bicycle safety in Bogotá: A seven-year analysis of bicyclists’ collisions and fatalities. Accid. Anal. Prev. 2020, 144, 105596. [Google Scholar] [CrossRef] [PubMed]
  23. OEC—International Transport Forum, ‘Road Safety Report-Germany’. 2021. Available online: https://www.itf-oecd.org/sites/default/files/germany-road-safety.pdf (accessed on 30 August 2023).
  24. OECD. Available online: https://data.oecd.org/transport/road-accidents.htm (accessed on 14 December 2022).
  25. Levulytė, L.; Baranyai, D.; Török, Á.; Sokolovskij, E. Bicycles’ role in road accidents a review of literature. Transp. Telecommun. J. 2016, 17, 122–127. [Google Scholar] [CrossRef]
  26. McLaughlin, K.A.; Glang, A. The Effectiveness of a Bicycle Safety Program for Improving Safety-Related Knowledge and Behavior in Young Elementary Students. J. Pediatr. Psychol. 2010, 35, 343–353. [Google Scholar] [CrossRef] [PubMed]
  27. Vanparijs, J.; Panis, L.I.; Meeusen, R.; de Geus, B. Exposure measurement in bicycle safety analysis: A review of the literature. Accid. Anal. Prev. 2015, 84, 9–19. [Google Scholar] [CrossRef] [PubMed]
  28. Nanayakkara, P.K.; Langenheim, N.; Moser, I.; White, M. Do Safe Bike Lanes Really Slow Down Cars? A Simulation-Based Approach to Investigate the Effect of Retrofitting Safe Cycling Lanes on Vehicular Traffic. Int. J. Environ. Res. Public Health 2022, 19, 3818. [Google Scholar] [CrossRef] [PubMed]
  29. MacNaughton, P.; Melly, S.; Vallarino, J.; Adamkiewicz, G.; Spengler, J.D. Impact of bicycle route type on exposure to traffic-related air pollution. Sci. Total. Environ. 2014, 490, 37–43. [Google Scholar] [CrossRef]
  30. Buehler, R.; Pucher, J. Making public transport financially sustainable. Transp. Policy 2011, 18, 126–138. [Google Scholar] [CrossRef]
  31. Longhurst, J. Bike Battles: A History of Sharing the American Road; University of Washington Press: Seattle, WA, USA, 2015. [Google Scholar]
  32. Mapes, J. Pedaling Revolution; Portland State University: Portland, OR, USA, 2009. [Google Scholar]
  33. Thomas, J.M.; Dillard, A.D. Redevelopment & race: Planning a finer city in postwar Detroit. Urban Hist. Rev. 1997, 16, 53. [Google Scholar]
  34. Antrop, M. The concept of traditional landscapes as a base for landscape evaluation and planning. The example of Flanders Region. Landsc. Urban Plan. 1997, 38, 105–117. [Google Scholar] [CrossRef]
  35. Chen, L.; Chen, C.; Srinivasan, R.; McKnight, C.E.; Ewing, R.; Roe, M. Evaluating the Safety Effects of Bicycle Lanes in New York City. Am. J. Public Health 2012, 102, 1120–1127. [Google Scholar] [CrossRef]
  36. Smith, R.L., Jr.; Walsh, T. Safety impacts of bicycle lanes. Transp. Res. Rec. 1988, 1168, 49–56. [Google Scholar]
  37. Jensen, S.U. Bicycle Tracks and Lanes: A Before-After Study. In Proceedings of the Transportation Research Board 87th Annual Meeting, Transportation Research Board, Washington, DC, USA, 13–17 January 2008; p. 15. [Google Scholar]
  38. Bao, J.; He, T.; Ruan, S.; Li, Y.; Zheng, Y. Planning Bike Lanes Based on Sharing-Bikes’ Trajectories. In Proceedings of the 23rd ACM SIGKDD International Conference on Knowledge Discovery and Data Mining, Halifax, NS, Canada, 13–17 August 2017; pp. 1377–1386. [Google Scholar] [CrossRef]
  39. Vera-Villarroel, P.; Contreras, D.; Lillo, S.; Beyle, C.; Segovia, A.; Rojo, N.; Moreno, S.; Oyarzo, F. Perception of Safety and Liking Associated to the Colour Intervention of Bike Lanes: Contribution from the Behavioural Sciences to Urban Design and Wellbeing. PLoS ONE 2016, 11, e0160399. [Google Scholar] [CrossRef]
  40. Foster, N.; Monsere, C.M.; Dill, J.; Clifton, K. Level-of-Service Model for Protected Bike Lanes. Transp. Res. Rec. J. Transp. Res. Board 2015, 2520, 90–99. [Google Scholar] [CrossRef]
  41. LaMondia, J.J.; Moore, N. Using Bicycle Level of Service for Decision Making: Comparison of Common Bicycle Level-of-Service Measures, Roadway Characteristics, and Perceived Bike Route Suitability. Transp. Res. Rec. J. Transp. Res. Board 2015, 2520, 123–131. [Google Scholar] [CrossRef]
  42. Bai, L.; Liu, P.; Chan, C.-Y.; Li, Z. Estimating level of service of mid-block bicycle lanes considering mixed traffic flow. Transp. Res. Part A Policy Pract. 2017, 101, 203–217. [Google Scholar] [CrossRef]
  43. Willis, D.P.; Manaugh, K.; El-Geneidy, A. Uniquely satisfied: Exploring cyclist satisfaction. Transp. Res. Part F Traffic Psychol. Behav. 2013, 18, 136–147. [Google Scholar] [CrossRef]
  44. Turcotte, M. Like commuting? Workers’ perceptions of their daily commute. Can. Soc. Trends 2006, 82, 35–40. [Google Scholar]
  45. Xin, F.; Chen, Y.; Wang, X.; Chen, X. Cyclist Satisfaction Evaluation Model for Free-Floating Bike-Sharing System: A Case Study of Shanghai. Transp. Res. Rec. J. Transp. Res. Board 2018, 2672, 21–32. [Google Scholar] [CrossRef]
  46. Echiburú, T.; Hurtubia, R.; Muñoz, J.C. role of perceived satisfaction and the built environment on the frequency of cycle-commuting. J. Transp. Land Use 2021, 14, 171–196. [Google Scholar] [CrossRef]
  47. Handy, S.L.; Xing, Y. Factors Correlated with Bicycle Commuting: A Study in Six Small U.S. Cities. Int. J. Sustain. Transp. 2011, 5, 91–110. [Google Scholar] [CrossRef]
  48. Mitsakis, E.; Stamos, I.; Grau, J.M.S.; Chrysochoou, E.; Iordanopoulos, P.; Aifadopoulou, G. Urban Mobility Indicators for Thessaloniki. J. Traffic Logist. Eng. 2013, 1, 148–152. [Google Scholar] [CrossRef]
  49. Hellenic Statistical Authority. Available online: https://www.statistics.gr/en/2021-census-pop-hous (accessed on 13 December 2022).
  50. Koroxenidis, E.; Theodosiou, T. Life cycle benefits and challenges of large—Scale green roof implementation in a mediterranean compact city: The case of Thessaloniki. IOP Conf. Series Earth Environ. Sci. 2021, 899, 012010. [Google Scholar] [CrossRef]
  51. Perra, V.-M.; Sdoukopoulos, A.; Pitsiava-Latinopoulou, M. Evaluation of sustainable urban mobility in the city of Thessaloniki. Transp. Res. Procedia 2017, 24, 329–336. [Google Scholar] [CrossRef]
  52. Hellenic Institute of Transport. 2018. Available online: https://www.svakthess.imet.gr/%CE%A3%CF%87%CE%B5%CF%84%CE%B9%CE%BA%CE%AC (accessed on 15 April 2023).
  53. OpenStreetMap Project. Available online: https://www.openstreetmap.org/ (accessed on 14 January 2019).
  54. Municipality of Thessaloniki. Available online: https://sdi.thessaloniki.gr/?lon=2555214.9794874&lat=4956597.1260329&zoom=13&tab=viewport_maptab (accessed on 2 August 2023).
  55. Márquez, L.; Cantillo, V.; Arellana, J. How do the characteristics of bike lanes influence safety perception and the intention to use cycling as a feeder mode to BRT? Travel Behav. Soc. 2021, 24, 205–217. [Google Scholar] [CrossRef]
  56. Monsere, C.M.; McNeil, N.W.; Sanders, R.L. User-Rated Comfort and Preference of Separated Bike Lane Intersection Designs. Transp. Res. Rec. J. Transp. Res. Board 2020, 2674, 216–229. [Google Scholar] [CrossRef]
  57. Kondo, M.C.; Morrison, C.; Guerra, E.; Kaufman, E.J.; Wiebe, D.J. Where do bike lanes work best? A Bayesian spatial model of bicycle lanes and bicycle crashes. Saf. Sci. 2018, 103, 225–233. [Google Scholar] [CrossRef]
  58. Okada, S. 2019. Available online: https://towardsdatascience.com/discover-the-strength-of-monotonic-relation-850d11f72046 (accessed on 27 June 2023).
  59. Böhning, D. Multinomial logistic regression algorithm. Ann. Inst. Stat. Math. 1992, 44, 197–200. [Google Scholar] [CrossRef]
  60. Williams, R. Understanding and interpreting generalized ordered logit models. J. Math. Sociol. 2016, 40, 7–20. [Google Scholar] [CrossRef]
  61. IBM Corp. IBM SPSS Statistics 25.0 for Windows. Available online: https://www.ibm.com/spss (accessed on 25 June 2023).
  62. Albert, A.; Anderson, J.A. On the existence of maximum likelihood estimates in logistic regression models. Biometrika 1984, 71, 1–10. [Google Scholar] [CrossRef]
  63. Nikitas, A.; Tsigdinos, S.; Karolemeas, C.; Kourmpa, E.; Bakogiannis, E. Cycling in the Era of COVID-19: Lessons Learnt and Best Practice Policy Recommendations for a More Bike-Centric Future. Sustainability 2021, 13, 4620. [Google Scholar] [CrossRef]
  64. Calvey, J.C.; Shackleton, J.P.; Taylor, M.D.; Llewellyn, R. Engineering condition assessment of cycling infrastructure: Cyclists’ perceptions of satisfaction and comfort. Transp. Res. Part A Policy Pract. 2015, 78, 134–143. [Google Scholar] [CrossRef]
  65. Hull, A.; O’Holleran, C. Bicycle infrastructure: Can good design encourage cycling? Urban Plan. Transp. Res. 2014, 2, 369–406. [Google Scholar] [CrossRef]
  66. Gao, J.; Sha, A.; Huang, Y.; Hu, L.; Tong, Z.; Jiang, W. Evaluating the cycling comfort on urban roads based on cyclists’ perception of vibration. J. Clean. Prod. 2018, 192, 531–541. [Google Scholar] [CrossRef]
  67. Katsavounidou, G.; Papagiannakis, A.; Christakidis, I.; Mavros, O. Emergent Bicycle Infrastructure During the COVID-19 Pandemic: The Karamanli Avenue Pop-Up Cycle Lane in Thessaloniki, Greece. In Proceedings of the 6th Conference on Sustainable Urban Mobility CSUM2022, Skiathos island, Greece, 31 August–2 September 2022; pp. 714–727. [Google Scholar] [CrossRef]
Figure 1. The existing network of bike lanes in the Municipality of Thessaloniki [53,54]; own processing.
Sustainability 15 13666 g001
Figure 2. Percentage of answers for every problem.
Sustainability 15 13666 g002
Figure 3. Percentage of answers for every possible improvement for the network.
Sustainability 15 13666 g003
Table 1. Questionnaire survey structure and basic variables.
Variable NameVariable DescriptionVariable Values
Cyclists’ demographics
GenderGender of respondent1: woman, 2: man, 3: I do not want to determine my gender
AgeAge of respondent1: <18, 2: 18–24, 3: 25–34, 4: 35–44, 5: 45–54, 6: 55–64, 7: >65
Cyclists’ mobility behavior
Transport modePrimary
transport mode
1: motorcycle, 2: car as a driver, 3: car as passenger, 4: bus, 5: e–scooter, 6: walking, 7: bicycling, 8: taxi
Cycling
trip purpose
The cycling trip purpose1: leisure, 2: commuting, 3: for work purposes,4: education, 5: transport mode change, 6: shopping, 7: personal business, 8: other
Cycling
trip frequency
The frequency
of cycling per week
1: <1 day/month, 2: 1–3 days/month, 3: 1–2 days/week, 4: 3–5 days/week, 5: daily
Bicycle kilometers
traveled
The total amount
of kilometers traveled
by bicycle per week
1: 0–5 km, 2: 5–10 km, 3: 10–20 km, 4: 20–35 km, 5: >35 km
Bicycle infrastructure evaluation
Cycling satisfactionOverall level of satisfaction 5-point Likert scale
Cycling safetyOverall level of safety5-point Likert scale
Bicycle network
problems
List of 11 design, safety, and implementation issuesChoose the 3 most
important problems
over the 11 issues
1: if an issue is chosen,
0: if not
Bicycle infrastructure improvements
Bicycle network
improvements
List of 8 improvement
interventions
Choose the 3 most
suitable measures
over the 8 interventions
1: if an intervention
is chosen, 0: if not
Table 2. Results of the correlation between satisfaction and safety variables.
SafetySatisfaction from the Existing Infrastructure
Spearman’s rhoSafetyCorrelation Coefficient10000.317 **
Sig. (2-tailed) 0.000
N504504
Satisfaction from the existing infrastructureCorrelation Coefficient0.317 **1000
Sig. (2-tailed)0.000
N504504
** Correlation is significant at the 0.01 level (2-tailed).
Table 3. Model fitting of multinomial analysis.
Model Fitting Information
Model Fitting CriteriaLikelihood Ratio Tests
ModelLikelihoodChi-SquareddfSig.
Intercept only1096.913
Final947.619149.293440.000
Table 4. Overall statistical importance of every problem.
Likelihood Ratio
ProblemsModel Fitting CriteriaLikelihood Ratio Tests
−2 Log Likelihood of Reduced ModelChi-SquaredDfSig.
Parked vehicles on bicycle lanes989.02641.40740.000
Lack of markings on the bicycle lane954.9527.33340.119
Obstruction of pedestrian traffic957.74910.13040.038
Poor maintenance of the bicycle lane948.9561.33740.855
Disconnected bicycle lane network970.50422.88540.000
Insecurity when crossing intersections948.8811.26240.868
Insecurity when crossing in front of bus stops955.2077.58840.108 *
Lack of ramps for accessing the sidewalk949.9662.34740.672
Absence of designated parking spaces at destinations949.2451.62640.804
Dangerous sudden opening of car doors949.9772.35840.670
Vehicles encroaching on the bicycle lane while moving949.3541.73540.784
* This problem is statistically important for a 90% level of significance (a = 0.10).
Table 5. Estimation of the multinomial logistic regression model.
BStd. ErrorSig.Exp(B)Lower BoundUpper Bound
Satisfaction = 1
Parked vehicles on bicycle lanes3.4471.0380.00131.4024.106240.190
Disconnected bicycle lane network1.9940.7830.0117.3431.58234.091
Satisfaction = 2
Parked vehicles on bicycle lanes3.1901.0390.00224.2863.170186.066
Lack of markings on the bicycle lane−0.7750.4670.097 *0.4610.1851.150
Disconnected bicycle lane network1.5160.7890.0554.5520.96921.387
Satisfaction = 3
Parked vehicles on bicycle lanes2.7441.0590.01015.5451.951123.840
* This problem is statistically significant at a = 0.10.
Table 6. Bicycle network problems and model variables.
VariableProblems Evaluated by Cyclists
P1 Parked vehicles on bicycle lanes
P2 Lack of markings on the bicycle lane
P3 Obstruction of pedestrian traffic
P4 Poor maintenance of the bicycle lane
P5 Disconnected bicycle lane network
P6 Insecurity when crossing intersections
P7 Insecurity when crossing in front of bus stops
P8 Lack of ramps for accessing the sidewalk
P9 Absence of designated parking spaces at destinations
P10 Dangerous sudden opening of car doors
P11 Vehicles encroaching on the bicycle lane while moving
Table 7. Test of parallel lines—ordinal regression.
Test of Parallel Lines
−2 Log LikelihoodChi-SquaredDfSig.
Null hypothesis632.732
General608.55424.178240.451
Table 8. Model fitting information—ordinal regression.
Model Fitting Information
−2 Log LikelihoodChi-SquaredDfSig.
Intercept only669.460
Final632.73236.72880.000
Table 9. Estimation of the ordinal regression model.
EstimateStd. ErrorWaldDfSig.Lower BoundUpper Bound
ThresholdSatisfaction = 1−0.9710.9171.12310.289−2.7680.826
Satisfaction = 20.2270.9160.06110.804−1.5682.022
Satisfaction = 31.0730.9171.37010.242−0.7242.871
Satisfaction = 41.8600.9214.08110.0430.0553.664
LocationS1 = 00.6800.2437.80810.0050.2031.157
S1 = 10 *..0...
S2 = 0−0.1200.2320.26610.606−0.5750.336
S2 = 10 *..0...
S3 = 0−0.1250.2340.28510.594−0.5820.333
S3 = 10 *..0...
S4 = 00.1040.2310.20410.651−0.3480.556
S4 = 10 *..0...
S5 = 00.1090.2300.22610.635−0.3410.560
S5 = 10 *..0...
S6 = 0−0.1350.2340.33510.563−0.5940.323
S6 = 10 *..0...
S7 = 00.1160.2300.25510.614−0.3350.567
S7 = 10 *..0...
S8 = 0−0.5300.2404.86910.027−1.001−0.059
S8 = 10 *..0...
* This value is set to zero because it is set as the reference value of the ordinal analysis.
Table 10. Proposed improvement measures and model variables.
VariableProposed Improvement Measures
S1Create an integrated and interconnected bicycle network within the city area
S2Implementation of secure bicycle parking spaces in areas with high trip attraction
S3Enhance accessibility to parks and recreational areas
S4Improve the quality standards of the pavement on bicycle lanes
S5Create physically separated bike lanes on sidewalks or adjacent to a roadway
S6Install adequate and clear horizontal and vertical road signage
S7Improve road intersection design for safe bicycle crossing
S8Provide direct access to the workplace
Disclaimer/Publisher’s Note: The statements, opinions and data contained in all publications are solely those of the individual author(s) and contributor(s) and not of MDPI and/or the editor(s). MDPI and/or the editor(s) disclaim responsibility for any injury to people or property resulting from any ideas, methods, instructions or products referred to in the content.

