Article

Organizational Health Behavior Index (OHBI): A Tool for Measuring Organizational Health

1
Organizational Culture and Internal Communication, ICM, Amjad Watan, Riyadh 12312, Saudi Arabia
2
College of Business Administration, Princess Nourah Bint Abdulrahman University, Riyadh 11671, Saudi Arabia
3
Department of Psychology, Westford University College, Sharjah P.O. Box 61110, United Arab Emirates
4
Jagran Lakecity Business School, Jagran Lakecity University, Bhopal 462044, India
*
Author to whom correspondence should be addressed.
Sustainability 2023, 15(18), 13650; https://doi.org/10.3390/su151813650
Submission received: 16 June 2023 / Revised: 10 August 2023 / Accepted: 28 August 2023 / Published: 12 September 2023

Abstract

:
Organizational health helps companies achieve their goals, gain a competitive edge, and boost employee engagement and well-being by determining a company’s ability to establish, communicate, and implement a unified business strategy while retaining highly engaged employees. The current study aimed to develop and validate an original two-subscale measure that evaluates organizational health behavior determinants, including a quantitative 5-point Likert-type “Subscale A” of 16 items in 5 dimensions (awareness, appreciation, relations, employee engagement, and internal communication) and a qualitative “Subscale B” of 10 items in 3 dimensions (employee persona, organizational culture, and employee voice) called the Organization Health Behavior Index (OHBI). The combination of the two methodologies enhances the study’s credibility, validity, and applicability, as well as its contribution to the field of organizational health behavior research. Furthermore, the study included three sample groups and a sample of 3510 respondents from five sectors in the Kingdom of Saudi Arabia: agriculture, education, government, health, and logistics. This research includes various stages in the development and evaluation of the psychometric properties of the OHBI. These stages include conducting reliability analysis, performing exploratory and confirmatory factor analyses, and finalizing the scale. The model’s fit indices, such as the chi-squared test, comparative fit index (CFI), Tucker–Lewis index (TLI), root mean square error of approximation (RMSEA), and standardized root mean square residual (SRMR), collectively demonstrated a favorable fit for the model. The findings presented in this study offer support for the reliability and validity of the OHBI scale. The OHBI scale comprehensively encompasses the necessary psychometric properties related to its construction and validation, thereby establishing its validity and reliability as a robust measure of organizational health behavior. The OHBI can help create an environment at work that boosts productivity, engagement, and retention. Organizations can compare their health behavior ratings to industry standards or best practices using the index.

1. Introduction

Organizations are perceived as having a unique identity by their employees, and this new identity has the potential to influence employee behavior. According to the concept of organizational health, employees are dedicated to their organizations, their roles are defined and valuable, and they experience exceptional performance and a sense of belonging to their work. To build a healthy society, health organizations must be established that are defined by continuity, survival in their environment, adaptation, and upgrading and growing their adaptive potential (Charoghchian Khorasani et al., 2020) [1].
Organizational health (OH) has been an actively examined topic with increasing importance and magnitude in academia and industry.
A healthy organization improves employee performance and productivity, thereby positively promoting an organization’s image (Ikechukwu, et al., 2019) [2]. In [3], it is noted that in healthy organizations, culture, climate, and excellent practices create an environment that can support employee health and safety as well as organizational effectiveness. According to (Grawitch and Ballard, 2016) [4], a healthy organization is conducive to a healthy and successful business, emphasizing the significant link between organizational profitability and worker well-being (Arnoux-Nicolas et al., 2016) [5]. According to (Tantry & Ali, 2020) [6], a healthy organization supports high employee performance, and employees have an interest in the organization’s future success. In line with the findings of (Gilani et al., 2023) [7], organizational efficiency shows positive, relevant, and direct connections with indices of organizational health.

1.1. A Need for a Holistic Scale for Measuring Organizational Health

Organizational health has been identified as a critical factor in determining a company’s ability to establish, communicate, and implement a unified business strategy while sustaining highly engaged employees. In this paper, organizational health is defined as “the ability of an organization to cope with change and continue to function with a high performance by maintaining sustainable workplace culture.”
In [8], it is mentioned that the long-term performance of an organization depends on its capacity to achieve strategic goals and align around them. To manage organizational health, the Organizational Health Index (OHI) emphasizes logical consistency, which includes quantitative evaluations, diagnostics, and success techniques that enable leaders to calculate and achieve the organizational health goals needed to sustain long-term performance. According to (Bridges, M. 2019) [9], senior leaders may assess and attain the organizational health necessary to maintain long-term performance with the help of our quantitative diagnostics and tested formulas for success. In [10], it is emphasized that to measure the health of any organization, a gauge must be used to compute the well-being of the company and its personnel in order to monitor the system’s performance and also the behavior of the employees.
Governments, the private sector, nonprofit organizations, and academics have all developed a variety of assessment and diagnostic frameworks that are currently in use to enhance organizational health and performance. Some are quantitative, while others are qualitative, but a framework that encompasses both qualitative and quantitative techniques of assessment is required to cover all of the important dimensions of organizational health and behavior. As a result, our scale was separated into two subscales: “Subscale A” for quantitative measurements and “Subscale B” for qualitative measurements. The combination of the two approaches can improve the credibility, validity, and application of this study while also contributing to the field of organizational health behavior research. Thus, the current study developed a construct for organizational health and behavior on unexplored features in previously published research.

1.2. Organizational Health Behavior Index—A Tool for Measuring Organizational Health

This paper attempts to propose a model and a tool for measuring the health of an organization called the OHBI.
The Organizational Health Behavior Index (OHBI) is a scale that measures the organizational health of any facility based on three needs (basic needs, corporate needs, and strategic needs) and eight factors (awareness, relations, appreciation, internal communication, engagement, employee persona, employee voice, and organizational culture) that lead to a healthy organizational culture, excellence in performance, and achievement of strategic objectives. It gives an accessible yet effective road map for leaders and managers to follow in order to promote organizational health (see Appendix A).
The OHBI model will help the health of any public or private organization by detecting where the problem lies and repairing the system as a whole by studying trends and behavior.
A main indicator of an organization’s capacity to deliver consistent performance is the Organizational Health Index score. Based on our unique organizational effectiveness results and management practices, it assesses the health of the organization.
The term “index,” which is used interchangeably with “scale,” can be described as a specific type of scale composed of various indicators that are added together to generate a single summary score in order to reflect a theoretical construct. (Carmines & Woods 2004) [11]. A scale, however, “takes advantage of differences in intensity among the attributes of the same variable to identify distinct patterns of response” (Babbie, 2003) [12].
Healthy organizations produce overall returns to shareholders that are three times higher than unhealthy organizations, according to a McKinsey study. Alternatively, a company with poor organizational health has low employee engagement, retention challenges, and low morale, which have a negative snowball impact on teams and the company as a whole [13]. As a result, it is critical to assess organizational health using an index that includes both qualitative and quantitative measuring approaches so that the results can assist organizations in responding to difficulties and capitalizing on opportunities in a changing business environment. The OHBI is a novel tool that can help improve organizational culture and employee engagement by contributing to the study of organizational behavior.
In the current research, the validation of the Organizational Health Behavior Index using a mix of qualitative and quantitative measures of assessment is supported by contextualized findings and useful implications that improve the study’s credibility, validity, and applicability as well as its contribution to the field of organizational health behavior research.

2. Literature Review

The concept of organizational health grew in prominence over several decades and has literature linked with research by notable scholars.

2.1. Meaning of Organizational Health

Organizational health is a term that exists in the literature to describe the aspects of the working environment related to the employee’s health. Miller et al., 1999 [14] used organizational health to describe occupational stress, while (Cotton and Hart, 2003) [15] interpreted it more as the well-being of the employee in a working environment. On the other hand (Lencioni, 2012) [16], defined OH as a state of convergence between management, operation, strategy and culture in an organization. Nowadays, organizations are paying attention to the health of the organization, as in a healthy organization, culture, climate, and continuous improvement contribute to developing an environment that can support both organizational efficacy and the well-being of employees.

2.2. The History of Organizational Health Measurement

The idea of organizational health initially appeared in the literature more than 40 years ago. Warren Bennis, 1962) [17] was one of the first theorists to establish organizational health as a method of determining organizational performance, presenting the three characteristics of organizational health as flexibility, clarity of identity, and ability to comprehend the world. The concept of organizational health is a mixture of ideas from (Parsons, 1967) [18], Miles (1969) [19], and (Etzioni, 1990) [20]. Miles identified ten characteristics of healthy organizations in 1969. Among these traits are goal focus, communication adequacy, optimal power equalization, resource utilization, cohesion, morale, innovativeness, autonomy, adaptation, and problem-solving adequacy. He categorized these traits as three requirements that organizations must meet: task, maintenance, and growth. According to Parsons, in order for organizations to survive and succeed, they must handle four fundamental problems: adaptation, goal attainment, integration, and latency. These four functions were narrowed by Etzioni to (adaptation and goal attainment) and (integration and latency). (Teresa, et al., 2005) [21].
To examine and assess the health of an organization, there have to be some recent tools and inventories to evaluate the growth and productivity of the organization and its employees.

2.3. Organizational Health Index

A main indicator of an organization’s capacity to deliver consistent performance is the Organizational Health Index score. Based on our unique organizational effectiveness results and management practices, it assesses the health of the organization. McKinsey has been tracking the health of over 1500 organizations in 100 countries for 10 years, combining employee and manager perspectives on actions taken to improve organizational health, and has discovered that these activities correlate with improved financial performance [22]. The Organizational Health Index, also known as corporate culture, employee consciousness, and corporate style, is an essential wheel for enhancing performance and achieving inventiveness in a firm, whereas (Keller and Price 2011) [23], examined organizational health in five respects to help organizations achieve their ultimate competitive advantage: aspiring, assessing, architecting, acting, and progressing. They are tied to organizational health imperatives.
According to the OHI theory given in [24], there are three clusters of organizational health: internal alignment, quality of execution, and capacity for renewal. The aforementioned clusters were utilized to partition the OHI dimensions into a total of 9 items and 37 practice indicators. The researchers conducted an evaluation of Telkom’s (company) Customer Facing Unit and its transformation implementation success, utilizing both the Organizational Health Index and the Organizational Agility Maturity Model. Based on their findings, the researchers developed recommendations aimed at enhancing the company’s overall health and agility.
In 2017, Hitachi Construction Machinery developed the Organizational Health Workstream, which is a cross-departmental function focused on the Human Resources Department. Its primary objective is to plan, formulate, and implement measures aimed at enhancing the Organizational Health Index.
To support the above facts, there are some researchers’ verdicts on relationships with organizational health.

2.4. Relationship between Crucial Dimensions of Organizations with Organizational Health

Many elements, whether healthy or unhealthy, have a direct impact on organizational health. As a result, healthy and unhealthy organizational variables are crucial for determining whether the organization is healthy or not.

2.4.1. Relationship between Awareness and Organizational Health

The authors of [25] defined organizational health in terms of characteristics and specifications such as communications, perception of organizational strategies and politics, competence of employees, manpower ability, management skills, employees’ morale, the workplace, employees’ awareness of the organization’s mission, cooperation, demographic characteristics of manpower and education, and professional improvement and development, which will influence employees’ behavior. Farahani et al., 2014) [26] on the other hand and [27] defined it as a structure that enables strategic leaders to seek to redefine basic competition and distinctive superiority as a result of discussions, as well as how to identify alternative strategies against competitors’ strategies and trying to understand issues such as how to benefit from and think about them. As a result of the importance of strategic awareness and its effective role in achieving the goals of the organization, it must be measured. In highlighting the significance, [28] stated that employees who are proficient in organizational awareness are able to get things done easily in the organization, recognize most of what is happening in the organization, rarely make mistakes due to misunderstanding the organizational structure, and act appropriately within the organization.

2.4.2. Relationship between Appreciation and Organizational Health

For a dynamic and energetic workforce, maintaining strong employee morale is a main objective. Employees feel valued and acknowledged for their minor or large accomplishments when they receive praise on an individual level. In [29], it is stated that appreciation is significant in organizations because it strengthens positive relationships, social support, and workers’ well-being, decreases negative emotions at work, and improves organizational health and success. According to [30], there is an increase in personal wellness. When managers express gratitude and appreciation to employees, they establish strong interpersonal relationships, which boost team dynamics and communication.

2.4.3. Relationship between Relations and Organizational Health

According to [31], survey 82 percent of workers would quit a job because of an unpleasant manager therefore strong manager-employee relationships can also aid in the reduction of staff absenteeism and turnover, and even (Suknunan et al., 2022) [32] concluded in their research that employee work performance and productivity can be viewed as influencing organizational performance. The working connection between employees and their managers is one of the aspects that determine employee job performance and productivity. The key findings revealed that the interaction between managers and employees has an impact on employee performance and productivity. A positive relationship with a manager is associated with higher motivation and performance, whereas a negative relationship is associated with lower performance. One study [33] study reported a multivariate analysis of the relationship between negative workplace interpersonal interactions between workers themselves, and that these experiences have consequences for worker experiences with burnout and dissatisfaction, as well as contribute to intentions to leave the workplace. Negative interpersonal relationships between workers are especially prominent across all occupational outcomes studied.

2.4.4. Relationship between Internal Communication and Organizational Health

Internal communication humanizes company relations, makes employees more conscious of their job, distinguishes their knowledge of a certain subject, integrates them better into the workplace, and helps them achieve company goals. As concluded by [34], internal communication binds the entire organization together and allows employees of various departments to work cooperatively to meet the organizational agenda. This research shows that employee/internal communication management is linked to employee engagement, which improves supportive employee communication and minimizes turnover intention. On the other hand, the findings of (Kang, et al., 2017) [35] suggested that employee–organization interactions greatly affect the effects of symmetrical internal communication on employee engagement. The survey in [36] also revealed that poor and insufficiently used communication mechanisms and a lack of participation by all employees in decision-making at times hinder employee performance inside the organization, which affects the health of the organization.
Thais Gandica et al. [37] concluded from their study that internal communications, particularly during crises, play a crucial role in employee relations, brand image, and overall organizational effectiveness. This study used primary and secondary research on three distinct organization sizes to investigate the communication techniques and practices that organizations needed to maintain high-functioning operations. The study’s results showed that the three organizations did not stop trying to improve internal communication. Instead, they made big changes to make sure that the organizations worked at their best.

2.4.5. Relationship between Engagement and Organizational Health

The SET model, which presupposes that an employee and their employer (or leader) engage in a social exchange relationship with one another, can be used to explain the relationship between perceived organizational health climate, leader health mindset, work engagement, and job crafting. Employees are more likely to act in a way that is beneficial to the organization if they feel they have a good relationship with it (Zweber, Z.M et al., 2016) [38]. Employees generally exhibit more positive work attitudes when they believe that their businesses and leaders care about their health and take steps to improve it (i.e., work engagement).
In [39], it is concluded that work engagement is a critical intermediary step in this model that maintains the link between job resources and work behavior. Thus, giving employees useful workplace resources boosts their personal resources and work engagement. When people believe their firm cares about their well-being (e.g., job crafting), employees will behave well at work.
There are other factors that can assist in evaluating the health of the organization and analyzing its performance.

2.5. Organizational Culture

According to (Edgar Schein, 2010) [40], organizations do not establish a culture in a single day; rather, it develops through time as personnel undergo numerous changes, adjust to the external environment, and solve challenges. The Competing Values Framework was developed first from research undertaken by University of Michigan faculty members on the primary markers of effective organizational performance in order to understand the culture of the organization. The CVF framework [41] outlines four contrasting organizational cultures and their associated leadership styles that may dominate in specific settings: controlling (hierarchy), competing (market), creative (adhocracy), and collaborative (clan). It has been discovered to be an extremely useful model for organizing and understanding a wide range of organizational and individual phenomena, including theories of organizational effectiveness, leadership competencies, organizational culture, organizational design, life cycle development stages, organizational quality, leadership roles, financial strategy, information processing, and brain functioning.
Observing the importance of the above factors in the overall development and well-being of an organization and its employees, the OHBI is designed to measure the health of an organization to promote sustainable development through healthy organization.

2.6. Employee Persona

According to (How Understanding Employee Persona Can Help Employers, 2020) [42], a detailed portrayal of a group of employees is called an employee persona. Organizations can develop employee personas by looking at traits, experiences, and behaviors to have a better understanding of the type of employee population or even who they want them to be. When it comes to efforts to retain employees and recruit new ones, employee personas are very effective. Employee personas give the tools any company needs to engage, connect, and interact with the workforce more effectively and create a better working environment.

2.7. Employee Voice

It is required to pay attention to the voice of employees for the purpose of improving the operation of an organization by incorporating the ideas made by the employees into the system.
Since the 1980s, the concept of employee voice has been in prominence in the domains of employment relations, human resource management, and organizational behavior [43]. Second, employment relations and human resource management literature defined the voice as a broad range of formal mechanisms for individual and collective employee input, such as grievance methods, suggestion mechanisms, services, employee-management meetings, non-management task forces, quality networks, work councils, and participative management [44].
Based on significant research and empirical evidence, organizational health is a collection of linked components rather than a single entity. These components, or latent factors, define the health behavior of the organization and impact its overall performance (Ye et al., 2022; Suwanyuha & Rinthaisong, 2018) [45,46]. These findings served as the foundation for a hypothesis that which aims to establish a theoretical link between these latent components and the resulting Organizational Health Behavior Index. The goal of our research was to develop a comprehensive measure, the OHBI, that accurately captures these drivers.
Hypothesis 1 (H1):
The Organizational Health Behavior Index is determined by several latent factors of the measure.

3. Methods

3.1. General Overview of Methodology

To improve the rigor and credibility of this study on the OHBI, this paper adopts a complete and systematic methodology. To ensure the validity and reliability of the produced measuring tool, the technique is structured across various phases and sample groups, integrating both quantitative and qualitative approaches (Table 1).

3.2. Subscale A (Quantitative Scale)

In the first phase, Study 1 involved creating items and enlisting the help of eight subject experts to validate them for Subscale A. These professionals provided their knowledge to assure the scale’s relevancy and comprehensiveness. The second study was conducted on a sample of 496 people. The scale’s underlying structure was discovered via exploratory factor analysis.
The second phase began with Study 3, which used a larger sample of 3510 respondents to establish the scale’s dependability. CFA, performed with the same sample group in Study 4, served to validate the factor structure discovered in the EFA.
In the third phase, to establish criterion validity in Study 5, a second sample of 218 respondents was used. By linking the generated scale with external criteria, this phase proved that it accurately measured the targeted constructs.

3.3. Subscale B (Qualitative Scale)

Fourth Phase: The qualitative component of the investigation began with study 6, where item generation for Subscale B took place. The created items were reviewed by 5 subject experts to ensure content validity, confirming that the scale’s items covered all the desired dimensions.
Fifth Phase: Study 7 was carried out on a sample of 50 respondents to conduct content analysis for Subscale B. This stage dug into the qualitative comments, gleaning significant insights and trends. Interrater reliability was demonstrated in Study 8 by incorporating three subject experts, which increased the credibility of the qualitative analysis.
The multiphase structure of the research demonstrated a well-thought-out strategy that blended quantitative and qualitative methods. The study not only verified the established measuring tool but also enriched our understanding of organizational health behavior by integrating subject specialists and utilizing varied sample groups. The study’s robustness was enhanced by this methodological approach, which ensured that the OHBI is a complete and trustworthy instrument for analyzing organizational health behavior determinants.
In the validation phase, the researchers ensured that the sample included a diverse group of employees working in various sectors to ensure that the OHBI was applicable to various groups. Moreover, the researchers ran statistical analyses to determine if there were any significant differences in the responses to the OHBI based on five demographics: gender, sector, domicile, tenure, and managerial level. These analyses helped ensure that the OHBI was not biased against any group of people.
Overall, the researchers were intentional in ensuring that equity, diversity, and inclusion were given due consideration throughout the development and validation of the OHBI. By doing so, the scale is inclusive and applicable to a diverse range of employees, which is essential for improving organizational health behavior and promoting employee well-being. Therefore, to address the objective of the current study, the authors attempted to develop an organizational health behavior measure that can incorporate both qualitative and quantitative methods of assessment to cover all the significant domains of organizational health and behavior. Therefore, the scale was divided into two subscales: “Subscale A” as a quantitative measure and “Subscale B” as a qualitative measure. The rationale for using both qualitative and quantitative assessment methods is as follows.
Organizational health behavior is a complex concept with many facets, including social, psychological, and physical components. Research can obtain a more complete knowledge of corporate health behavior by using both qualitative and quantitative metrics [47]. The viewpoints, experiences, and interpretations of participants can be thoroughly explored using qualitative methods. These revelations can offer a rich framework for creating a quantitative subscale that accounts for all pertinent dimensions.
Utilizing qualitative data collection techniques offers the chance to investigate the conceptual underpinnings and underlying meaning of organizational health behavior. Qualitative measurements offer insightful information about the particular organizational context that may influence health behavior. This contextualization makes sure that the Organizational Health Behavior Index is applicable and relevant across a range of organizational settings. The study’s goal of offering practical implications to businesses is aligned with the inclusion of both qualitative and quantitative assessment measures. The study can provide complete insights and evidence-based suggestions to enhance organizational health behavior by combining both techniques.
In conclusion, the choice to create and validate the Organizational Health Behavior Index using a mix of qualitative and quantitative measures of assessment is supported by the need to accurately reflect the comprehensive nature of organizational health behavior, ensure contextualized findings, and offer useful implications. The two methodologies are combined, which improves the study’s credibility, validity, and applicability, as well as its contribution to the field of organizational health behavior research.
The methods and phases of development and validation are given in detail in the following sections.

4. Results

4.1. Methods for Subscale A

4.1.1. Phase 1

Item Generation

For study 1, we used previous measures and the existing literature related to the construct to generate items for a measure of organizational health behavior. Content validity for this new pool of items was achieved by obtaining expert feedback (6 expert raters), and initially, a set of 36 items was recommended by experts from an original set of 43 items.

Participants

For Study 2, a sample of 519 participants who work in the information technology sector in the Kingdom of Saudi Arabia was recruited via Google Forms using a convenience sampling method. Sample sizes of about 200 are appropriate for most factor analyses [48]; (Tabachnik & Fidell, 2019) [49]. After screening out participants who reported their availability and willingness to participate, 496 were retained, of whom 281 identified as male and 215 as female (they were given an “other gender” option, but no one selected that). The majority (about 70%) were between 26 and 35 years old, with a mean age of 32.56 years old. Two years of minimum experience in the same organization was one of the criteria to be included in the sample.

Factor Analysis: Exploratory Factor Analysis (EFA)

The results in Table 2 suggested that the deviation of data from normality was not severe, as the values of skewness and kurtosis indices ranged between −1 through 0 to +1 on all the items. Data are considered to be normally distributed if the value of skewness ranges between −2 and +2 and if the value of kurtosis ranges between −7 and +7 (Demir, 2022) [50]; (Hair et al., 2010) [51]; Bryne, 2010) [52]. Other experts suggest that an acceptable range for skewness or kurtosis is below +1.5 and above −1.5 (Tabachnick & Fidell, 2013) [53]. Therefore, the indices for skewness and kurtosis suggested that the data can be normally distributed.
It can be observed from the KMO and Bartlett’s Test (Table 2) that the Kaiser–Meyer–Olkin index was 0.933, surpassing the recommended lower limit value of 0.60 (Kaiser, 1970) [54], whereas (Bartlett’s, 1954) [55] test of sphericity was significant (χ2 = 3.12, df = 276, p = 0.000 < 0.01 level of significance) (Table 3), which ensured that the data were sufficiently correlated and had inherently sufficient correlations and justified the use of EFA.
The goal of using PCA as an extraction method was to discover the first underlying components that contribute to the variance observed in the dataset (Table 4). PCA is a strategy for reducing dimensionality that tries to transform the original variables into a new collection of uncorrelated variables known as principal components. These primary components capture the greatest amount of volatility in the data. PCA offered preliminary insight into the data’s eight potential underlying structures (Table 5). It computed eigenvalues for each primary component. The amount of variance explained by each component is represented by these eigenvalues. Eigenvalues larger than one (Kaiser’s criterion) or the scree plot approach (see Figure 1) can help determine how many initial factors to consider in the EFA.
A series of factor analyses were conducted using principal component analysis as an extraction method. As previous research suggests the popular Kaiser criterion (i.e., eigenvalues greater than 1.0) alone is unreliable (e.g., Velicer & Jackson, 1990) [56], and examination of the scree plot was also used to determine the optimal number of factors. As recommended by (Costello and Osborne 2005) [57], we conducted analyses in an iterative manner, testing models at and around the “elbow” in the scree plot and after deleting items that had either low loadings (<0.50) or that were cross-loaded (>0.50 on more than 1 factor). Using this approach, an eight-factor solution with 24 items emerged as the one with high factor loadings within a scale and minimal cross-loadings. This model accounted for 78.426% of the variance among the items. Factor loadings are presented in Table 4.

4.1.2. Phase 2

Participants

For Studies 3 and 4, a second sample group of 3510 employees who work in agriculture, education, government, health, and logistics in the Kingdom of Saudi Arabia was taken to calculate reliability, and confirmatory factor analysis was run to test the model developed from EFA. Out of the 3510, 2110 were males and 1400 were female employees. The age range of the sample included in the study was 20 to 50 years with a mean age of 32.76 years. The study excluded employees older than 50 years of age to minimize aging effects on the sample. The sample consisted of both Saudi and non-Saudi employees working in the kingdom, where 1870 employees were Saudi locals and 1640 were expats.

Reliability

The indices of Cronbach’s alpha for the overall scale were satisfactory (0.888) and for the first five factors were: awareness = 0.912, appreciation = 0.896, employee engagement = 0.903, relations = 0.941, and internal communication = 0.925. However, the coefficient of Cronbach’s alpha of the sixth factor, organizational culture = 0.623, the seventh factor, employee persona = 0.647, and the eighth factor, with only two items, showed an unsatisfactory coefficient of Cronbach’s alpha, which was communication = 0.610 (Table 6). Therefore, the factor-wise reliability coefficients suggested that the overall scale had a significantly high Cronbach’s alpha. Moreover, Cronbach’s alpha criteria retained five factors with 16 items of the OHBI for CFA and excluded factors such as “employee persona,” “organizational cultures,” and “communication” with low Cronbach’s alpha. Hence, it supported the EFA results that suggested five factors with more than two items; however, one factor with less than three items could not be considered.
All item–total correlation scores were much higher than the threshold of 0.40 (DeVellis & Thorpe, 2021) [58] (Table 7). Besides that, all interitem correlations ranged from 0.3 to 0.9.
Following the methodology of [59] methodology, measurement invariance analysis showed that males and females were invariant on the HRG (i.e., the prerequisites for strong invariance were satisfied; Table 8, top portion). The findings of the ANOVA also revealed that there was no significant difference between males (n = 2110) and females (n = 1400) in their overall standardized OHBI scores on Subscale A. Furthermore, none of the gender differences that were found met the requirements for even a minor effect size. These findings imply that the OHBI is measuring males and females in the same manner and that the OHBI measures organizational health and behavior similarly for both sexes.

Confirmatory Factor Analysis (CFA)

Study 4 was conducted on a sample of 3510 employees to run CFA to test the five factors with 16 items developed from EFA.
The goodness-of-fit model indices were found to be excellent (χ2 = 3202.136, χ2/df = 12.245, NFI = 0.926, RFI = 0.909, GFI = 0.941, IFI = 0.932, TLI = 0.916, RMSEA = 0.057, and CFI = 0.931) (Table 9). The findings explained that all the indices of model fit supported a good model fit.
It can be concluded from the factor analysis that the final version of 16 items represents the five-factor measure of the OHBI (Figure 2). The factor loadings/standardized beta values of all 16 items explained a good positive variance in their respective factors (β values ranged from 0.711 to 0.866, p values < 0.001 level of significance). The model’s lowest factor loading was 0.711, which is above the acceptable range (Table 10). The findings supported the hypothesis (H1) of the study, i.e., that the Organizational Health Behavior Index is determined by several latent factors of the measure.

4.1.3. Phase 3

Validity

Study 5 was conducted on a third sample group of 218 professionals (120 males and 98 females) in the medical field working in different health-care facilities in Riyadh, Saudi Arabia to establish the criterion validity of the measure. The average age of the sample was 31.05 years. Out of the 218, 50 were Saudi locals and 168 were expats. The validity of the OHBI was established by correlating it with the Brief Questionnaire on Organizational Health (QISO). The creation of a new measurement tool was not the only goal of the current investigation. While it is true that the QISO questionnaire exists, it does not include a combination of qualitative and quantitative measures, so we felt it was necessary to develop and validate the OHBI on a sizable population in the KSA. OHBI is a multifaceted measure that incorporates a combination of qualitative and quantitative measures. We wanted to demonstrate the construct validity of the OHBI and verify that it captures the key elements of organizational health behavior in our study by connecting it with an existing validated instrument. This method allows for meaningful comparisons and improves the dependability of our findings, strengthening the credibility and robustness of our findings.
Method: The QISO searches and quantifies all information on the different dimensions of organizational health and on three groups of indicators—positive, negative, and mental and physical discomfort—in the nursing population. It consisted of 48 items (a short version of 118 QISO) divided into eight. All the QISO items are rated on a 4-point Likert scale, assigning the worst condition to the value 1 and the best condition to the value 4; therefore, a higher score indicates better conditions. For the current study, seven subscales (39 items) of the QISO were used to establish correlations with five dimensions of the OHBI-16. The results showed good positive correlations between the dimensions of the OHBI and QISO, where all the coefficients ranged from 0.71 to 0.83. The results are displayed in Table 11 below.

Scoring for Subscale A

The final 16-item subscale was developed from this study to measure OHB. The scale asks respondents to rate each item on a 5-point Likert scale ranging from 1 (strongly disagree) to 5 (strongly agree). There are no reverse-scored items in the scale. Subscale A is further divided into five dimensions: awareness (four items), appreciation (three items), employee engagement (three items), relations (three items), and internal communication (three items). The scores on each dimension are obtained by adding all the items of their respective dimensions. A total score of a dimension is obtained by adding responses on all the items of that dimension. Similarly, the score on Subscale A is obtained by adding scores/responses of all 16 items and can range from a minimum score of 16 to a maximum score of 80. A normalized score higher than the normalized mean score is an index of good organizational health and behavior, and a lower score is an index of poor organizational health and behavior (see Table 12).

4.2. Methods for Subscale B

4.2.1. Phase 4

As a qualitative method to evaluate employee persona, organizational culture, and employee voice, a second subscale of the OHBI (Subscale B) was established. In study 6, 15 items were first created after a thorough literature review to construct the items pool. To guarantee content validity, the 15-item preliminary subscale was given to five subject experts for review. Eleven items were chosen by the experts for the subscale.
In study 7, 50 employees from five different industries—agriculture, education, government, health, and logistics—were given the 11-item scale, 10 from each industry.

4.2.2. Reliability of Subscale B

Study 8: by gathering opinions from three experts on the themes drawn from the responses received on the 11-item pool, interrater reliability was developed. Following the raters’ response, one item from the organizational culture subscale was eliminated, leaving a final pool of 10 items for Subscale B: (B1) individual interests (five multiple-choice questions), (B2) organizational culture (three multiple-choice items), and (B3) employee voice (two open-ended items) make up Subscale B’s three dimensions. As a result, a final version of 10 three-dimensional items was created for Subscale B (see Table 13).

4.2.3. Scoring of Subscale B

The scoring of the three dimensions of Subscale B is undertaken in different ways.
Scoring for employee persona: Employees’ persona is evaluated on five items based on five themes: their interests, their level/type of engagement, their communication method, their definitions of appreciation, and their level of loyalty. There is no calculation of a numerical score in this scoring process. Instead, for each factor, qualitative data are obtained and assessed. Multiple-choice questions are used to obtain qualitative data. Content analysis is part of the scoring procedure.
  • Interests: Examine the employee’s interests and how they relate to the position or company. To find trends and themes, analyze and classify the responses. Give a brief description of the employee’s interests and connection to the position or organization.
  • Type of Engagement: Determine the employee’s type of commitment to the tasks they are allocated or their employment. Determine the many forms of involvement displayed by the employee and classify them (for example, proactive engagement, task-focused engagement, and social engagement). Describe the employee’s engagement patterns and highlight the many types of engagement that were shown.
  • Method of Communication: Analyze the employee’s preferences for and communication methods. Determine the effectiveness of the employee’s communication techniques (such as email, intranet, Snapchat, server screens, etc.). Examine the employee’s interpersonal skills, communication style, and ability to explain ideas clearly. Give a brief description of the employee’s communication style and how it affects interactions at work.
  • Appreciation Definition: Examine how the employee perceives and understands appreciation at work. Determine what gratitude means to the employee and how they perceive and value it. Examine their understanding of the organization’s procedures for expressing gratitude. Analyze the employee’s comprehension of gratitude and its significance to their work experience in a descriptive manner.
  • Employee Loyalty: Evaluate the employee’s allegiance and dedication to the company. Consider such qualities as tenure, desire to go above and beyond expectations, and commitment to the organization’s goals. Examine the employee’s thoughts and behaviors regarding loyalty. Give a succinct description of the employee’s devotion to the company and loyalty.
Scoring for Organizational Culture: Three items, each with four multiple-choice answers that represent several cultural kinds (clan culture, market culture, adhocracy, and hierarchy culture), are evaluated as part of the scoring process for the aspects of organizational culture. Whether the culture is created by the organization, leaders, or employees will be shown by the conclusion taken from the responses to the three questions. The scoring process can be put into practice as follows. Four multiple-choice options (A, B, C, and D) reflecting several cultural kinds (clan, market, adhocracy, and hierarchy) should be presented to responders. For this choice, respondents are asked to select the response that most accurately reflects how they see the culture of the company.
Scoring for Employee Voice: This dimension consists of two open-ended items and the scoring is based on thematic analysis. There are no calculations for this dimension. Opinions are gathered to hear the employee’s voice. The voices lead to either a positive or negative theme.

5. Discussion

Organizations are a vital component of modern society and the national economy, and the health and well-being of their employees are critical for good customer service, a better society, and the sustainability of the organization. The most vital resource of any organization is the human resources—the employees. A conducive work environment enhances employee performance, increases a firm’s productivity, and thus promotes its image positively (Ikechukwu, et al., 2019) [61]. In recent years, the COVID-19 pandemic significantly impacted organizational health behavior (Ranka, et al., 2020 [62]; Shoss, 2021 [63]; Sinclair, et al., 2021) [64]. The pandemic underlined the significance of corporate health behavior in preserving employee well-being and productivity as firms were compelled to switch to remote work or adapt to new health and safety standards (Ekpanyaskul, & Padungtod, 2021) [65]. Additionally, the pandemic revealed flaws in organizational health practices, notably regarding worker security, work–life balance, appreciation, relations, healthy engagements, communication, internal culture, and environment [66]. There have been cases of insufficient safety precautions and exorbitant task demands as firms hurried to implement new policies and processes to protect personnel (D’Angelo, et al., 2022) [67]. Additionally, managing professional and home duties while undertaking remote work has presented additional difficulties for employees, raising questions about burnout and mental health. Given these challenges, policymakers, managers, and CEOs are now prioritizing the improvement of organizational health behavior as a critical aspect of maintaining employee well-being and productivity in the post-pandemic era (Khurana, et al., 2021) [68]. Organizations are investing in new strategies to support employee mental health, promote work-life balance, and create safe and supportive work environments (Fazal, et al., 2022) [69]. This renewed focus on organizational health behavior reflects a growing recognition of its importance in fostering a healthy, engaged, and productive workforce (Kirsten 2022 [70], Arief, et al., 2021) [71]). Therefore, the concept of organizational health has become increasingly important as it helps organizations to achieve their objectives, enhance their competitive edge, and promote employee satisfaction and well-being. The current study aimed to develop and validate a multidimensional framework, a comprehensive measure of an organization’s health behavior, to gauge organizational health behavior determinants. The OHBI consists of two subscales: the quantitative Subscale A and the qualitative Subscale B. To ensure the reliability and validity of the OHBI, it was developed and validated using rigorous techniques.
Development of the OHBI: A comprehensive study of the available literature, expert consultations, and in-depth qualitative open-ended questions with organizational stakeholders were all part of the process of developing the OHBI. While professional discussions helped assure content validity and relevance, the literature study assisted in the identification of essential organizational health behavior aspects and indicators. The qualitative questions provide insightful information regarding how employees perceived and dealt with health behavior in the workplace. Additionally, a significant index of organizational health behavior was supplied by the quantitative items.
The study came out with an original two-subscale measure: the quantitative 5-point Likert type Subscale A of 16 items in five dimensions (awareness, appreciation, relations, employee engagement, and internal communication), and a qualitative Subscale B of 10 items in three dimensions (employee persona, organizational culture, and employee voice) called the Organization Health Behavior Index (OHBI).
Quantitative Analysis on Subscale A: Subscale A was established to collect quantitative information on several organizational health behavior dimensions. It was composed of carefully crafted Likert-scale questions that were based on the outcomes of the literature and expert consultations. To ensure its generalizability, the survey was given to sizable sample groups of workers from various industries and sizes of organizations. The fundamental elements influencing organizational health behavior were found using exploratory factor analysis. Confirmatory factor analysis was used to further support the findings, demonstrating the scale’s capacity to assess a variety of variables and guaranteeing the construct validity of the scale.
Validation: Several actions were performed to validate the OHBI. First, internal consistency analyses for Subscale A were performed. The results showed high Cronbach’s alpha values, which indicate a high level of internal reliability.
Additionally, the criterion-related validity of the OHBI was evaluated by comparing its results with the QISO. A significant relationship between the OHBI and QISO was shown, demonstrating the validity of the OHBI.
The OHBI is a scale that assesses an organization’s health behavior, which includes the attitudes, actions, and routines that support worker productivity and well-being. For subscale A, a quantitative Likert-type pool of 43 items was identified during the item generation phase, which was the first step in the creation of the OHBI. From Study 1 of the content validity analysis, 36 items were kept for additional examination. The succeeding stages of the OHBI’s development are covered in this chapter, including the reliability analysis, exploratory and confirmatory factor analyses, and the scale’s final iteration.
The development and calculation of the psychometric properties of the OHBI involved several phases. The first phase started with the item generation phase, where the authors identified 43 potential items. In Study 1, the 43-item pool was shared with field experts to carry out a content validity analysis, and 36 items were retained for further validation. In the second phase, data were taken on the 36-item set from a sample of 496 participants employed in the IT sector in Saudi Arabia. The data were assessed on skewness and kurtosis statistics to test the range of normality.
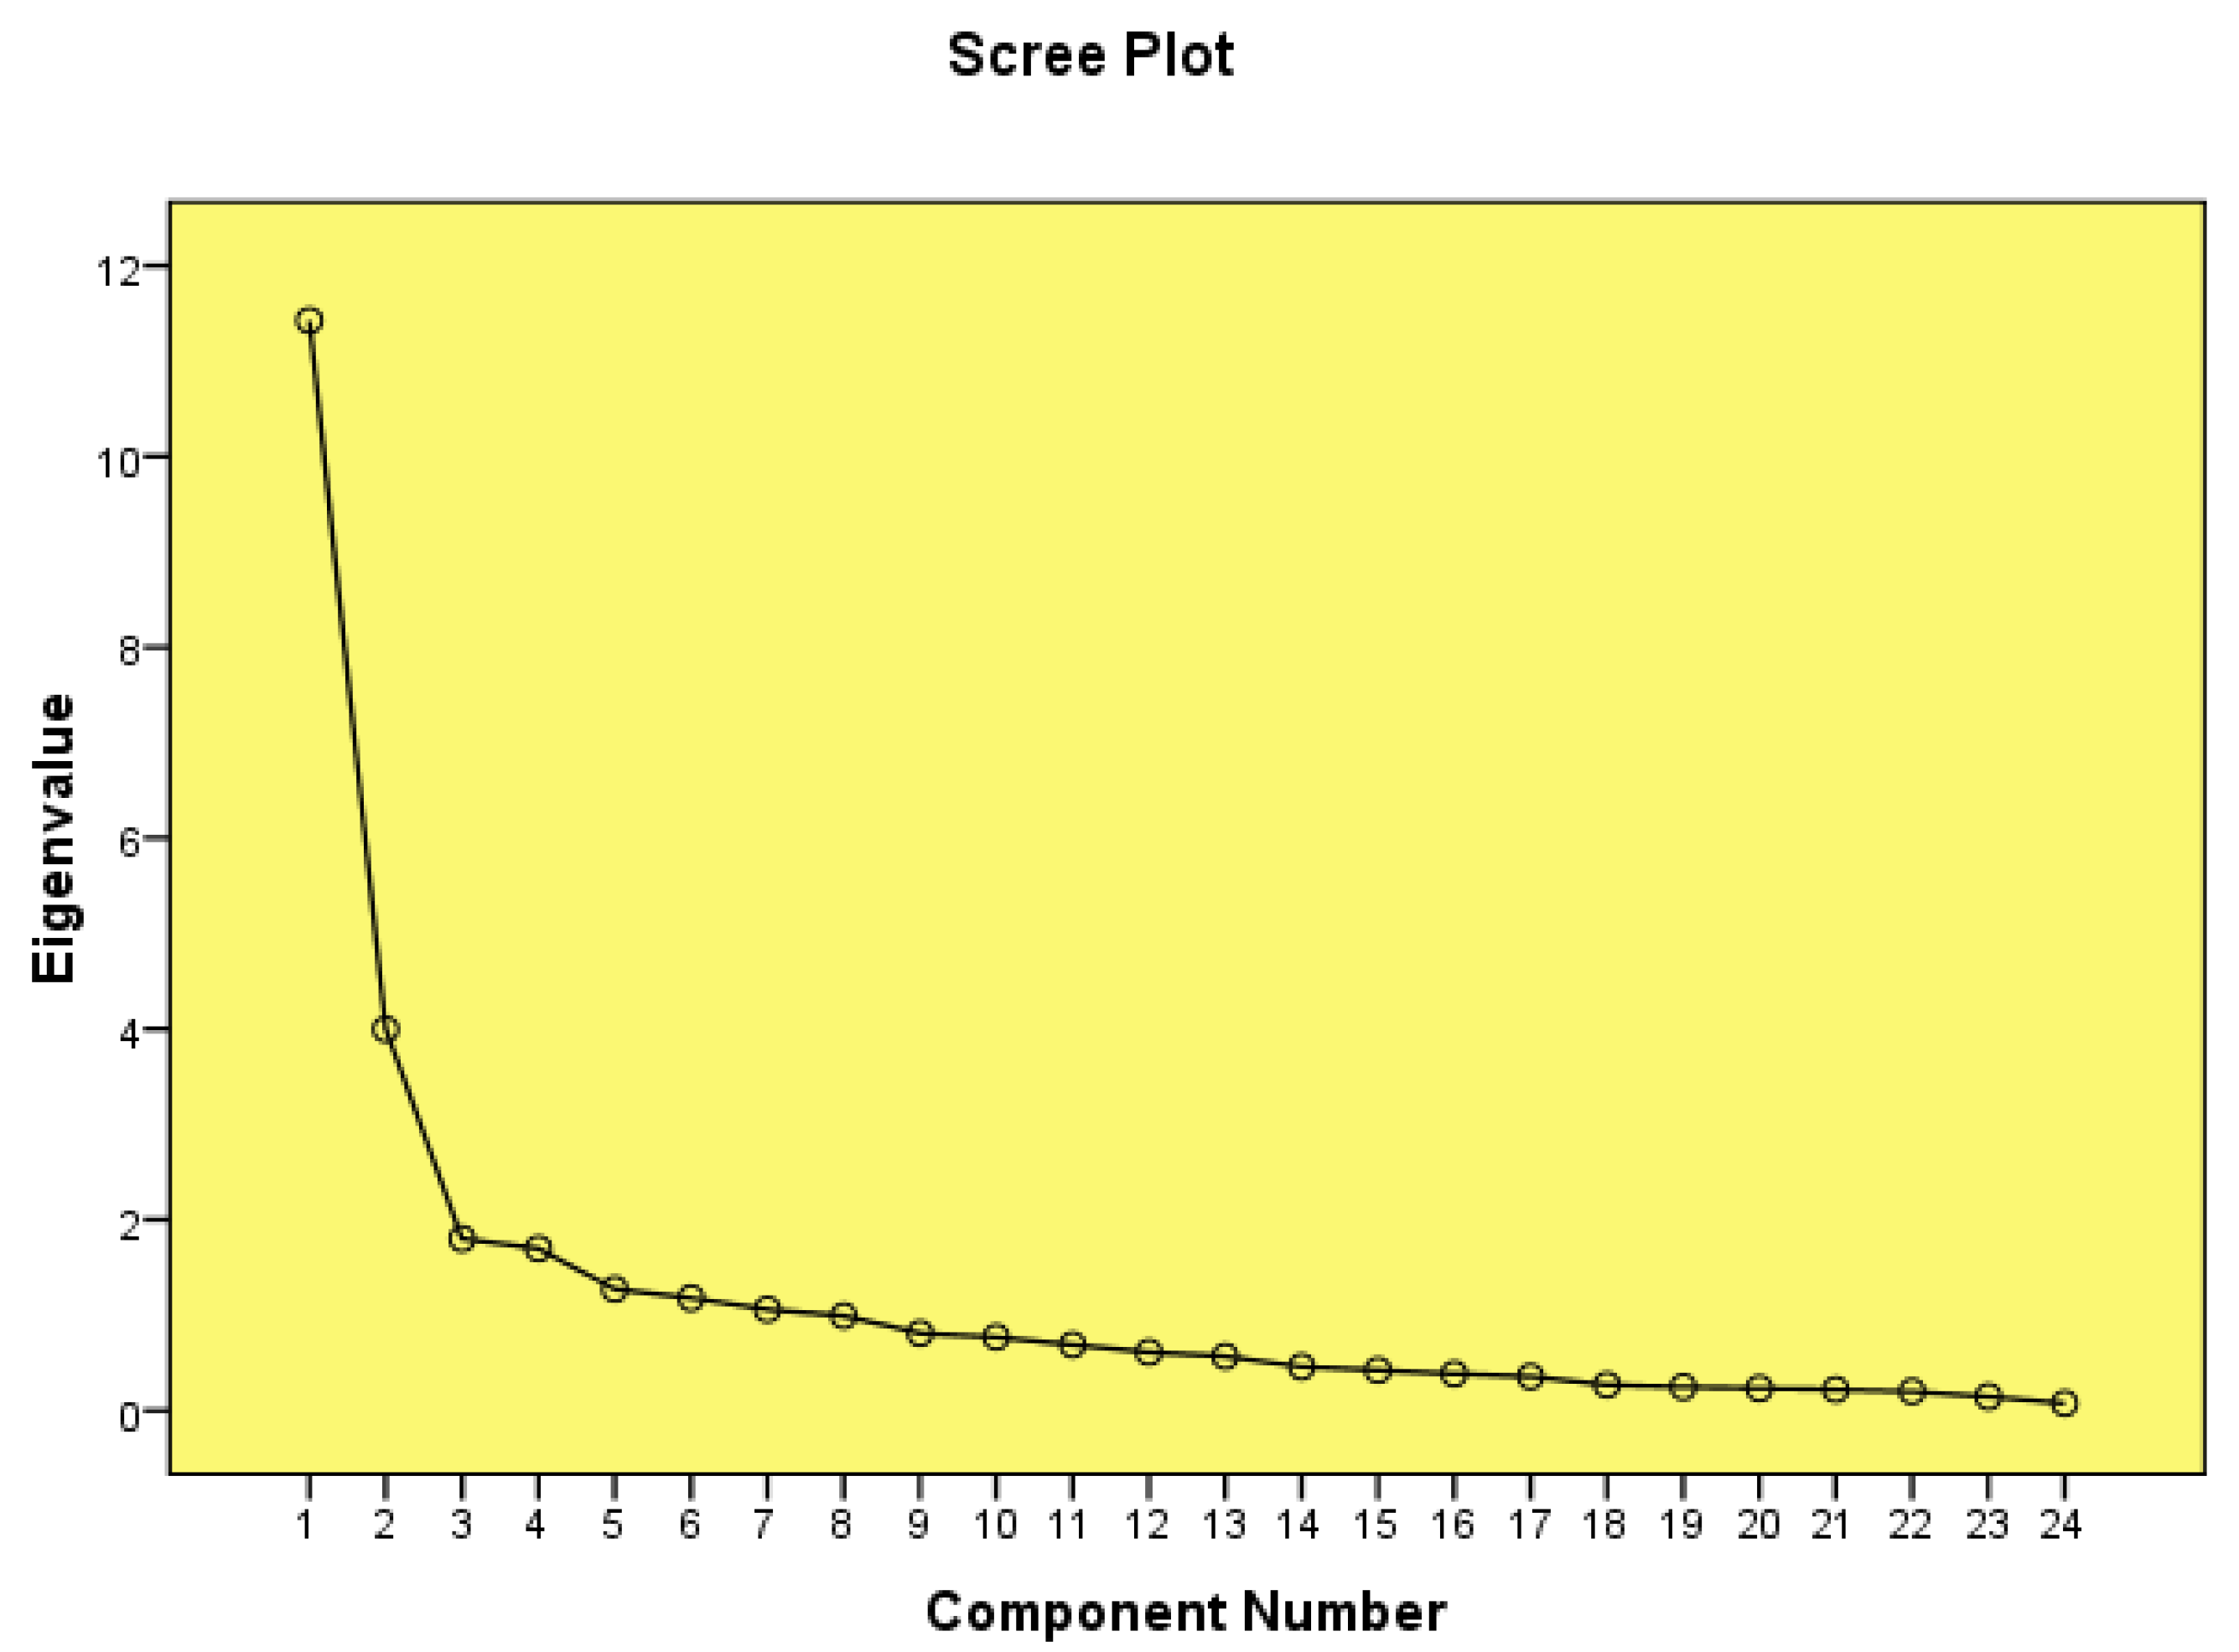
To find the latent factors for the OHBI model on the 36 items, exploratory factor analysis was used in the third phase. A 16-item, five-factor model was validated by the results of the exploratory factor analysis, and 20 items were dropped from the pool. The results of the exploratory factor analysis conducted in Study 2 supported a 16-item, five-factor model for the OHBI scale. The factors were (1) awareness, (2) appreciation, (3) relations, (4) employee engagement, and (5) internal communication. In the fourth phase, Study 3 evaluated the reliability of the OHBI model. All five factors had strong Cronbach’s alphas, ranging from 0.82 to 0.94.
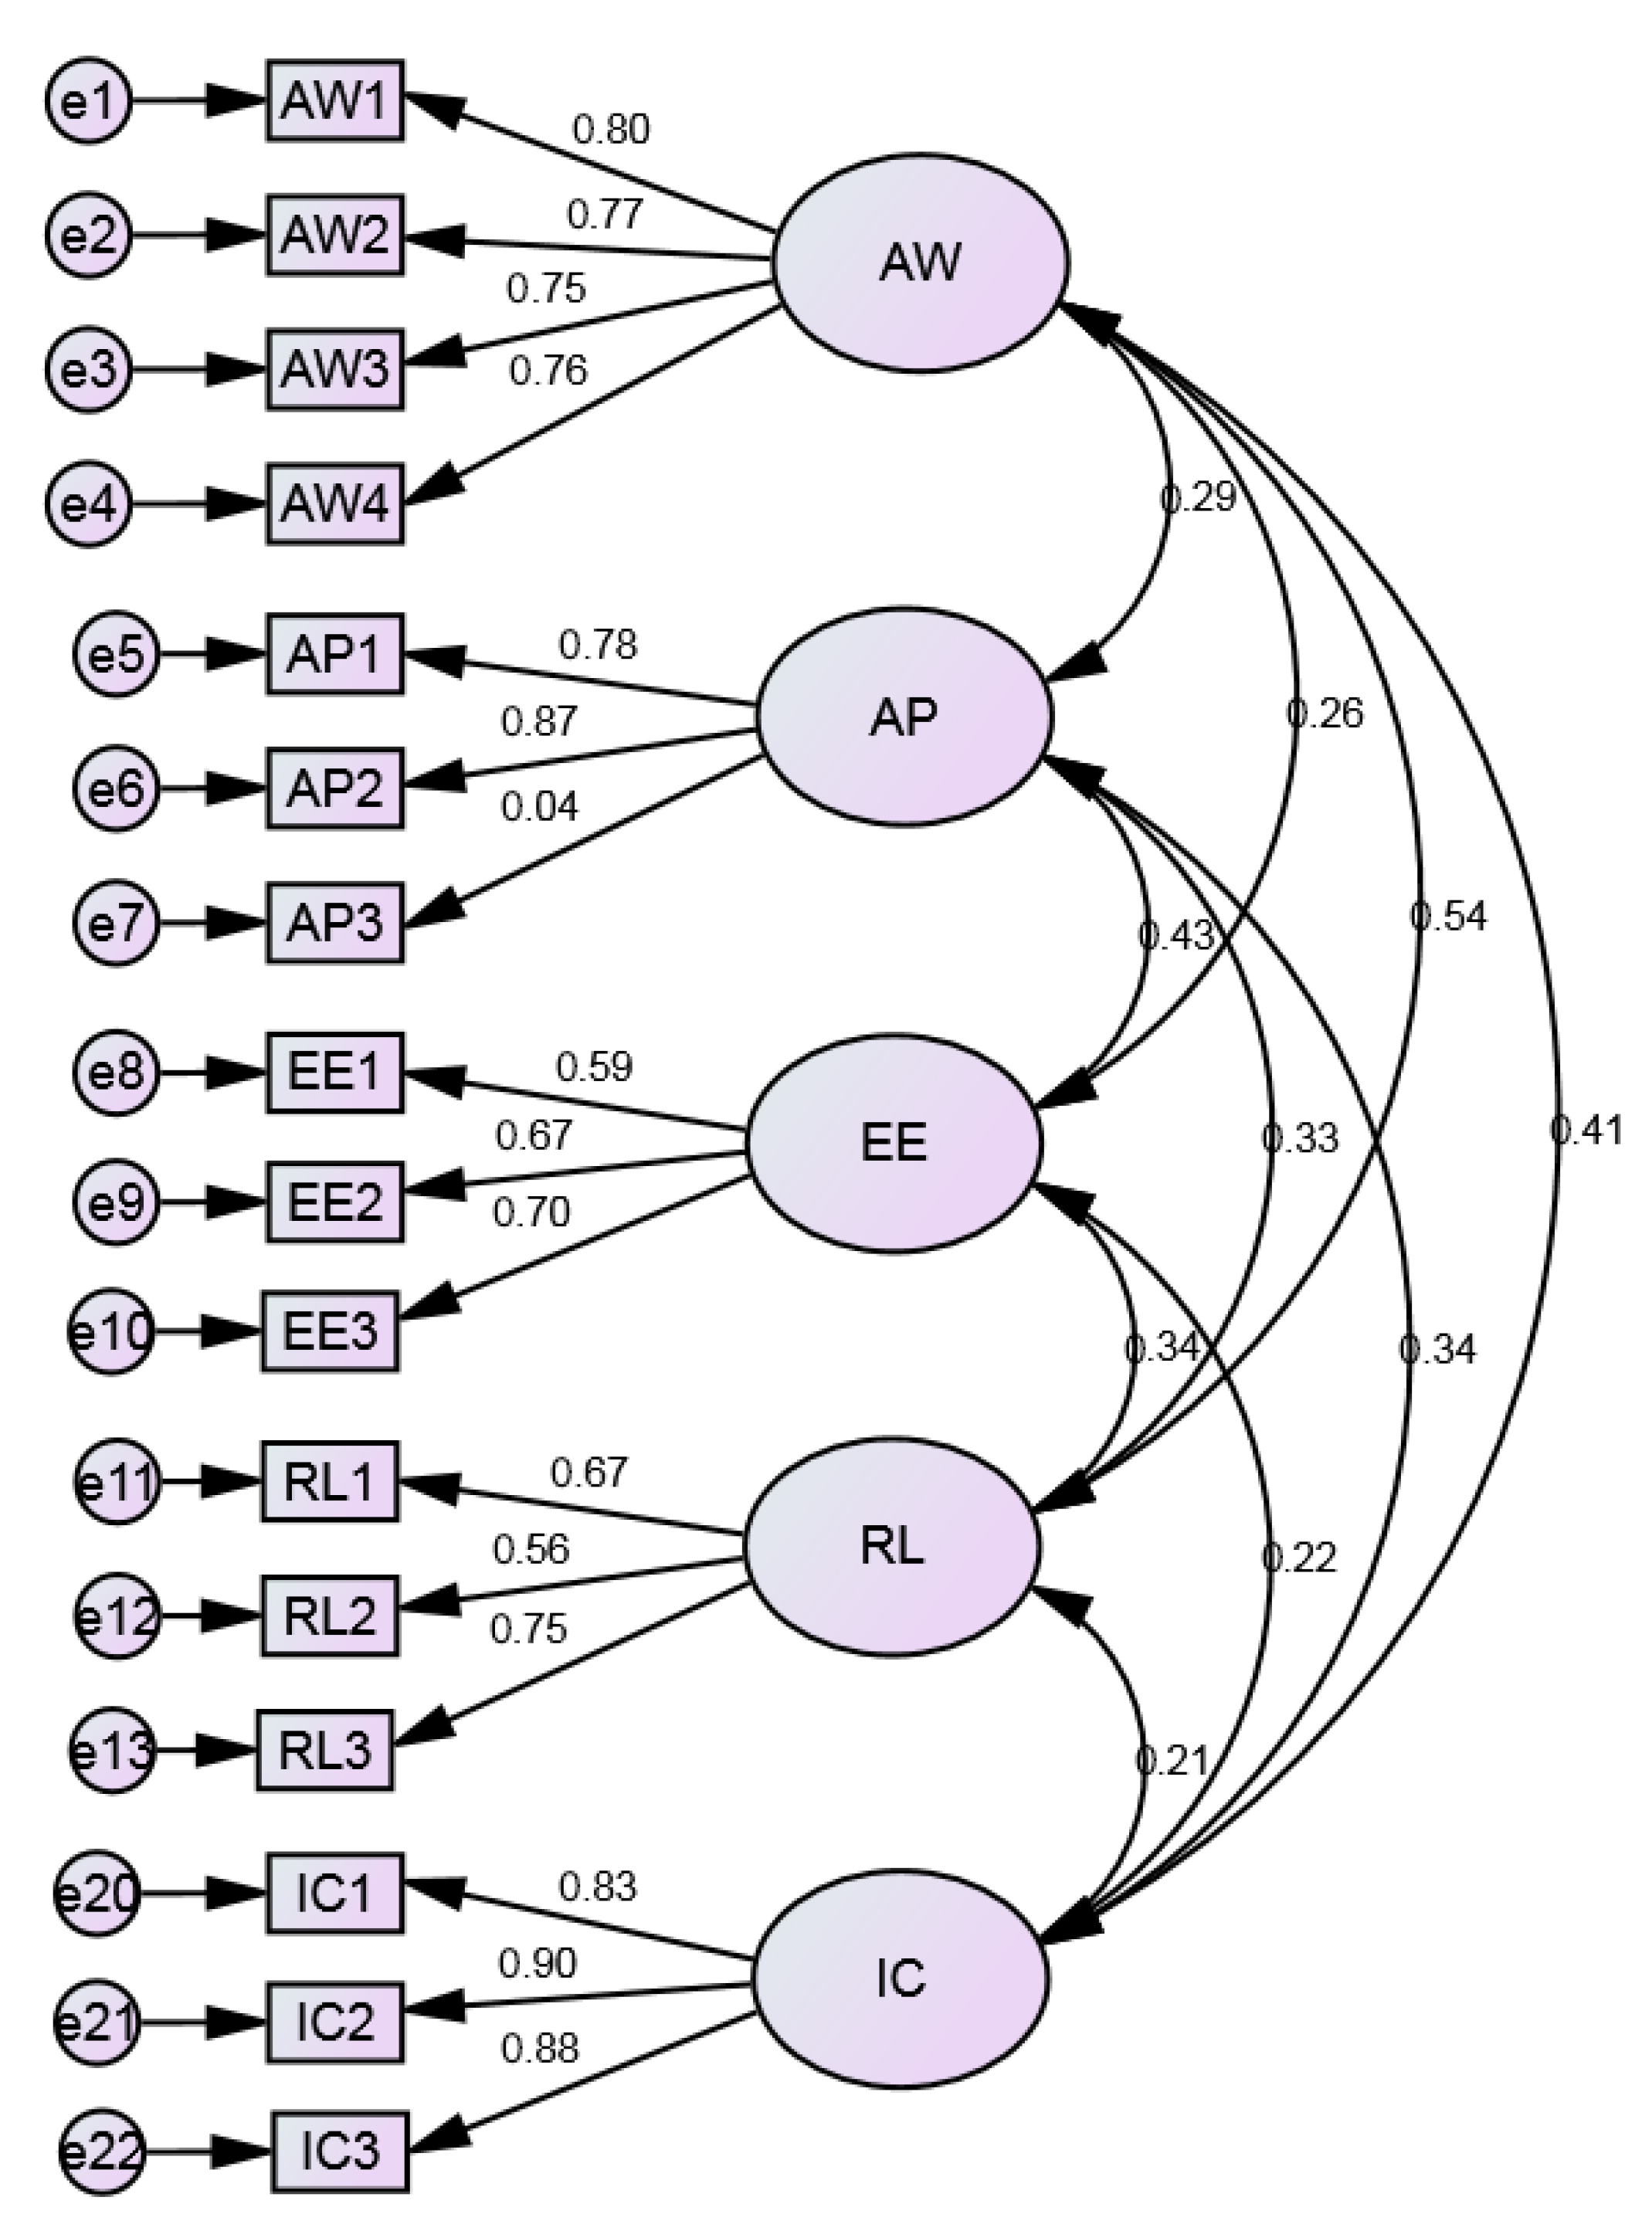
Confirmatory factor analysis in Study 4 was carried out in the fifth phase using a second sample of 3510 participants. The 16-item, five-factor model created during the exploratory factor analysis and reliability phase was confirmed by the findings of the confirmatory factor analysis. The model fit indices, including the chi-squared test, comparative fit index (CFI), Tucker–Lewis index (TLI), root mean square error of approximation (RMSEA), and standardized root mean square residual (SRMR), indicated a good fit for the model. The results provided evidence of the reliability and validity of the OHBI scale. The final version of Subscale A of the OHBI model consisted of 16 items in five dimensions.
In Study 5, concurrent validity was established in a third sample group. The seven subscales (39 items) of the QISO were used to establish correlations with five dimensions of the OHBI-16. The results showed good positive correlations between the dimensions of the OHBI and QISO, where all the coefficients ranged from 0.71 to 0.83.
The OHBI scale addressed all the essential psychometric properties of construction and validation, and is a valid and reliable measure of organizational health behavior. The scale’s internal consistency and construct validity is demonstrated by the scale’s 16-item, five-component model, which was created through exploratory factor analysis and validated through confirmatory factor analysis. The OHBI model’s five components represent important facets of organizational health behavior that might affect employee well-being and work.
Qualitative Analysis on Subscale B: The purpose of Subscale B, which focused on qualitative analysis, was to delve more deeply into employees’ qualitative experiences with corporate health behavior. Participants were able to share their perspectives, challenges, and experiences regarding health behavior in the organization through the use of open-ended questions. The qualitative data were subjected to thematic analysis, which allowed for the discovery of recurrent themes and patterns. The qualitative findings enhanced the understanding of organizational health behavior and gave the OHBI a relevant context by complementing the quantitative data.
The second subscale of the OHBI (Subscale B) was developed as a qualitative method to assess employee persona, organizational culture, and employee voice. In Study 6, the literature was thoroughly reviewed to generate 15 items. The preliminary subscale of 14 items was sent to five subject experts for review to ensure content validity. The experts approved 11 items for the subscale. In Study 7, the 11-item scale was administered to 50 employees taken from five sectors: agriculture, education, government, health, and logistics (10 from each sector). In Study 8, an interrater reliability was assessed by collecting reviews from three experts on the themes taken from the responses gathered on the 11-item pool. One item was deleted from organizational culture after the raters’ feedback, and a final pool of 10 items for Subscale B was developed. The three dimensions of Subscale B are employee persona (five items), organizational culture (three items), and employee voice (two open-ended items). Therefore, a final version of 10 items in three dimensions was developed for Subscale B.

6. Conclusions

There have been several studies that have developed and validated similar scales in the organizational health context. Organizational health has been extensively measured within single sectors, for example, the business sector (De Smet, et al., 2007) [72], the education sector (Johnson Perry, 2015) [73], the social care sector (Potter et al., 2016) [74], and the healthcare sector (Nicolay et al., 2019) [75], the nursing questionnaire on organizational health, and general practice organizational health (Williams, et al., 2022) [76]. These scales have provided additional evidence of the importance of measuring organizational health behavior and its impact on employee well-being and job performance. However, these scales also have some limitations. For example, these scales focused on specific aspects of organizational health, while neglecting other important dimensions. This limited scope did not provide a comprehensive understanding of organizational health behavior. Moreover, the existing scales have been developed and validated in specific sectors, which may limit their applicability to other sectors. There is, however, a relative dearth of research considering the measurement of organizational health from a wider perspective, considering various sectors of the work field. While considering these limitations, there arose scope for developing a new scale that can address these issues and provide a more comprehensive and specific assessment of organizational health behavior from different sectors: a new 26-item scale that included two subscales. Subscale A is a quantitative measure of five dimensions: awareness, appreciation, relations, employee engagement, and internal communication. Subscale B is a qualitative measure of three dimensions: employee persona, organizational culture, and employee voice. The items were more specific and tailored to the organizational context and were developed and validated in a range of cultural settings to ensure cross-cultural validity. Additionally, efforts were made to minimize response bias by ensuring the anonymity of participants and using validated techniques for data collection and analysis. Therefore, a new scale that addresses these limitations can provide a more accurate and useful assessment of organizational health behavior.
Long overdue is the understanding of the significance of upstream performance determinants inside the organizational field. We will be able to evaluate and objectively assess the relative provision of organizational elements necessary for excellent performance over the long term by using measurements such as the OHBI. Overall, the OHBI, with its 26 items in eight dimensions, is a valuable addition to the field of organizational health measurement and provides a comprehensive assessment of organizational health behavior.
Practical Implications: Organizations can identify areas that need improvement with the help of the OHBI. Managers can identify priority areas and apportion resources appropriately by looking at the ratings on the various organizational health behavior characteristics. Interventions can be crafted to target certain flaws when organizational health behavior is thoroughly measured. Therefore, to enhance the areas with lower scores, organizations can create specialized training programs, workshops, or projects.
Workforce engagement is probably higher in organizations with higher OHBI ratings. The index can be used as a guide to establish a supportive workplace that encourages worker happiness, productivity, and retention. Utilizing the index, organizations can assess how well their health behavior scores compare to industry standards or best practices. This contrast enables students to comprehend where they are in relation to others and gain insight into effective tactics. Consequently, the OHBI may affect the way of making strategic choices. Organizations can make themselves more efficient and long-lasting by aligning their objectives and strategies with the factors that influence overall health behavior the most. The index may be used as another performance measurement. A culture of continuous improvement can be promoted by recognizing and rewarding teams or departments for their good contributions to organizational health behavior. It can be utilized to track the effects of large organizational changes on health behavior. Similarly, it can be applied as a part of a process of ongoing learning and development. Regular evaluations can shed light on the success of previous efforts and inform future tactics. Moreover, it can be used by organizations to evaluate the influence of leadership on health behavior. It enables the identification of areas that may require leadership training and development in order to generate a more positive organizational culture.
The OHBI, in conclusion, offers insightful information regarding an organization’s general health behavior and pinpoints particular areas for development. With the aid of this tool, businesses may carry out focused interventions, boost worker engagement, and connect strategies with health behavior characteristics, ultimately ensuring a productive and long-lasting workplace.

7. Limitations

The current study was conducted on five sectors: agriculture, education, government, health, and logistics. Moreover, the study involved three sample groups, including a large sample of 3510 respondents, which reflects its power of generalizability. Despite the strengths of the research in the construction and validation of the OHBI, there are some limitations that should be acknowledged, as follows.
(1)
The sample used in the study was limited to participants working in the Saudi region, which may limit the generalizability of the framework to other geographies. More research is needed to test the OHBI in different settings and with a more diverse range of participants.
(2)
The OHBI data were collected through self-report questionnaires, which may be subject to social desirability bias or other response biases. Future research could benefit from utilizing multiple methods of data collection, such as interviews or behavioral observations, to complement self-report data.
(3)
The present study used a cross-sectional design, which limits the ability to draw causal inferences about the relationships between organizational health behavior and employee well-being. Future research could benefit from longitudinal designs to examine changes in organizational health behavior and its effects on employee outcomes over time.
(4)
The current gauge measures eight dimensions of organizational health behavior, which may not capture the full range of factors that contribute to employee well-being and productivity. Future research could benefit from exploring additional dimensions or factors that may influence organizational health behavior and employee outcomes.
(5)
The OHBI was internally validated through exploratory and confirmatory factor analyses; however, external validation was conducted using only one external criterion. Further research is needed to validate the OHBI against other established measures of organizational health behavior to ensure its reliability and validity.
Overall, while the OHBI represents an important contribution to the field of organizational health behavior research, further research is needed to address these limitations and provide a more comprehensive understanding of the factors that influence employee well-being and productivity.

8. Future Work

A solid foundation for comprehending and evaluating health behavior within businesses has been established by the development and validation of the Organizational Health Behavior Index (OHBI). The application and impact of the OHBI can be improved, as with any research project, with additional effort in the future. Some potential directions for further research include those listed below.
Validation across Cultures: The current study’s main goal was to establish the OHBI’s cultural validity. Future studies could examine the OHBI’s cross-cultural validity by utilizing it in other cultural contexts and comparing the outcomes. It needs to be verified in more languages and locations. This will make it easier to spot any potential cultural differences in how organizational health behavior is understood and expressed.
Longitudinal Studies: Conducting studies over time using the OHBI can offer important insights into how organizational health behavior changes over time. The effectiveness of interventions and the influence of outside factors on trends in health behavior can both be learned through monitoring changes in health behavior within businesses.
Gender Diversity: Future studies should give due consideration to other genders to include the health behavior of them as well.

Author Contributions

The authors confirm responsibility for the following. M.J. was responsible for the study’s conception, research design, and data collection, with assistance from A.A. in writing the discussion section, A.T. and Z.A. for data analysis and interpretation, and R.A., the corresponding author, for detailed manuscript preparation. All authors have read and agreed to the published version of the manuscript.

Funding

This research received no external funding.

Institutional Review Board Statement

The study did not require ethical approval as it did not involve experimentation on humans or animals, nor did it pose any other risks to individuals or living beings.

Informed Consent Statement

Informed consent was obtained from all subjects involved in the study.

Data Availability Statement

Data will be available on request.

Acknowledgments

The authors would like to thank the following individuals for their efforts and contributions to the OHBI data collection and conceptualization: Haia Bin Ajaje, Rahaf Al Swiket, Meznah Jaafari and Demmah Sultan.

Conflicts of Interest

The authors have no conflicts of interest to declare. All co-authors have seen and agree with the contents of the manuscript, and there is no financial interest to report.

Appendix A. OHBI

All the questions for Subscale A are to be answered on 5 point Likert scale, from strongly disagree to strongly agree, and Subscale B questions are based on multiple-choice questions.
NeedsFactorSubfactorsQuestion
-Demographic
  • Gender
  • Tenure
  • Managerial level
  • Sector
  • Location
  • Male or female
  • Select your years of experience.
    • Less than 3 months
    • 3–6 months
    • 6–12 months
    • 1–2 years
    • 2–4 years
    • More than 3 months
  • Select your position
  • Select your sector
  • Select your location
Basic needsAwarenessAwareness of
  • Strategy
  • Values
  • News
  • Rights
  • I am aware of my organization’s strategy and its future directions.
  • I am implementing our organization’s values in my daily work.
  • I am aware of my organization’s external and internal news.
  • I am aware of my rights and privileges as an employee in my organization.
Basic needsAppreciationAppreciation from
  • Manager
  • Organization
  • Employee
  • My direct manager appreciates my work and my accomplishments satisfactorily.
  • My organization appreciates my efforts by providing the necessary capabilities to better my work.
  • I rarely think about leaving (my organization) to work somewhere else
Basic needsRelationRelationship between
  • Employees
  • Employee–line manager
  • Employee’s family–organization
  • My relationship with my colleagues in other departments is effective
  • My relationship with my line manager is perfect.
  • My family’s relationship with my organization is good (their awareness of the nature of my work, their appreciation of the services provided by my organization, and its news).
Corporate needsEngagementEngagement with
  • Organization
  • Jobs
  • Coworkers
  • I am keen to publish achievements and activities of my organization through my accounts on social media and my external meetings.
  • I don’t feel the time I spend on developing my tasks while I’m working
  • I know the professional history of my colleagues, their health, and how to deal with them in general.
Corporate needsInternal communicationInternal communication
  • Internal events activation
  • Services of the department
  • Communication channels
  • My organization interacts very well with the international days compared to other organization.
  • The services provided by internal communication during the last year were satisfactory, whether it was email communication messages or motivational initiatives and recreational and interactive activities).
  • Internal communication was able to reach me through various communication channels.
Corporate needsEmployee PersonaEmployee’s:
  • Interests
  • Type of Engagement
  • Method of Communication
  • Appreciation Definition
  • Employee Loyalty
  • Identify your top three personal interests:
    • Sports and health
    • Technology and E- games
    • Entertainment and shopping
    • Money and business
    • Restaurants and cafes
    • Education and development
    • Volunteering and community service
    • Travel and tourism
    • Plant and animal wildlife
    • Culture and arts
  • Identify the most important things you know about your coworkers:
    • Their health condition
    • Their hobbies and talents
    • Their professional and academic history
    • How to deal with them
    • General information about them
    • not interested
  • Best three ways to deliver communication messages for you:
    • Email
    • Intranet
    • Snapchat
    • Server screens
    • Telegram
    • Text messages, SMS
    • WhatsApp
    • Wall stickers
    • Workshops
  • Determine the four most important means of appreciation for you:
    • Appreciation by management.
    • Involve me in important decisions.
    • Announcing and highlighting my achievements.
    • Taking care of my physical health.
    • Taking care of my mental health.
    • Taking care of my professional development and career development.
    • Verbal appreciation and gratitude.
    • Gifts.
    • Clarify my rights and privileges.
    • Financial benefits and compensation.
  • Pick the one you appreciate the most:
    • Your colleagues.
    • Your manager.
    • Your organization.
Corporate needsEmployee voice
  • Positive
  • Negative
  • What do you think are the most prominent negative aspects of our work environment?
  • What are the most prominent positive aspects of our work environment, and how can we enhance them?

References

  1. Charoghchian Khorasani, E.; Sany, S.B.T.; Tehrani, H.; Doosti, H.; Peyman, N. Review of Organizational Health Literacy Practice at Health Care Centers: Outcomes, Barriers and Facilitators. Int. J. Environ. Res. Public Health 2020, 17, 7544. [Google Scholar] [CrossRef] [PubMed]
  2. Ikechukwu, N.P.; Achori, T.D.; Uchenna, E.S.; Okechukwu, A.K.E. Work environment as a tool for improving Employees performance and organizational productivity. IJAR 2019, 5, 241–247. [Google Scholar]
  3. Lowe, G. Creating Healthy Organizations: How Vibrant Workplaces Inspire Employees to Achieve Sustainable Success; University of Toronto Press: Toronto, ON, Canada, 2010. [Google Scholar]
  4. Grawitch, M.J.; Ballard, D.W. The Psychologically Healthy Workplace: Building a Win-Win Environment for Organizations and Employees; American Psychological Association: Washington, DC, USA, 2016. [Google Scholar]
  5. Arnoux-Nicolas, C.; Sovet, L.; Lhotellier, L.; Di Fabio, A.; Bernaud, J.L. Perceived work conditions and turnover intentions: The mediating role of meaning of work. Front. Psychol. 2016, 7, 704. [Google Scholar] [CrossRef] [PubMed]
  6. Tantry, A.; Ali, Z. Job Satisfaction among Non-teaching Staffs of Secondary Schools. Ann. Trop. Med. Public Health 2020, 23, 1371–1376. [Google Scholar] [CrossRef]
  7. Gilani, S.; Gernal, L.; Tantry, A.; Yasin, N.; Sergio, R. Leadership Styles Adopted by Scottish Micro-businesses During the COVID-19 Pandemic. Digit. Oppor. Chall. Bus. 2023, 1, 144–156. [Google Scholar]
  8. SHRM Advisor. What Are the Right Metrics to Measure Organizational Health? SHRM: Alexandria, VI, USA, 2023; Available online: https://www.shrm.org/shrm-india/pages/what-are-the-right-metrics-to-measure-organizational-health.aspx (accessed on 18 March 2023).
  9. Bridges, M. Managing Performance by Leveraging the Organizational Health Index (OHI)|flevy.com/blog, 27 May 2019. Available online: https://flevy.com/blog/managing-performance-by-leveraging-the-organizational-health-index-ohi/ (accessed on 9 February 2023).
  10. Kruk, M.E.; Gage, A.D.; Arsenault, C.; Jordan, K.; Leslie, H.H.; Roder-DeWan, S.; Adeyi, O.; Barker, P.; Daelmans, B.; Doubova, S.V.; et al. High-quality health systems in the Sustainable Development Goals era: Time for a revolution. Lancet Glob. Health 2018, 6, e1196–e1252. [Google Scholar] [CrossRef]
  11. Carmines, E.G.; Woods, J. Index. In The Sage Encyclopedia of Social Science Research Methods; Lewis-Beck, M.S., Bryman, A., Liao, T.F., Eds.; Sage: Thousand Oaks, CA, USA, 2004; Volume 2, pp. 485–486. [Google Scholar]
  12. Baxter, L.A.; Babbie, E.R. The Basics of Communication Research; Cengage Learning: Boston, MA, USA, 2003. [Google Scholar]
  13. Available online: https://www.mckinsey.com/capabilities/people-and-organizational-performance/our-insights/the-hidden-value-of-organizational-health-and-how-to-capture-it (accessed on 19 March 2023).
  14. Miller, R.L.; Griffin, M.A.; Hart, P.M. Personality and organizational health: The role of conscientiousness. Work Stress 1999, 13, 7–19. [Google Scholar] [CrossRef]
  15. Cotton, P.; Hart, P.M. Occupational wellbeing and performance: A review of organisational health research. Aust. Psychol. 2003, 38, 118–127. [Google Scholar] [CrossRef]
  16. Lencioni, P.M. The Advantage: Why Organizational Health Trumps Everything Else in Business; John Wiley & Sons: Hoboken, NJ, USA, 2012. [Google Scholar]
  17. Bennis, W.G. Towards a “Truly” scientific management: The Concept of organization Health. Ind. Manag. Rev. 1962, 4, 1. [Google Scholar] [CrossRef]
  18. Talcott, P. Some ingredients of a general theory of formal organization. In Administrative Theory in Education; The Macmillan Company: New York, NY, USA, 1967; pp. 40–72. [Google Scholar]
  19. Miles, M.B. Planned Change and Organizational Health: Figure and Ground. In Organizations and Human Behavior: Focus on Schools; Carver, F.D., Sergiovanni, T.J., Eds.; McGraw-Hill: New York, NY, USA, 1969; pp. 375–391. [Google Scholar]
  20. Etzioni, A. Modern Organizations; Prentice Hall: Englewood Cliffs, NJ, USA, 1990. [Google Scholar]
  21. Teresa, R.; Robinson, A.; Vincent, A.; Anfara, J.R.; Christopher, L.; Henderson, A.E.; Buehler, W.L.; Stein, J.; Victoria, D. Principal Leadership for Equity and Excellence: A Case Study of an Inclusive Exemplary School. 2000. Available online: https://www.proquest.com/openview/cff32cb82797a7350a0431f69f541017/1?pq-origsite=gscholar&cbl=18750&diss=y (accessed on 14 April 2023).
  22. Gagnon, C.; John, E.; Theunissen, R. Organizational health: A fast track to performance improvement. In McKinsey Quarterly; McKinsey & Company: Singapore, 2017; Volume 7. [Google Scholar]
  23. Keller, S.; Price, C. Organizational Health: The Ultimate Competitive Advantage. In McKinsey Quarterly; McKinsey & Company: Singapore, 2011; Volume 2, pp. 94–107. [Google Scholar]
  24. Harjanti, S.S.; Gustomo, A. Organizational health index and organizational agility maturity criteria as measurement tools of organizational transformation effectiveness. J. Manaj. Teknol. 2017, 16, 2017. [Google Scholar] [CrossRef]
  25. GH, D.; M, E. The perception of teachers about organizational health in boy public schools of educational districts 3 and 12 in Tehran. J. New Approaches Educ. Adm. 2015, 6, 111–126. [Google Scholar]
  26. Farmahini, F.M.; Mirzamohamadi, M.H.; Afsouran, N.R.; Mohammadi, S.S. The study of the relationship of organizational health of the schools and that of the student’s’ academic achievement (A Case Study of High schools of Kohkilouie and Boierahmad Province, Iran 2011). Procedia-Soc. Behav. Sci. 2014, 109, 628–633. [Google Scholar] [CrossRef]
  27. Alabdaly, D.; Almayali, E. The Impact of Strategic Awareness on Organizational Readiness: An Analytic Research of the Opinions of the Sample of Top Leaderships in Private Colleges in the Provinces of the Al-Furat Al-Awsat in Iraq. Webology 2021, 18, 487–508. [Google Scholar] [CrossRef]
  28. Usman, U.M.Z.; Musa, M.A. The influence of organizational knowledge sharing on employee motivation. In 2012 International Conference on Information Retrieval & Knowledge Management, Kuala Lumpur, Malaysia, 13–15 March 2012; IEEE: Piscataway, NJ, USA, 2012; pp. 87–90. [Google Scholar]
  29. Annamaria, D.F.; Palazzeschi, L.; Bucci, O. Gratitude in organizations: A contribution for healthy organizational contexts. Front. Psychol. 2017, 8, 2025. [Google Scholar] [CrossRef]
  30. Rushing, K. Workplace Appreciation and Its Link to Organizational Health-Blue Hen. Blue Hen, 5 May 2021. Available online: https://bluehenagency.com/workplace-appreciation-and-its-link-to-organizational-health/ (accessed on 23 March 2023).
  31. GoodHire. Horrible Bosses: A Survey of the American Workforce|GoodHire. n.d. Available online: https://www.goodhire.com/resources/articles/horrible-bosses-survey/ (accessed on 23 March 2023).
  32. Suknunan, S.; Bhana, A. Influence of employee-manager relationship on employee performance and productivity. Probl. Perspect. Manag. 2022, 20, 28–42. [Google Scholar]
  33. Shier, M.L.; John, R.; Graham, D.N. Interpersonal interactions, workplace violence, occupational health outcomes among social workers. J. Soc. Work. 2018, 18, 525–547. [Google Scholar] [CrossRef]
  34. Faquir, I.; Habib, L. Impact of internal communication in organizational development. Int. J. Trend Res. Dev. 2016, 3, 2394–9333. [Google Scholar]
  35. Kang, M.; Sung, M. How symmetrical employee communication leads to employee engagement and positive employee communication behaviors: The mediation of employee-organization relationships. J. Commun. Manag. 2017, 21, 82–102. [Google Scholar] [CrossRef]
  36. Franklin, T. The impact of internal communication on employee performance in an organization. SSRN Electron. J. 2013, 81. [Google Scholar] [CrossRef]
  37. Gandica, T.; Talwar, M.; Thungon, S.W.; Pyrtuh, E.K.; Kumah, E. Internal Communications in The Time of A Global Pandemic. Master’s Thesis, School of Professional Studies, Clark University, Worcester, MA, USA, 2021. [Google Scholar]
  38. Zweber, Z.M.; Henning, R.A.; Magley, V.J. A practical scale for Multi-Faceted Organizational Health Climate Assessment. J. Occup. Health Psychol. 2016, 21, 250. [Google Scholar] [CrossRef] [PubMed]
  39. Shin, Y.; Hur, M. Do Organizational Health Climates and Leader Health Mindsets Enhance Employees’ Work Engagement and Job Crafting Amid the Pandemic? Int. J. Environ. Res. Public Health 2021, 18, 12123. [Google Scholar] [CrossRef] [PubMed]
  40. Schein, E.H. Organizational Culture and Leadership; John Wiley & Sons: Hoboken, NJ, USA, 2010; Volume 2. [Google Scholar]
  41. Cameron, K.S.; Quinn, R.E. Changing Organizational Culture: Based on the Competing Values Framework; Jossey-Bass: San Francisco, CA, USA, 2011. [Google Scholar]
  42. Nurture an Engaged and Satisfied Workforce|Vantage Circle HR Blog. How Understanding Employee Persona Can Help Employers. 26 June 2020. Available online: https://blog.vantagecircle.com/employee-persona/ (accessed on 4 April 2023).
  43. Wilkinson, A.; Gollan, P.J.; Kalfa, S.; Xu, Y. Voices unheard: Employee voice in the new century. Int. J. Hum. Resour. Manag. 2018, 29, 711–724. [Google Scholar] [CrossRef]
  44. Morrison, E.W. Employee voice behavior: Integration and directions for future research. Acad. Manag. Ann. 2011, 5, 373–412. [Google Scholar] [CrossRef]
  45. Ye, M.; Chen, Y.; Liu, Y.; Li, X. Impact of organizational health-oriented strategies on employees’ job performance, perceived medical mistrust as a moderator: A COVID-19 perception-based view. Front. Public Health 2022, 10, 946946. [Google Scholar] [CrossRef]
  46. Suwanyuha, K.; Rinthaisong, I. Structural equation modeling of organizational health in the marine fisheries management section under the fisheries management bureau. Kasetsart J. Soc. Sci. 2018, 39, 387–392. [Google Scholar] [CrossRef]
  47. Awotunde, J.B.; Ajagbe, S.A.; Oladipupo, M.A.; Awokola, J.A.; Afolabi, O.S.; Mathew, T.O.; Oguns, Y.J. An improved machine learnings diagnosis technique for COVID-19 pandemic using chest X-ray images. In Applied Informatics, Proceedings of the Fourth International Conference, ICAI 2021, Buenos Aires, Argentina, 28–30 October 2021; Springer International Publishing: Cham, Switzerland, 2021. [Google Scholar]
  48. Clayton, S.; Karazsia, B.T. Development and validation of a measure of climate change anxiety. J. Environ. Psychol. 2020, 69, 101434. [Google Scholar] [CrossRef]
  49. Tabachnick, B.G.; Fidell, L.S. Using Multivariate Statistics, 7th ed.; Pearson: London, UK, 2019. [Google Scholar]
  50. Demir, Süleyman. Comparison of normality tests in terms of sample sizes under different skewness and Kurtosis coefficients. Int. J. Assess. Tools Educ. 2022, 9, 397–409. [Google Scholar] [CrossRef]
  51. Wilson, J.; Hair, C.; Knight, R.; Catto-Smith, A.; Bell, S.; Kamm, M.; Desmond, P.; McNeil, J.; Connell, W. High incidence of inflammatory bowel disease in Australia: A prospective population-based Australian incidence study. Inflamm. Bowel Dis. 2010, 16, 1550–1556. [Google Scholar] [CrossRef]
  52. Bryne. Structural Equation Modeling with Amos: Basic Concepts, Applications, and Programming, 2nd ed.; Taylor and Francis Group: New York, NY, USA, 2010. [Google Scholar]
  53. Tabachnick, B.G.; Fidell, L.S.; Ullman, J.B. Using Multivariate Statistics; Pearson: Boston, MA, USA, 2007; Volume 5. [Google Scholar]
  54. Kaiser, H.F. A second generation little jiffy. Psychometrika 1970, 35, 401–415. [Google Scholar] [CrossRef]
  55. Bartlett, M.S. A note on the multiplying factors for various χ2 approximations. J. R. Stat. Soc. Ser. B (Methodol.) 1954, 16, 296–298. [Google Scholar] [CrossRef]
  56. Velicer, W.F.; Jackson, D.N. Component analysis versus common factor analysis: Some issues in selecting an appropriate procedure. Multivar. Behav. Res. 1990, 25, 1–28. [Google Scholar] [CrossRef]
  57. Costello, A.B.; Osborne, J. Best practices in exploratory factor analysis: Four recommendations for getting the most from your analysis. Pract. Assess. Res. Eval. 2005, 10, 7. [Google Scholar]
  58. DeVellis, R.F.; Carolyn, T. Thorpe. In Scale Development: Theory and Applications; Sage Publications: Thousand Oaks, CA, USA, 2021. [Google Scholar]
  59. Dubravka, S.; Rutkowski, L.; Rutkowski, D. Multiple-group invariance with categorical outcomes using updated guidelines: An illustration using M plus and the lavaan/semtools packages. Struct. Equ. Model. A Multidiscip. J. 2020, 27, 111–130. [Google Scholar]
  60. Cohen, J. Statistical Power Analysis for the Behavioral Sciences; Lawrence Erlbaum: Hillsdale, NJ, USA, 1988. [Google Scholar]
  61. Nwokeoma, B.N.; Ede, M.O.; Nwosu, N.; Ikechukwu-Illomuanya, A.; Ogba, F.N.; Ugwoezuonu, A.U.; Offordile, E.E.; Agu, P.U.; Amoke, C.; Eze, C.O.; et al. Impact of rational emotive occupational health coaching on work-related stress management among staff of Nigeria police force. Medicine 2019, 98, 2019. [Google Scholar] [CrossRef]
  62. Ranka, S.; Quigley, J.; Hussain, T. Behaviour of occupational health services during the COVID-19 pandemic. Occup. Med. 2020, 70, 359–363. [Google Scholar] [CrossRef]
  63. Shoss, M. Occupational health psychology research and the COVID-19 pandemic. J. Occup. Health Psychol. 2021, 26, 259. [Google Scholar] [CrossRef]
  64. Sinclair, R.R.; Probst, T.M.; Watson, G.P.; Bazzoli, A. Caught between Scylla and Charybdis: How economic stressors and occupational risk factors influence workers’ occupational health reactions to COVID-19. Appl. Psychol. 2021, 70, 85–119. [Google Scholar] [CrossRef] [PubMed]
  65. Chatchai, E.; Padungtod, C. Occupational health problems and lifestyle changes among novice working-from-home workers amid the COVID-19 pandemic. Saf. Health Work. 2021, 12, 384–389. [Google Scholar]
  66. Chanana, N.; Sangeeta. Employee engagement practices during COVID-19 lockdown. J. Public Aff. 2021, 21, e2508. [Google Scholar] [CrossRef] [PubMed]
  67. D’Angelo, C.; Gazzaroli, D.; Corvino, C.; Gozzoli, C. Changes and Challenges in Human Resources Management: An Analysis of Human Resources Roles in a Bank Context (after COVID-19). Sustainability 2022, 14, 4847. [Google Scholar] [CrossRef]
  68. Khurana, S.; Haleem, A.; Luthra, S.; Huisingh, D.; Mannan, B. Now is the time to press the reset button: Helping India’s companies to become more resilient and effective in overcoming the impacts of COVID-19, climate changes and other crises. J. Clean. Prod. 2021, 280, 124466. [Google Scholar] [CrossRef] [PubMed]
  69. Fazal, S.; Masood, S.; Nazir, F.; Majoka, M.I. Individual and Organizational Strategies for Promoting Work–Life Balance for Sustainable Workforce: A Systematic Literature Review from Pakistan. Sustainability 2022, 14, 11552. [Google Scholar] [CrossRef]
  70. Kirsten, W. The Evolution from Occupational Health to Healthy Workplaces. Am. J. Lifestyle Med. 2022, 134–138. [Google Scholar] [CrossRef]
  71. Arief, Y.; Fauji, M.R.; Arifin, R.F.; Hidayat, B. A Community Intervention in COVID-19 Pandemic: Occupational Health and Safety for Moslem Online Transportation. Psikis J. Psikol. Islam. 2021, 7, 161–168. [Google Scholar] [CrossRef]
  72. De Smet, I.; Tetsumura, T.; De Rybel, B.; Frei dit Frey, N.; Laplaze, L.; Casimiro, I.; Swarup, R.; Naudts, M.; Vanneste, S.; Audenaert, D.; et al. Auxin-dependent regulation of lateral root positioning in the basal meristem of Arabidopsis. Development 2007, 134, 681–690. [Google Scholar] [CrossRef] [PubMed]
  73. Todd, J.; Sharpe, L.; Johnson, A.; Perry, K.N.; Colagiuri, B.; Dear, B.F. Towards a new model of attentional biases in the development, maintenance, management of pain. Pain 2015, 156, 1589–1600. [Google Scholar] [CrossRef]
  74. De Winter, J.C.; Gosling, S.D.; Potter, J. Comparing the Pearson and Spearman correlation coefficients across distributions and sample sizes: A tutorial using simulations and empirical data. Psychol. Methods 2016, 21, 273. [Google Scholar] [CrossRef]
  75. Nicolay, C.R.; Williams, S.P.; Brkic, M.; Purkayastha, S.; Chaturvedi, S.; Phillips, N.; Darzi, A. Measuring the organisational health of acute sector healthcare organisations: Development and validation of the Healthcare-OH survey. Int. J. Healthc. Manag. 2019, 14, 64–76. [Google Scholar] [CrossRef]
  76. Williams, S.P.; Purkayastha, S.; Chaturvedi, S.; Darzi, A. The GP-OH (General Practice–Organizational Health) Survey: Development and Validation of a Novel Instrument to Measure Organizational Health in General Practice. Hosp. Top. 2022, 100, 177–187. [Google Scholar] [CrossRef]
Figure 1. The scree plot shows eight factors with eigenvalues much higher than 1, the cutoff value.
Sustainability 15 13650 g001
Figure 2. The path model.
Sustainability 15 13650 g002
Table 1. Summary of phases, studies and steps for methodologies and results.
Subscale A (Quantitative Scale)
Phase 1StudiesSample GroupMethods/Operations
18 Subject expertsItem generation and validity
2Sample group 1 = 496EFA
Phase 23Sample group 2 = 3510Reliability (Cronbach’s alpha)
4Same sample group 2 of 3510CFA
Phase 35Sample group 3 = 218Validity (criterion validity)
Subscale B (Qualitative Scale)
Phase 465 ExpertsItem generation and validity
7Sample group 4 = 50Content analysis
83 ExpertsReliability (interrater reliability)
Table 2. Descriptive statistics.
NMeanSDSkewnessKurtosis
StatisticStatisticStatisticStatisticStatistic
AW14962.810.702−0.847−0.158
AW24963.130.951−1.2770.964
AW34962.620.766−0.600−0.493
AW44962.430.974−0.430−1.062
RL14963.030.987−1.0780.359
RL24963.320.766−1.7092.243
RL34962.640.561−0.662−0.661
EE24963.580.755−1.3772.814
EE14962.650.602−0.691−0.806
EE34962.860.788−0.877−0.082
AP14962.570.750−0.644−0.761
AP24962.530.716−0.552−0.857
MA14963.010.912−1.1050.544
MA24962.930.852−0.9490.099
MA34962.860.752−0.859−0.017
CM24960.2500.0101.130−0.724
CM54960.3000.0731.4092.274
PI14960.6100.408−0.446−1.802
PI24960.3900.0880.439−1.808
OC34961.750.658−0.322−1.250
OC24961.680.564−0.195−1.623
OC14962.240.0490.973−0.523
PI34960.6200.186−0.477−1.773
Valid N (listwise)496
Table 3. Assumptions to justify the use of EFA.
KMO and Bartlett’s Test a
Kaiser–Meyer–Olkin Measure of Sampling Adequacy0.933
Bartlett’s Test of SphericityApprox. Chi-Squared3.122 × 104
df276
Sig.0.000
a Based on correlations.
Table 4. Principal component analysis as an extraction method.
ComponentInitial Eigenvalues a
Total% of VarianceCumulative %
Raw111.42638.26438.264
23.99513.37851.642
31.8016.03057.672
41.6975.68363.355
51.2724.25967.615
61.1783.94571.559
71.0593.54775.106
81.0013.32078.426
90.8092.70981.135
100.7682.57383.708
110.6882.30486.012
120.6092.04188.052
130.5661.89589.947
140.4591.53791.484
150.4211.41092.894
160.3851.28994.183
170.3561.19295.376
180.2680.89896.273
190.2450.82297.095
200.2310.77497.869
210.2180.73198.600
220.1990.66599.265
230.1450.48699.751
240.0740.249100.000
Extraction method: principal component analysis. a = The “a” sign in the context of initial eigenvalues refers to the eigenvalues associated with the correlation or covariance matrix of the observed variables. Eigenvalues represent the variance explained by each factor. An eigenvalue of “a” would typically mean that the factor explains “a” amount of variance in the observed variables.
Table 5. Component matrix of factor loadings using principal component analysis.
Component Matrix a
Component
12345678
AW30.988
AW40.963
AW10.815
AW20.772
AP1 0.842
AP2 0.831
AP3 0.819
EE3 0.901
EE1 0.874
EE2 0.731
RL2 0.891
RL1 0.874
RL3 0.730
OC2 0.796
OC3 0.776
OC1 0.753
PI1 0.750
PI3 0.733
PI2 0.721
MA1 0.746
MA3 0.724
MA2 0.711
CM2 0.634
CM5 0.615
Extraction method: principal component analysis. a: 3 components extracted.
Table 6. Cronbach’s alpha for 24 items of the OHBI.
No. of ItemsCronbach’s Alpha
Overall OHBI Scale 240.888
Factor 1 Awareness40.912
Factor 2 Appreciation30.896
Factor 3 Employee Engagement30.903
Factor 4 Relations30.941
Factor 5 Internal Communication 30.925
Factor 6 Employee Persona30.647
Factor 7 Organizational Cultures30.623
Factor 8 Communication20.610
Table 7. Corrected item–total statistics on an overall scale.
Overall ScaleCorrected Item–Total CorrelationCronbach’s Alpha if Item Deleted
AW10.6670.778
AW20.6690.779
AW30.6400.779
AW40.7080.801
AP10.6800.780
AP20.7450.782
AP30.5710.778
EE10.5840.784
EE20.5530.781
EE30.5750.781
RL10.5940.777
RL20.5370.775
RL30.6660.779
OC10.5510.618
OC20.5280.608
OC30.5340.730
PI10.5600.690
PI20.5990.749
PI30.5160.689
IC10.6570.789
IC20.6650.789
IC30.6760.802
CM20.5220.859
CM50.5010.841
Table 8. OHBI distribution in the normative sample by gender.
Male (n = 2110)Female (n = 1400)
MSDMSDF (1, 3508)pCohen’s d (1988) [60]
AW80.0112.879.3811.31.320.7080.07
AP83.229.584.0210.71.700.3600.04
RL48.156.747.186.40.980.1520.11
EE47.106.647.695.80.930.2270.11
IC80.5210.179.4411.21.120.4230.09
Criteria for interpreting Cohen’s d are 0.2 = small, 0.5 = medium, 0.8 = large.
Table 9. Confirmatory factor analysis fit indices for eight-factor model (OHBI-16) (n = 3510).
Modelχ2χ2/dfdfNFIRFIGFIIFITLICFIRMSEA
Five-Factor Model3202.13612.2451880.9260.9090.9410.9320.9160.9310.057
Table 10. Factor loadings/standardized beta coefficients on five subscales of 16 items OHBI (OHBI-22).
PathsStandardized Beta Coefficient/Factor Loadings
Factor 1 Awareness
Item 10.799 ***
Item 20.771 ***
Item 30.750 ***
Item 40.757 ***
Factor 2 Appreciation
Item 50.784 ***
Item 60.866 ***
Item 70.741 ***
Factor 3 Employee Engagement
Item 80.784 ***
Item 90.760 ***
Item 100.711 ***
Factor 4 Relations
Item 110.771 ***
Item 120.785 ***
Item 130.742 ***
Factor 5 Internal Communication/Maturity
Item 140.772 ***
Item 150.783 ***
Item 160.722 ***
*** Significant at the 0.001 level of significance.
Table 11. Correlations between dimensions of the OHBI and Brief QISO.
NPearson rpSig.
Awareness and accident safety and prevention2180.750.0010.01 **
Appreciation and organizational equity2180.730.0010.01 **
Relations and collaborative interpersonal relations2180.830.0010.01 **
Employee engagement and operational smoothness 2180.710.0130.05 *
Internal communication (maturity) and organizational context2180.730.0240.05 *
** Significant at the 0.01 level of significance; * Significant at the 0.01 level of significance.
Table 12. Final set of 16 items of the 5-factor quantitative model of Subscale A of the OHBI.
Item No.Items
1.I am aware of my organization’s strategy and its future directions.
2.I am implementing our organization’s values in my daily work
3.I am aware of my organization’s external and internal news.
4.I am aware of my rights and privileges as an employee in my organization.
5.My direct manager appreciates my work and my accomplishments satisfactorily.
6.My organization appreciates my efforts by providing the necessary capabilities to better my work.
7.I rarely think about leaving (my organization) to work somewhere else.
8.My relationship with my colleagues in other departments is effective.
9.My relationship with my line manager is perfect.
10.My family’s relationship with my organization is good (their awareness of the nature of my work, their appreciation of the services provided by my organization, and its news.
11.I am keen to publish achievements and activities of my organization through my accounts on social media and my external meetings.
12.I don’t feel the time I spend on developing my tasks while I’m working
13.I know the professional history of my colleagues, their health, and how to deal with them in general.
14.My organization interacts very well with the international days compared to other organization.
15.The services provided by the internal communication during the last year were satisfactory, whether it was email communication messages or motivational initiatives and recreational and interactive activities).
16.Internal communication was able to reach me through various communication channels.
Table 13. Final set of 10 items of the 3-factor qualitative method of Subscale B of the OHBI.
Item No.Item
1.Identify your top three personal interests.
2.Identify the most important things you know about your coworkers.
3.Best three ways to deliver communication messages for you.
4.Determine the four most important means of appreciation for you.
5.Pick the one you appreciate the most.
6.What is the most appropriate phrase that describes your organization’s priorities?
7.Choose the most appropriate word that describes your line manager?
8.What is the most appropriate word to describe your colleague?
9.What do you think are the most prominent negative aspects of our work environment?
10.What are the most prominent positive aspects of our work environment, and how can we enhance them?
Disclaimer/Publisher’s Note: The statements, opinions and data contained in all publications are solely those of the individual author(s) and contributor(s) and not of MDPI and/or the editor(s). MDPI and/or the editor(s) disclaim responsibility for any injury to people or property resulting from any ideas, methods, instructions or products referred to in the content.

