
Assessing the Use of Ziziphus spina-christi as a Sustainable Solution for Biomonitoring of Urban Air Quality: A Case Study from Qatar
 , ,
, ,
Abstract
:1. Introduction
2. Materials and Methodology
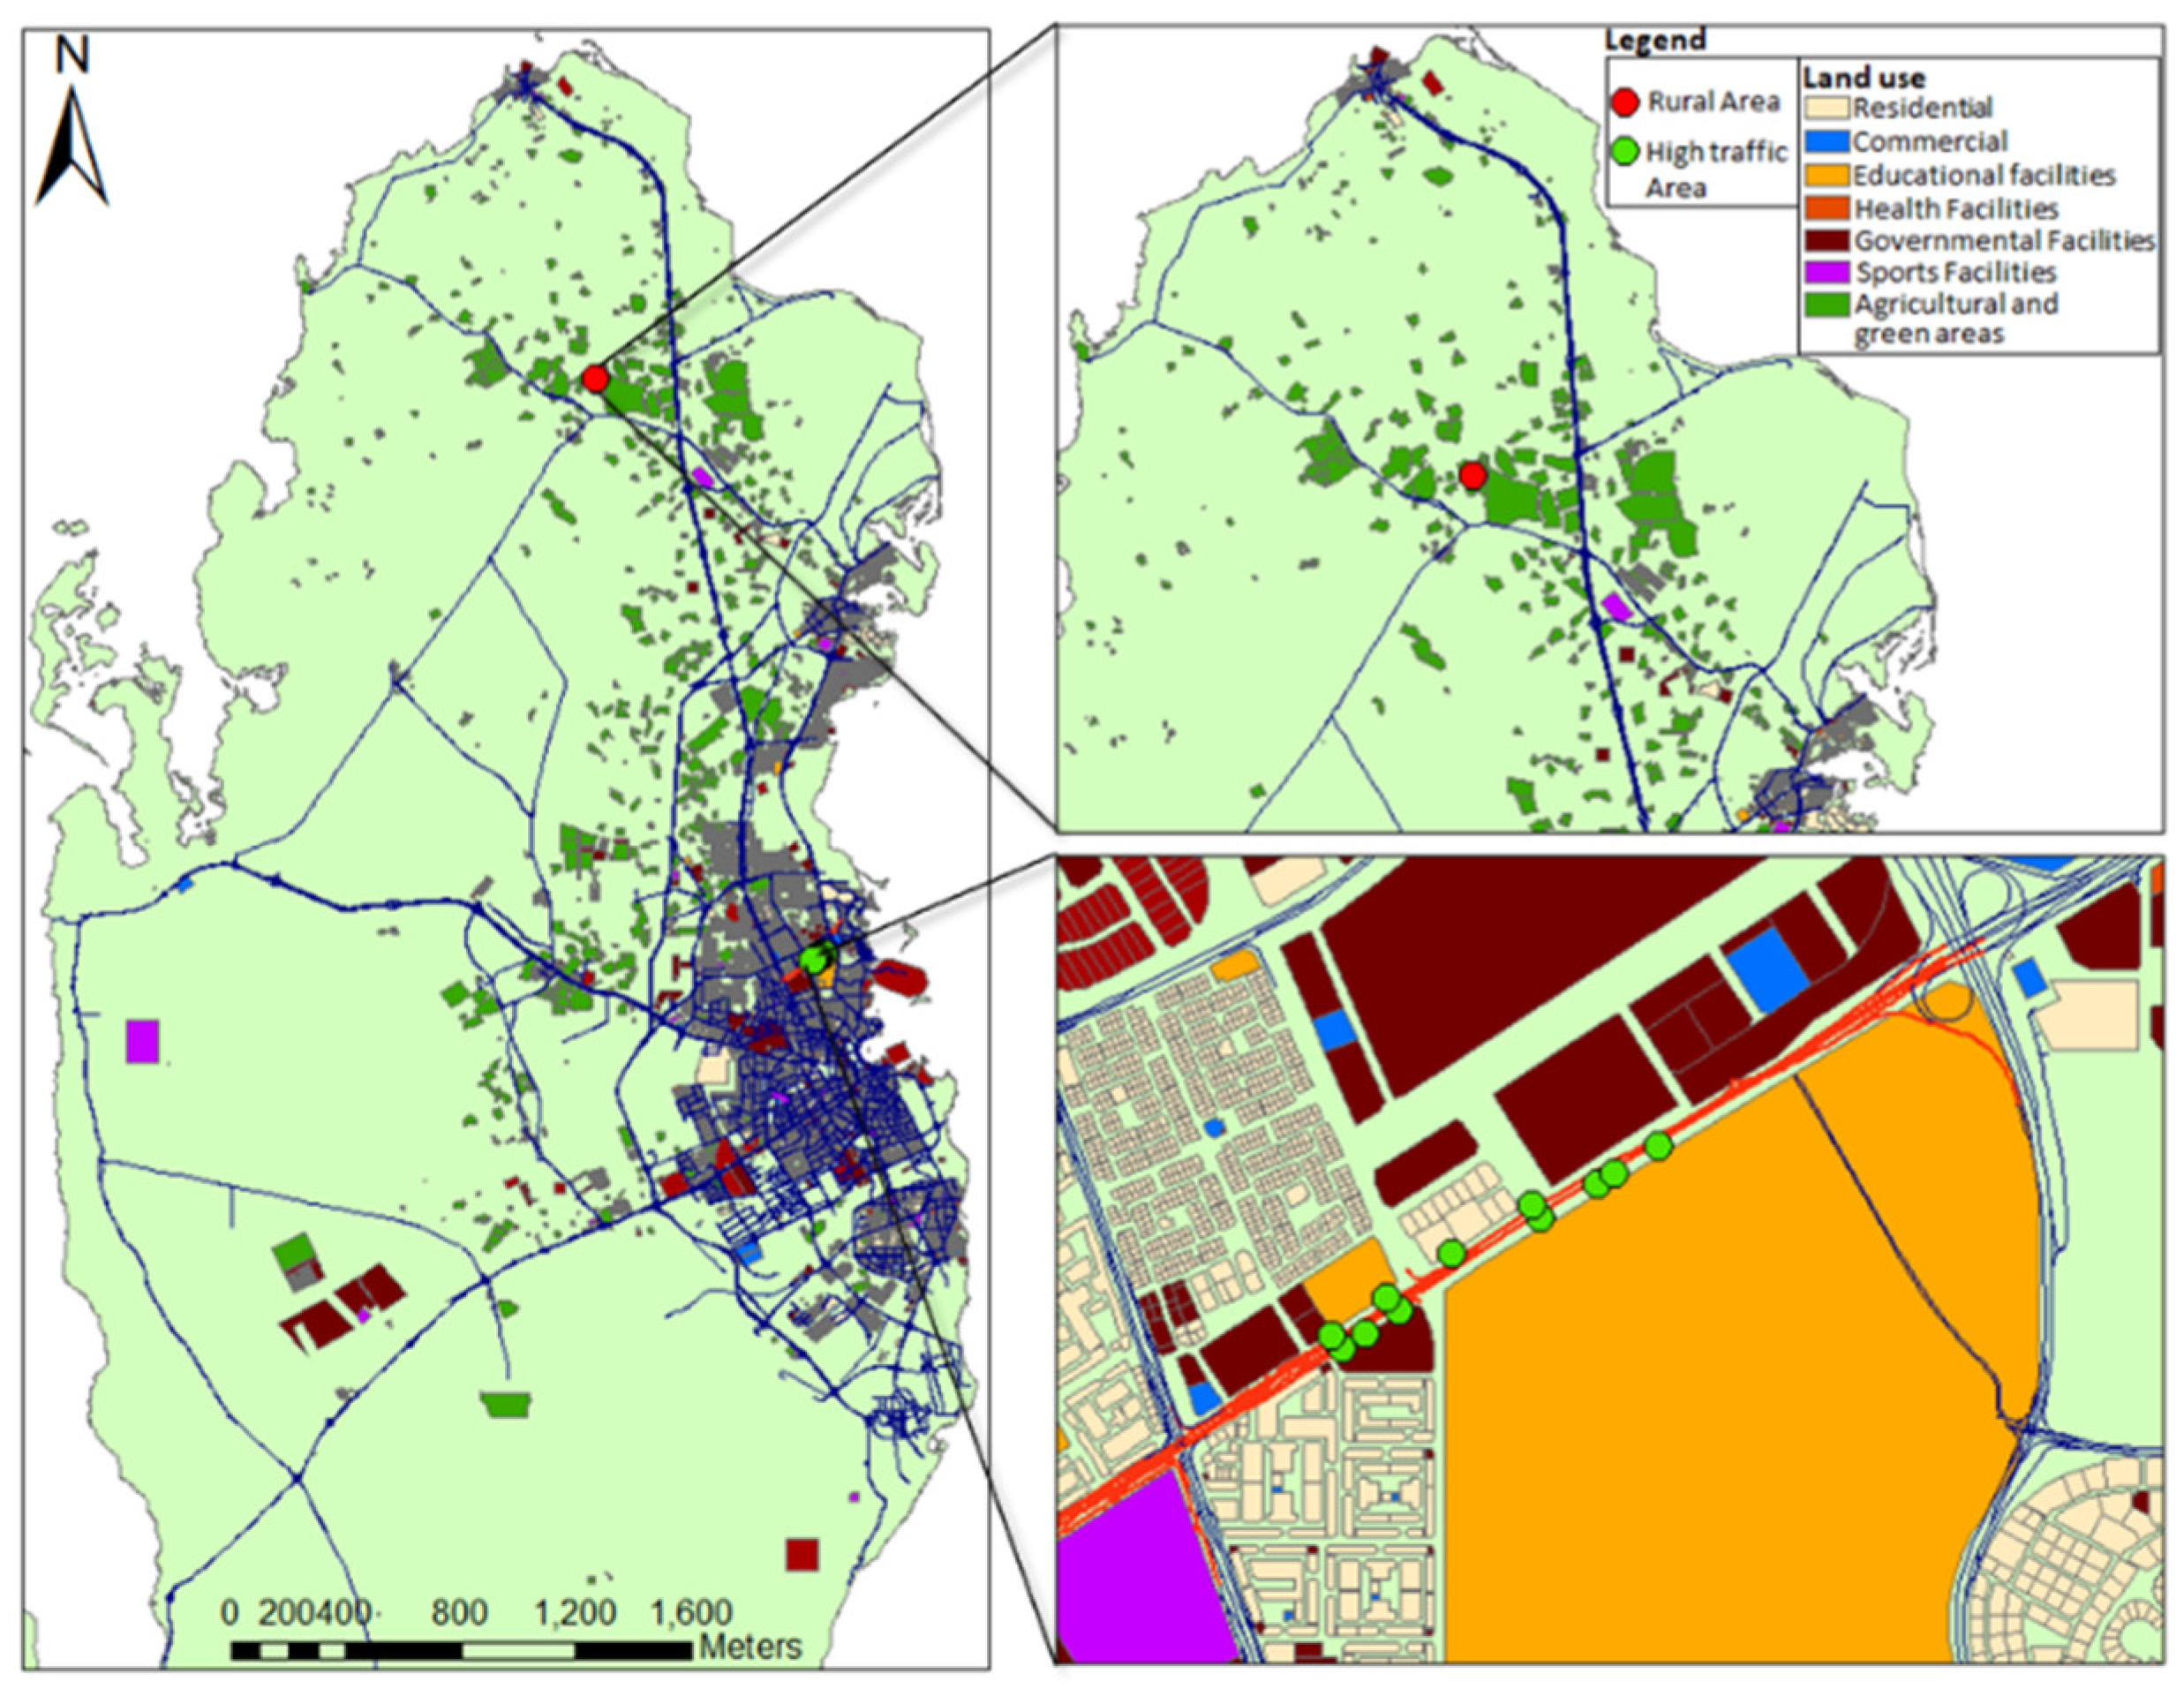
2.1. Study Area and Sampling Strategy
2.2. Biochemical Parameters
2.2.1. Ascorbic Acid
2.2.2. Total Chlorophyll Content (TChl)
2.2.3. pH of Leaf Extract
2.2.4. Relative Water Content (RWC)
2.3. Air Pollution Tolerance Index (APTI)
2.4. Chemical Analysis of Metals
2.5. Quality Assurance and Control
2.6. Bioconcentration Factor (BCF)
2.7. Statistical Analysis
3. Results and Discussions
3.1. Ascorbic Acid
3.2. Total Chlorophyll
3.3. pH
3.4. Relative Water Content
3.5. APTI
3.6. BCF
4. Conclusions
Author Contributions
Funding
Institutional Review Board Statement
Informed Consent Statement
Data Availability Statement
Acknowledgments
Conflicts of Interest
References
- D’Amato, G.; Cecchi, L.; D’Amato, M.; Liccardi, G. Urban Air Pollution and Climate Change as Environmental Risk Factors of Respiratory Allergy: An Update. J. Investig. Allergol. Clin. Immunol. 2010, 20, 95–102, quiz following 102. [Google Scholar] [PubMed]
- Sukmaningrum, P.S.; Widiastuti, T.; Aprilianti, L.; Aprilianto, E.D.; Madyan, M. The Challenge and the Impact of Green Belt as an Air Pollution Control. Int. J. Innov. Creat. Chang. 2020, 10, 463–471. [Google Scholar]
- Menon, J.S.; Sharma, R. Nature-Based Solutions for Co-Mitigation of Air Pollution and Urban Heat in Indian Cities. Front. Sustain. Cities 2021, 3, 93. [Google Scholar] [CrossRef]
- Jin, T.; Fu, L. Application of GIS to Modified Models of Vehicle Emission Dispersion. Atmos. Environ. 2005, 39, 6326–6333. [Google Scholar] [CrossRef]
- Krzyzanowski, M.; Kuna-Dibbert, B.; Schneider, J. Health Effects of Transport-Related Air Pollution; WHO Regional Office Europe: Copenhagen, Denmark, 2005; ISBN 9289013737. [Google Scholar]
- Manisalidis, I.; Stavropoulou, E.; Stavropoulos, A.; Bezirtzoglou, E. Environmental and Health Impacts of Air Pollution: A Review. Front. Public Health 2020, 8, 14. [Google Scholar] [CrossRef]
- Al-Naimi, N.; Balakrishnan, P.; Goktepe, I. Measurement and Modelling of Nitrogen Dioxide (NO2) Emissions: A Marker for Traffic-Related Air Pollution in Doha, Qatar. Ann. GIS 2015, 21, 249–259. [Google Scholar] [CrossRef]
- Biswal, B.K.; Bolan, N.; Zhu, Y.-G.; Balasubramanian, R. Nature-Based Systems (NbS) for Mitigation of Stormwater and Air Pollution in Urban Areas: A Review. Resour. Conserv. Recycl. 2022, 186, 106578. [Google Scholar] [CrossRef]
- Sowińska-Świerkosz, B.; García, J. What Are Nature-Based Solutions (NBS)? Setting Core Ideas for Concept Clarification. Nat.-Based Solut. 2022, 2, 100009. [Google Scholar] [CrossRef]
- European Commission. Nature-Based Solutions: EU-Funded Nbs Research Projects Tackle the Climate and Biodiversity Crisis. Available online: https://op.europa.eu/en/publication-detail/-/publication/780fb633-49e4-11ed-92ed-01aa75ed71a1/language-en (accessed on 27 August 2023).
- Wernecke, B.; Pool, J.-R. Are Nature-Based Solutions a Missing Link in Air Quality Management in South African Cities? Clean Air J. 2022, 32, 1–4. [Google Scholar] [CrossRef]
- Molnár, V.É.; Simon, E.; Tóthmérész, B.; Ninsawat, S.; Szabó, S. Air Pollution Induced Vegetation Stress—The Air Pollution Tolerance Index as a Quick Tool for City Health Evaluation. Ecol. Indic. 2020, 113, 106234. [Google Scholar] [CrossRef]
- Mukherjee, A.; Agrawal, M. Pollution Response Score of Tree Species in Relation to Ambient Air Quality in an Urban Area. Bull. Environ. Contam. Toxicol. 2016, 96, 197–202. [Google Scholar] [CrossRef]
- Jyothi, S.J.; Jaya, D.S. Evaluation of Air Pollution Tolerance Index of Selected Plant Species along Roadsides in Thiruvananthapuram, Kerala. J. Environ. Biol. 2010, 31, 379–386. [Google Scholar] [PubMed]
- Singh, S.K.; Rao, D.N. Evaluation of Plants for Their Tolerance to Air Pollution. In Proceedings of the Symposium on Air Pollution Control; IIT Delhi: Delhi, India, 1983; Volume 1, pp. 218–224. [Google Scholar]
- Shrestha, S.; Baral, B.; Dhital, N.B.; Yang, H.-H. Assessing Air Pollution Tolerance of Plant Species in Vegetation Traffic Barriers in Kathmandu Valley, Nepal. Sustain. Environ. Res. 2021, 31, 3. [Google Scholar] [CrossRef]
- Kaur, M.; Nagpal, A.K. Evaluation of Air Pollution Tolerance Index and Anticipated Performance Index of Plants and Their Application in Development of Green Space along the Urban Areas. Environ. Sci. Pollut. Res. 2017, 24, 18881–18895. [Google Scholar] [CrossRef]
- Liu, Y.J.; Ding, H. Variation in Air Pollution Tolerance Index of Plants near a Steel Factory: Implications for Landscape-Plant Species Selection for Industrial Areas. WSEAS Trans. Environ. Dev. 2008, 4, 24–32. [Google Scholar]
- Zhang, H.; Wang, S.; Hao, J.; Wang, X.; Wang, S.; Chai, F.; Li, M. Air Pollution and Control Action in Beijing. J. Clean. Prod. 2016, 112, 1519–1527. [Google Scholar] [CrossRef]
- Jabeen, R. Air Pollution Tolerance Index (APTI) of Some Plants Growing on the Roads of Abha, Saudi Arabia. Biosci. Biotechnol. 2019, 12, 631–636. [Google Scholar] [CrossRef]
- Alotaibi, M.D.; Alharbi, B.H.; Al-Shamsi, M.A.; Alshahrani, T.S.; Al-Namazi, A.A.; Alharbi, S.F.; Alotaibi, F.S.; Qian, Y. Assessing the Response of Five Tree Species to Air Pollution in Riyadh City, Saudi Arabia, for Potential Green Belt Application. Environ. Sci. Pollut. Res. 2020, 27, 29156–29170. [Google Scholar] [CrossRef]
- Amin, S.A. The Tolerance Index for Different Growing Tree Plant Species in Jubail Industrial City, a Polluted Area, KSA. Biomed. J. Sci. Technol. Res. 2021, 36, 28957–28965. [Google Scholar] [CrossRef]
- Al Maawali, R.; Sulaiman, H. Trees for Air Pollution Tolerance to Develop Green Belts as an Ecological Mitigation. Int. J. Environ. Ecol. Eng. 2017, 11, 116–119. [Google Scholar] [CrossRef]
- Alhesnawi, A.S.M.; Alsalman, I.M.; Najem, N.A. Evaluation of Air Pollution Tolerance Index of Some Plants Species in Kerbala City, Iraq. J. Pharm. Sci. Res. 2018, 10, 1386–1390. [Google Scholar]
- Usman, K.; Al-Ghouti, M.A.; Abu-Dieyeh, M.H. The Assessment of Cadmium, Chromium, Copper, and Nickel Tolerance and Bioaccumulation by Shrub Plant Tetraena Qataranse. Sci. Rep. 2019, 9, 5658. [Google Scholar] [CrossRef]
- Nabulo, G.; Oryem-Origa, H.; Diamond, M. Assessment of Lead, Cadmium, and Zinc Contamination of Roadside Soils, Surface Films, and Vegetables in Kampala City, Uganda. Environ. Res. 2006, 101, 42–52. [Google Scholar] [CrossRef]
- Shahid, M.; Dumat, C.; Khalid, S.; Schreck, E.; Xiong, T.; Niazi, N.K. Foliar Heavy Metal Uptake, Toxicity and Detoxification in Plants: A Comparison of Foliar and Root Metal Uptake. J. Hazard. Mater. 2017, 325, 36–58. [Google Scholar] [CrossRef]
- El-Amier, Y.A.; Alghanem, S.M. Tree Leaves as Bioindicator of Heavy Metal Pollution from Soiland Ambient Air in Urban Environmental. Plant Arch. 2018, 18, 2559–2566. [Google Scholar]
- Sulaiman, F.R.; Hamzah, H.A. Heavy Metals Accumulation in Suburban Roadside Plants of a Tropical Area (Jengka, Malaysia). Ecol. Process. 2018, 7, 28. [Google Scholar] [CrossRef]
- Rafati, M.; Mohammadi Roozbahani, M.; Pirmoradi, Z. Bioaccumulation of Some Heavy Metals by the Soil and Leaves of Ziziphus Spina-Christi in Khouzestan Oxin Steel Company. Iran. J. For. Range Prot. Res. 2019, 17, 173–184. [Google Scholar]
- Andric, I.; Kamal, A.; Al-Ghamdi, S.G. Efficiency of Green Roofs and Green Walls as Climate Change Mitigation Measures in Extremely Hot and Dry Climate: Case Study of Qatar. Energy Rep. 2020, 6, 2476–2489. [Google Scholar] [CrossRef]
- Zhang, K.; Batterman, S. Air Pollution and Health Risks Due to Vehicle Traffic. Sci. Total Environ. 2013, 450–451, 307–316. [Google Scholar] [CrossRef]
- Past Weather in Doha, Qatar—March 2021. Available online: https://www.timeanddate.com/weather/qatar/doha/historic?month=3&year=2021 (accessed on 27 August 2023).
- Determination of Vitamin C Concentration by Titration. University of Canterbury, Christchurch, New Zealand. Available online: https://www.canterbury.ac.nz/media/documents/science-outreach/vitaminc_iodine.pdf (accessed on 5 July 2023).
- Singh, S.K.; Rao, D.N.; Agrawal, M.; Pandey, J.; Naryan, D. Air Pollution Tolerance Index of Plants. J. Environ. Manag. 1991, 32, 45–55. [Google Scholar] [CrossRef]
- US-EPA. U.S. EPA Method 3051A: Microwave Assisted Acid Digestion of Sediments, Sludges, and Oils; US-EPA: Washington, DC, USA, 2007.
- US-EPA. SW-846 Test Method 3052: Microwave Assisted Acid Digestion of Siliceous and Organically Based Matrices; US-EPA: Washington, DC, USA, 1996; Volume 20.
- Wu, Q.; Wang, S.; Thangavel, P.; Li, Q.; Zheng, H.; Bai, J.; Qiu, R. Phytostabilization Potential of Jatropha curcas L. in Polymetallic Acid Mine Tailings. Int. J. Phytoremediation 2011, 13, 788–804. [Google Scholar] [CrossRef] [PubMed]
- Mishra, T.; Pandey, V.C. Phytoremediation of Red Mud Deposits Through Natural Succession. In Phytomanagement of Polluted Sites; Elsevier: Amsterdam, The Netherlands, 2019; pp. 409–424. ISBN 9780128139134. [Google Scholar]
- Liu, W.-X.; Liu, J.-W.; Wu, M.-Z.; Li, Y.; Zhao, Y.; Li, S.-R. Accumulation and Translocation of Toxic Heavy Metals in Winter Wheat (Triticum aestivum L.) Growing in Agricultural Soil of Zhengzhou, China. Bull. Environ. Contam. Toxicol. 2009, 82, 343–347. [Google Scholar] [CrossRef] [PubMed]
- Pandey, A.K.; Pandey, M.; Mishra, A.; Tiwary, S.M.; Tripathi, B.D. Air Pollution Tolerance Index and Anticipated Performance Index of Some Plant Species for Development of Urban Forest. Urban For. Urban Green. 2015, 14, 866–871. [Google Scholar] [CrossRef]
- Joshi, P.C.; Swami, A. Air Pollution Induced Changes in the Photosynthetic Pigments of Selected Plant Species. J. Environ. Biol. 2009, 30, 295–298. [Google Scholar] [PubMed]
- Rai, R.; Agrawal, M.; Kumar Choudhary, K.; Agrawal, S.B.; Emberson, L.; Büker, P. Application of Ethylene Diurea (EDU) in Assessing the Response of a Tropical Soybean Cultivar to Ambient O3: Nitrogen Metabolism, Antioxidants, Reproductive Development and Yield. Ecotoxicol. Environ. Saf. 2015, 112, 29–38. [Google Scholar] [CrossRef]
- Khaleel, S.; Jaran, A.; Haddadin, M. Evaluation of Total Phenolic Content and Antioxidant Activity of Three Leaf Extracts of Ziziphus Spina-Christi (Sedr) Grown in Jordan. Br. J. Med. Med. Res. 2016, 14, 1–8. [Google Scholar] [CrossRef]
- Seyyednejad, S.M.; Niknejad, M.; Koochak, H. A Review of Some Different Effects of Air Pollution on Plants. Res. J. Environ. Sci. 2011, 5, 302. [Google Scholar] [CrossRef]
- Kuddus, M.; Kumari, R.; Ramteke, P.W. Studies on Air Pollution Tolerance of Selected Plants in Allahabad City, India. E3 J. Environ. Res. Manag. 2011, 2, 42–046. [Google Scholar]
- Nawaz, R.; Aslam, M.; Nasim, I.; Irshad, M.A.; Ahmad, S.; Latif, M.; Hussain, F. Air Pollution Tolerance Index and Heavy Metals Accumulation of Tree Species for Sustainable Environmental Management in Megacity of Lahore. Air 2022, 1, 55–68. [Google Scholar] [CrossRef]
- Achakzai, K.; Khalid, S.; Adrees, M.; Bibi, A.; Ali, S.; Nawaz, R.; Rizwan, M. Air Pollution Tolerance Index of Plants around Brick Kilns in Rawalpindi, Pakistan. J. Environ. Manag. 2017, 190, 252–258. [Google Scholar] [CrossRef]
- Sharma, B.; Bhardwaj, S.K.; Sharma, S.; Nautiyal, R.; Kaur, L.; Alam, N.M. Pollution Tolerance Assessment of Temperate Woody Vegetation Growing along the National Highway-5 in Himachal Pradesh, India. Environ. Monit. Assess. 2019, 191, 177. [Google Scholar] [CrossRef]
- Adamsab, M.P.; Kousar, H.; Shwetha, D.S.; Sirajuddin, M.H.; Ravichandran, M. APTI of Some Selected Plants in Shivamogga City, South Asia. Int. J. Adv. Sci. Eng. Inf. Technol. 2011, 1, 668. [Google Scholar] [CrossRef]
- Aguiar-Silva, C.; Brandão, S.E.; Domingos, M.; Bulbovas, P. Antioxidant Responses of Atlantic Forest Native Tree Species as Indicators of Increasing Tolerance to Oxidative Stress When They Are Exposed to Air Pollutants and Seasonal Tropical Climate. Ecol. Indic. 2016, 63, 154–164. [Google Scholar] [CrossRef]
- Aghajanzadeh, T.; Hawkesford, M.J.; De Kok, L.J. Atmospheric H2S and SO2 as Sulfur Sources for Brassica Juncea and Brassica Rapa: Regulation of Sulfur Uptake and Assimilation. Environ. Exp. Bot. 2016, 124, 1–10. [Google Scholar] [CrossRef]
- Dadkhah-Aghdash, H.; Rasouli, M.; Rasouli, K.; Salimi, A. Detection of Urban Trees Sensitivity to Air Pollution Using Physiological and Biochemical Leaf Traits in Tehran, Iran. Sci. Rep. 2022, 12, 15398. [Google Scholar] [CrossRef] [PubMed]
- Zenna, F.; Taha, L.; Shahin, S. Evaluation of Some Japanese’s Garden Plant Species for Its Tolerance to Air Pollution b. Comparison of Different Species of the Family Grown in Different Parts of the Garden. Egypt. J. Agric. Res. 2019, 97, 727–743. [Google Scholar] [CrossRef]
- Sumangala, H.P.; Aswath, C.; Laxman, R.H.; Namratha, M.R. Evaluation of Air Pollution Tolerance Index (ATPI) of Selected Ornamental Tree Species of Bengaluru, India. Int. J. Pure App. Biosci. 2018, 6, 366–373. [Google Scholar] [CrossRef]
- Karmakar, D.; Padhy, P.K. Air Pollution Tolerance, Anticipated Performance, and Metal Accumulation Indices of Plant Species for Greenbelt Development in Urban Industrial Area. Chemosphere 2019, 237, 124522. [Google Scholar] [CrossRef]
- Beg, M.U.; Farooq, M.; Bhargava, S.K.; Kidwai, M.M.; Lal, M.M. Performance of Trees around a Thermal Power Station. Environ. Ecol. 1990, 8, 791–797. [Google Scholar]
- Katiyar, V.; Dubey, P.S. Growth Behaviour of Two Cultivars of Maize in Response to SO2 and NO2. J. Environ. Biol. 2000, 21, 317–323. [Google Scholar]
- Shilpa, S.; Verma, H.N.; Bhargava, S.K. Air Pollution and Its Impacts on Plant Growth; New India Publishing Agency: New Delhi, India, 2006; ISBN 81-89422-10-3. [Google Scholar]
- Rahmawati, N.; Rosmayati, R.; Delvian, D.; Basyuni, M. Chlorophyll Content of Soybean As Affected By Foliar Application of Ascorbic Acid And Inoculation of Arbuscular Mycorrhizal Fungi In Saline Soil. Int. J. Sci. Technol. Res. 2014, 3, 127–131. [Google Scholar]
- Tripathi, A.K.; Gautam, M. Biochemical Parameters of Plants as Indicators of Air Pollution. J. Environ. Biol. 2007, 28, 127–132. [Google Scholar] [PubMed]
- Bora, M.; Joshi, N. A Study on Variation in Biochemical Aspects of Different Tree Species with Tolerance and Performance Index. Bioscan 2014, 9, 59–63. [Google Scholar]
- Giri, S.; Shrivastava, D.; Deshmukh, K.; Dubey, P. Effect of Air Pollution on Chlorophyll Content of Leaves. Curr. Agric. Res. J. 2013, 1, 93–98. [Google Scholar] [CrossRef]
- Bakiyaraj, R.; Ayyappan, D. Air Pollution Tolerance Index of Some Terrestrial Plants Around an Industrial Area. Int. J. Mod. Res. Rev. 2014, 2, 1–7. [Google Scholar]
- Lai, J.-Y.; Luo, L.-J.; Ma, D. Effect of Cross-Linking Density on the Structures and Properties of Carbodiimide-Treated Gelatin Matrices as Limbal Stem Cell Niches. Int. J. Mol. Sci. 2018, 19, 3294. [Google Scholar] [CrossRef]
- Blainey, P.C. The Future Is Now: Single-Cell Genomics of Bacteria and Archaea. FEMS Microbiol. Rev. 2013, 37, 407–427. [Google Scholar] [CrossRef]
- Rai, P.K.; Panda, L.L.S. Dust Capturing Potential and Air Pollution Tolerance Index (APTI) of Some Road Side Tree Vegetation in Aizawl, Mizoram, India: An Indo-Burma Hot Spot Region. Air Qual. Atmos. Health 2014, 7, 93–101. [Google Scholar] [CrossRef]
- Sen, D.N.; Bhandari, M. Ecological and Water Relation to Two Citrullus spp. Environ. Physiol. Ecol. Plants 1978, 1978, 203–228. [Google Scholar]
- Jones, H. Plants and Microclimate; Cambridge University Press: Cambridge, UK, 1994. [Google Scholar]
- Keller, T.; Schwager, H. Air Pollution and Ascorbic Acid. For. Pathol. 1977, 7, 338–350. [Google Scholar] [CrossRef]
- Keller, T. The Electrical Conductivity of Norway Spruce Needle Diffusate as Affected by Air Pollutants. Tree Physiol. 1986, 1, 85–94. [Google Scholar] [CrossRef] [PubMed]
- Masuch, G.; Kicinski, H.G.; Kettrup, A.; Boos, K.S. Single and Combined Effects of Continuous and Discontinuous O3 and SO2 Immission on Norway Spruce Needles: I. Histological and Cytological Changes. Int. J. Environ. Anal. Chem. 1988, 32, 187–212. [Google Scholar] [CrossRef]
- Swami, A.; Bhatt, D.; Joshi, P.C. Effects of Automobile Pollution on Sal (Shorea robusta) and Rohini (Mallotus phillipinensis) at Asarori, Dehradun. Himal. J. Environ. Zool. 2004, 18, 57–61. [Google Scholar]
- Joshi, P.C.; Swami, A. Physiological Responses of Some Tree Species under Roadside Automobile Pollution Stress around City of Haridwar, India. Environmentalist 2007, 27, 365–374. [Google Scholar] [CrossRef]
- Rai, P.K. Impacts of Particulate Matter Pollution on Plants: Implications for Environmental Biomonitoring. Ecotoxicol. Environ. Saf. 2016, 129, 120–136. [Google Scholar] [CrossRef]
- Ogunkunle, C.O.; Suleiman, L.B.; Oyedeji, S.; Awotoye, O.O.; Fatoba, P.O. Assessing the Air Pollution Tolerance Index and Anticipated Performance Index of Some Tree Species for Biomonitoring Environmental Health. Agrofor. Syst. 2015, 89, 447–454. [Google Scholar] [CrossRef]
- Nadgórska–Socha, A.; Kandziora-Ciupa, M.; Trzęsicki, M.; Barczyk, G. Air Pollution Tolerance Index and Heavy Metal Bioaccumulation in Selected Plant Species from Urban Biotopes. Chemosphere 2017, 183, 471–482. [Google Scholar] [CrossRef]
- Abbaszadeh-Dahaji, P.; Baniasad-Asgari, A.; Hamidpour, M. The Effect of Cu-Resistant Plant Growth-Promoting Rhizobacteria and EDTA on Phytoremediation Efficiency of Plants in a Cu-Contaminated Soil. Environ. Sci. Pollut. Res. 2019, 26, 31822–31833. [Google Scholar] [CrossRef]


| APTI | Response |
|---|---|
| ≤14 | Sensitive |
| 15–19 | Intermediate |
| 20–24 | Moderately tolerant |
| >24 | Tolerant |
| Site | |||
|---|---|---|---|
| Rural Area (Reference Site) | Roadside Area | ||
| Ascorbic Acid, mg/g (dry weight) | Mean ± Std | 38.93 ± 0.90 | 42.94 ± 4.73 |
| Range | 37.70–40.23 | 34.98–54.70 | |
| Total Chlorophyll, mg/g (dry weight) | Mean ± Std | 5.94 ± 0.06 | 3.32 ± 1.00 |
| Range | 5.89–6.02 | 1.94–4.87 | |
| pH | Mean ± Std | 6.15 ± 0.01 | 6.17 ± 0.08 |
| Range | 6.15–6.16 | 6.05–6.36 | |
| Relative Water Content, % | Mean ± Std | 92.18 ± 1.91 | 78.82 ± 4.41 |
| Range | 89.09–94.13 | 71.83–90.24 | |
| APTI | Mean ± Std | 56.29 ± 1.13 | 48.88 ± 7.80 |
| Range | 54.68–57.81 | 39.55–63.01 | |
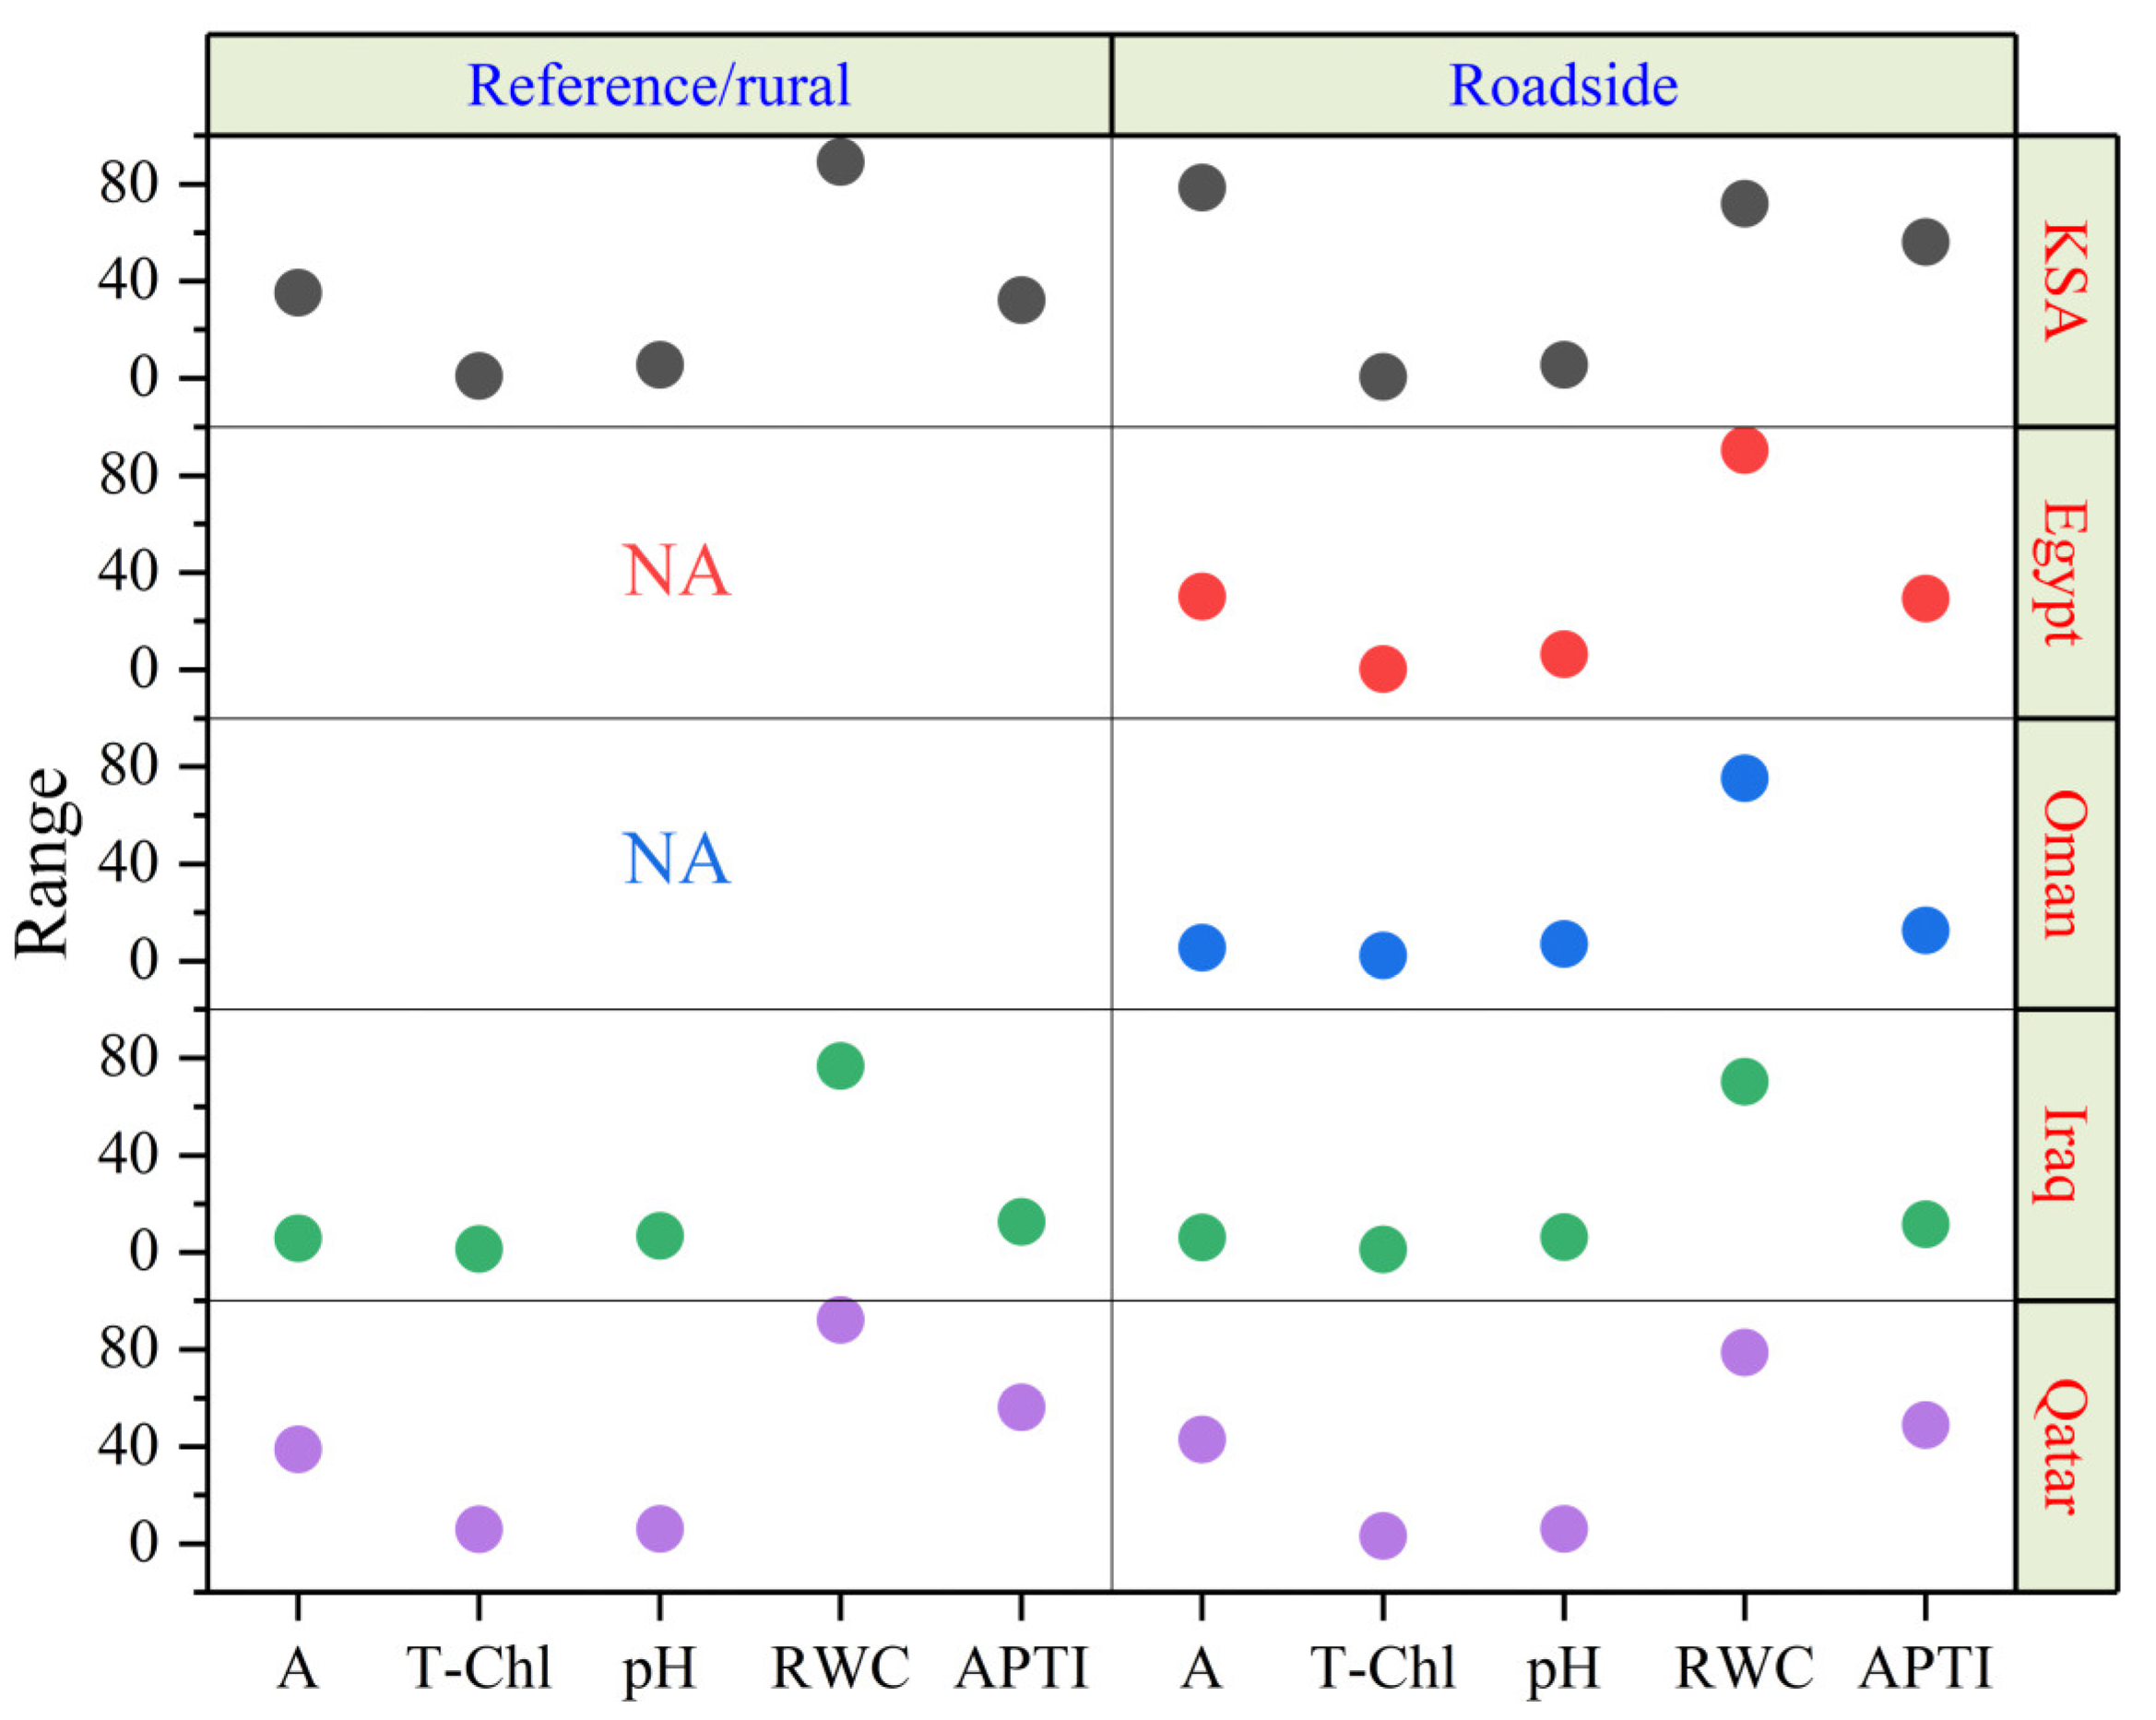
| Country | Site | Ascorbic Acid (mg/g) | Total Chlorophyll (mg/g) | pH | Relative Water Content (%) | APTI | Reference |
|---|---|---|---|---|---|---|---|
| KSA | Reference/rural | 35.30 | 1.08 | 5.52 | 89.10 | 32.20 | [21] |
| KSA | Roadside site | 78.60 | 0.69 | 5.55 | 72.00 | 56.20 | [21] |
| Egypt | Roadside | 30.11 | 0.32 | 6.40 | 90.40 | 29.26 | [54] |
| Oman | Roadside | 5.52 | 2.35 | 7.07 | 75.39 | 12.74 | [23] |
| Iraq | Reference/rural | 5.87 | 1.50 | 6.90 | 76.86 | 12.62 | [24] |
| Iraq | Roadside | 6.16 | 1.27 | 6.30 | 70.33 | 11.68 | [24] |
| Qatar | Reference/rural | 38.93 | 5.94 | 6.15 | 92.18 | 56.29 | This study |
| Qatar | Roadside | 42.94 | 3.32 | 6.17 | 78.82 | 48.88 | This study |
| pH | Ascorbic Acid | Total Chlorophyll | RWC | APTI | |
|---|---|---|---|---|---|
| pH | 1 | ||||
| Ascorbic Acid | 0.05 | 1 | |||
| Total Chlorophyll | 0.063 | 0.27 * | 1 | ||
| RWC | −0.21 | −0.33 * | 0.30 * | 1 | |
| APTI | 0.08 | 0.76 ** | 0.83 ** | 0.04 | 1 |
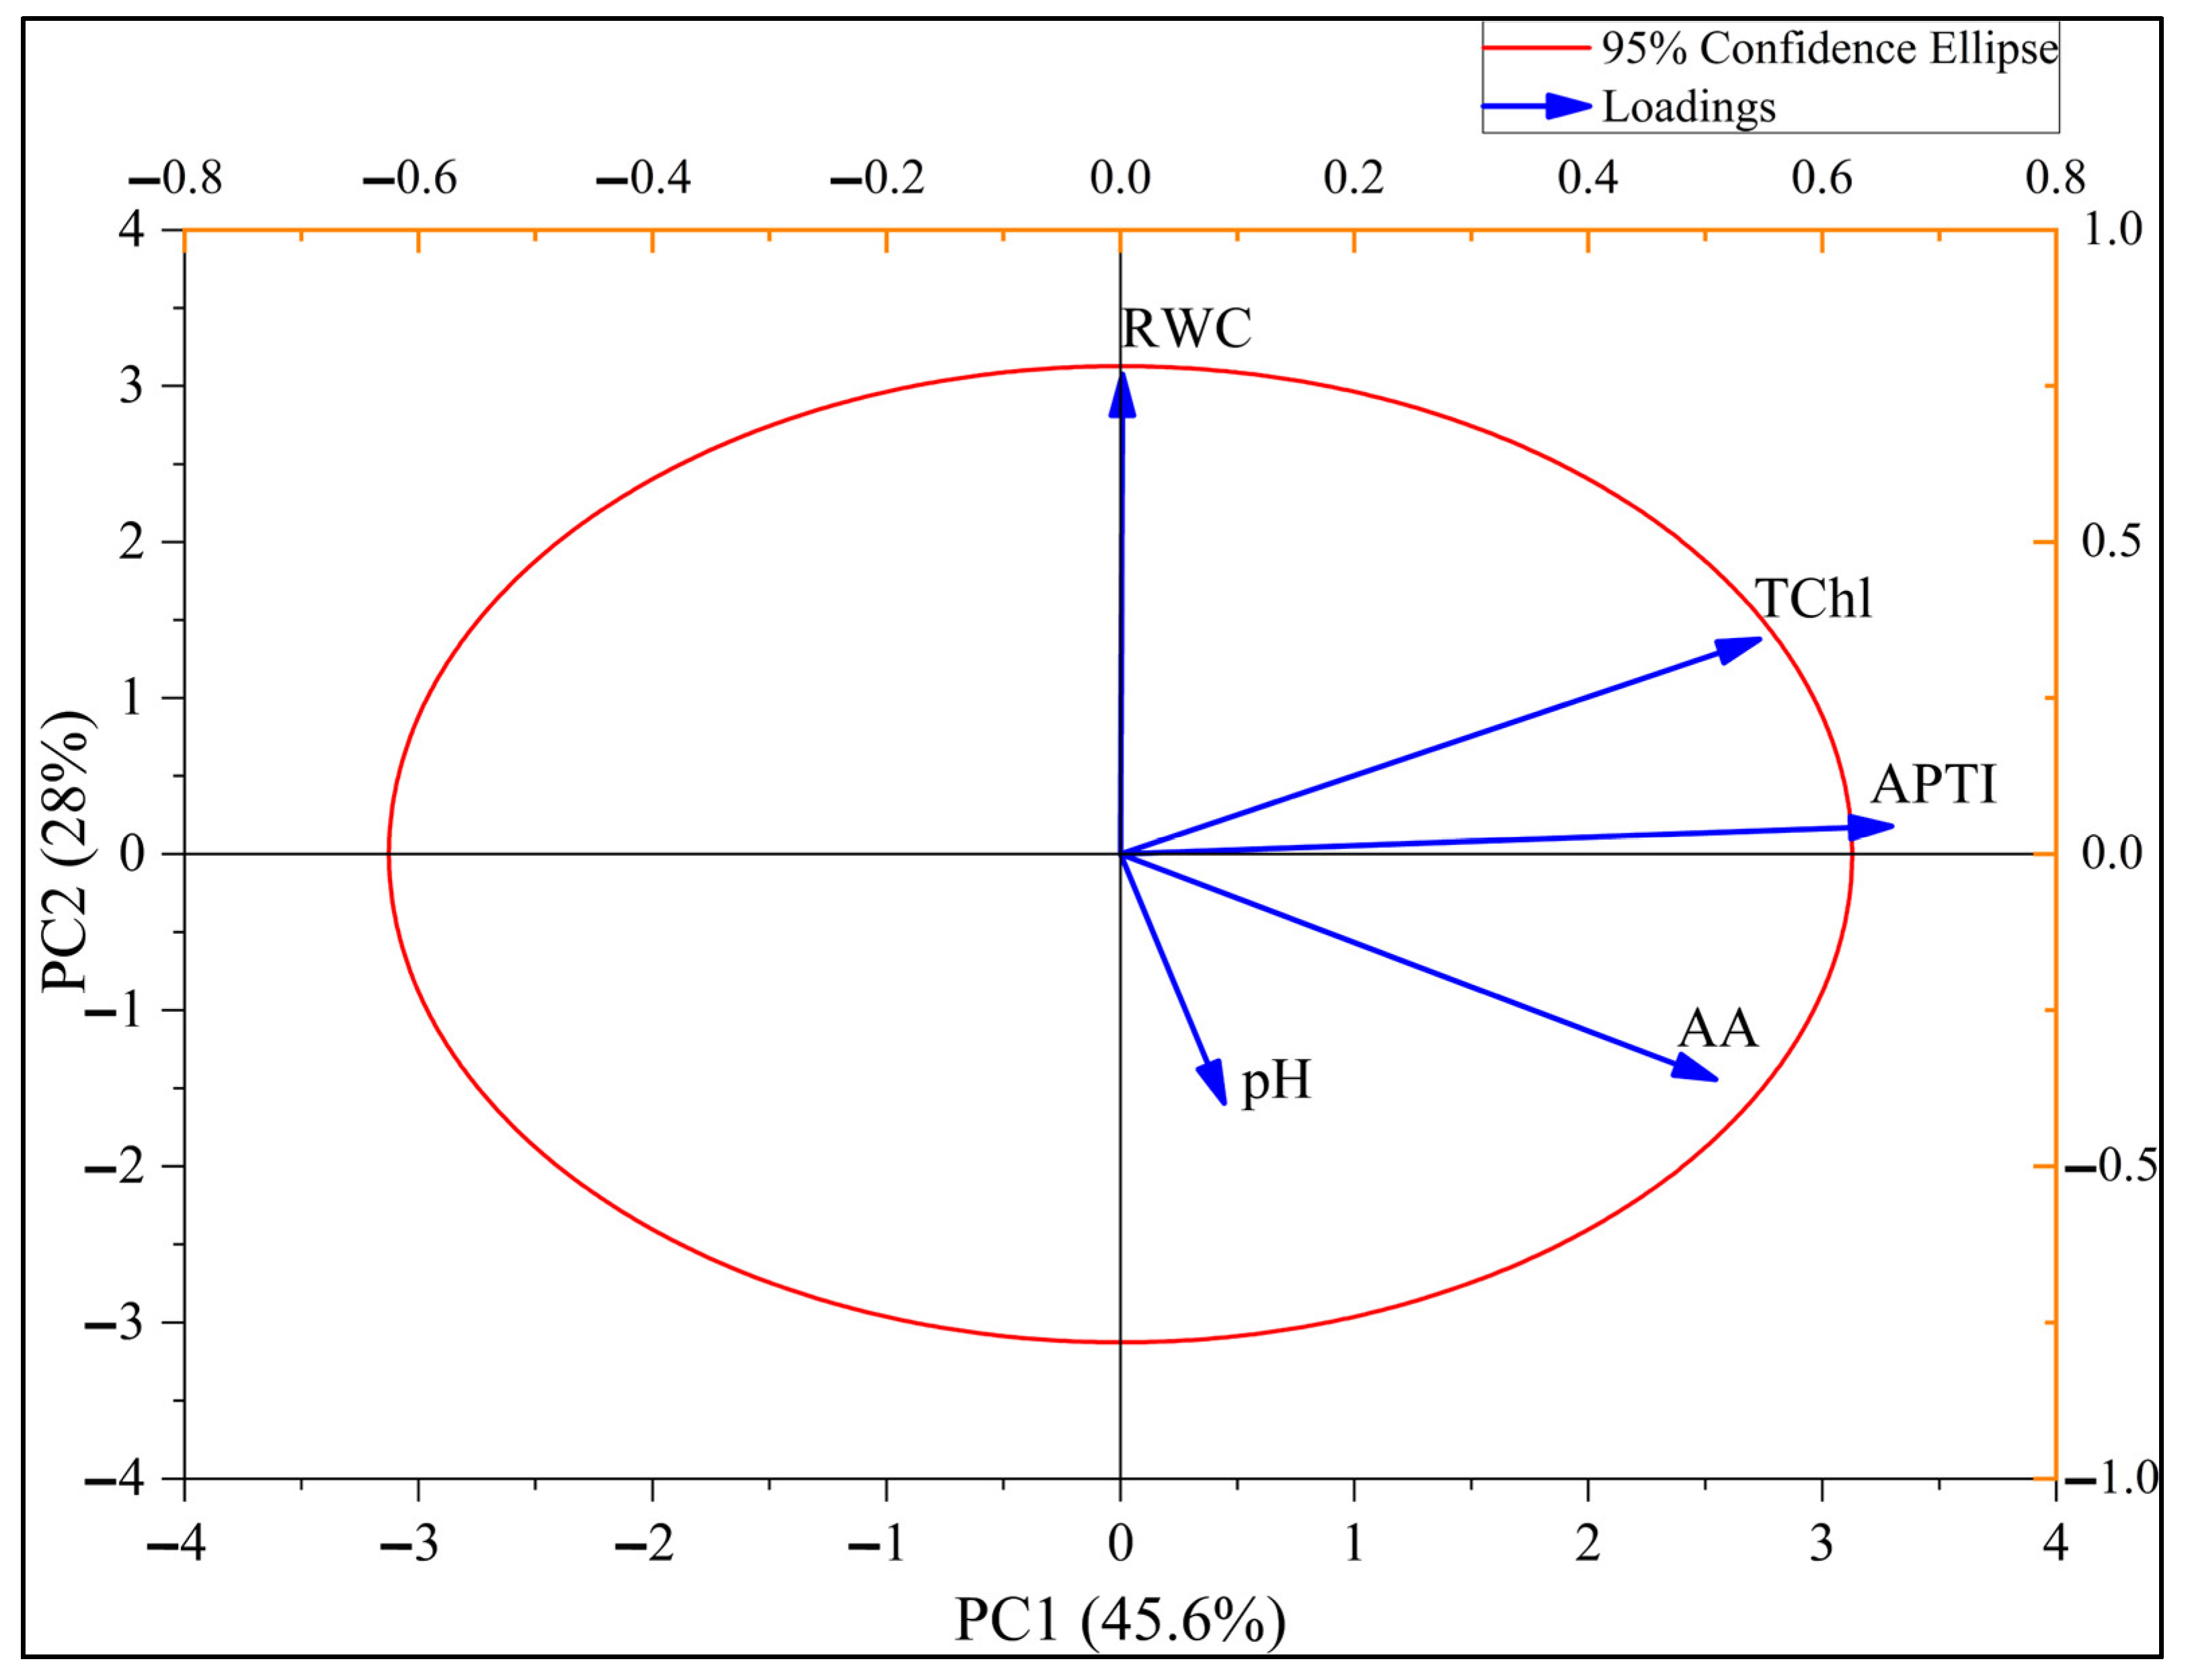
| Component | Initial Eigenvalues | Variables | Rotated Component Matrix | |||
|---|---|---|---|---|---|---|
| Total | % of Variance | Cumulative % | PC1 | PC2 | ||
| 1 | 2.279 | 45.589 | 45.589 | APTI | 0.994 | −0.102 |
| 2 | 1.399 | 27.979 | 73.568 | TChl | 0.871 | 0.288 |
| 3 | 0.950 | 18.997 | 92.565 | Ascorbic Acid | 0.700 | −0.537 |
| 4 | 0.371 | 7.417 | 99.983 | RWC | 0.139 | 0.900 |
| 5 | 0.001 | 0.017 | 100.000 | pH | 0.061 | −0.477 |
Disclaimer/Publisher’s Note: The statements, opinions and data contained in all publications are solely those of the individual author(s) and contributor(s) and not of MDPI and/or the editor(s). MDPI and/or the editor(s) disclaim responsibility for any injury to people or property resulting from any ideas, methods, instructions or products referred to in the content. |
© 2023 by the authors. Licensee MDPI, Basel, Switzerland. This article is an open access article distributed under the terms and conditions of the Creative Commons Attribution (CC BY) license (https://creativecommons.org/licenses/by/4.0/).
Share and Cite
Al-Naimi, N.; Abou Elezz, A.; Al-Adba, M.; Al-Saadi, H.; Sorino, C.; Hassan, H. Assessing the Use of Ziziphus spina-christi as a Sustainable Solution for Biomonitoring of Urban Air Quality: A Case Study from Qatar. Sustainability 2023, 15, 13590. https://doi.org/10.3390/su151813590
Al-Naimi N, Abou Elezz A, Al-Adba M, Al-Saadi H, Sorino C, Hassan H. Assessing the Use of Ziziphus spina-christi as a Sustainable Solution for Biomonitoring of Urban Air Quality: A Case Study from Qatar. Sustainability. 2023; 15(18):13590. https://doi.org/10.3390/su151813590
Chicago/Turabian StyleAl-Naimi, Noora, Ahmed Abou Elezz, Maryam Al-Adba, Hamood Al-Saadi, Caesar Sorino, and Hassan Hassan. 2023. "Assessing the Use of Ziziphus spina-christi as a Sustainable Solution for Biomonitoring of Urban Air Quality: A Case Study from Qatar" Sustainability 15, no. 18: 13590. https://doi.org/10.3390/su151813590